Monoterapia con carbamazepina versus fenobarbitona para la epilepsia: una revisión de datos de participantes individuales
Información
- DOI:
- https://doi.org/10.1002/14651858.CD001904.pub4Copiar DOI

- Base de datos:
-
- Cochrane Database of Systematic Reviews
- Versión publicada:
-
- 24 octubre 2018see what's new
- Tipo:
-
- Intervention
- Etapa:
-
- Review
- Grupo Editorial Cochrane:
-
Grupo Cochrane de Epilepsia
- Copyright:
-
- Copyright © 2018 The Cochrane Collaboration. Published by John Wiley & Sons, Ltd.
Cifras del artículo
Altmetric:
Citado por:
Autores
Contributions of authors
-
SJ Nevitt assessed trials for inclusion in the review update, obtained individual participant data from trial investigators for the review update, assessed risk of bias in all included trials, performed analyses in Stata version 14, added survival plots and a 'Summary of findings' table, and updated the text of the review.
-
C Tudur Smith was the lead investigator on the original review, assessed eligibility and methodological quality of original individual trials, organised and cleaned the IPD sets, performed data validation checks and statistical analyses, and co‐wrote the original review.
-
AG Marson obtained IPD from trial investigators, provided guidance with the clinical interpretation of results, assessed eligibility and methodological quality of individual trials, and co‐wrote the original review.
Sources of support
Internal sources
-
No sources of support supplied
External sources
-
National Institute for Health Research, UK.
Declarations of interest
-
Sarah J Nevitt: nothing to declare
-
Anthony G Marson: a consortium of pharmaceutical companies (GSK, EISAI, UCB Pharma), funded the National Audit of Seizure Management in Hospitals (NASH), through grants paid to The University of Liverpool. Professor Tony Marson is part funded by National Institute for Health Research Collaboration for Leadership in Applied Health Research and Care North West Coast (NIHR CLAHRC NWC).
-
Catrin Tudur Smith: nothing to declare
Acknowledgements
This review was supported by the National Institute for Health Research, via Cochrane Infrastructure funding to the Epilepsy Group. The views and opinions expressed therein are those of the authors and do not necessarily reflect those of the Systematic Reviews Programme, NIHR, NHS or the Department of Health
We are greatly indebted to all of the original trialists that provided IPD and input into this review. We are grateful to Cochrane Epilepsy's Information Specialist, Graham Chan, for performing all electronic searches, and Giacomo Frosi for translation of the Italian trial.
We acknowledge Paula Williamson for contributions to the original review.
We acknowledge Jennifer Weston for assessing the risk of bias in all included trials for the 2015 update.
Version history
| Published | Title | Stage | Authors | Version |
| 2018 Oct 24 | Carbamazepine versus phenobarbitone monotherapy for epilepsy: an individual participant data review | Review | Sarah J Nevitt, Anthony G Marson, Catrin Tudur Smith | |
| 2016 Dec 15 | Carbamazepine versus phenobarbitone monotherapy for epilepsy: an individual participant data review | Review | Sarah J Nevitt, Anthony G Marson, Jennifer Weston, Catrin Tudur Smith | |
| 2015 Jul 23 | Carbamazepine versus phenobarbitone monotherapy for epilepsy: an individual participant data review | Review | Sarah J Nolan, Anthony G Marson, Jennifer Weston, Catrin Tudur Smith | |
| 2003 Jan 20 | Carbamazepine versus phenobarbitone monotherapy for epilepsy | Review | Catrin Tudur Smith, Anthony G Marson, Paula R Williamson | |
Differences between protocol and review
December 2014: the title was changed to specify that the review uses individual participant data (IPD).
Update 2015: we added sensitivity analyses following the discovery of inconsistencies between IPD provided and published papers. The existence of such inconsistencies could not have been known at the time of writing the original protocol.
Update 2015: we added the outcomes 'time to six‐month remission' and 'adverse events' for consistency with the other reviews in the series of Cochrane IPD reviews investigating pair‐wise monotherapy comparisons.
Update 2016: we added 'Summary of findings' tables to the update in 2015 and added text in the Methods section for 'Summary of findings' tables in August 2016.
Update 2018: 'Time to withdrawal of allocated treatment' was re‐defined as 'Time to treatment failure' due to feedback received from the Cochrane Editorial Unit regarding potential confusion regarding 'withdrawal' as a positive or negative outcome of anti‐epileptic monotherapy.
Additional analyses of 'Time to treatment failure' (due to lack of efficacy and due to adverse events), following feedback on published anti‐epileptic drug monotherapy reviews that these sub outcomes would be useful for clinical practice.
The term 'partial' has been replaced by 'focal', in accordance with the most recent classification of epilepsies of the International League Against Epilepsy (Scheffer 2017).
Notes
Sarah J Nolan (lead author of the 2015 and 2016 update), is now Sarah J Nevitt.
Keywords
MeSH
Medical Subject Headings (MeSH) Keywords
- Anticonvulsants [adverse effects, *therapeutic use];
- Carbamazepine [adverse effects, *therapeutic use];
- Epilepsies, Partial [*drug therapy];
- Epilepsy, Generalized [*drug therapy];
- Epilepsy, Tonic‐Clonic [drug therapy];
- Phenobarbital [adverse effects, *therapeutic use];
- Randomized Controlled Trials as Topic;
- Recurrence;
- Remission Induction;
- Seizures [prevention & control];
- Time Factors;
- Treatment Failure;
Medical Subject Headings Check Words
Adult; Child; Humans;
PICO

Study flow diagram

'Risk of bias' graph: review authors' judgements about each 'Risk of bias' item presented as percentages across all included trials
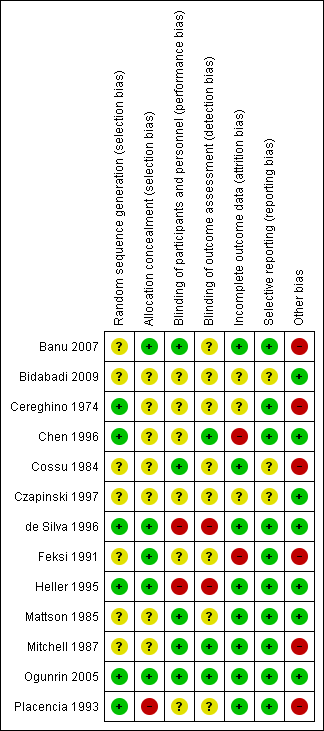
'Risk of bias' summary: review authors' judgements about each 'Risk of bias' item for each included trial
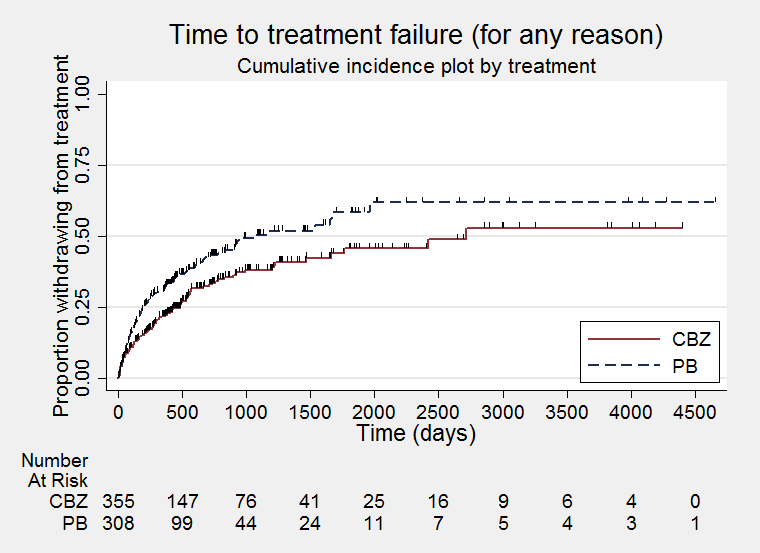
Time to treatment failure ‐ any reason related to the treatment (CBZ: carbamazepine; PB: phenobarbitone)

Time to treatment failure ‐ any reason related to the treatment, by seizure type (CBZ: carbamazepine; PB: phenobarbitone)

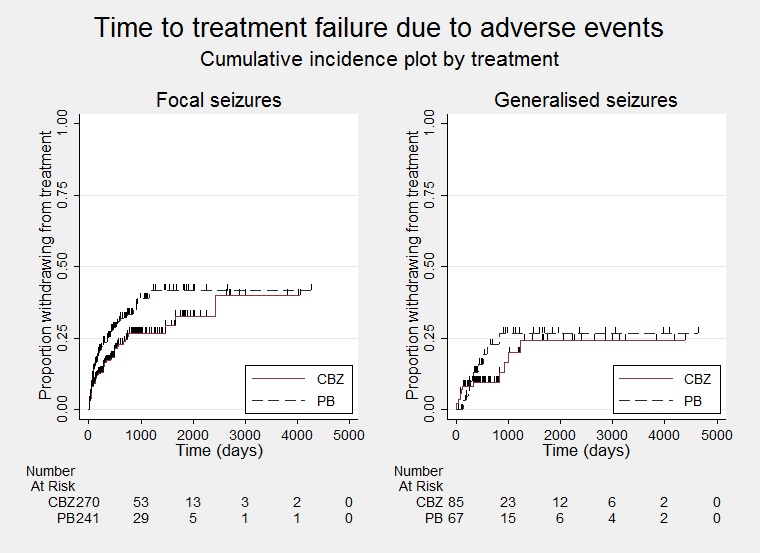
Time to treatment failure due to adverse events (CBZ: carbamazepine; PB: phenobarbitone)
Time to treatment failure due to adverse events, by seizure type (CBZ: carbamazepine; PB: phenobarbitone)

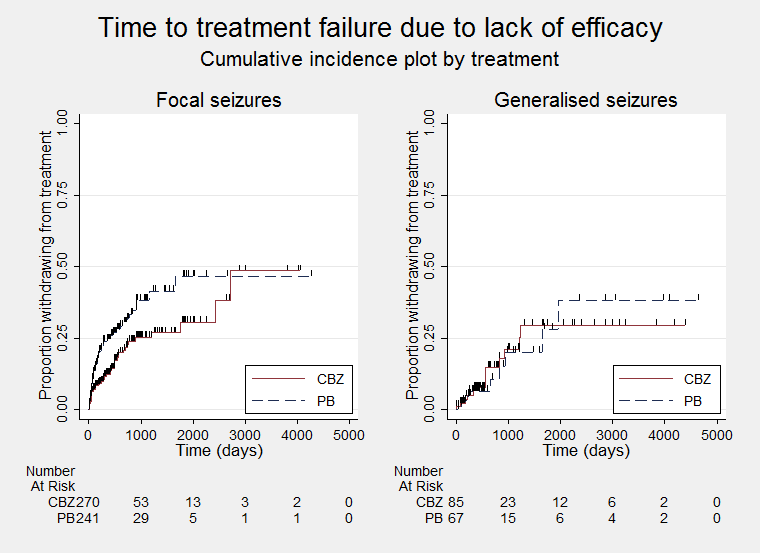
Time to treatment failure due to lack of efficacy (CBZ: carbamazepine; PB: phenobarbitone)
Time to treatment failure due to lack of efficacy, by seizure type (CBZ: carbamazepine; PB: phenobarbitone)

Time to first seizure post randomisation (CBZ: carbamazepine; PB: phenobarbitone)

Time to first seizure post randomisation ‐ by seizure type (CBZ: carbamazepine; PB: phenobarbitone)
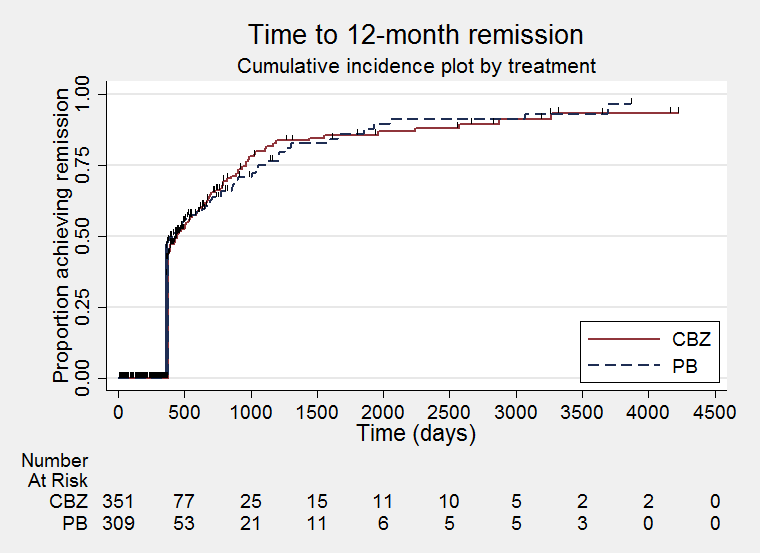
Time to 12‐month remission (CBZ: carbamazepine; PB: phenobarbitone)

Time to 12‐month remission ‐ by seizure type (CBZ: carbamazepine; PB: phenobarbitone)

Time to six‐month remission (CBZ: carbamazepine; PB: phenobarbitone)

Time to six‐month remission ‐ by seizure type (CBZ: carbamazepine; PB: phenobarbitone)

Comparison 1 Carbamazepine versus phenobarbitone, Outcome 1 Time to treatment failure (any reason related to the treatment).

Comparison 1 Carbamazepine versus phenobarbitone, Outcome 2 Time to treatment failure due to adverse events.

Comparison 1 Carbamazepine versus phenobarbitone, Outcome 3 Time to treatment failure due to lack of efficacy.
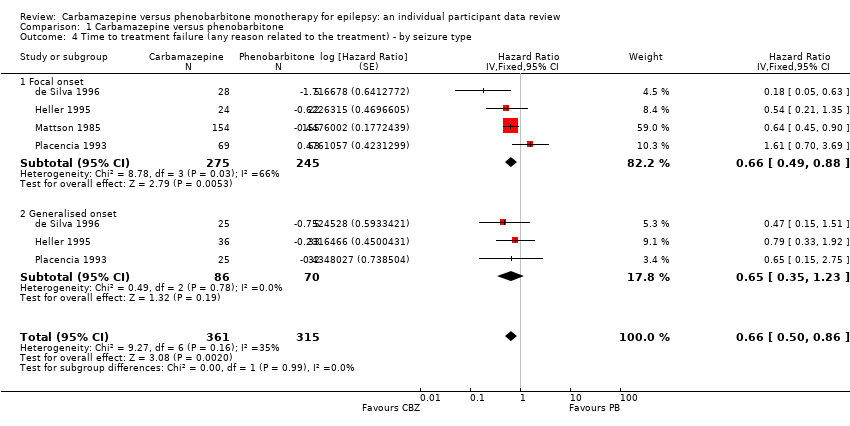
Comparison 1 Carbamazepine versus phenobarbitone, Outcome 4 Time to treatment failure (any reason related to the treatment) ‐ by seizure type.
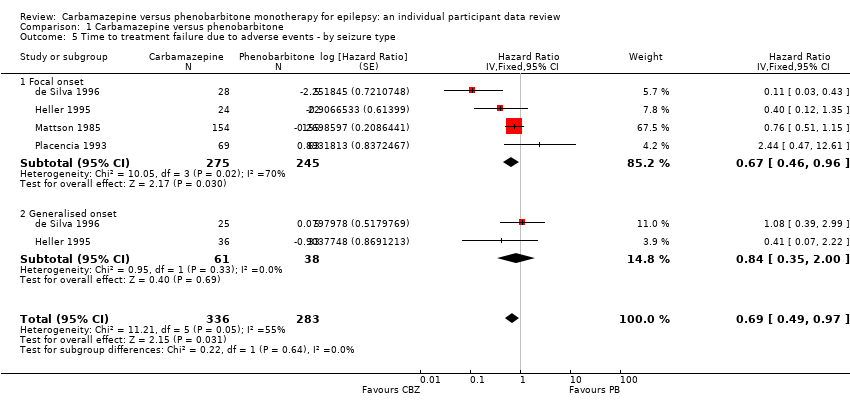
Comparison 1 Carbamazepine versus phenobarbitone, Outcome 5 Time to treatment failure due to adverse events ‐ by seizure type.

Comparison 1 Carbamazepine versus phenobarbitone, Outcome 6 Time to treatment failure due to lack of efficacy ‐ by seizure type.

Comparison 1 Carbamazepine versus phenobarbitone, Outcome 7 Time to first seizure.

Comparison 1 Carbamazepine versus phenobarbitone, Outcome 8 Time to first seizure ‐ by seizure type.

Comparison 1 Carbamazepine versus phenobarbitone, Outcome 9 Time to first seizure ‐ sensitivity analysis.

Comparison 1 Carbamazepine versus phenobarbitone, Outcome 10 Time to 12‐month remission.
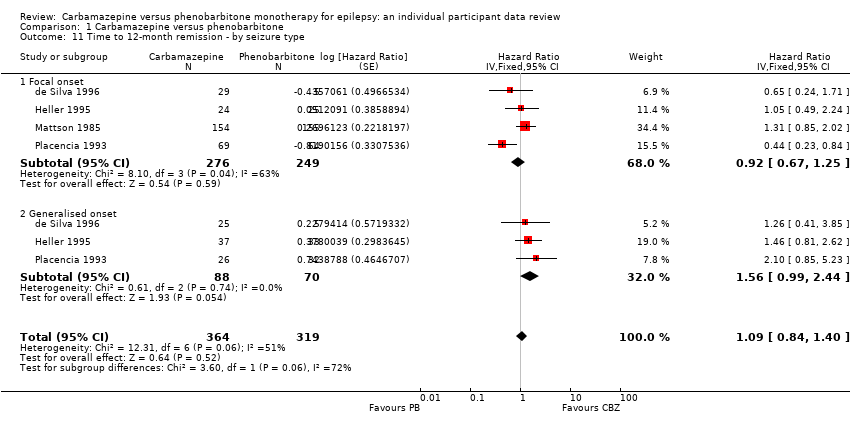
Comparison 1 Carbamazepine versus phenobarbitone, Outcome 11 Time to 12‐month remission ‐ by seizure type.
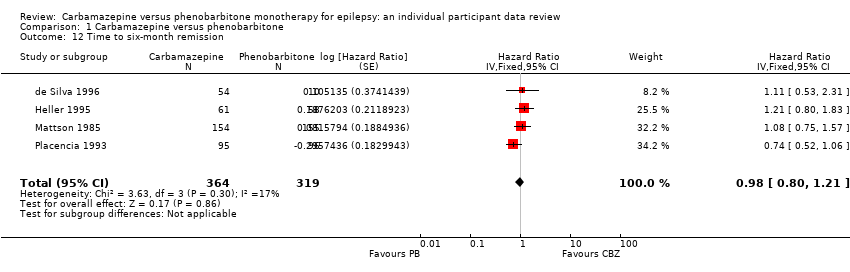
Comparison 1 Carbamazepine versus phenobarbitone, Outcome 12 Time to six‐month remission.
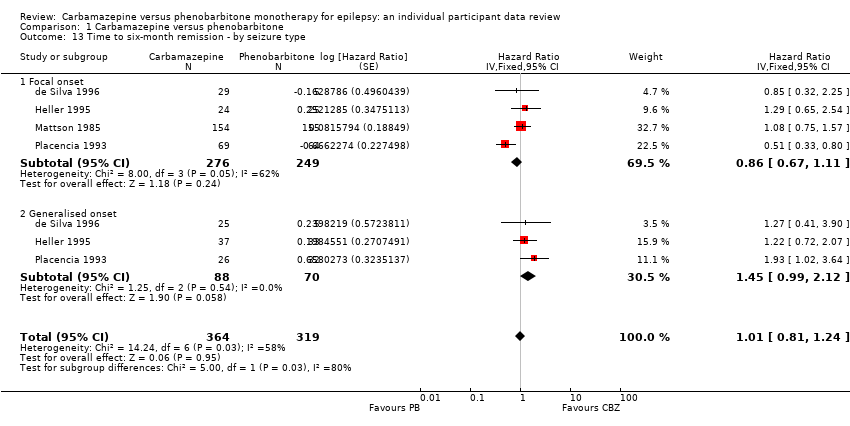
Comparison 1 Carbamazepine versus phenobarbitone, Outcome 13 Time to six‐month remission ‐ by seizure type.
| Carbamazepine compared with phenobarbitone for epilepsy (time to treatment failure) | ||||||
| Patient or population: adults and children with newly onset focal or generalised epilepsy Settings: outpatients Intervention: carbamazepine Comparison: phenobarbitone | ||||||
| Outcomes | Illustrative comparative risks* (95% CI) | Relative effect | No of participants | Quality of the evidence | Comments | |
| Assumed risk | Corresponding risk | |||||
| Phenobarbitone | Carbamazepine | |||||
| Time to treatment failure (any reason related to treatment) All participants Range of follow‐up: 0 to 4653 days | The median time to treatment failure was 1059 days in the phenobarbitone group | The median time to treatment failure was 2717 days (1658 days longer) in the carbamazepine group | HR 0.66 (0.50 to 0.86)a | 676 (4 trials) | ⊕⊕⊕⊝ | HR < 1 indicates a clinical advantage for carbamazepine. Treatment failure due to adverse events (HR 0.69, 95% CI 0.49 to 0.97, P = 0.03, I² = 55%), and due to lack of efficacy (HR 0.54, 95% CI 0.38 to 0.78, P = 0.0008, I² = 0%), also occurred significantly earlier on phenobarbitone compared to carbamazepine. |
| Time to treatment failure (any reason related to treatment) Subgroup: focal onset seizures Range of follow‐up: 0 to 4272 days | The median time to treatment failure was 913 days in the phenobarbitone group | The median time to treatment failure was 2422 days (1509 days longer) in the carbamazepine group | HR 0.66 (0.49 to 0.88) | 520 (4 trials) | ⊕⊕⊕⊝ | HR < 1 indicates a clinical advantage for carbamazepine. Treatment failure due to adverse events (HR 0.67, 95% CI 0.46 to 0.96, P = 0.03, I² = 70%), and due to lack of efficacy (HR 0.54, 95% CI 0.36 to 0.80, P = 0.002, I² = 0%), also occurred significantly earlier on phenobarbitone compared to carbamazepine. |
| Time to treatment failure (any reason related to treatment) Subgroup: generalised onset tonic‐clonic seizures Range of follow‐up: 0 to 4653 days | The 25th percentiled of time to treatment failure was 605 days in the phenobarbitone group | The 25th percentiled of time to treatment failure was 825 days (220 days longer) in the carbamazepine group | HR 0.65 (0.35 to 1.23) | 156 | ⊕⊕⊕⊝ | HR < 1 indicates a clinical advantage for carbamazepine. There was also no statistically significant difference between drugs in treatment failure due to adverse events (HR 0.84, 95% CI 0.35 to 2.00, P = 0.69, I² = 0%), or treatment failure due to lack of efficacy: HR 0.56 (95% CI 0.23 to 1.35, P = 0.20, I² = 0%). |
| *Illustrative risks in the carbamazepine and phenobarbitone groups are calculated at the median time to treatment failure (i.e. the time to 50% of participants failing or withdrawing from allocated treatment) within each group across all trials. The relative effect (pooled hazard ratio) shows the comparison of 'time to treatment failure' between the treatment groups. CI: 95% confidence interval; HR: hazard ratio | ||||||
| GRADE Working Group grades of evidence | ||||||
| aPooled HR for all participants adjusted for seizure type. | ||||||
| Carbamazepine compared with phenobarbitone for epilepsy (secondary outcomes) | ||||||
| Patient or population: adults and children with newly onset focal or generalised epilepsy Settings: outpatients Intervention: carbamazepine Comparison: phenobarbitone | ||||||
| Outcomes | Illustrative comparative risks* (95% CI) | Relative effect | No of participants | Quality of the evidence | Comments | |
| Assumed risk | Corresponding risk | |||||
| Phenobarbitone | Carbamazepine | |||||
| Time to first seizure (post‐randomisation) All participants Range of follow‐up: 0 to 4108 days | The median time to first seizure post‐randomisation was 218 days in the phenobarbitone group | The median time to first seizure post‐randomisation was 113 days (105 days shorter) in the carbamazepine group | HR 1.13 (0.93 to 1.38)a | 822 (6 trials) | ⊕⊕⊕⊝ | HR < 1 indicates a clinical advantage for carbamazepine |
| Time to first seizure (post‐randomisation) Subgroup: focal onset seizures Range of follow‐up: 0 to 4108 days | The median time to first seizure post‐randomisation was 266 days in the phenobarbitone group | The median time to first seizure post‐randomisation was 84 days (182 days shorter) in the carbamazepine group | HR 1.31 (1.04 to 1.66) | 584 (6 trials) | ⊕⊕⊕⊝ | HR < 1 indicates a clinical advantage for carbamazepine |
| Time to first seizure (post‐randomisation) Subgroup: generalised onset tonic‐clonic seizures Range of follow‐up: 0 to 4070 days | The median time to first seizure post‐randomisation was 209 days in the phenobarbitone group | The median time to first seizure post‐randomisation was 303 days (94 days longer) in the carbamazepine group | HR 0.80 (0.55 to 1.15) | 238 (5 trials) | ⊕⊕⊝⊝ | HR < 1 indicates a clinical advantage for carbamazepine |
| Time to achieve 12‐month remission (seizure‐free period) All participants Range of follow‐up: 0 to 4222 days | The median time to achieve to 12‐month remission was 413 days in the phenobarbitone group | The median time to achieve to 12‐month remission was 446 days (33 days longer) in the carbamazepine group | HR 1.09 (0.84 to 1.40)a | 683 | ⊕⊕⊝⊝ | HR < 1 indicates a |
| Time to achieve 12‐month remission (seizure‐free period) Subgroup: focal onset seizures Range of follow‐up: 0 to 4222 days | The median time to achieve to 12‐month remission was 369 days in the phenobarbitone group | The median time to achieve to 12‐month remission was 531 days (162 days longer) in the carbamazepine group | HR 0.92 (0.67 to 1.25) | 525 | ⊕⊕⊝⊝ | HR < 1 indicates a |
| Time to achieve 12‐month remission (seizure‐free period) Subgroup: generalised onset tonic‐clonic seizures Range of follow‐up: 0 to 4163 days | The median time to achieve to 12‐month remission was 421 days in the phenobarbitone group | The median time to achieve to 12‐month remission was 366 days (55 days shorter) in the carbamazepine group | HR 1.56 (0.99 to 2.44) | 158 | ⊕⊕⊝⊝ | HR < 1 indicates a |
| *Illustrative risks in the carbamazepine and phenobarbitone groups are calculated at the median time to first seizure or time to 12‐month remission (i.e. the time to 50% of participants experiencing a first seizure or 12‐months of remission) within each group across all trials. The relative effect (pooled hazard ratio) shows the comparison of 'time to first seizure' or 'time to 12‐month remission' between the treatment groups. CI: 95% confidence interval; HR: hazard ratio | ||||||
| GRADE Working Group grades of evidence | ||||||
| aPooled HR for all participants adjusted for seizure type. | ||||||
| Focal seizures: n (%)a | Male participants: n (%)a | Age at entry (years): Mean (SD), range | Aged > 30 and generalised seizures: n (%) | Epilepsy duration (years): mean (SD), range | Number of seizures in prior 6 months: median (range) | |||||||||||||
| CBZ | PB | Missing | CBZ | PB | Missing | CBZ | PB | Missing | CBZ | PB | Missing | CBZ | PB | Missing | CBZ | PB | Missing | |
| 33 (61%) | 26 (48%) | 0 | 24 (44%) | 37 (69%) | 0 | 6.2 (3.6), 1 to 15 | 5.3 (3.3), 1 to 12 | 0 | 0 | 0 | 0 | 2.0 (2.4), 0 to 11.5 | 1.6 (2.0), 0 to 10 | 0 | 24 (1 to 7200) | 24 (2 to 4320) | 5 | |
| 29 (54%) | 5 (50%) | 0 | 30 (56%) | 4 (40%) | 6 | 9.2 (3.8), 2 to 15 | 9.1 (3.9), 3 to 14 | 6 | 0 | 0 | 0 | 1.7 (2.6), 0 to 12 | 1.3 (1.8), 0.1 to 5 | 6 | 3 (1 to 500) | 3 (1 to 170) | 6 | |
| 24 (39%) | 25 (43%) | 0 | 30 (49%) | 25 (43%) | 0 | 29.3 (14.1), 13 to 69 | 34.5 (15.1), 16 to 77 | 1 | 9 | 13 | 0 | 4.4 (7.4), 0.1 to 40 | 3.4 (6.6), 0 to 37 | 2 | 2 (1 to 354) | 3 (1 to 579) | 1 | |
| 155 (100%) | 155 (100%) | 0 | 133 (87%) | 135 (88%) | 4 | 42.1 (15.9), 18 to 82 | 40.1 (15.3), 18 to 75 | 4 | 0 | 0 | 0 | 5.9 (9.1), 0.5 to 55 | 5.7 (7.9), 0.5 to 36 | 5 | 1 (1 to 100) | 1 (1 to 14) | 7 | |
| 5 (26%) | 2 (11%) | 0 | 12 (63%) | 11 (61%) | 0 | 28.2 (5.8), 14 to 38 | 35.4 (6.2), 26 to 55 | 0 | 6 | 13 | 0 | NA | NA | 37 | 18 (6 to 36) | 12 (6 to 42) | 0 | |
| 69 (73%) | 64 (66%) | 0 | 37 (39%) | 30 (31%) | 0 | 29.3 (18.2), 2 to 68 | 28.7 (17.1), 2 to 68 | 0 | 11 | 13 | 0 | 9.5 (11.6), 0.5 to 54 | 9.8 (11.0), 0.5 to 48 | 0 | 1 (0 to 68) | 2 (0 to 100) | 0 | |
| CBZ: carbamazepine; n: number of participants; NA: not available; PB: phenobarbitone; SD: standard deviation aProportions (%) are calculated based on non‐missing data. | ||||||||||||||||||
| Trial | Outcomes reported | Summary of results |
|
|
| |
|
|
| |
|
|
| |
|
|
| |
|
|
| |
|
| PB (n = 123), CBZ (n = 126)
| |
|
|
| |
| CBZ: carbamazepine; IQ: intelligence quotient; PB: phenobarbitone; WISC‐R scale: the Wechsler Intelligence Scale for Children | ||
| Trial | Number randomised | Time to treatment failure | Time to 12‐month remission | Time to six‐month remission | Time to first seizure | ||||||||||
| CBZ | PB | Total | CBZ | PB | Total | CBZ | PB | Total | CBZ | PB | Total | CBZ | PB | Total | |
| 54 | 54 | 108 | Data not available | Data not available | Data not available | 54 | 54 | 108 | |||||||
| 54 | 10 | 64 | 53 | 10 | 63 | 54 | 10 | 64 | 54 | 10 | 64 | 54 | 10 | 64 | |
| 61 | 58 | 119 | 60 | 55 | 115 | 61 | 58 | 119 | 61 | 58 | 119 | 61 | 58 | 119 | |
| 155 | 155 | 310 | 154 | 155 | 309 | 154 | 155 | 309 | 154 | 155 | 309 | 151 | 151 | 302 | |
| 19 | 18 | 37 | Data not available | Data not available | Data not available | 19 | 18 | 37 | |||||||
| 95 | 97 | 192 | 94 | 95 | 189 | 95 | 96 | 191 | 95 | 96 | 191 | 95 | 97 | 192 | |
| Total | 438 | 392 | 830 | 361 | 315 | 676 | 364 | 319 | 683 | 364 | 319 | 683 | 434 | 388 | 822 |
| CBZ: carbamazepine; PB: phenobarbitone | |||||||||||||||
| Reason for early termination | Total | ||||||||||||
| CBZ | PB | CBZ | PB | CBZ | PB | CBZ | PB | CBZ | PB | CBZ | PB | All | |
| Adverse events (event) | 3 | 2 | 8 | 12 | 11 | 5 | 5 | 5 | 0 | 0 | 27 | 24 | 51 |
| Lack of efficacy (event) | 12 | 2 | 5 | 7 | 3 | 11 | 0 | 0 | 8 | 6 | 28 | 26 | 54 |
| Both adverse events and lack of efficacy (event) | 6 | 4 | 4 | 3 | 31 | 46 | 0 | 0 | 0 | 0 | 41 | 53 | 94 |
| Non‐compliance/protocol violation (event) | 0 | 0 | 0 | 0 | 11 | 19 | 13 | 9 | 6 | 0 | 30 | 28 | 58 |
| Illness or death (not treatment‐related, censored) | 0 | 0 | 0 | 0 | 17 | 13 | 2 | 1 | 0 | 0 | 19 | 14 | 33 |
| Participant went into remission (censored) | 18 | 1 | 6 | 3 | 0 | 0 | 0 | 0 | 0 | 2 | 24 | 6 | 30 |
| Lost to follow‐up (censored) | 0 | 0 | 0 | 0 | 26 | 26 | 11 | 5 | 7 | 15 | 44 | 46 | 90 |
| Other (censored)d | 0 | 0 | 0 | 0 | 3 | 2 | 0 | 0 | 0 | 0 | 3 | 2 | 5 |
| Completed the trial (censored) | 14 | 1 | 37 | 30 | 52 | 33 | 63 | 75 | 33 | 31 | 199 | 170 | 369 |
| Total | 53 | 10 | 60 | 55 | 154 | 155 | 94 | 95 | 54 | 54 | 415 | 369 | 784 |
| CBZ: carbamazepine; PB: phenobarbitone | |||||||||||||
| Analysisa | Time to treatment failureb | Time to first seizured | Time to 12‐month remission | Time to six‐month remission | |
| Original analysis (adjusted for seizure type) | Participants | Overall: 676 (Foc: 520; Gen: 156) | Overall: 822 (Foc: 584; Gen 238) | Overall: 683 (Foc: 525; Gen:158) | Overall: 683 (Foc: 525; Gen:158) |
| Pooled HR (95% CI), P value, I² (%) | Foc: 0.66 (0.49 to 0.88) P = 0.005, I² = 66% Gen: 0.65 (0.35 to 1.23) P = 0.19, I² = 0% Overall: 0.66 (0.50 to 0.86) P = 0.002, I² = 35% | Foc: 1.31 (1.04 to 1.66) P = 0.02, I² = 0% Gen: 0.80 (0.55 to 1.15) P = 0.22, I² = 54% Overall: 1.13 (0.93 to 1.38) P = 0.22, I² = 46% | Foc: 0.92 (0.67 to 1.25) P = 0.59, I² = 63% Gen: 1.56 (0.99 to 2.44) P = 0.05, I² = 0% Overall: 1.09 (0.84 to 1.40) P = 0.52, I² = 51% | Foc: 0.86 (0.67 to 1.11) P = 0.24, I² = 62% Gen: 1.45 (0.99 to 2.12) P = 0.06, I² = 0% Overall: 1.01 (0.81 to 1.24) P = 0.95, I² = 58% | |
| Sensitivity analysis excluding Placencia 1993b | Participants | Overall: 487 (Foc: 388; Gen 99) | Overall: 630 (Foc: 451; Gen: 179) | Overall: 492 (Foc: 392; Gen:100) | Overall: 492 (Foc: 392; Gen:100) |
| Pooled HR (95% CI), P value, I² (%) | Foc: 0.58 (0.42 to 0.79) P = 0.0006, I² = 45% Gen: 0.66 (0.32 to 1.32) P = 0.24, I² = 0% Overall: 0.59 (0.44 to 0.79) P = 0.0003, I² = 6% | Foc: 1.22 (0.94 to 1.58) P = 0.13, I² = 0% Gen: 0.86 (0.57 to 1.28) P = 0.46, I² = 62% Overall: 1.10 (0.89 to 1.37) P = 0.38, I² = 39% | Foc: 1.14 (0.80 to 1.62) P = 0.47, I² = 0% Gen: 1.41 (0.84 to 2.37) P = 0.19, I² = 0% Overall: 1.22 (0.91 to 1.63) P = 0.18; I² = 0% | Foc: 1.10 (0.81 to 1.49) P = 0.56, I² = 0% Gen: 1.23 (0.76 to 1.99) P = 0.40, I² = 0% Overall: 1.13 (0.87 to 1.47) P = 0.34, I² = 0% | |
| Sensitivity analysis for de Silva 1996c | Participants | Overall: 633 (Foc: 498: Gen: 135) | Overall: 779 (Foc: 562; Gen: 217) | Overall: 640 (Foc: 503; Gen: 137) | Overall: 640 (Foc: 503; Gen: 137) |
| Pooled HR (95% CI), P value, I² (%) | Foc: 0.69 (0.51 to 0.93) P = 0.01, I² = 47% Gen: 0.73 (0.37 to 1.45) P = 0.37, I² = 0% Overall: 0.69 (0.53 to 0.91) P = 0.009, I² = 0% | Foc: 1.30 (1.02 to 1.64) P = 0.03; I² = 0% Gen: 0.81 (0.56 to 1.19) P = 0.29, I² = 53% Overall: 1.14 (0.93 to 1.39) P = 0.21; I² = 42% | Foc: 0.94 (0.68 to 1.29) P = 0.69, I² = 62% Gen: 1.68 (1.06 to 2.69) P = 0.03, I² = 0% Overall: 1.13 (0.87 to 1.46) P = 0.37, I² = 51% | Foc: 0.87 (0.67 to 1.13) P = 0.31; I² = 65% Gen: 1.51 (1.02 to 2.23) P = 0.04, I² = 0% Overall: 1.03 (0.83 to 1.28) P = 0.79, I² = 65% | |
| Sensitivity analysis classifying generalised onset seizures and age at onset > 30 as focal onset seizures | Participants | Overall: 676 (Foc: 566; Gen: 110) | Overall: 822 (Foc: 649; Gen: 173) | Overall: 683 (Foc: 571; Gen: 112) | Overall: 683 (Foc: 569; Gen: 114) |
| Pooled HR (95% CI), P value, I² (%) | Foc: 0.66 (0.49 to 0.88), P = 0.005, I² = 63% Gen: 0.67 (0.35 to 1.28) P = 0.22, I² = 0% Overall: 0.66 (0.5 to 0.86) P = 0.002, I² = 31% | Foc: 1.29 (1.04 to 1.62) P = 0.02, I² = 0% Gen: 0.70 (0.45 to 1.07) P = 0.10, I² = 0% Overall: 1.14 (0.93 to 1.39) P = 0.20, I² = 17% | Foc: 0.97 (0.73 to 1.30) P = 0.85, I² = 52% Gen: 1.53 (0.96 to 2.44) P = 0.08, I² = 0% Overall: 1.10 (0.86 to 1.40) P = 0.45, I² = 41% | Foc: 0.91 (0.71 to 1.15) P = 0.41, I² = 43% Gen: 1.30 (0.82 to 2.08) P = 0.27, I² = 0% Overall: 0.97 (0.79 to 1.20) P = 0.81, I² = 21% | |
| Sensitivity analysis classifying generalised onset seizures and age at onset > 30 as uncertain seizure type | Participants | Overall: 676 (Foc: 520; Gen: 110; Unc: 46) | Overall: 822 (Foc: 584; Gen: 173; Unc: 65) | Overall: 683 (Foc: 525; Gen:112; Unc: 46) | Overall: 683 (Foc: 525; Gen:112; Unc: 46) |
| Pooled HR (95% CI) P value, I² (%) | Foc: 0.66 (0.49 to 0.88) P = 0.005, I² = 66% Gen: 0.67 (0.35 to 1.28) P = 0.22, I² = 0% Unc: 0.77 (0.18 to 3.27) P = 0.72, I² = 0% Overall: 0.66 (0.51 to 0.86) P = 0.002, I² = 16% | Foc: 1.31 (1.04 to 1.66) P = 0.02, I² = 0% Gen: 0.70 (0.45 to 1.07) P = 0.10, I² = 0% Unc: 0.82 (0.40 to 1.69) P = 0.59, I² = 58% Overall: 1.11 (0.91 to 1.35) P = 0.32, I² = 30% | Foc: 0.92 (0.67 to 1.25) P = 0.59, I² = 63% Gen: 1.53 (0.96 to 2.44) P = 0.08, I² = 0% Unc: 1.85 (0.77 to 4.42) P = 0.17, I² = 0% Overall: 1.12 (0.87 to 1.43) P = 0.42, I² = 42% | Foc: 0.86 (0.67 to 1.11) P = 0.24, I² = 62% Gen: 1.30 (0.82 to 2.08) P = 0.27, I² = 0% Unc:1.67 (0.85 to 3.28) P = 0.14, I² = 3% Overall: 1.00 (0.81 to 1.23) P = 0.27, I² = 0% | |
| CI: confidence interval; Foc: focal onset seizures; Gen: generalised onset seizures; HR: hazard ratio; Unc: uncertain seizure type aFor time to treatment failure and time to first seizure, HR < 1 indicates a clinical advantage for carbamazepine and for time to 12‐month and six‐month remission, HR < 1 indicates a clinical advantage for phenobarbitone. All results presented are calculated from fixed‐effect meta‐analysis. | |||||
| Trial | Adverse event dataa | Summary of reported results | |
| CBZ | PB | ||
| Reported list of 'problems' at the last visit (provided as IPD) | n = 54
| n = 54
| |
| Rate of drug side‐effects | No statistical significant difference was seen after treatment between 2 groups in the rate of drug side‐effects | No statistical significant difference was seen after treatment between 2 groups in the rate of drug side‐effects | |
| Most frequently observed side‐effects | Gastrointestinal side‐effects and "impaired function" (general malaise). Frequency not clearly stated | Gastrointestinal side‐effects and "impaired function" (general malaise). Frequency not clearly stated | |
| Withdrawal from the trial due to 'allergic reactions' | n = 24 1 participant withdrew due to an allergic reaction | n = 23 2 participants withdrew due to allergic reactions | |
| No adverse events reported | Not reported | Not reported | |
| "Exclusions due to adverse events or no efficacy" | n = 30 Proportion "excluded": 30% | n = 30 Proportion "excluded": 33.3% | |
| "Unacceptable" adverse events leading to drug withdrawal | n = 54
| n = 10
| |
| Reports of minor adverse events and side‐effects leading to drug withdrawal | n = 150
| n = 152
| |
| "Unacceptable" adverse events leading to drug withdrawal | n = 61
| n = 58
| |
| Narrative report of "adverse effects" and "serious side‐effects" | n = 155
No serious side‐effects | n = 155
No serious side‐effects | |
| Systemic side‐effects and side‐effects leading to drug change | n = 15 4 participants switched from CBZ to PB; 3 due to systemic side‐effects (1 with persistent rashes and 1 with marked granulocytopenia (decrease of granulocytes (white blood cells)) and 1 due to behavioural changes | n = 18 1 participant switched from PB to CBZ due to substantial behavioural side‐effects | |
| Participant‐reported symptomatic complaints (provided as IPD) | n = 19
| n = 18
| |
| Number of participants reporting side‐effects | n = 95 53 participants reported at least 1 side‐effect | n = 97 50 participants reported at least 1 side‐effect | |
| CBZ: carbamazepine; IPD: individual participant data; n: number; PB: phenobarbitone | |||
| Outcome or subgroup title | No. of studies | No. of participants | Statistical method | Effect size |
| 1 Time to treatment failure (any reason related to the treatment) Show forest plot | 4 | 676 | Hazard Ratio (Fixed, 95% CI) | 0.66 [0.51, 0.86] |
| 2 Time to treatment failure due to adverse events Show forest plot | 4 | 676 | Hazard Ratio (Fixed, 95% CI) | 0.67 [0.48, 0.93] |
| 3 Time to treatment failure due to lack of efficacy Show forest plot | 3 | 487 | Hazard Ratio (Fixed, 95% CI) | 0.54 [0.38, 0.77] |
| 4 Time to treatment failure (any reason related to the treatment) ‐ by seizure type Show forest plot | 4 | 676 | Hazard Ratio (Fixed, 95% CI) | 0.66 [0.50, 0.86] |
| 4.1 Focal onset | 4 | 520 | Hazard Ratio (Fixed, 95% CI) | 0.66 [0.49, 0.88] |
| 4.2 Generalised onset | 3 | 156 | Hazard Ratio (Fixed, 95% CI) | 0.65 [0.35, 1.23] |
| 5 Time to treatment failure due to adverse events ‐ by seizure type Show forest plot | 4 | 619 | Hazard Ratio (Fixed, 95% CI) | 0.69 [0.49, 0.97] |
| 5.1 Focal onset | 4 | 520 | Hazard Ratio (Fixed, 95% CI) | 0.67 [0.46, 0.96] |
| 5.2 Generalised onset | 2 | 99 | Hazard Ratio (Fixed, 95% CI) | 0.84 [0.35, 2.00] |
| 6 Time to treatment failure due to lack of efficacy ‐ by seizure type Show forest plot | 3 | 487 | Hazard Ratio (Fixed, 95% CI) | 0.54 [0.38, 0.78] |
| 6.1 Focal onset | 3 | 388 | Hazard Ratio (Fixed, 95% CI) | 0.54 [0.36, 0.80] |
| 6.2 Generalised onset | 2 | 99 | Hazard Ratio (Fixed, 95% CI) | 0.56 [0.23, 1.35] |
| 7 Time to first seizure Show forest plot | 6 | 822 | Hazard Ratio (Fixed, 95% CI) | 1.15 [0.95, 1.40] |
| 8 Time to first seizure ‐ by seizure type Show forest plot | 6 | 822 | Hazard Ratio (Fixed, 95% CI) | 1.13 [0.93, 1.38] |
| 8.1 Focal onset | 6 | 584 | Hazard Ratio (Fixed, 95% CI) | 1.31 [1.04, 1.66] |
| 8.2 Generalised onset | 5 | 238 | Hazard Ratio (Fixed, 95% CI) | 0.80 [0.55, 1.15] |
| 9 Time to first seizure ‐ sensitivity analysis Show forest plot | 6 | 822 | Hazard Ratio (Fixed, 95% CI) | 1.11 [0.91, 1.35] |
| 9.1 Focal onset | 6 | 584 | Hazard Ratio (Fixed, 95% CI) | 1.31 [1.04, 1.66] |
| 9.2 Generalised onset | 5 | 173 | Hazard Ratio (Fixed, 95% CI) | 0.70 [0.45, 1.07] |
| 9.3 Uncertain seizure type | 3 | 65 | Hazard Ratio (Fixed, 95% CI) | 0.82 [0.40, 1.69] |
| 10 Time to 12‐month remission Show forest plot | 4 | 683 | Hazard Ratio (Fixed, 95% CI) | 1.09 [0.85, 1.40] |
| 11 Time to 12‐month remission ‐ by seizure type Show forest plot | 4 | 683 | Hazard Ratio (Fixed, 95% CI) | 1.09 [0.84, 1.40] |
| 11.1 Focal onset | 4 | 525 | Hazard Ratio (Fixed, 95% CI) | 0.92 [0.67, 1.25] |
| 11.2 Generalised onset | 3 | 158 | Hazard Ratio (Fixed, 95% CI) | 1.56 [0.99, 2.44] |
| 12 Time to six‐month remission Show forest plot | 4 | 683 | Hazard Ratio (Fixed, 95% CI) | 0.98 [0.80, 1.21] |
| 13 Time to six‐month remission ‐ by seizure type Show forest plot | 4 | 683 | Hazard Ratio (Fixed, 95% CI) | 1.01 [0.81, 1.24] |
| 13.1 Focal onset | 4 | 525 | Hazard Ratio (Fixed, 95% CI) | 0.86 [0.67, 1.11] |
| 13.2 Generalised onset | 3 | 158 | Hazard Ratio (Fixed, 95% CI) | 1.45 [0.99, 2.12] |