Administración de suplementos nutricionales para la asistencia posoperatoria de la fractura de cadera en pacientes de edad avanzada
Información
- DOI:
- https://doi.org/10.1002/14651858.CD001880.pub6Copiar DOI

- Base de datos:
-
- Cochrane Database of Systematic Reviews
- Versión publicada:
-
- 30 noviembre 2016see what's new
- Tipo:
-
- Intervention
- Etapa:
-
- Review
- Grupo Editorial Cochrane:
-
Grupo Cochrane de Lesiones óseas, articulares y musculares
- Copyright:
-
- Copyright © 2016 The Cochrane Collaboration. Published by John Wiley & Sons, Ltd.
Cifras del artículo
Altmetric:
Citado por:
Autores
Contributions of authors
Alison Avenell, Toby Smith, Jenson Mak and James Curtain assessed and extracted data from trials for this version of the review. Alison Avenell and Toby Smith revised the analysis, performed the GRADE review, prepared the 'Summary of findings' tables and re‐interpreted the data for this version of the review. Alison Avenell wrote the first draft of this version of the review and all authors revised drafts. All authors are guarantors of this review.
Sources of support
Internal sources
-
University of Aberdeen, UK.
-
University of East Anglia, Norwich, UK.
-
Cambridge University Hospitals NHS Trust, UK.
-
Gosford Hospital, Gosford, Australia.
External sources
-
Chief Scientist Office of the Scottish Government Health Directorates, UK.
Declarations of interest
Alison Avenell: none known
Toby O Smith: none known
James P Curtain: none known
Jenson CS Mak: none known
Phyo K Myint: none known
Acknowledgements
For this version of the review, we are grateful for the helpful comments at editorial and external review from Helen Handoll and Jane Portlock. We also thank Lindsey Elstub and Joanne Elliott for their help on this version.
This project was supported by the National Institute for Health Research via Cochrane Infrastructure funding to the Cochrane Bone, Joint and Muscle Trauma Group. The views and opinions expressed therein are those of the authors and do not necessarily reflect those of the Systematic Reviews Programme, NIHR, NHS or the Department of Health.
Version history
| Published | Title | Stage | Authors | Version |
| 2016 Nov 30 | Nutritional supplementation for hip fracture aftercare in older people | Review | Alison Avenell, Toby O Smith, James P Curtain, Jenson CS Mak, Phyo K Myint | |
| 2010 Jan 20 | Nutritional supplementation for hip fracture aftercare in older people | Review | Alison Avenell, Helen HG Handoll | |
| 2006 Oct 18 | Nutritional supplementation for hip fracture aftercare in older people | Review | Alison Avenell, Helen HG Handoll | |
| 2005 Apr 20 | Nutritional supplementation for hip fracture aftercare in older people | Review | Alison Avenell, Helen HG Handoll | |
| 2004 Jan 26 | Nutritional supplementation for hip fracture aftercare in the elderly | Review | Alison Avenell, Helen HG Handoll | |
| 2000 Jun 27 | Nutritional supplementation for hip fracture aftercare in the elderly | Review | Alison Avenell, Helen HG Handoll | |
Differences between protocol and review
We made the following changes in this update (2016).
Types of interventions
In response to feedback from an external referee, we added clarification that the nutritional interventions covered in this review were aimed at improving recovery from hip fracture.
Risk of bias
In the protocol and previous versions of this review (Avenell 2010), we assessed methodological quality using a subject‐specific modification of the former generic evaluation tool developed by the Cochrane Bone, Muscle and Joint Trauma Group. In this update, we have changed to assessing the risk of bias of all included trials using the Cochrane 'Risk of bias' tool (Higgins 2011).
Outcomes
In this update to the review, we do not report on the following outcomes, which were listed under 'Other outcomes' in previous versions of this review (Avenell 2010):
-
changes in anthropometric indices, such as weight, skinfold thickness, and mid‐upper arm circumference
-
new fractures
-
changes in bone mineral density, assessed by techniques involving radiation, for example dual photon absorptiometry, dual energy X‐ray absorptiometry, quantitative computed tomography
-
changes in nutritional indicators measured in blood, such as albumin, transferrin, vitamin and mineral levels, haemoglobin
-
changes in functional markers of nutritional status, including delayed cutaneous hypersensitivity (a marker of immune function) and grip strength
GRADE assessment
We used the GRADE approach to assess the quality of evidence related to the each of the primary outcomes for all comparisons.
Keywords
MeSH
Medical Subject Headings (MeSH) Keywords
Medical Subject Headings Check Words
Aged; Humans;
PICO
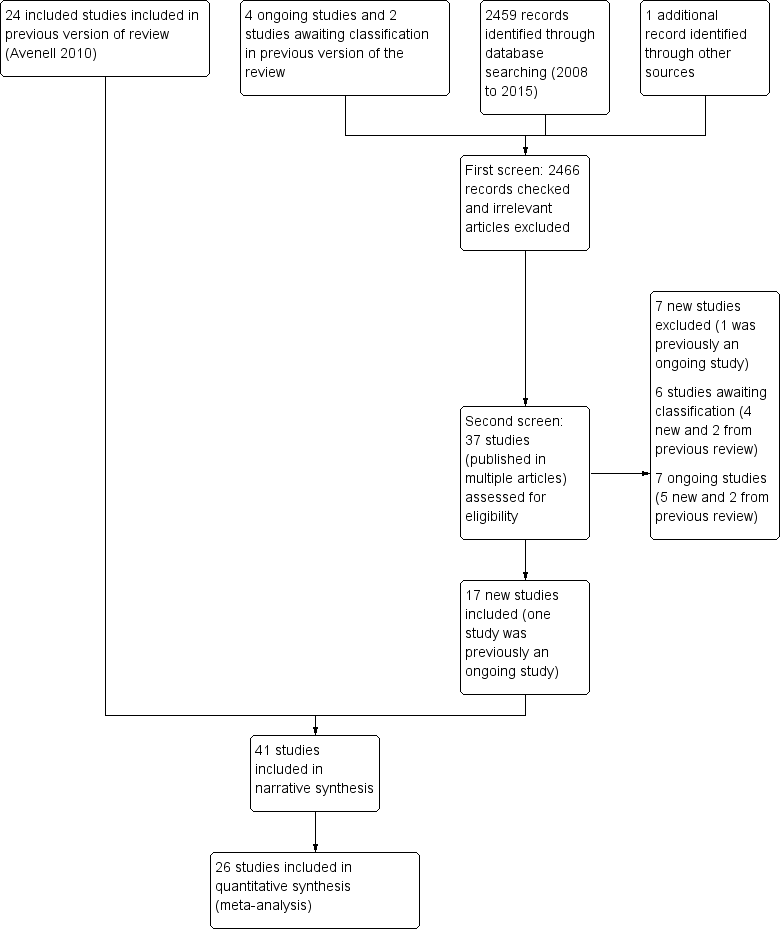
Study flow diagram
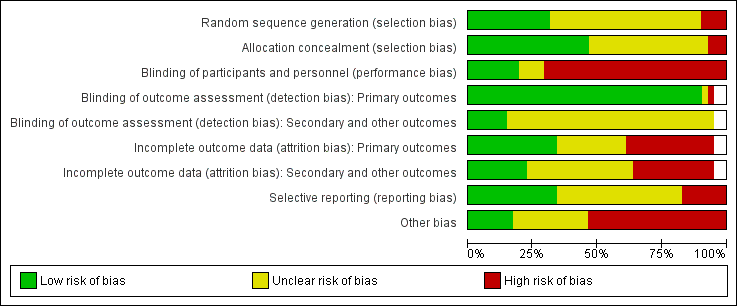
Risk of bias graph: review authors' judgements about each risk of bias item presented as percentages across all included studies
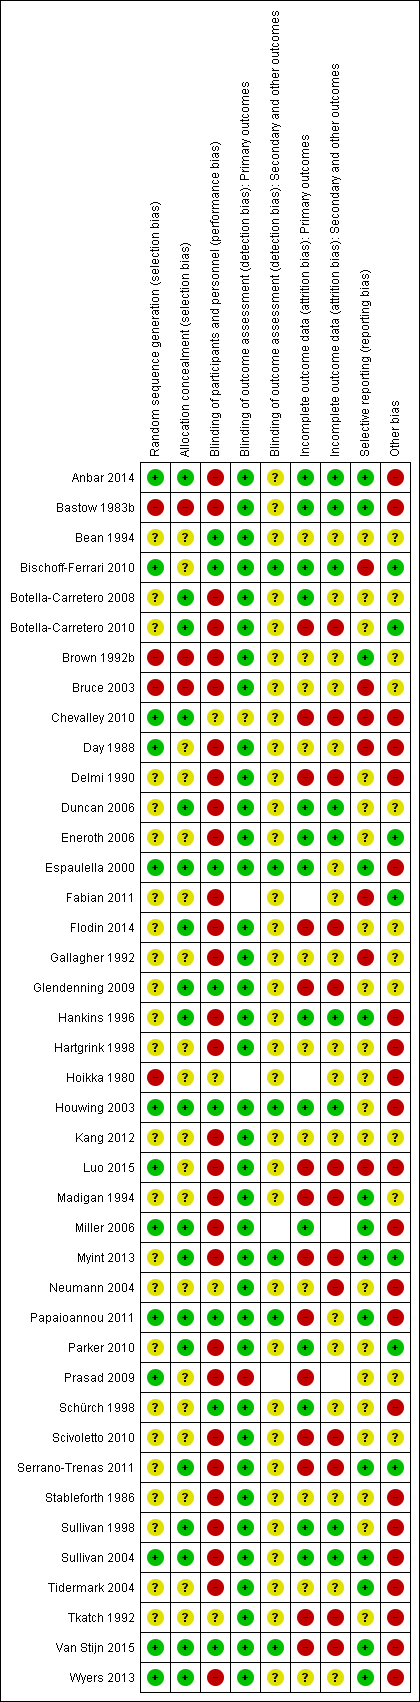
Risk of bias summary: review authors' judgements about each risk of bias item for each included study

Forest plot of comparison: 1 Multinutrient supplements (oral, nasogastric, intravenous) versus control, outcome: 1.1 Mortality by end of study
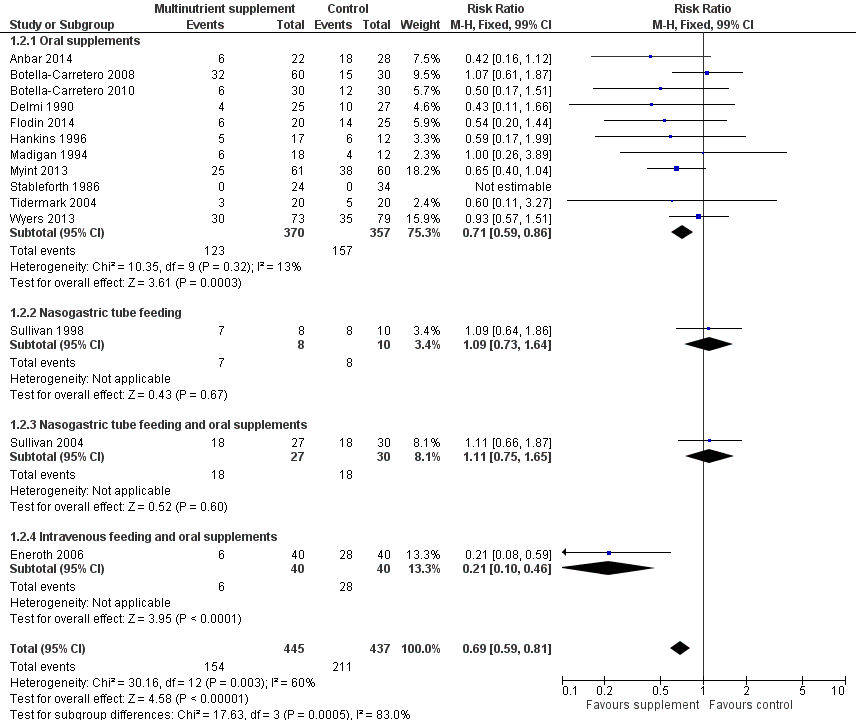
Forest plot of comparison: 1 Multinutrient supplements (oral, nasogastric, intravenous) versus control, outcome: 1.2 Participants with complications at end of study

Funnel plot of comparison: 1 Multinutrient supplements (oral, nasogastric, intravenous) versus control, outcome: 1.1 Mortality by end of study

Funnel plot of comparison: 1 Multinutrient supplements (oral, nasogastric, intravenous) versus control, outcome: 1.2 Participants with complications at end of study

Comparison 1 Multinutrient supplements (oral, nasogastric, intravenous) versus control, Outcome 1 Mortality by end of study.

Comparison 1 Multinutrient supplements (oral, nasogastric, intravenous) versus control, Outcome 2 Participants with complications at end of study.

Comparison 1 Multinutrient supplements (oral, nasogastric, intravenous) versus control, Outcome 3 Participants with complications at end of study: random‐effects model.

Comparison 1 Multinutrient supplements (oral, nasogastric, intravenous) versus control, Outcome 4 Unfavourable outcome (death or complications) at end of study.

Comparison 1 Multinutrient supplements (oral, nasogastric, intravenous) versus control, Outcome 5 Unfavourable outcome (death or complications) ‐ oral supplements extra analyses.

Comparison 1 Multinutrient supplements (oral, nasogastric, intravenous) versus control, Outcome 6 Adverse effects (putatively related to treatment).

Comparison 2 Multinutrient supplements (oral, nasogastric routes, intravenous) versus control (split by nutritional status), Outcome 1 Mortality by end of study.

Comparison 2 Multinutrient supplements (oral, nasogastric routes, intravenous) versus control (split by nutritional status), Outcome 2 Mortality by end of study ‐ oral supplements only.

Comparison 2 Multinutrient supplements (oral, nasogastric routes, intravenous) versus control (split by nutritional status), Outcome 3 Participants with complications at end of study.

Comparison 2 Multinutrient supplements (oral, nasogastric routes, intravenous) versus control (split by nutritional status), Outcome 4 Unfavourable outcome (death or complications) at end of study.
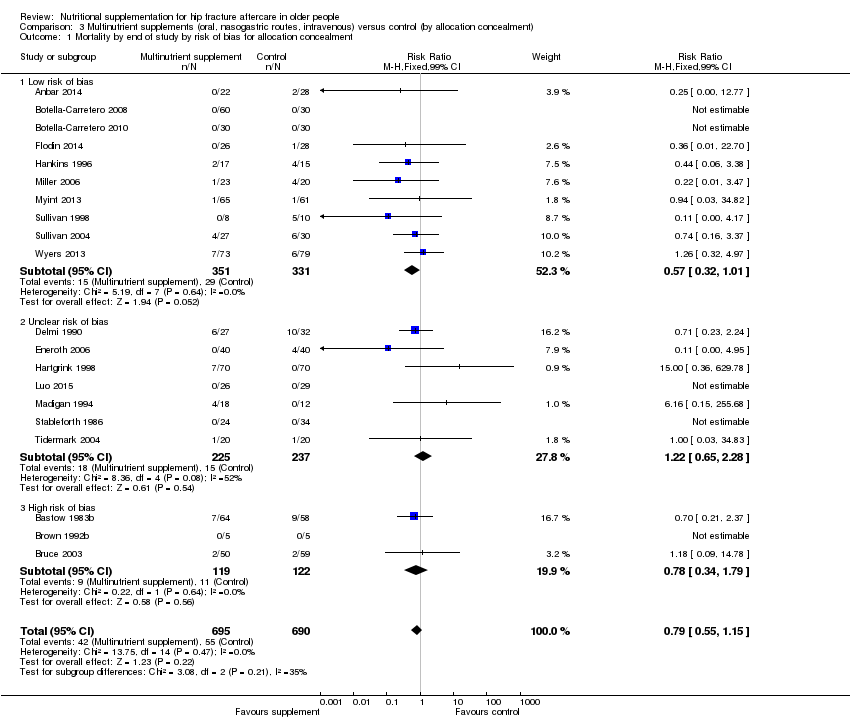
Comparison 3 Multinutrient supplements (oral, nasogastric routes, intravenous) versus control (by allocation concealment), Outcome 1 Mortality by end of study by risk of bias for allocation concealment.

Comparison 3 Multinutrient supplements (oral, nasogastric routes, intravenous) versus control (by allocation concealment), Outcome 2 Participants with complications at end of study by risk of bias for allocation concealment.

Comparison 4 High protein‐containing supplements versus low protein‐ or non‐protein‐containing supplements, Outcome 1 Mortality by end of study.

Comparison 4 High protein‐containing supplements versus low protein‐ or non‐protein‐containing supplements, Outcome 2 Unfavourable outcome (death or complications) at end of study.
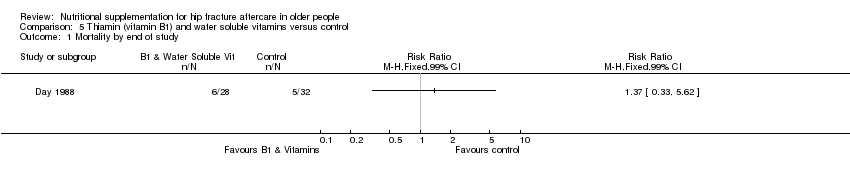
Comparison 5 Thiamin (vitamin B1) and water soluble vitamins versus control, Outcome 1 Mortality by end of study.

Comparison 5 Thiamin (vitamin B1) and water soluble vitamins versus control, Outcome 2 Participants with complications at end of study.

Comparison 6 Vitamin D versus control or lower dose supplementation, Outcome 1 Participants with complications at end of study.
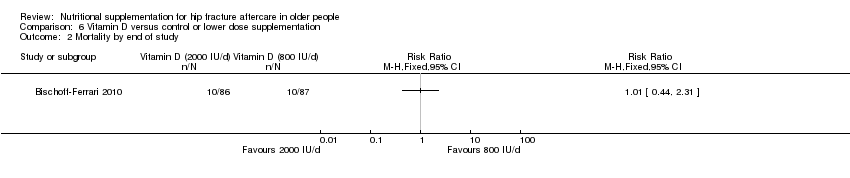
Comparison 6 Vitamin D versus control or lower dose supplementation, Outcome 2 Mortality by end of study.
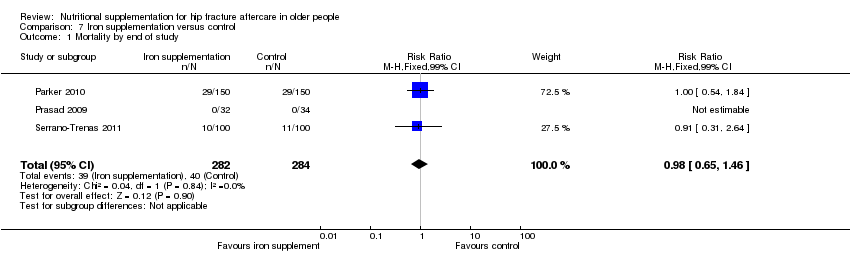
Comparison 7 Iron supplementation versus control, Outcome 1 Mortality by end of study.
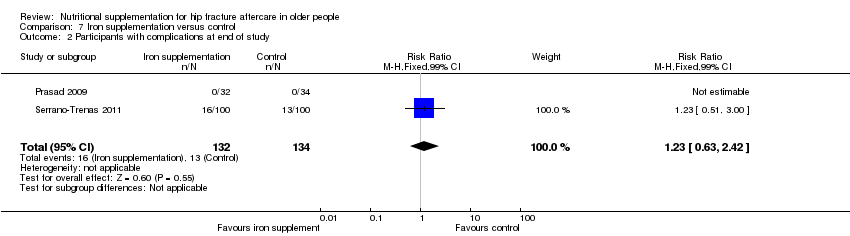
Comparison 7 Iron supplementation versus control, Outcome 2 Participants with complications at end of study.

Comparison 8 Taurine versus placebo, Outcome 1 Mortality by end of study.

Comparison 9 Dietetic assistants versus usual care, Outcome 1 Mortality by end of study.

Comparison 9 Dietetic assistants versus usual care, Outcome 2 Participants with complications at end of study.
| Multinutrient supplements (oral) versus control for hip fracture aftercare in older people | ||||||
| Patient or population: Older people undergoing hip fracture aftercare Comparison: Standard postoperative nutritional support and care in control groups | ||||||
| Outcomes | Illustrative comparative risks* (95% CI) | Relative effect | No of Participants | Quality of the evidence | Comments | |
| Assumed risk | Corresponding risk | |||||
| Control | Multinutrient supplements (oral) versus control | |||||
| Mortality by end of study Follow‐up: 1‐12 months | Study population | RR 0.81 | 968 | ⊕⊕⊝⊝ | The statistical test for subgroup differences between the results for the 5 trials targeting malnourished participants and those 10 trials not targeting malnourished participants did not confirm a difference between the two subgroups for mortality | |
| 72 per 10001 | 59 per 1000 | |||||
| High risk2 | ||||||
| 250 per 1000 | 203 per 1000 | |||||
| Participants with complications (e.g. pressure sore, chest infection) at end of study | Study population | RR 0.71 | 727 | ⊕⊕⊝⊝ | Only 2 trials targeting malnourished people reported these data | |
| 443 per 10004 | 315 per 1000 | |||||
| Moderate risk5 | ||||||
| 290 per 1000 | 206 per 1000 | |||||
| Unfavourable outcome 7 by end of study Follow‐up: 1‐12 months | Study population | RR 0.67 (0.51 to 0.89) | 334 (6 studies) | ⊕⊝⊝⊝ | Only 1 trial targeting malnourished people reported these data | |
| 500 per 10004 | 335 per 1000 (255 to 445) | |||||
| Putative side effects of treatment (e.g. vomiting and diarrhoea) Follow‐up: during supplementation period | Study population | RR 0.99 (0.47 to 2.05) | 442 (6 studies) | ⊕⊝⊝⊝ | Three of the 6 trials reported no adverse effects | |
| 50 per 10004 | 50 per 1000 (24 to 103) | |||||
| *The basis for the assumed risk (e.g. the median control group risk across studies) is provided in footnotes. The corresponding risk (and its 95% confidence interval) is based on the assumed risk in the comparison group and the relative effect of the intervention (and its 95% CI). | ||||||
| GRADE Working Group grades of evidence | ||||||
| 1. The control group risk is the median control group risk across the 9 studies that reported one or more deaths in the control group. | ||||||
| Multinutrient supplements (nasogastric) versus control for hip fracture aftercare in older people7 | ||||||
| Patient or population: Older people undergoing hip fracture aftercare Comparison: Standard postoperative nutritional support and care in control groups | ||||||
| Outcomes | Illustrative comparative risks* (95% CI) | Relative effect | No of Participants | Quality of the evidence | Comments | |
| Assumed risk | Corresponding risk | |||||
| Control | Multinutrient supplements (nasogastric) versus control | |||||
| Mortality by end of study | Study Population | RR: 0.99 (0.50 to 1.97) | 280 (3 studies) | ⊕⊝⊝⊝ | Only 1 trial targeting malnourished participants reported these data | |
| 156 per 10002 | 155 per 1000 (78 to 308) | |||||
| Participants with complications (e.g. pressure sore, aspiration pneumonia) at end of study | Study Population | RR: 1.09 (0.73 to 1.64) | 18 (1 study) | ⊕⊝⊝⊝ | For consistency we have presented 95% CI here but have used 99% CI for single trial data in the main text: 99% CI 0.64 to 1.86.6 | |
| 800 per 10004 | 872 per 1000 (584 to 1000) | |||||
| Unfavourable outcome Follow‐up: 1‐12 months | See comment | See comment | Outcome not reported | |||
| Putative side effects of treatment (e.g. aspiration pneumonia) Follow‐up: during supplementation period | See comment | See comment | Insufficient data to draw any conclusions. However, poor toleration of tube feeding was noted.1 There was no report of aspiration pneumonia (1 study; 140 participants). One study reported 18 (28% of 64) participants in the intervention group developed diarrhoea ‐ this was ascribed to antibiotics in 16 ‐ but did not report on the control group. One study (18 participants) reported 3 cases of "bloating" in the intervention group; it found no feed‐induced diarrhoea | |||
| *The basis for the assumed risk (e.g. the median control group risk across studies) is provided in footnotes. The corresponding risk (and its 95% confidence interval) is based on the assumed risk in the comparison group and the relative effect of the intervention (and its 95% CI). | ||||||
| GRADE Working Group grades of evidence the estimate. | ||||||
| 1. Nasogatric feeding was poorly tolerated but varied between studies. One study reported only 26% of the intervention group tolerated tube feeding for the full two weeks; another reported 78% completed the course (until hospital discharge). | ||||||
| Study ID | Intervention | Control | Mean difference (99% confidence intervaI) | ||||
| Multinutritional oral supplements | |||||||
| 22 | 10.1 | 3.2 | 28 | 12.5 | 5.5 | ‐2.40 days (‐5.60 to 0.80) | |
| 30 | 13.3 | 4.3 | 30 | 12.8 | 4.0 | 0.50 days (‐2.26 to 3.26) | |
| 5 | 27.00 | 10.00 | 5 | 48.00 | 37.00 | ‐21.00 days (‐65.15 to 23.15) | |
| 50 | 17.70 | 9.40 | 58 | 16.60 | 9.20 | 1.10 days (‐3.53 to 5.73) | |
| 18 | 16.00 | 8.00 | 12 | 15.00 | 11.00 | 1.00 day (‐8.51 to 10.51) | |
| 61 | 26.2 | 8.2 | 60 | 29.9 | 11.2 | ‐3.70 days (‐8.30 to 0.90) | |
| Nasogastric tube feeding | |||||||
| 8 | 38.20 | 36.90 | 7 | 23.70 | 20.00 | 14.50 days (‐24.34 to 53.34) | |
| High protein supplements | |||||||
| 85 | 16.40 | 6.60 | 86 | 17.20 | 7.70 | ‐0.80 days (‐3.62 to 2.02) | |
| 18 | 23.20 | 5.52 | 20 | 28.00 | 11.63 | ‐4.80 days (‐12.29 to 2.69) | |
| Iron supplementation versus control | |||||||
| 150 | 18.8 | 17.4 | 150 | 21.3 | 20.6 | ‐2.50 days (‐8.17 to 3.17) | |
| 99 | 13.5 | 7.1 | 97 | 13.1 | 6.9 | 0.40 days (‐2.18 to 2.98) | |
| Vitamin B1 | |||||||
| 28 | 35.00 | 34.00 | 30 | 29.00 | 30.00 | 6.00 days (‐15.75 to 27.75) | |
| Vitamin, mineral and amino acid supplementation versus control | |||||||
| 49 | 15.4 | 6.8 | 47 | 17.9 | 7.3 | ‐2.50 days (‐6.21 to 1.21) | |
| Semi‐essential amino acid | |||||||
| 111 | 13 | 10 | 123 | 13 | 11 | 0.00 days (‐3.54 to 3.54) | |
| SD: standard deviation | |||||||
| Outcome or subgroup title | No. of studies | No. of participants | Statistical method | Effect size |
| 1 Mortality by end of study Show forest plot | 20 | 1385 | Risk Ratio (M‐H, Fixed, 99% CI) | 0.79 [0.55, 1.15] |
| 1.1 Oral supplements | 15 | 968 | Risk Ratio (M‐H, Fixed, 99% CI) | 0.81 [0.49, 1.32] |
| 1.2 Nasogastric tube feeding | 3 | 280 | Risk Ratio (M‐H, Fixed, 99% CI) | 0.99 [0.50, 1.97] |
| 1.3 Nasogastric tube feeding and oral supplements | 1 | 57 | Risk Ratio (M‐H, Fixed, 99% CI) | 0.74 [0.23, 2.35] |
| 1.4 Intravenous feeding and oral supplements | 1 | 80 | Risk Ratio (M‐H, Fixed, 99% CI) | 0.11 [0.01, 2.00] |
| 2 Participants with complications at end of study Show forest plot | 14 | 882 | Risk Ratio (M‐H, Fixed, 99% CI) | 0.69 [0.59, 0.81] |
| 2.1 Oral supplements | 11 | 727 | Risk Ratio (M‐H, Fixed, 99% CI) | 0.71 [0.59, 0.86] |
| 2.2 Nasogastric tube feeding | 1 | 18 | Risk Ratio (M‐H, Fixed, 99% CI) | 1.09 [0.73, 1.64] |
| 2.3 Nasogastric tube feeding and oral supplements | 1 | 57 | Risk Ratio (M‐H, Fixed, 99% CI) | 1.11 [0.75, 1.65] |
| 2.4 Intravenous feeding and oral supplements | 1 | 80 | Risk Ratio (M‐H, Fixed, 99% CI) | 0.21 [0.10, 0.46] |
| 3 Participants with complications at end of study: random‐effects model Show forest plot | 14 | 882 | Risk Ratio (M‐H, Random, 99% CI) | 0.70 [0.53, 0.91] |
| 3.1 Oral supplements | 11 | 727 | Risk Ratio (M‐H, Random, 99% CI) | 0.72 [0.58, 0.89] |
| 3.2 Nasogastric tube feeding | 1 | 18 | Risk Ratio (M‐H, Random, 99% CI) | 1.09 [0.73, 1.64] |
| 3.3 Nasogastric tube feeding and oral supplements | 1 | 57 | Risk Ratio (M‐H, Random, 99% CI) | 1.11 [0.75, 1.65] |
| 3.4 Intravenous feeding and oral supplements | 1 | 80 | Risk Ratio (M‐H, Random, 99% CI) | 0.21 [0.10, 0.46] |
| 4 Unfavourable outcome (death or complications) at end of study Show forest plot | 6 | 334 | Risk Ratio (M‐H, Fixed, 99% CI) | 0.67 [0.51, 0.89] |
| 4.1 Oral supplements | 6 | 334 | Risk Ratio (M‐H, Fixed, 99% CI) | 0.67 [0.51, 0.89] |
| 4.2 Nasogastric tube feeding | 0 | 0 | Risk Ratio (M‐H, Fixed, 99% CI) | 0.0 [0.0, 0.0] |
| 4.3 Nasogastric tube feeding and oral supplements | 0 | 0 | Risk Ratio (M‐H, Fixed, 99% CI) | 0.0 [0.0, 0.0] |
| 4.4 Intravenous feeding and oral supplements | 0 | 0 | Risk Ratio (M‐H, Fixed, 99% CI) | 0.0 [0.0, 0.0] |
| 5 Unfavourable outcome (death or complications) ‐ oral supplements extra analyses Show forest plot | 6 | Risk Ratio (M‐H, Fixed, 99% CI) | Subtotals only | |
| 5.1 Oral supplements: worst case scenario | 6 | 353 | Risk Ratio (M‐H, Fixed, 99% CI) | 0.81 [0.62, 1.04] |
| 5.2 Oral supplements: Hankins 1996 acute hospital data | 1 | 31 | Risk Ratio (M‐H, Fixed, 99% CI) | 0.96 [0.71, 1.31] |
| 5.3 Oral supplements: Hankins 1996 post discharge | 1 | 31 | Risk Ratio (M‐H, Fixed, 99% CI) | 1.10 [0.50, 2.41] |
| 6 Adverse effects (putatively related to treatment) Show forest plot | 8 | Risk Ratio (M‐H, Fixed, 99% CI) | Subtotals only | |
| 6.1 Oral supplements (mainly diarrhoea or/and vomiting) | 6 | 442 | Risk Ratio (M‐H, Fixed, 99% CI) | 0.99 [0.47, 2.05] |
| 6.2 Nasogatric tube feeding | 1 | 18 | Risk Ratio (M‐H, Fixed, 99% CI) | 8.56 [0.51, 144.86] |
| 6.3 Intravenous feeding and oral supplements | 1 | 57 | Risk Ratio (M‐H, Fixed, 99% CI) | 1.85 [0.49, 7.03] |
| 6.4 Nasogastric tube feeding and oral supplements | 0 | 0 | Risk Ratio (M‐H, Fixed, 99% CI) | 0.0 [0.0, 0.0] |
| Outcome or subgroup title | No. of studies | No. of participants | Statistical method | Effect size |
| 1 Mortality by end of study Show forest plot | 20 | 1385 | Risk Ratio (M‐H, Fixed, 99% CI) | 0.79 [0.55, 1.15] |
| 1.1 Malnourished targeted | 6 | 388 | Risk Ratio (M‐H, Fixed, 99% CI) | 0.55 [0.27, 1.11] |
| 1.2 Malnourished not targeted | 14 | 997 | Risk Ratio (M‐H, Fixed, 99% CI) | 0.92 [0.59, 1.42] |
| 2 Mortality by end of study ‐ oral supplements only Show forest plot | 15 | 968 | Risk Ratio (M‐H, Fixed, 99% CI) | 0.81 [0.49, 1.32] |
| 2.1 Malnourished targeted | 5 | 266 | Risk Ratio (M‐H, Fixed, 99% CI) | 0.39 [0.13, 1.20] |
| 2.2 Malnourished not targeted | 10 | 702 | Risk Ratio (M‐H, Fixed, 99% CI) | 0.99 [0.56, 1.72] |
| 3 Participants with complications at end of study Show forest plot | 14 | 882 | Risk Ratio (M‐H, Fixed, 99% CI) | 0.69 [0.59, 0.81] |
| 3.1 Malnourished targeted | 2 | 150 | Risk Ratio (M‐H, Fixed, 99% CI) | 0.64 [0.46, 0.89] |
| 3.2 Malnourished not targeted | 12 | 732 | Risk Ratio (M‐H, Fixed, 99% CI) | 0.70 [0.59, 0.84] |
| 4 Unfavourable outcome (death or complications) at end of study Show forest plot | 6 | 334 | Risk Ratio (M‐H, Fixed, 99% CI) | 0.67 [0.51, 0.89] |
| 4.1 Malnourished targeted | 1 | 29 | Risk Ratio (M‐H, Fixed, 99% CI) | 0.47 [0.17, 1.31] |
| 4.2 Malnourished not targeted | 5 | 305 | Risk Ratio (M‐H, Fixed, 99% CI) | 0.70 [0.52, 0.93] |
| Outcome or subgroup title | No. of studies | No. of participants | Statistical method | Effect size |
| 1 Mortality by end of study by risk of bias for allocation concealment Show forest plot | 20 | 1385 | Risk Ratio (M‐H, Fixed, 99% CI) | 0.79 [0.55, 1.15] |
| 1.1 Low risk of bias | 10 | 682 | Risk Ratio (M‐H, Fixed, 99% CI) | 0.57 [0.32, 1.01] |
| 1.2 Unclear risk of bias | 7 | 462 | Risk Ratio (M‐H, Fixed, 99% CI) | 1.22 [0.65, 2.28] |
| 1.3 High risk of bias | 3 | 241 | Risk Ratio (M‐H, Fixed, 99% CI) | 0.78 [0.34, 1.79] |
| 2 Participants with complications at end of study by risk of bias for allocation concealment Show forest plot | 14 | 882 | Risk Ratio (M‐H, Fixed, 99% CI) | 0.69 [0.59, 0.81] |
| 2.1 Low risk of bias | 9 | 622 | Risk Ratio (M‐H, Fixed, 99% CI) | 0.78 [0.66, 0.92] |
| 2.2 Unclear risk of bias | 5 | 260 | Risk Ratio (M‐H, Fixed, 99% CI) | 0.38 [0.24, 0.61] |
| 2.3 High risk of bias | 0 | 0 | Risk Ratio (M‐H, Fixed, 99% CI) | 0.0 [0.0, 0.0] |
| Outcome or subgroup title | No. of studies | No. of participants | Statistical method | Effect size |
| 1 Mortality by end of study Show forest plot | 4 | 361 | Risk Ratio (M‐H, Fixed, 99% CI) | 1.42 [0.85, 2.37] |
| 1.1 Protein‐containing supplement v non‐protein‐containing supplement | 3 | 315 | Risk Ratio (M‐H, Fixed, 99% CI) | 1.38 [0.82, 2.34] |
| 1.2 High protein‐containing supplement v low protein‐containing supplement | 1 | 46 | Risk Ratio (M‐H, Fixed, 99% CI) | 2.18 [0.21, 22.42] |
| 2 Unfavourable outcome (death or complications) at end of study Show forest plot | 2 | 223 | Risk Ratio (M‐H, Fixed, 99% CI) | 0.78 [0.65, 0.95] |
| 2.1 Protein‐containing supplement v non‐protein‐containing supplement | 2 | 223 | Risk Ratio (M‐H, Fixed, 99% CI) | 0.78 [0.65, 0.95] |
| Outcome or subgroup title | No. of studies | No. of participants | Statistical method | Effect size |
| 1 Mortality by end of study Show forest plot | 1 | Risk Ratio (M‐H, Fixed, 99% CI) | Totals not selected | |
| 2 Participants with complications at end of study Show forest plot | 1 | Risk Ratio (M‐H, Fixed, 99% CI) | Totals not selected | |
| Outcome or subgroup title | No. of studies | No. of participants | Statistical method | Effect size |
| 1 Participants with complications at end of study Show forest plot | 1 | Risk Ratio (M‐H, Fixed, 99% CI) | Totals not selected | |
| 2 Mortality by end of study Show forest plot | 1 | Risk Ratio (M‐H, Fixed, 95% CI) | Totals not selected | |
| Outcome or subgroup title | No. of studies | No. of participants | Statistical method | Effect size |
| 1 Mortality by end of study Show forest plot | 3 | 566 | Risk Ratio (M‐H, Fixed, 99% CI) | 0.98 [0.65, 1.46] |
| 2 Participants with complications at end of study Show forest plot | 2 | 266 | Risk Ratio (M‐H, Fixed, 99% CI) | 1.23 [0.63, 2.42] |
| Outcome or subgroup title | No. of studies | No. of participants | Statistical method | Effect size |
| 1 Mortality by end of study Show forest plot | 1 | Risk Ratio (M‐H, Fixed, 99% CI) | Totals not selected | |
| Outcome or subgroup title | No. of studies | No. of participants | Statistical method | Effect size |
| 1 Mortality by end of study Show forest plot | 1 | Risk Ratio (M‐H, Fixed, 99% CI) | Totals not selected | |
| 2 Participants with complications at end of study Show forest plot | 1 | Risk Ratio (M‐H, Fixed, 99% CI) | Totals not selected | |