Administración de suplementos nutricionales para la asistencia posoperatoria de la fractura de cadera en pacientes de edad avanzada
Appendices
Appendix 1. Search strategies used for this update
CENTRAL (Ovid Online)
1 exp Hip Fractures/ (881)
2 ((hip* or femur* or femoral* or trochant* or pertrochant* or intertrochant* or subtrochant* or intracapsular* or extracapsular*) adj3 fracture*).tw. (2531)
3 1 or 2 (2613)
4 exp Food/ (31621)
5 exp Diet/ (11888)
6 Nutritional Status/ (1475)
7 Nutritional Requirements/ (474)
8 Nutrition assessment/ (373)
9 exp Nutrition Therapy/ (6544)
10 exp Nutrition Disorders/ (9355)
11 Dietetics/ (73)
12 (food* or feed* or fed or diet* or nutri* or supplement* or calorie* or energy intake or macronutrient* or micronutrient*).tw. (75436)
13 Calcium, Dietary/ or Iron, Dietary/ or Phosphorus, Dietary/ or Potassium, Dietary/ or Sodium, Dietary/ or exp Magnesium/ or Sulfur/ or Fluorides/ (3265)
14 exp Trace Elements/ (4024)
15 (magnesium or chloride* or sulfate* or sulphate* or fluoride* or zinc or copper or selen* or manganese or molybdenum or chromium or cobalt or iodi#e or trace element* or trace metal* or micronutrient*).tw. (20419)
16 exp Vitamins/ (11325)
17 exp Carotenoids/ (2634)
18 (vitamin*or ascorb*or thiamin* or riboflavin* or pyridox*or niacin*or fola* or folic or biotin or cobalamin* or retino* or caroten* or tocopher* or dihydrotachysterol or calcitriol or cholecalciferol or alfacalcidol or alphacalcidol).tw. (9627)
19 or/4‐18 (114255)
20 3 and 19 (340)
MEDLINE (Ovid Online)
1 exp Hip Fractures/ (18900)
2 ((hip* or femur* or femoral* or trochant* or pertrochant* or intertrochant* or subtrochant* or intracapsular* or extracapsular*) adj3 fracture*).tw. (29214)
3 1 or 2 (34052)
4 exp Food/ (1132277)
5 exp Diet/ (212311)
6 Nutritional Status/ (25768)
7 Nutritional Requirements/ (17713)
8 Nutrition Assessment/ (8832)
9 exp Nutrition Therapy/ (85077)
10 exp Nutrition Disorders/ (281563)
11 Dietetics/ (5321)
12 (food* or feed* or fed or diet* or nutri* or supplement* or calorie* or energy intake or macronutrient* or micronutrient*).tw. (1277335)
13 Calcium, Dietary/ or Iron, Dietary/ or Phosphorus, Dietary/ or Potassium, Dietary/ or Sodium, Dietary/ or exp Magnesium/ or Sulfur/ or Fluorides/ (113180)
14 exp Trace Elements/ (280342)
15 (magnesium or chloride* or sulfate* or sulphate* or fluoride* or zinc or copper or selen* or manganese or molybdenum or chromium or cobalt or iodi#e or trace element* or trace metal* or micronutrient*).tw. (626881)
16 exp Vitamins/ (279429)
17 exp Carotenoids/ (70869)
18 (vitamin*or ascorb*or thiamin* or riboflavin* or pyridox*or niacin*or fola* or folic or biotin or cobalamin* or retino* or caroten* or tocopher* or dihydrotachysterol or calcitriol or cholecalciferol or alfacalcidol or alphacalcidol).tw. (197485)
19 or/4‐18 (2974627)
20 3 and 19 (3061)
21 Randomized controlled trial.pt. (415161)
22 Controlled clinical trial.pt. (91996)
23 randomized.ab. (337237)
24 placebo.ab. (169335)
25 Drug therapy.fs. (1851378)
26 randomly.ab. (243329)
27 trial.ab. (351376)
28 groups.ab. (1515273)
29 or/21‐28 (3690561)
30 exp Animals/ not Humans/ (4137930)
31 29 not 30 (3175177)
32 20 and 31 (1043)
33 (2008* or 2009* or 2010* or 2011* or 2012* or 2013* or 2014* or 2015*).ed,dc. (8171541)
34 32 and 33 (483)
Embase (Ovid Online)
1 exp Hip Fracture/ (32421)
2 ((hip* or femur* or femoral* or trochant* or pertrochant* or intertrochant* or subtrochant* or intracapsular* or extracapsular*) adj3 fracture*).tw. (36361)
3 1 or 2 (47054)
4 exp Nutrition/ (1598956)
5 exp Nutritional Disorder/ (634610)
6 Dietetics/ or Dietitian/ (10947)
7 exp Feeding/ (138744)
8 (food* or feed* or fed or diet* or nutri* or supplement*).tw. (1503689)
9 Calcium intake/ or Iron intake/ or Phosphate intake/ or Potassium intake/ or Salt intake/ or Sodium intake/ or Magnesium/ or Phosphorus/ or Sulfur/ or Fluoride/ (197235)
10 exp Trace Element/ (29882)
11 (magnesium or chloride* or sulfate* or sulphate* or fluoride* or zinc or copper or selen* or manganese or molybdenum or chromium or cobalt or iodi#e or trace element* or trace metal* or micronutrient*).tw. (693705)
12 exp Vitamin/ (500209)
13 (vitamin*or ascorb*or thiamin* or riboflavin* or pyridox*or niacin*or fola* or folic or biotin or cobalamin* or retino* or caroten* or tocopher* or dihydrotachysterol or calcitriol or cholecalciferol or colecalciferol or alfacalcidol or alphacalcidol).tw. (224774)
14 or/4‐13 (3739226)
15 3 and 14 (7532)
16 exp Randomized Controlled Trial/ or exp Single Blind Procedure/ or exp Double Blind Procedure/ or Crossover Procedure/ (437780)
17 (random* or RCT or placebo or allocat* or crossover* or 'cross over' or trial or (doubl* adj1 blind*) or (singl* adj1 blind*)).ti,ab. (1446337)
18 16 or 17 (1524910)
19 (exp Animal/ or animal.hw. or Nonhuman/) not (exp Human/ or Human Cell/ or (human or humans).ti.) (5407531)
20 18 not 19 (1343809)
21 15 and 20 (1253)
22 (2008* or 2009* or 2010* or 2011* or 2012* or 2013* or 2014* or 2015*).em,dd. (10439093)
23 21 and 22 (847)
CAB Abstracts (Ovid Online)
1 Hips/ (2306)
2 Bone Fractures/ (5244)
3 1 and 2 (347)
4 ((hip* or femur* or femoral* or trochant* or pertrochant* or intertrochant* or subtrochant* or intracapsular* or extracapsular*) adj3 fracture*).tw. (1551)
5 3 or 4 (1625)
6 exp Food/ or exp Intake/ (393838)
7 exp Nutrition/ or Elderly nutrition/ or Clinical nutrition/ or Nutrition planning/ or Nutrition programmes/ or Nutritional support/ or Nutritional intervention/ or Nutritional state/ or Nutritional assessment/ or Mineral nutrition/ (122401)
8 exp Therapeutic Diets/ (11760)
9 Dietetics/ or Diet planning/ or Diet treatment/ or Dietitians/ (7241)
10 exp Supplements/ (98759)
11 (food* or feed* or fed or diet* or nutri* or supplement*).tw. (1761385)
12 Calcium/ or Phosphorus/ or Potassium/ or Sodium/ or Magnesium/ or Sulfur/ or Fluorides/ or Chromium/ or Cobalt/ or Copper/ or Iodine/ or Iron/ or Manganese/ or Molybdenum/ or Nutrients/ or Zinc/ or Trace elements/ (460000)
13 (magnesium or chloride* or sulfate* or sulphate* or fluoride* or zinc or copper or selen* or manganese or molybdenum or chromium or cobalt or iodi#e or trace element* or trace metal* or micronutrient*).tw. (434877)
14 Vitamin supplements/ or exp Vitamins/ (149456)
15 exp Carotenoids/ (47975)
16 (vitamin*or ascorb*or thiamin* or riboflavin* or pyridox*or niacin*or fola* or folic or biotin or cobalamin* or retino* or caroten* or tocopher* or dihydrotachysterol or calcitriol or cholecalciferol or alfacalcidol or alphacalcidol).tw. (102792)
17 or/6‐16 (2285965)
18 5 and 17 (683)
19 Randomized controlled trials/ (13766)
20 (random* or RCT or placebo or allocat* or crossover* or 'cross over' or trial or (doubl* adj1 blind*) or (singl* adj1 blind*)).ti,ab. (428246)
21 19 or 20 (428824)
22 18 and 21 (176)
23 5 and 21 (234)
CINAHL (Ebsco)
S1 (MH "Hip Fractures+") (6,423)
S2 TX ((hip* or femur* or femoral* or trochant* or pertrochant* or intertrochant* or subtrochant* or intracapsular* or extracapsular*) n3 fracture*) (11,703)
S3 S1 OR S2 (11,703)
S4 (MH "Food+") (108,154)
S5 (MH "Nutrition+") (103,313)
S6 (MH "Nutritional Support+") (25,077)
S7 (MH "Nutritional Assessment") (11,360)
S8 (MH "Nutrition Disorders+") (84,425)
S9 (MH "Diet Therapy+") (20,493)
S10 (MH "Dietetics") (1,684)
S11 (MH "Dietitians") (3,655)
S12 (MH "Nutrition Services+") (2,223)
S13 TX (food* or feed* or fed or diet* or nutri* or supplement*) (460,521)
S14 (MH "Calcium, Dietary") OR (MH "Iron") OR (MH "Phosphorus") OR (MH "Potassium") OR (MH "Sodium, Dietary+") OR (MH "Magnesium") OR (MH "Sulfur") OR (MH "Fluorides") (19,289)
S15 (MH "Trace Elements+") (14,475)
S16 TX (magnesium or chloride* or sulfate* or sulphate* or fluoride* or zinc or copper or selen* or manganese or molybdenum or chromium or cobalt or iodine or iodide or trace element* or trace metal* or micronutrient*) (38,568)
S17 (MH "Vitamins+") (35,678)
S18 (MH "Carotenoids+") (6,752)
S19 TX (vitamin*or ascorb*or thiamin* or riboflavin* or pyridox*or niacin*or fola* or folic or biotin or cobalamin* or retino* or caroten* or tocopher* or dihydrotachysterol or calcitriol or cholecalciferol or alfacalcidol or alphacalcidol) (21,526)
S20 S4 OR S5 OR S6 OR S7 OR S8 OR S9 OR S10 OR S11 OR S12 OR S13 OR S14 OR S15 OR S16 OR S17 OR S18 OR S19 (565,320)
S21 S3 AND S20 (1,603)
S22 (MH "Clinical Trials+") (194,386)
S23 (MH "Evaluation Research+") (21,724)
S24 (MH "Comparative Studies") (82,272)
S25 (MH "Crossover Design") (13,423)˜
S26 PT Clinical Trial (78,919)
S27 (MH "Random Assignment") (40,165)
S28 S22 or S23 or S24 or S25 or S26 or S27 (304,749)
S29 TX ((clinical or controlled or comparative or placebo or prospective or randomi?ed) and (trial or study)) (811,835)
S30 TX (random* and (allocat* or allot* or assign* or basis* or divid* or order*)) (76,678)
S31 TX ((singl* or doubl* or trebl* or tripl*) and (blind* or mask*)) (821,470)
S32 TX ( crossover* or 'cross over' ) or TX cross n1 over (17,186)
S33 TX ((allocat* or allot* or assign* or divid*) and (condition* or experiment* or intervention* or treatment* or therap* or control* or group*)) (100,866)
S34 S29 or S30 or S31 or S32 or S33 (1,495,149)
S35 S28 or S34 (1,505,395)
S36 S21 AND S35 (869)
S37 EM 2008 OR EM 2009 OR EM 2010 OR EM 2011 OR EM 2012 OR EM 2013 OR EM 2014 OR EM 2015 (2,879,808)
S38 S36 AND S37 (548)
Trial register search strategies
Current Controlled Trials, the WHO International Clinical Trials Registry Platform and the UK clinical research network study portfolio were searched using the following terms:
1 Fracture
2 Hip or femur or femoral
3 Nutrition
4 1 and 2 and 3
Appendix 2. Previous search methods for identification of studies (Avenell 2008)
Electronic searches
We searched the Cochrane Bone, Joint and Muscle Trauma Group Specialised Register (September 2008), the Cochrane Central Register of Controlled Trials (The Cochrane Library 2008, Issue 3), MEDLINE (1966 to July 2008), Nutrition Abstracts and Reviews (1984 to July 2008), EMBASE (1980 to week 32 2008), BIOSIS (1985 to 14 August 2008), CINAHL (1982 to August week 2 2008), and HEALTHSTAR (1975 to March 2002).
In MEDLINE (Ovid) the first two phases of the standard Cochrane search strategy (Higgins 2006) were combined with subject‐specific terms. This strategy was modified for use in other databases. No language restrictions were applied.
We also searched Current Controlled Trials (14 August 2008), WHO International Clinical Trials Registry Platform (6 October 2009) and the National Research Register (NRR) Archive (to September 2007) to identify ongoing trials.
Searching other resources
We handsearched Nutrition Abstracts and Reviews (publication database) from 1960 to 1983; Clinical Nutrition: Clinical nutrition: official journal of the European Society of Parenteral and Enteral Nutrition vol 1 to vol 27 (3) 2008; American Journal of Clinical Nutrition vol 2 to vol 88 (2) 2008; Journal of Parenteral and Enteral Nutrition vol 1 to vol 32 (2) 2008; and Proceedings of the Nutrition Society vol 1 to vol 67(3) 2008. We also checked reference lists of articles, searched books related to orthopaedics, geriatric medicine and nutrition, and corresponded with colleagues and investigators.
Appendix 3. Previous results of the search (Avenell 2008)
Overall, of the 66 studies identified via the search strategy: 24 are included, 36 are excluded, four are ongoing and two are awaiting assessment.
Only 13 included trials were identified via the MEDLINE search strategy. One further trial (Stableforth 1986), located via EMBASE, was indexed by MEDLINE, but was not retrieved by the first two phases of the optimum Cochrane search strategy for randomised controlled trials (Dickersin 1994; Higgins 2006). BIOSIS yielded two further studies (Bean 1994; Brown 1992b). Gallagher 1992 was initially found from handsearching the Journal of Parenteral and Enteral Nutrition, but also appeared in the reference list of another published trial. Bean 1994 and Gallagher 1992 were only available as abstracts from conference proceedings. The two presently unpublished trials (Hankins 1996; Madigan 1994) and two previously unpublished trials (Duncan 2006; Espaulella 2000) were provided by personal contacts (Ian Cameron, Heidi Guyer, Donna Duncan and Antony Johansen). Bruce 2003, Houwing 2003 and Tidermark 2004 were initially identified by handsearching Clinical Nutrition and Neumann 2004 by searching Nutrition. A separate examination of the search strategy and findings prior to 2001 is available (Avenell 2001a). All 24 included trials were published in English.
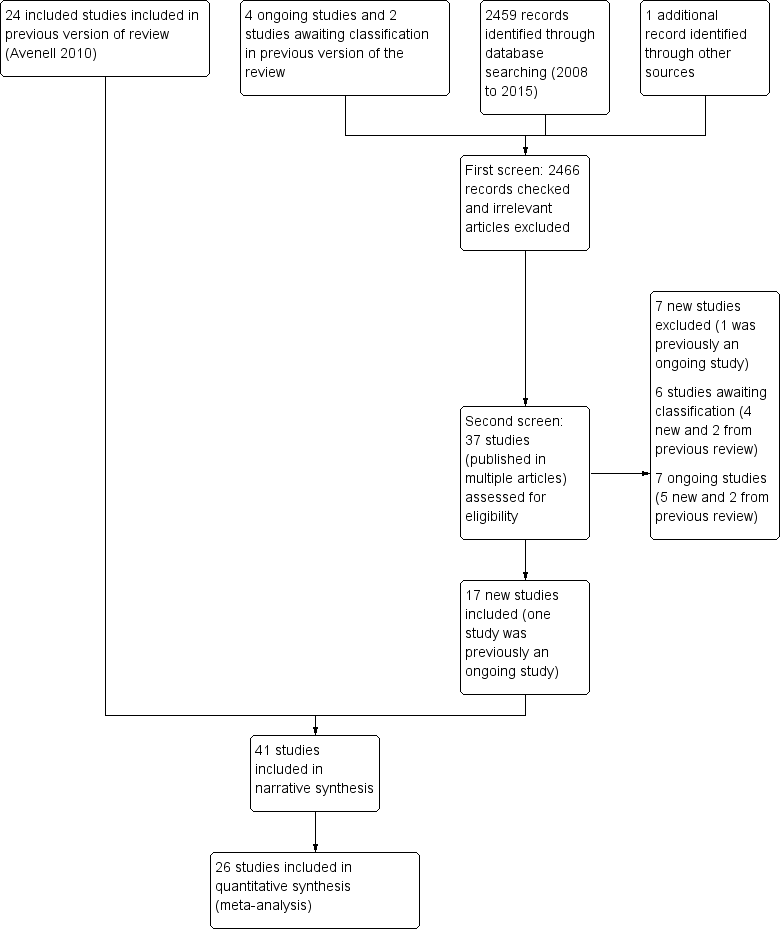
Study flow diagram
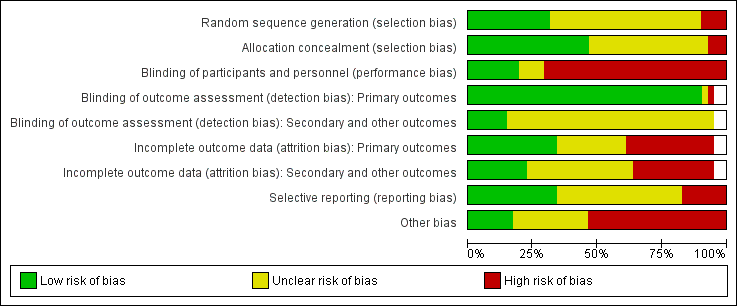
Risk of bias graph: review authors' judgements about each risk of bias item presented as percentages across all included studies
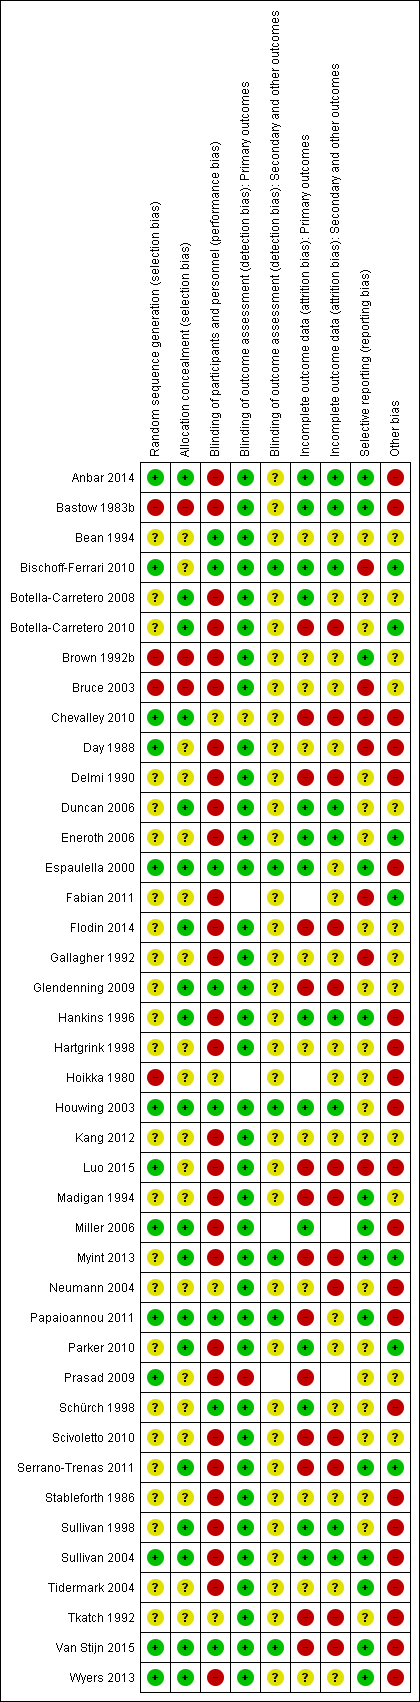
Risk of bias summary: review authors' judgements about each risk of bias item for each included study

Forest plot of comparison: 1 Multinutrient supplements (oral, nasogastric, intravenous) versus control, outcome: 1.1 Mortality by end of study
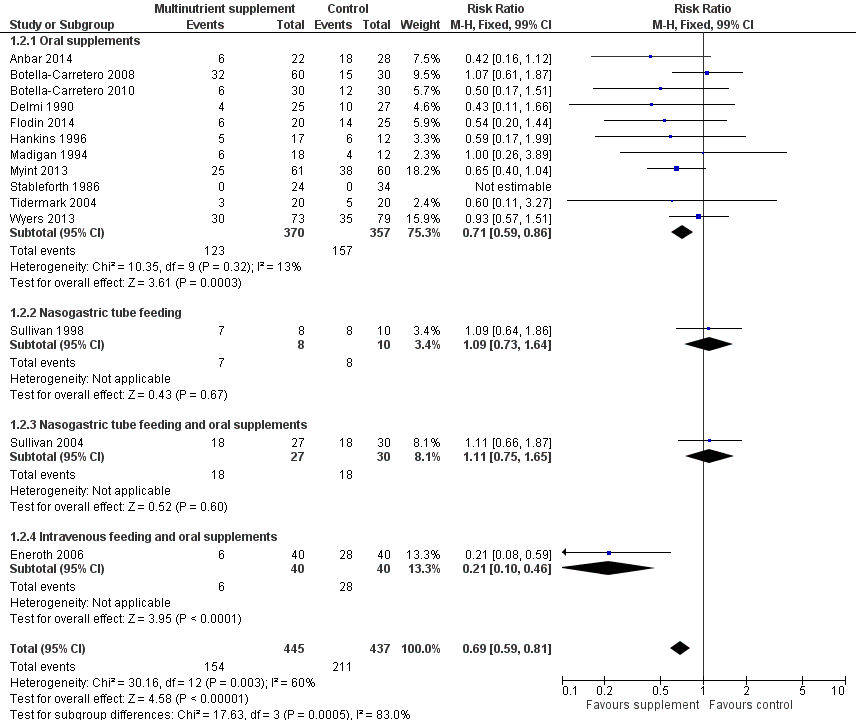
Forest plot of comparison: 1 Multinutrient supplements (oral, nasogastric, intravenous) versus control, outcome: 1.2 Participants with complications at end of study

Funnel plot of comparison: 1 Multinutrient supplements (oral, nasogastric, intravenous) versus control, outcome: 1.1 Mortality by end of study

Funnel plot of comparison: 1 Multinutrient supplements (oral, nasogastric, intravenous) versus control, outcome: 1.2 Participants with complications at end of study

Comparison 1 Multinutrient supplements (oral, nasogastric, intravenous) versus control, Outcome 1 Mortality by end of study.

Comparison 1 Multinutrient supplements (oral, nasogastric, intravenous) versus control, Outcome 2 Participants with complications at end of study.

Comparison 1 Multinutrient supplements (oral, nasogastric, intravenous) versus control, Outcome 3 Participants with complications at end of study: random‐effects model.

Comparison 1 Multinutrient supplements (oral, nasogastric, intravenous) versus control, Outcome 4 Unfavourable outcome (death or complications) at end of study.

Comparison 1 Multinutrient supplements (oral, nasogastric, intravenous) versus control, Outcome 5 Unfavourable outcome (death or complications) ‐ oral supplements extra analyses.

Comparison 1 Multinutrient supplements (oral, nasogastric, intravenous) versus control, Outcome 6 Adverse effects (putatively related to treatment).

Comparison 2 Multinutrient supplements (oral, nasogastric routes, intravenous) versus control (split by nutritional status), Outcome 1 Mortality by end of study.

Comparison 2 Multinutrient supplements (oral, nasogastric routes, intravenous) versus control (split by nutritional status), Outcome 2 Mortality by end of study ‐ oral supplements only.

Comparison 2 Multinutrient supplements (oral, nasogastric routes, intravenous) versus control (split by nutritional status), Outcome 3 Participants with complications at end of study.

Comparison 2 Multinutrient supplements (oral, nasogastric routes, intravenous) versus control (split by nutritional status), Outcome 4 Unfavourable outcome (death or complications) at end of study.
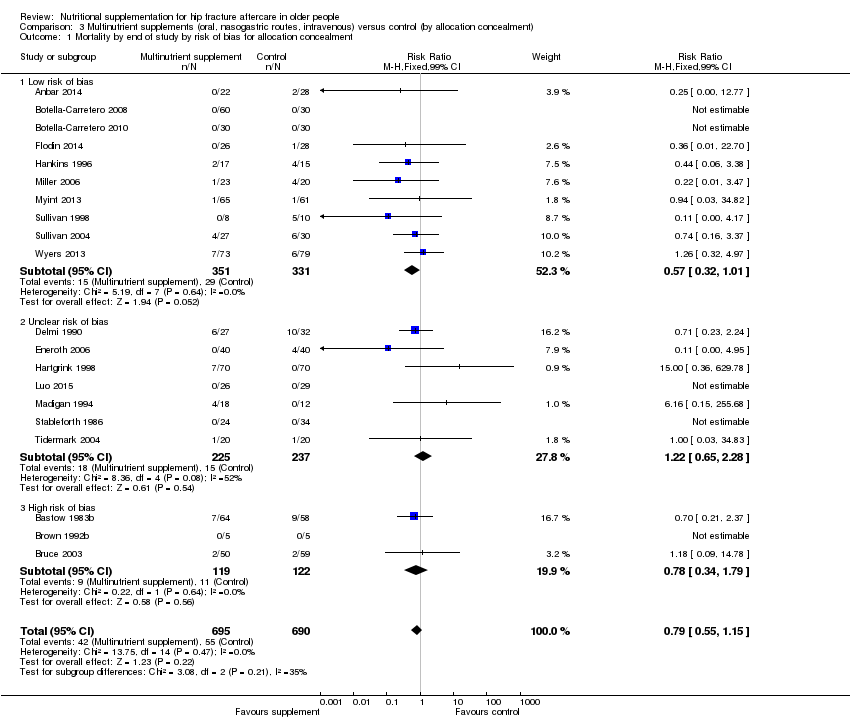
Comparison 3 Multinutrient supplements (oral, nasogastric routes, intravenous) versus control (by allocation concealment), Outcome 1 Mortality by end of study by risk of bias for allocation concealment.

Comparison 3 Multinutrient supplements (oral, nasogastric routes, intravenous) versus control (by allocation concealment), Outcome 2 Participants with complications at end of study by risk of bias for allocation concealment.

Comparison 4 High protein‐containing supplements versus low protein‐ or non‐protein‐containing supplements, Outcome 1 Mortality by end of study.

Comparison 4 High protein‐containing supplements versus low protein‐ or non‐protein‐containing supplements, Outcome 2 Unfavourable outcome (death or complications) at end of study.
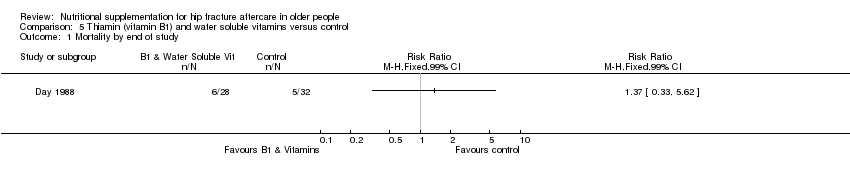
Comparison 5 Thiamin (vitamin B1) and water soluble vitamins versus control, Outcome 1 Mortality by end of study.

Comparison 5 Thiamin (vitamin B1) and water soluble vitamins versus control, Outcome 2 Participants with complications at end of study.

Comparison 6 Vitamin D versus control or lower dose supplementation, Outcome 1 Participants with complications at end of study.
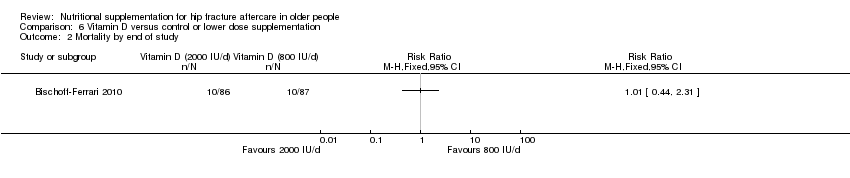
Comparison 6 Vitamin D versus control or lower dose supplementation, Outcome 2 Mortality by end of study.
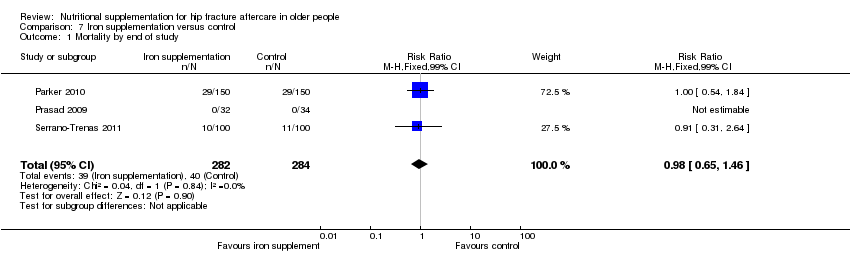
Comparison 7 Iron supplementation versus control, Outcome 1 Mortality by end of study.
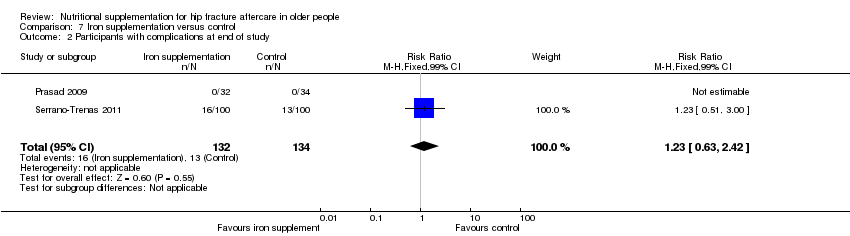
Comparison 7 Iron supplementation versus control, Outcome 2 Participants with complications at end of study.

Comparison 8 Taurine versus placebo, Outcome 1 Mortality by end of study.

Comparison 9 Dietetic assistants versus usual care, Outcome 1 Mortality by end of study.

Comparison 9 Dietetic assistants versus usual care, Outcome 2 Participants with complications at end of study.
| Multinutrient supplements (oral) versus control for hip fracture aftercare in older people | ||||||
| Patient or population: Older people undergoing hip fracture aftercare Comparison: Standard postoperative nutritional support and care in control groups | ||||||
| Outcomes | Illustrative comparative risks* (95% CI) | Relative effect | No of Participants | Quality of the evidence | Comments | |
| Assumed risk | Corresponding risk | |||||
| Control | Multinutrient supplements (oral) versus control | |||||
| Mortality by end of study Follow‐up: 1‐12 months | Study population | RR 0.81 | 968 | ⊕⊕⊝⊝ | The statistical test for subgroup differences between the results for the 5 trials targeting malnourished participants and those 10 trials not targeting malnourished participants did not confirm a difference between the two subgroups for mortality | |
| 72 per 10001 | 59 per 1000 | |||||
| High risk2 | ||||||
| 250 per 1000 | 203 per 1000 | |||||
| Participants with complications (e.g. pressure sore, chest infection) at end of study | Study population | RR 0.71 | 727 | ⊕⊕⊝⊝ | Only 2 trials targeting malnourished people reported these data | |
| 443 per 10004 | 315 per 1000 | |||||
| Moderate risk5 | ||||||
| 290 per 1000 | 206 per 1000 | |||||
| Unfavourable outcome 7 by end of study Follow‐up: 1‐12 months | Study population | RR 0.67 (0.51 to 0.89) | 334 (6 studies) | ⊕⊝⊝⊝ | Only 1 trial targeting malnourished people reported these data | |
| 500 per 10004 | 335 per 1000 (255 to 445) | |||||
| Putative side effects of treatment (e.g. vomiting and diarrhoea) Follow‐up: during supplementation period | Study population | RR 0.99 (0.47 to 2.05) | 442 (6 studies) | ⊕⊝⊝⊝ | Three of the 6 trials reported no adverse effects | |
| 50 per 10004 | 50 per 1000 (24 to 103) | |||||
| *The basis for the assumed risk (e.g. the median control group risk across studies) is provided in footnotes. The corresponding risk (and its 95% confidence interval) is based on the assumed risk in the comparison group and the relative effect of the intervention (and its 95% CI). | ||||||
| GRADE Working Group grades of evidence | ||||||
| 1. The control group risk is the median control group risk across the 9 studies that reported one or more deaths in the control group. | ||||||
| Multinutrient supplements (nasogastric) versus control for hip fracture aftercare in older people7 | ||||||
| Patient or population: Older people undergoing hip fracture aftercare Comparison: Standard postoperative nutritional support and care in control groups | ||||||
| Outcomes | Illustrative comparative risks* (95% CI) | Relative effect | No of Participants | Quality of the evidence | Comments | |
| Assumed risk | Corresponding risk | |||||
| Control | Multinutrient supplements (nasogastric) versus control | |||||
| Mortality by end of study | Study Population | RR: 0.99 (0.50 to 1.97) | 280 (3 studies) | ⊕⊝⊝⊝ | Only 1 trial targeting malnourished participants reported these data | |
| 156 per 10002 | 155 per 1000 (78 to 308) | |||||
| Participants with complications (e.g. pressure sore, aspiration pneumonia) at end of study | Study Population | RR: 1.09 (0.73 to 1.64) | 18 (1 study) | ⊕⊝⊝⊝ | For consistency we have presented 95% CI here but have used 99% CI for single trial data in the main text: 99% CI 0.64 to 1.86.6 | |
| 800 per 10004 | 872 per 1000 (584 to 1000) | |||||
| Unfavourable outcome Follow‐up: 1‐12 months | See comment | See comment | Outcome not reported | |||
| Putative side effects of treatment (e.g. aspiration pneumonia) Follow‐up: during supplementation period | See comment | See comment | Insufficient data to draw any conclusions. However, poor toleration of tube feeding was noted.1 There was no report of aspiration pneumonia (1 study; 140 participants). One study reported 18 (28% of 64) participants in the intervention group developed diarrhoea ‐ this was ascribed to antibiotics in 16 ‐ but did not report on the control group. One study (18 participants) reported 3 cases of "bloating" in the intervention group; it found no feed‐induced diarrhoea | |||
| *The basis for the assumed risk (e.g. the median control group risk across studies) is provided in footnotes. The corresponding risk (and its 95% confidence interval) is based on the assumed risk in the comparison group and the relative effect of the intervention (and its 95% CI). | ||||||
| GRADE Working Group grades of evidence the estimate. | ||||||
| 1. Nasogatric feeding was poorly tolerated but varied between studies. One study reported only 26% of the intervention group tolerated tube feeding for the full two weeks; another reported 78% completed the course (until hospital discharge). | ||||||
| Study ID | Intervention | Control | Mean difference (99% confidence intervaI) | ||||
| Multinutritional oral supplements | |||||||
| 22 | 10.1 | 3.2 | 28 | 12.5 | 5.5 | ‐2.40 days (‐5.60 to 0.80) | |
| 30 | 13.3 | 4.3 | 30 | 12.8 | 4.0 | 0.50 days (‐2.26 to 3.26) | |
| 5 | 27.00 | 10.00 | 5 | 48.00 | 37.00 | ‐21.00 days (‐65.15 to 23.15) | |
| 50 | 17.70 | 9.40 | 58 | 16.60 | 9.20 | 1.10 days (‐3.53 to 5.73) | |
| 18 | 16.00 | 8.00 | 12 | 15.00 | 11.00 | 1.00 day (‐8.51 to 10.51) | |
| 61 | 26.2 | 8.2 | 60 | 29.9 | 11.2 | ‐3.70 days (‐8.30 to 0.90) | |
| Nasogastric tube feeding | |||||||
| 8 | 38.20 | 36.90 | 7 | 23.70 | 20.00 | 14.50 days (‐24.34 to 53.34) | |
| High protein supplements | |||||||
| 85 | 16.40 | 6.60 | 86 | 17.20 | 7.70 | ‐0.80 days (‐3.62 to 2.02) | |
| 18 | 23.20 | 5.52 | 20 | 28.00 | 11.63 | ‐4.80 days (‐12.29 to 2.69) | |
| Iron supplementation versus control | |||||||
| 150 | 18.8 | 17.4 | 150 | 21.3 | 20.6 | ‐2.50 days (‐8.17 to 3.17) | |
| 99 | 13.5 | 7.1 | 97 | 13.1 | 6.9 | 0.40 days (‐2.18 to 2.98) | |
| Vitamin B1 | |||||||
| 28 | 35.00 | 34.00 | 30 | 29.00 | 30.00 | 6.00 days (‐15.75 to 27.75) | |
| Vitamin, mineral and amino acid supplementation versus control | |||||||
| 49 | 15.4 | 6.8 | 47 | 17.9 | 7.3 | ‐2.50 days (‐6.21 to 1.21) | |
| Semi‐essential amino acid | |||||||
| 111 | 13 | 10 | 123 | 13 | 11 | 0.00 days (‐3.54 to 3.54) | |
| SD: standard deviation | |||||||
| Outcome or subgroup title | No. of studies | No. of participants | Statistical method | Effect size |
| 1 Mortality by end of study Show forest plot | 20 | 1385 | Risk Ratio (M‐H, Fixed, 99% CI) | 0.79 [0.55, 1.15] |
| 1.1 Oral supplements | 15 | 968 | Risk Ratio (M‐H, Fixed, 99% CI) | 0.81 [0.49, 1.32] |
| 1.2 Nasogastric tube feeding | 3 | 280 | Risk Ratio (M‐H, Fixed, 99% CI) | 0.99 [0.50, 1.97] |
| 1.3 Nasogastric tube feeding and oral supplements | 1 | 57 | Risk Ratio (M‐H, Fixed, 99% CI) | 0.74 [0.23, 2.35] |
| 1.4 Intravenous feeding and oral supplements | 1 | 80 | Risk Ratio (M‐H, Fixed, 99% CI) | 0.11 [0.01, 2.00] |
| 2 Participants with complications at end of study Show forest plot | 14 | 882 | Risk Ratio (M‐H, Fixed, 99% CI) | 0.69 [0.59, 0.81] |
| 2.1 Oral supplements | 11 | 727 | Risk Ratio (M‐H, Fixed, 99% CI) | 0.71 [0.59, 0.86] |
| 2.2 Nasogastric tube feeding | 1 | 18 | Risk Ratio (M‐H, Fixed, 99% CI) | 1.09 [0.73, 1.64] |
| 2.3 Nasogastric tube feeding and oral supplements | 1 | 57 | Risk Ratio (M‐H, Fixed, 99% CI) | 1.11 [0.75, 1.65] |
| 2.4 Intravenous feeding and oral supplements | 1 | 80 | Risk Ratio (M‐H, Fixed, 99% CI) | 0.21 [0.10, 0.46] |
| 3 Participants with complications at end of study: random‐effects model Show forest plot | 14 | 882 | Risk Ratio (M‐H, Random, 99% CI) | 0.70 [0.53, 0.91] |
| 3.1 Oral supplements | 11 | 727 | Risk Ratio (M‐H, Random, 99% CI) | 0.72 [0.58, 0.89] |
| 3.2 Nasogastric tube feeding | 1 | 18 | Risk Ratio (M‐H, Random, 99% CI) | 1.09 [0.73, 1.64] |
| 3.3 Nasogastric tube feeding and oral supplements | 1 | 57 | Risk Ratio (M‐H, Random, 99% CI) | 1.11 [0.75, 1.65] |
| 3.4 Intravenous feeding and oral supplements | 1 | 80 | Risk Ratio (M‐H, Random, 99% CI) | 0.21 [0.10, 0.46] |
| 4 Unfavourable outcome (death or complications) at end of study Show forest plot | 6 | 334 | Risk Ratio (M‐H, Fixed, 99% CI) | 0.67 [0.51, 0.89] |
| 4.1 Oral supplements | 6 | 334 | Risk Ratio (M‐H, Fixed, 99% CI) | 0.67 [0.51, 0.89] |
| 4.2 Nasogastric tube feeding | 0 | 0 | Risk Ratio (M‐H, Fixed, 99% CI) | 0.0 [0.0, 0.0] |
| 4.3 Nasogastric tube feeding and oral supplements | 0 | 0 | Risk Ratio (M‐H, Fixed, 99% CI) | 0.0 [0.0, 0.0] |
| 4.4 Intravenous feeding and oral supplements | 0 | 0 | Risk Ratio (M‐H, Fixed, 99% CI) | 0.0 [0.0, 0.0] |
| 5 Unfavourable outcome (death or complications) ‐ oral supplements extra analyses Show forest plot | 6 | Risk Ratio (M‐H, Fixed, 99% CI) | Subtotals only | |
| 5.1 Oral supplements: worst case scenario | 6 | 353 | Risk Ratio (M‐H, Fixed, 99% CI) | 0.81 [0.62, 1.04] |
| 5.2 Oral supplements: Hankins 1996 acute hospital data | 1 | 31 | Risk Ratio (M‐H, Fixed, 99% CI) | 0.96 [0.71, 1.31] |
| 5.3 Oral supplements: Hankins 1996 post discharge | 1 | 31 | Risk Ratio (M‐H, Fixed, 99% CI) | 1.10 [0.50, 2.41] |
| 6 Adverse effects (putatively related to treatment) Show forest plot | 8 | Risk Ratio (M‐H, Fixed, 99% CI) | Subtotals only | |
| 6.1 Oral supplements (mainly diarrhoea or/and vomiting) | 6 | 442 | Risk Ratio (M‐H, Fixed, 99% CI) | 0.99 [0.47, 2.05] |
| 6.2 Nasogatric tube feeding | 1 | 18 | Risk Ratio (M‐H, Fixed, 99% CI) | 8.56 [0.51, 144.86] |
| 6.3 Intravenous feeding and oral supplements | 1 | 57 | Risk Ratio (M‐H, Fixed, 99% CI) | 1.85 [0.49, 7.03] |
| 6.4 Nasogastric tube feeding and oral supplements | 0 | 0 | Risk Ratio (M‐H, Fixed, 99% CI) | 0.0 [0.0, 0.0] |
| Outcome or subgroup title | No. of studies | No. of participants | Statistical method | Effect size |
| 1 Mortality by end of study Show forest plot | 20 | 1385 | Risk Ratio (M‐H, Fixed, 99% CI) | 0.79 [0.55, 1.15] |
| 1.1 Malnourished targeted | 6 | 388 | Risk Ratio (M‐H, Fixed, 99% CI) | 0.55 [0.27, 1.11] |
| 1.2 Malnourished not targeted | 14 | 997 | Risk Ratio (M‐H, Fixed, 99% CI) | 0.92 [0.59, 1.42] |
| 2 Mortality by end of study ‐ oral supplements only Show forest plot | 15 | 968 | Risk Ratio (M‐H, Fixed, 99% CI) | 0.81 [0.49, 1.32] |
| 2.1 Malnourished targeted | 5 | 266 | Risk Ratio (M‐H, Fixed, 99% CI) | 0.39 [0.13, 1.20] |
| 2.2 Malnourished not targeted | 10 | 702 | Risk Ratio (M‐H, Fixed, 99% CI) | 0.99 [0.56, 1.72] |
| 3 Participants with complications at end of study Show forest plot | 14 | 882 | Risk Ratio (M‐H, Fixed, 99% CI) | 0.69 [0.59, 0.81] |
| 3.1 Malnourished targeted | 2 | 150 | Risk Ratio (M‐H, Fixed, 99% CI) | 0.64 [0.46, 0.89] |
| 3.2 Malnourished not targeted | 12 | 732 | Risk Ratio (M‐H, Fixed, 99% CI) | 0.70 [0.59, 0.84] |
| 4 Unfavourable outcome (death or complications) at end of study Show forest plot | 6 | 334 | Risk Ratio (M‐H, Fixed, 99% CI) | 0.67 [0.51, 0.89] |
| 4.1 Malnourished targeted | 1 | 29 | Risk Ratio (M‐H, Fixed, 99% CI) | 0.47 [0.17, 1.31] |
| 4.2 Malnourished not targeted | 5 | 305 | Risk Ratio (M‐H, Fixed, 99% CI) | 0.70 [0.52, 0.93] |
| Outcome or subgroup title | No. of studies | No. of participants | Statistical method | Effect size |
| 1 Mortality by end of study by risk of bias for allocation concealment Show forest plot | 20 | 1385 | Risk Ratio (M‐H, Fixed, 99% CI) | 0.79 [0.55, 1.15] |
| 1.1 Low risk of bias | 10 | 682 | Risk Ratio (M‐H, Fixed, 99% CI) | 0.57 [0.32, 1.01] |
| 1.2 Unclear risk of bias | 7 | 462 | Risk Ratio (M‐H, Fixed, 99% CI) | 1.22 [0.65, 2.28] |
| 1.3 High risk of bias | 3 | 241 | Risk Ratio (M‐H, Fixed, 99% CI) | 0.78 [0.34, 1.79] |
| 2 Participants with complications at end of study by risk of bias for allocation concealment Show forest plot | 14 | 882 | Risk Ratio (M‐H, Fixed, 99% CI) | 0.69 [0.59, 0.81] |
| 2.1 Low risk of bias | 9 | 622 | Risk Ratio (M‐H, Fixed, 99% CI) | 0.78 [0.66, 0.92] |
| 2.2 Unclear risk of bias | 5 | 260 | Risk Ratio (M‐H, Fixed, 99% CI) | 0.38 [0.24, 0.61] |
| 2.3 High risk of bias | 0 | 0 | Risk Ratio (M‐H, Fixed, 99% CI) | 0.0 [0.0, 0.0] |
| Outcome or subgroup title | No. of studies | No. of participants | Statistical method | Effect size |
| 1 Mortality by end of study Show forest plot | 4 | 361 | Risk Ratio (M‐H, Fixed, 99% CI) | 1.42 [0.85, 2.37] |
| 1.1 Protein‐containing supplement v non‐protein‐containing supplement | 3 | 315 | Risk Ratio (M‐H, Fixed, 99% CI) | 1.38 [0.82, 2.34] |
| 1.2 High protein‐containing supplement v low protein‐containing supplement | 1 | 46 | Risk Ratio (M‐H, Fixed, 99% CI) | 2.18 [0.21, 22.42] |
| 2 Unfavourable outcome (death or complications) at end of study Show forest plot | 2 | 223 | Risk Ratio (M‐H, Fixed, 99% CI) | 0.78 [0.65, 0.95] |
| 2.1 Protein‐containing supplement v non‐protein‐containing supplement | 2 | 223 | Risk Ratio (M‐H, Fixed, 99% CI) | 0.78 [0.65, 0.95] |
| Outcome or subgroup title | No. of studies | No. of participants | Statistical method | Effect size |
| 1 Mortality by end of study Show forest plot | 1 | Risk Ratio (M‐H, Fixed, 99% CI) | Totals not selected | |
| 2 Participants with complications at end of study Show forest plot | 1 | Risk Ratio (M‐H, Fixed, 99% CI) | Totals not selected | |
| Outcome or subgroup title | No. of studies | No. of participants | Statistical method | Effect size |
| 1 Participants with complications at end of study Show forest plot | 1 | Risk Ratio (M‐H, Fixed, 99% CI) | Totals not selected | |
| 2 Mortality by end of study Show forest plot | 1 | Risk Ratio (M‐H, Fixed, 95% CI) | Totals not selected | |
| Outcome or subgroup title | No. of studies | No. of participants | Statistical method | Effect size |
| 1 Mortality by end of study Show forest plot | 3 | 566 | Risk Ratio (M‐H, Fixed, 99% CI) | 0.98 [0.65, 1.46] |
| 2 Participants with complications at end of study Show forest plot | 2 | 266 | Risk Ratio (M‐H, Fixed, 99% CI) | 1.23 [0.63, 2.42] |
| Outcome or subgroup title | No. of studies | No. of participants | Statistical method | Effect size |
| 1 Mortality by end of study Show forest plot | 1 | Risk Ratio (M‐H, Fixed, 99% CI) | Totals not selected | |
| Outcome or subgroup title | No. of studies | No. of participants | Statistical method | Effect size |
| 1 Mortality by end of study Show forest plot | 1 | Risk Ratio (M‐H, Fixed, 99% CI) | Totals not selected | |
| 2 Participants with complications at end of study Show forest plot | 1 | Risk Ratio (M‐H, Fixed, 99% CI) | Totals not selected | |