Nutritional supplementation for hip fracture aftercare in older people
Abstract
Background
Older people with hip fractures are often malnourished at the time of fracture, and subsequently have poor food intake. This is an update of a Cochrane review first published in 2000, and previously updated in 2010.
Objectives
To review the effects (benefits and harms) of nutritional interventions in older people recovering from hip fracture.
Search methods
We searched the Cochrane Bone, Joint and Muscle Trauma Group Specialised Register, CENTRAL, MEDLINE, MEDLINE In‐Process & Other Non‐Indexed Citations, Embase, CAB Abstracts, CINAHL, trial registers and reference lists. The search was last run in November 2015.
Selection criteria
Randomised and quasi‐randomised controlled trials of nutritional interventions for people aged over 65 years with hip fracture where the interventions were started within the first month after hip fracture.
Data collection and analysis
Two review authors independently selected trials, extracted data and assessed risk of bias. Where possible, we pooled data for primary outcomes which were: all cause mortality; morbidity; postoperative complications (e.g. wound infections, pressure sores, deep venous thromboses, respiratory and urinary infections, cardiovascular events); and 'unfavourable outcome' defined as the number of trial participants who died plus the number of survivors with complications. We also pooled data for adverse events such as diarrhoea.
Main results
We included 41 trials involving 3881 participants. Outcome data were limited and risk of bias assessment showed that trials were often methodologically flawed, with less than half of trials at low risk of bias for allocation concealment, incomplete outcome data, or selective reporting of outcomes. The available evidence was judged of either low or very low quality indicating that we were uncertain or very uncertain about the estimates.
Eighteen trials evaluated oral multinutrient feeds that provided non‐protein energy, protein, vitamins and minerals. There was low‐quality evidence that oral feeds had little effect on mortality (24/486 versus 31/481; risk ratio (RR) 0.81 favouring supplementation, 95% confidence interval (CI) 0.49 to 1.32; 15 trials). Thirteen trials evaluated the effect of oral multinutrient feeds on complications (e.g. pressure sore, infection, venous thrombosis, pulmonary embolism, confusion). There was low‐quality evidence that the number of participants with complications may be reduced with oral multinutrient feeds (123/370 versus 157/367; RR 0.71, 95% CI 0.59 to 0.86; 11 trials). Based on very low‐quality evidence from six studies (334 participants), oral supplements may result in lower numbers with 'unfavourable outcome' (death or complications): RR 0.67, 95% CI 0.51 to 0.89. There was very low‐quality evidence for six studies (442 participants) that oral supplementation did not result in an increased incidence of vomiting and diarrhoea (RR 0.99, 95% CI 0.47 to 2.05).
Only very low‐quality evidence was available from the four trials examining nasogastric multinutrient feeding. Pooled data from three heterogeneous trials showed no evidence of an effect of supplementation on mortality (14/142 versus 14/138; RR 0.99, 95% CI 0.50 to 1.97). One trial (18 participants) found no difference in complications. None reported on unfavourable outcome. Nasogastric feeding was poorly tolerated. One study reported no cases of aspiration pneumonia.
There is very low‐quality evidence from one trial (57 participants, mainly men) of no evidence for an effect of tube feeding followed by oral supplementation on mortality or complications. Tube feeding, however, was poorly tolerated.
There is very low‐quality evidence from one trial (80 participants) that a combination of intravenous feeding and oral supplements may not affect mortality but could reduce complications. However, this expensive intervention is usually reserved for people with non‐functioning gastrointestinal tracts, which is unlikely in this trial.
Four trials tested increasing protein intake in an oral feed. These provided low‐quality evidence for no clear effect of increased protein intake on mortality (30/181 versus 21/180; RR 1.42, 95% CI 0.85 to 2.37; 4 trials) or number of participants with complications but very low‐quality and contradictory evidence of a reduction in unfavourable outcomes (66/113 versus 82/110; RR 0.78, 95% CI 0.65 to 0.95; 2 trials). There was no evidence of an effect on adverse events such as diarrhoea.
Trials testing intravenous vitamin B1 and other water soluble vitamins, oral 1‐alpha‐hydroxycholecalciferol (vitamin D), high dose bolus vitamin D, different oral doses or sources of vitamin D, intravenous or oral iron, ornithine alpha‐ketoglutarate versus an isonitrogenous peptide supplement, taurine versus placebo, and a supplement with vitamins, minerals and amino acids, provided low‐ or very low‐quality evidence of no clear effect on mortality or complications, where reported.
Based on low‐quality evidence, one trial evaluating the use of dietetic assistants to help with feeding indicated that this intervention may reduce mortality (19/145 versus 36/157; RR 0.57, 95% CI 0.34 to 0.95) but not the number of participants with complications (79/130 versus 84/125).
Authors' conclusions
There is low‐quality evidence that oral multinutrient supplements started before or soon after surgery may prevent complications within the first 12 months after hip fracture, but that they have no clear effect on mortality. There is very low‐quality evidence that oral supplements may reduce 'unfavourable outcome' (death or complications) and that they do not result in an increased incidence of vomiting and diarrhoea. Adequately sized randomised trials with robust methodology are required. In particular, the role of dietetic assistants, and peripheral venous feeding or nasogastric feeding in very malnourished people require further evaluation.
PICO
Plain language summary
Nutritional supplementation for older people after hip fracture
Background and aim
Older people with hip fractures are often malnourished at the time of their fracture and many have poor food intake while in hospital. Malnutrition may hinder recovery after hip fracture. We reviewed the effects of nutritional interventions in older people recovering from hip fracture.
Search results
We searched the scientific literature up to November 2015 and include 41 studies including 3881 participants. All nutritional interventions were started within one month of hip fracture. The studies had flaws in their methods that may affect the validity of their results. Some evidence was very low quality which means we are very unsure of the results.
Key results
Eighteen studies examined the use of additional oral feeds that provided energy from sources other than protein, protein, some vitamins and minerals. There was low‐quality evidence that these multinutrient oral feeds may not reduce mortality but that they may reduce the number of people with complications (e.g. pressure sore, infection, venous thrombosis, pulmonary embolism, confusion). There was very low‐quality evidence that oral multinutrient feeds may reduce unfavourable outcome (death or complications) and that they did not result in increased vomiting and diarrhoea.
Four studies examined nasogastric tube feeding, where liquid food is delivered via a tube inserted into the nose and passed down into the stomach, with non‐protein energy, protein, some vitamins and minerals. These studies provided very low‐quality evidence that tube feeding, which was poorly tolerated, did not seem to make a difference to mortality or complications. Unfavourable outcome was not recorded and there was insufficient evidence on adverse events.
One study provided very low‐quality evidence that nasogastric tube feeding followed by oral feeds may not affect mortality or complications. It reported that tube feeding was poorly tolerated.
One study provided very low‐quality evidence that giving feed into a vein initially and then by mouth may not affect mortality but may reduce complications. However, we were surprised that this intervention was being used in people who seemed to be able to take nutrition orally.
Increasing protein intake in an oral feed was tested in four studies. These provided low‐quality evidence of no clear effect on mortality or complications and very low‐quality evidence for a reduction in unfavourable outcome.
Studies testing intravenous vitamin B1 and other water soluble vitamins, oral 1‐alpha‐hydroxycholecalciferol (vitamin D), high dose bolus vitamin D, different oral doses or sources of vitamin D, intravenous or oral iron, ornithine alpha‐ketoglutarate versus an isonitrogenous peptide supplement, taurine versus placebo, and a supplement with vitamins, minerals and amino acids, provided low‐ or very low‐quality evidence of no clear effect on mortality or complications, where reported.
One study, evaluating the use of dietetic assistants to help with feeding, provided low‐quality evidence that this may reduce mortality but not the numbers of people with complications.
Conclusions
Oral supplements with non‐protein energy, protein, vitamins and minerals started before or soon after surgery may prevent complications after hip fracture in older people but may not affect mortality. Adequately sized randomised studies with better design are required. We suggest that the role of dietetic assistants, and of peripheral venous feeding or nasogastric feeding in very malnourished patients, require further evaluation.
Authors' conclusions
Summary of findings
| Multinutrient supplements (oral) versus control for hip fracture aftercare in older people | ||||||
| Patient or population: Older people undergoing hip fracture aftercare Comparison: Standard postoperative nutritional support and care in control groups | ||||||
| Outcomes | Illustrative comparative risks* (95% CI) | Relative effect | No of Participants | Quality of the evidence | Comments | |
| Assumed risk | Corresponding risk | |||||
| Control | Multinutrient supplements (oral) versus control | |||||
| Mortality by end of study Follow‐up: 1‐12 months | Study population | RR 0.81 | 968 | ⊕⊕⊝⊝ | The statistical test for subgroup differences between the results for the 5 trials targeting malnourished participants and those 10 trials not targeting malnourished participants did not confirm a difference between the two subgroups for mortality | |
| 72 per 10001 | 59 per 1000 | |||||
| High risk2 | ||||||
| 250 per 1000 | 203 per 1000 | |||||
| Participants with complications (e.g. pressure sore, chest infection) at end of study | Study population | RR 0.71 | 727 | ⊕⊕⊝⊝ | Only 2 trials targeting malnourished people reported these data | |
| 443 per 10004 | 315 per 1000 | |||||
| Moderate risk5 | ||||||
| 290 per 1000 | 206 per 1000 | |||||
| Unfavourable outcome 7 by end of study Follow‐up: 1‐12 months | Study population | RR 0.67 (0.51 to 0.89) | 334 (6 studies) | ⊕⊝⊝⊝ | Only 1 trial targeting malnourished people reported these data | |
| 500 per 10004 | 335 per 1000 (255 to 445) | |||||
| Putative side effects of treatment (e.g. vomiting and diarrhoea) Follow‐up: during supplementation period | Study population | RR 0.99 (0.47 to 2.05) | 442 (6 studies) | ⊕⊝⊝⊝ | Three of the 6 trials reported no adverse effects | |
| 50 per 10004 | 50 per 1000 (24 to 103) | |||||
| *The basis for the assumed risk (e.g. the median control group risk across studies) is provided in footnotes. The corresponding risk (and its 95% confidence interval) is based on the assumed risk in the comparison group and the relative effect of the intervention (and its 95% CI). | ||||||
| GRADE Working Group grades of evidence | ||||||
| 1. The control group risk is the median control group risk across the 9 studies that reported one or more deaths in the control group. | ||||||
| Multinutrient supplements (nasogastric) versus control for hip fracture aftercare in older people7 | ||||||
| Patient or population: Older people undergoing hip fracture aftercare Comparison: Standard postoperative nutritional support and care in control groups | ||||||
| Outcomes | Illustrative comparative risks* (95% CI) | Relative effect | No of Participants | Quality of the evidence | Comments | |
| Assumed risk | Corresponding risk | |||||
| Control | Multinutrient supplements (nasogastric) versus control | |||||
| Mortality by end of study | Study Population | RR: 0.99 (0.50 to 1.97) | 280 (3 studies) | ⊕⊝⊝⊝ | Only 1 trial targeting malnourished participants reported these data | |
| 156 per 10002 | 155 per 1000 (78 to 308) | |||||
| Participants with complications (e.g. pressure sore, aspiration pneumonia) at end of study | Study Population | RR: 1.09 (0.73 to 1.64) | 18 (1 study) | ⊕⊝⊝⊝ | For consistency we have presented 95% CI here but have used 99% CI for single trial data in the main text: 99% CI 0.64 to 1.86.6 | |
| 800 per 10004 | 872 per 1000 (584 to 1000) | |||||
| Unfavourable outcome Follow‐up: 1‐12 months | See comment | See comment | Outcome not reported | |||
| Putative side effects of treatment (e.g. aspiration pneumonia) Follow‐up: during supplementation period | See comment | See comment | Insufficient data to draw any conclusions. However, poor toleration of tube feeding was noted.1 There was no report of aspiration pneumonia (1 study; 140 participants). One study reported 18 (28% of 64) participants in the intervention group developed diarrhoea ‐ this was ascribed to antibiotics in 16 ‐ but did not report on the control group. One study (18 participants) reported 3 cases of "bloating" in the intervention group; it found no feed‐induced diarrhoea | |||
| *The basis for the assumed risk (e.g. the median control group risk across studies) is provided in footnotes. The corresponding risk (and its 95% confidence interval) is based on the assumed risk in the comparison group and the relative effect of the intervention (and its 95% CI). | ||||||
| GRADE Working Group grades of evidence the estimate. | ||||||
| 1. Nasogatric feeding was poorly tolerated but varied between studies. One study reported only 26% of the intervention group tolerated tube feeding for the full two weeks; another reported 78% completed the course (until hospital discharge). | ||||||
Background
Description of the condition
Hip (proximal femur) fractures are a common cause of substantial morbidity and mortality in older people living in industrialised societies (Kanis 2012). Nine months after their hip fracture people still have poorer quality of life than age and sex matched controls (Cranney 2005). Many people fail to return to their own homes and previous state of mobility after a hip fracture. In industrialised societies, mortality in the year after hip fracture may be as high as 30% (Bentler 2009; Mariconda 2015), and averages 11% during the first few months after fracture (Lyons 1997). Mortality in the first four months after hip fracture surgery is age dependent. For instance, mortality was reported as 5% in people aged 50 to 69 years, compared with 28% in those people aged 90 years or over in the Scottish Hip Fracture Audit Report (Holt 2008). A meta‐analysis of prospective studies found the relative hazard for mortality during the first three months following hip fracture to be 5.75 (95% CI 4.94 to 6.67) for women, and higher in men at 7.95 (95% CI 6.13 to 10.30) (Haentjens 2010). Excess mortality was also found to persist for as long as 10 years after hip fracture for both men and women. For those who survive, acute hospital costs are substantial, but long‐term costs in rehabilitation and extra care in the community are even greater (Dolan 1998; Haentjens 2005; Johnell 1997).
People with hip fractures, who are more likely to be older and frailer, are often malnourished or at risk of becoming malnourished at the time of the fracture (Bachrach 2001; Bastow 1983a; Koren‐Hakim 2012; Lumbers 2001). Social, psychological, physical, economic, medical and cognitive influences may all contribute to the risk of malnutrition. Dietary intake in people recovering from hip fracture in hospital is frequently suboptimal (Bell 2014; Jallut 1990; Lumbers 2001; Nematy 2004; Patterson 1992; Stableforth 1986).
Under‐nutrition leads to depressed mood, muscle wasting and reduced muscle power, and impaired cardiac function (Keys 1950). All of these will impair mobility and increase the tendency to develop postoperative medical complications (e.g. pneumonia, pressure sores, deep venous thrombosis) and hinder recovery, both in hospital and subsequently (Lennard‐Jones 1992), increasing health and social care costs. Malnutrition also impairs the immune response, which will enhance the risk of postoperative infection (Lesourd 1997). Poor nutritional status is associated with an increased risk of pressure ulcers after hip fracture (Lindholm 2008).
Description of the intervention
Examined in this review are nutritional interventions started within the first month after a hip fracture that are aimed at improving recovery from hip fracture by increasing the intake of energy, protein, vitamins and minerals, alone or in combination. Nutrition interventions can be provided by various routes: oral (by mouth), enteral (tube feeding into the stomach or small bowel, including percutaneous endoscopic gastrostomy) or parenteral (intravenous and intramuscular), also alone or in combination. Also considered are interventions that revolve round the administration of nutrition, such as the use of dietetic assistants in hospital.
How the intervention might work
There is an association between frailty, including that related to nutrition, and unfavourable outcomes following a hip fracture. Modification of nutritional status in the rehabilitation period, particularly early on, could be beneficial in reducing functional decline and reducing complications.
Making links between nutritional status and fracture recovery is complicated by the fact that markers of dietary protein depletion measured in blood, such as albumin, prealbumin, and transferrin are partly affected by fluid shifts and responses to injury and infection. Nevertheless, associations have been shown between low serum albumin and increased postoperative complications and poorer survival (Foster 1990; Patterson 1992). Another factor that has been implicated is vitamin C, which is required for an effective immune response and collagen formation required for wound healing. Low leucocyte vitamin C levels have been associated with the development of pressure sores in people with hip fracture (Brown 1992a; Goode 1992).
More direct markers of nutritional status are anthropometric indices, such as weight in relation to height, triceps skinfold for body fat, and mid‐upper arm circumference for muscle and fat mass. People with hip fracture have lower triceps skinfold and mid‐upper arm circumference than healthy people in the same age category (Mansell 1990; Nematy 2004). In a study of 744 people with hip fracture, Bastow 1983a found that low triceps skinfold and arm muscle circumference was associated with lower calorie intake on the ward and predicted poorer survival after hip fracture.
Why it is important to do this review
As described above, people with hip fracture are sometimes undernourished, and poor food intake may occur during routine care, hindering recovery. There is therefore an argument for nutritional supplementation in this group, and consequently a need to evaluate the use of nutrition interventions in this group of people by examining the evidence from relevant randomised controlled trials. This is the seventh update of our Cochrane review first published in 2000, and previously updated in 2010. The previous update (Avenell 2010) continued to point to the insufficiency of the available evidence to draw robust conclusions.
Objectives
To review the effects (benefits and harms) of nutritional interventions in older people recovering from hip fracture.
We considered comparisons where people with hip fracture, who were randomly allocated a nutritional intervention, including supplements, were compared with those allocated to no intervention or placebo. Where possible, effects were examined according to pre‐existing nutritional status: malnourished or not malnourished.
We also considered comparisons between nutritional interventions if these were compared in a randomised controlled trial.
Methods
Criteria for considering studies for this review
Types of studies
We included all randomised controlled trials (RCTs) and quasi‐randomised (e.g. allocation by date of birth or hospital record number) controlled trials of nutritional supplements post hip fracture. We also included trials that could not be analysed on an intention‐to‐treat basis, and those that lacked blinding or use of placebo treatment.
Studies of nutritional interventions that examined the secondary prevention of osteoporotic fractures after hip fracture were not considered in this review.
Types of participants
We included trials of older people recovering from any type of hip fracture. It was anticipated that most participants would be over 65 years of age. If the number of younger participants was relatively small, and provided there was adequate randomisation with unbiased distribution of this age group between the intervention and control groups, we retained them. Trials that focused specifically or mainly on younger people, people with multiple trauma or people with pathological fractures (e.g. cancer‐related fractures) were excluded. We also excluded trials published before 1980 with undefined geriatric populations or with mixed populations with fewer than five participants with hip fracture in each intervention group.
Studies reporting results on mixed populations of orthopaedic or other geriatric patients were only included, either if separate data were available from the participants with fracture of the hip, or when contact with the study authors resulted in the provision of such data.
The participants studied may have resided in a hospital or in a rehabilitation unit or any location after discharge from either of these facilities.
Types of interventions
We included trials of nutritional interventions aimed to improve the recovery from hip fracture by increasing the intake of energy, protein, vitamins and minerals, alone or in combination. Nutritional interventions were provided by oral (by mouth), enteral (tube feeding into the stomach or small bowel, including percutaneous endoscopic gastrostomy) or parenteral (intravenous and intramuscular) routes, alone or in combination. Interventions included those evaluating the administration of nutrition, such as the use of dietetic assistants. The interventions examined were started within the first month after hip fracture, and given for up to one year. Trials evaluating intravenous fluid administration in the immediate postoperative period for hydration purposes were excluded.
Interventions included multinutrient supplements (providing non‐protein energy, protein, vitamins and minerals) given orally, enterally or intravenously, compared with supplements containing less or none of these components, or no treatment. We included interventions of vitamins, minerals, amino acids or related compounds compared with lower doses, placebo or no treatment. We also included trials examining different policies to provide nutrition, for example, additional assistance from dietetic assistants.
Types of outcome measures
We sought information on the following outcomes, which we split into main outcomes (and further categorised into primary and secondary outcomes) and other outcomes. Additionally, we made the collection of 'unfavourable outcome' explicit.
Main outcomes
Primary outcomes
-
All cause mortality
-
Morbidity, postoperative complications (e.g. wound infections, pressure sores, deep venous thromboses, respiratory and urinary infections, cardiovascular events)
-
'Unfavourable outcome'. This was defined as the number of trial participants who died plus the number of survivors with complications. Alternatively, where these data were unavailable, we accepted a slightly different definition (mortality or survivors with a major complication or two or more minor complications) originally presented in Delmi 1990.
Secondary outcomes
-
Length of hospital and rehabilitation unit stay
-
Postoperative functional status (cognitive functioning, mobility and ability to perform activities of daily living)
-
The level of care and extent of support required after discharge
-
Patient perceived quality of life after discharge
-
Fracture healing
-
Putative side effects of treatment (e.g. diarrhoea, aspiration pneumonia, specific intravenous line complications)
Other outcomes
-
Patient tolerance of/compliance with nutrition interventions
-
Carer burden and stress
-
Economic outcomes
For this update, we shortened the list of 'other outcomes' that appeared in previous versions of this review (Avenell 2010). The removed outcomes are listed in Differences between protocol and review.
Search methods for identification of studies
Electronic searches
We searched the Cochrane Bone, Joint and Muscle Trauma Group Specialised Register (9 October 2014), the Cochrane Central Register of Controlled Trials (CENTRAL; 2015 issue 12) in The Cochrane Library, MEDLINE (1966 to October Week 5 2015), MEDLINE In‐Process & Other Non‐Indexed Citations (10 November 2015), Embase (1980 to 2015 Week 45), CAB Abstracts (1973 to 2015 Week 44), and the Cumulative Index to Nursing and Allied Health Literature (CINAHL) (1982 to 10 November 2015). For this update, the search results were limited from 2008 onwards.
In MEDLINE (Ovid), we combined the sensitivity‐maximizing version of the Cochrane Highly Sensitive Search Strategy for identifying randomised trials (Lefebvre 2011) with subject‐specific terms. We modified this strategy for use in the other databases (see Appendix 1 for search strategies).
We also searched the ISRCTN registry (17 February 2015), the WHO International Clinical Trials Registry Platform (17 February 2015), the UK Clinical Research Network Study Portfolio (17 February 2015), to identify ongoing trials.
We did not apply any language restrictions. We have given details of the search methods used for the previous version of the review in Appendix 2.
Searching other resources
We checked reference lists of articles, searched books related to orthopaedics, geriatric medicine and nutrition, and corresponded with colleagues and investigators.
Data collection and analysis
Selection of studies
Two review authors (from AA, TS, JC) independently assessed reports of potentially eligible studies and resolved any differences by discussion.
Data extraction and management
Two review authors (from AA, TS, JC, JM) independently extracted data. We resolved all differences by discussion. We extracted data using a pre‐derived data extraction form and entered the agreed results into Review Manager (RevMan) (RevMan 2014). If necessary, we contacted trialists for further information on methodology and data.
Assessment of risk of bias in included studies
In this update, two review authors (from AA, TS, JC, JM) independently assessed risk of bias in all included trials using the Cochrane 'Risk of bias' tool (Higgins 2011). This assesses sequence generation, allocation concealment, blinding of participants or personnel, blinding of outcome assessment, completeness of outcome data, selective outcome reporting and other potential sources of bias. We considered primary and secondary outcomes separately in our assessment of blinding of outcome assessment and completeness of outcome data. We resolved any differences of opinion by consensus or by consulting a third party.
Our risk of bias assessment superceded our assessment of methodological quality in previous versions of this review (Avenell 2010); see Differences between protocol and review.
Measures of treatment effect
For each study, risk ratios and 99% confidence intervals (CI) were calculated for dichotomous outcomes and mean differences and 99% CIs for continuous outcomes. The choice of 99% CIs reflects the extra burden of proof we considered appropriate for individual trials, in view of their generally poor quality. Summary estimates for meta‐analysis are provided as 95% CIs.
Unit of analysis issues
Although we would have included cluster‐randomised trials, the unit of randomisation in all included trials was the individual participant.
Dealing with missing data
We have presented mortality results using denominators based on the numbers of participants at randomisation (intention‐to‐treat analysis), where available. Generally, we presented the results for other outcomes using denominators based on the numbers of participants available at follow‐up. In some cases, we investigated the effect of drop outs and exclusions by conducting worst scenario analyses for the primary outcomes, where those who were missing to follow‐up in the intervention group were assumed to have the poorer outcome but not those who were missing in the control group. We were alert to the potential mislabelling or non identification of standard errors and standard deviations. Unless missing standard deviations could be derived from confidence intervals or standard errors, we did not assume values in order to present these in the analyses.
Assessment of heterogeneity
Heterogeneity was assessed by visual inspection of the forest plot (analysis) along with consideration of the Chi² test for heterogeneity and the I² statistic (Higgins 2003).
Assessment of reporting biases
We considered that there were sufficient data available to present funnel plots to explore the potential for publication bias for multinutrient supplements and the outcomes of mortality and complications. Our search of 'grey literature', dogged pursuit of trials listed in clinical trial registers and contact with trial authors should have helped to avoid some publication bias.
Data synthesis
Where appropriate, we combined the results of comparable groups of trials using both fixed‐effect, as the main analysis, and random‐effects models. We have presented all data for individual trials in meta‐analyses as 99% CIs, and pooled data with 95% CIs.
Subgroup analysis and investigation of heterogeneity
Our primary subgroup analysis was based on pre‐existing nutritional status (malnourished targeted versus malnourished not targeted). We also presented data on multinutrient supplements stratified by route of delivery: oral supplements, nasogastric tube feeding, nasogastric tube feeding and oral supplements, and intravenous feeding and oral supplements. To test whether the subgroups were statistically significantly different from one another, we tested the interaction using the inbuilt facility in RevMan 2014 that is based on methods outlined by Deeks 2011 in the Cochrane Handbook for Systematic Reviews of Interventions (Chapter 9).
Sensitivity analysis
We planned sensitivity analyses based on aspects of trial and review methodology. We have explored the risk of bias associated with inadequate concealment of allocation (unclear or high risk of selection bias) and the choice of statistical model for pooling data (fixed‐effect versus random‐effects).
'Summary of findings' tables and assessment of the quality of the evidence
We have presented the results for mortality, participants with complications and unfavourable outcomes (our primary outcome measures) and adverse events (e.g. vomiting and diarrhoea) in separate 'Summary of findings' tables for the comparisons of oral multinutrient supplements versus control and nasogastric multinutrient supplements versus control. For each outcome for each comparison, we graded the evidence as 'very low', 'low', 'moderate' or 'high' in accordance with the GRADE working group criteria (Guyatt 2008).
Results
Description of studies
Results of the search
We updated the search from 2008 to November 2015. We screened a total of 2459 records from the following databases: Cochrane Bone, Joint and Muscle Trauma Group Specialised Register (7), CENTRAL (340), MEDLINE (483), Embase (847), CAB Abstracts (234), and CINAHL (548). We did not identify any additional new trials from Current Controlled Trials, the WHO International Clinical Trials Registry Platform or the UK clinical research network study portfolio. We also identified one potentially eligible study from contact with the author (Luo 2015).
The search update resulted in the identification of 32 new studies (many published in multiple articles) for potential inclusion, for which we obtained reports. Upon study selection, we found 17 trials eligible for inclusion (Anbar 2014; Bischoff‐Ferrari 2010; Botella‐Carretero 2010; Chevalley 2010; Fabian 2011; Flodin 2014; Glendenning 2009; Kang 2012; Luo 2015; Myint 2013; Papaioannou 2011; Parker 2010; Prasad 2009; Scivoletto 2010; Serrano‐Trenas 2011; Van Stijn 2015; Wyers 2013), we excluded six studies (Bell 2014; Gunnarsson 2009; Hitz 2007; Hoekstra 2011; Holst 2012; Li 2012), we placed five in ongoing trials (ACTRN12609000241235; ACTRN12612000448842; NCT01404195; NCT01505985; Rowlands) and four await classification (Benati 2011; Bernabeu‐Wittel 2016; Ekinci 2015; Ish‐Shalom 2008).
We excluded one previously ongoing study (Cameron 2011). A second (NCT00523575) was published and is now an included study (Wyers 2013).
Overall, there are now 41 included studies, 43 excluded studies, seven ongoing trials and six studies awaiting classification.
Further details of the process of screening and selecting studies for inclusion in the review are illustrated in Figure 1. The results of the search reported in the previous version of the review (Avenell 2010) can be found in Appendix 3.

Study flow diagram
Included studies
Details of study methods, population, interventions and outcomes of individual trials are provided in the Characteristics of included studies.
We obtained further details (including clarifications) on methodology, trial participants and outcomes, from trialists of 23 studies (Bastow 1983b; Botella‐Carretero 2008; Botella‐Carretero 2010; Brown 1992b; Bruce 2003; Chevalley 2010; Day 1988; Duncan 2006; Eneroth 2006; Espaulella 2000; Flodin 2014; Hankins 1996; Hartgrink 1998; Houwing 2003; Luo 2015; Miller 2006; Myint 2013; Neumann 2004; Parker 2010; Prasad 2009; Sullivan 1998; Sullivan 2004; Tidermark 2004) and other sources for two trials (Ronald Koretz for Gallagher 1992; Jane Robertson for Hoikka 1980).
Design
Thirty‐seven trials were RCTs. The other four trials were quasi‐randomised trials (Bastow 1983b; Brown 1992b; Bruce 2003; Hoikka 1980). There were no cluster or cross‐over randomised trials.
Sample sizes
The 41 included studies involved a total of 3881 participants. Sample size ranged from 10 participants in Brown 1992b to 318 participants in Duncan 2006.
Setting
The publication dates of the trials span 35 years, Hoikka 1980 being the earliest. Most of the trials were based in a single centre. Trials were conducted in 15 countries (Australia, Austria, Canada, China, Finland, Israel, Italy, Korea, the Netherlands, Russia, Spain, Sweden, Switzerland, UK, USA), with eight trials being conducted in the UK, five each in Australia and Switzerland, four in the USA, three in Spain, and three each in the Netherlands and Sweden.
Participants
The majority of participants were female and in 10 studies all participants were female (Bastow 1983b; Bean 1994; Brown 1992b; Bruce 2003; Chevalley 2010; Duncan 2006; Fabian 2011; Serrano‐Trenas 2011; Stableforth 1986; Tidermark 2004). Sullivan 1998 and Sullivan 2004 were the only studies where male participants formed the majority. Where reported, the mean age of participants was usually over 80 years. Luo 2015 and Papaioannou 2011 had younger participants with a mean age of 69 years. Gallagher 1992 gave no details on age, but the rest of the details provided in the abstract were compatible with an older population. Only Bean 1994 applied an upper age limit, this being 85 years.
All studies (except Miller 2006, which included participants with lower limb fractures) included only participants with hip fracture. We obtained separate data for participants with hip fracture for Miller 2006. Nineteen studies provided information on the types of hip fractures suffered by the participants (Anbar 2014; Day 1988; Delmi 1990; Eneroth 2006; Espaulella 2000; Flodin 2014; Hartgrink 1998; Myint 2013; Parker 2010; Prasad 2009; Schürch 1998; Scivoletto 2010; Serrano‐Trenas 2011; Stableforth 1986; Sullivan 1998; Sullivan 2004; Tidermark 2004; Tkatch 1992; Wyers 2013). Seventeen studies excluded people with dementia or severe cognitive dysfunction. Many studies excluded people with a wide range of medical conditions (Anbar 2014; Bastow 1983b; Bean 1994; Bischoff‐Ferrari 2010; Brown 1992b; Chevalley 2010; Delmi 1990; Eneroth 2006; Espaulella 2000; Flodin 2014; Luo 2015; Myint 2013; Schürch 1998; Scivoletto 2010; Tidermark 2004; Tkatch 1992; Van Stijn 2015; Wyers 2013). Eight studies indicated that consent (assent) was acceptable if given by a relative or guardian (Day 1988; Duncan 2006; Espaulella 2000; Hankins 1996; Houwing 2003; Parker 2010; Sullivan 1998; Sullivan 2004).
Eight studies, involving 616 participants, examined the effect of supplementation on malnourished participants (Bastow 1983b; Bean 1994; Brown 1992b; Gallagher 1992; Hankins 1996; Luo 2015; Miller 2006; Myint 2013). Gallagher 1992 and Luo 2015 defined participants as malnourished on the basis of serum albumin; other studies used anthropometric measurements, such as mid‐upper arm circumference. Myint 2013 recruited participants if BMI was < 25 kg/m2and mean BMI was actually 21.7 kg/m2. We discussed this with consultant geriatrician colleagues, who advised that participants in this trial be considered under 'malnourished targeted' category of subgroup analysis.
Interventions
The 41 included trials evaluated a variety of nutritional supplements, mostly in comparison with a control group. We have provided details of these and the method of delivery in individual studies in the Characteristics of included studies. The comparisons under test fell into five categories (as detailed below).
Four studies had three treatment groups each. Madigan 1994 had three groups: the two supplemented groups (one with a multivitamin and mineral supplement) were subsequently combined in the report, owing to small numbers at follow‐up. Since these two groups both fit the criterion in this review for a 'multinutrient' supplement group, the combined results for these two groups, compared with the control, are also presented here. Botella‐Carretero 2008 also had three groups: oral protein and energy, oral protein, and control; both supplemented groups have been combined for this review, also owing to small numbers. Papaioannou 2011 compared an initial oral bolus dose of 100,000 IU vitamin D2 versus 50,000 IU vitamin D2 versus placebo; followed by 1,000 IU vitamin D3 for 90 days in all groups. Finally, Chevalley 2010 compared three different protein sources: oral casein protein versus oral whey protein versus oral whey protein plus essential amino acids.
Miller 2006 had four groups: a nutrition supplementation group, a physical activity intervention group, a combined intervention group, and an attention control group. We have only used data from the nutritional supplementation only and control groups here. Bischoff‐Ferrari 2010 had a factorial design with randomisation to two different doses of vitamin D3 and standard or extended physiotherapy.
We made the following comparisons:
Multinutrient supplements (oral, nasogastric, intravenous) versus control
The multinutrient supplements under investigation usually provided non‐protein energy, protein, some vitamins and minerals. These were delivered either orally, via a nasogastric tube, intravenously, or combinations of these.
Oral supplements
The 18 studies testing oral supplements involved 1190 participants (Anbar 2014; Botella‐Carretero 2008; Botella‐Carretero 2010; Brown 1992b; Bruce 2003; Delmi 1990; Fabian 2011; Flodin 2014; Hankins 1996; Houwing 2003; Kang 2012; Luo 2015; Madigan 1994; Miller 2006; Myint 2013; Stableforth 1986; Tidermark 2004; Wyers 2013). Anbar 2014 undertook three measurements of resting energy expenditure to estimate requirements for the intervention group. Wyers 2013 included five dietetic visits and five follow‐up phone calls for the intervention group. Interventions were usually started pre‐operatively or in two days postoperatively and most continued for at least a month.
Nasogastric tube feeding
Four studies involving 377 participants (Bastow 1983b; Gallagher 1992; Hartgrink 1998; Sullivan 1998), examined supplementation starting within five days of surgery and continued usually until oral intake was sufficient, or hospital discharge.
Nasogastric tube feeding and oral supplements
One study involving 57 participants (Sullivan 2004), examined supplementation postoperatively until oral intake was sufficient.
Intravenous feeding and oral supplements
One study involving 80 participants (Eneroth 2006) examined supplementation for the first 10 days in hospital.
High protein‐containing supplements versus low‐protein or non‐protein‐containing supplements
Protein supplementation was delivered within oral feeds, usually starting within a week of fracture and given for one to six months. This was assessed in four studies involving 371 participants (Espaulella 2000; Neumann 2004; Schürch 1998; Tkatch 1992). Whereas the protein supplement resulted in extra calories in the intervention group in Tkatch 1992, the energy content of both intervention and placebo groups were equivalent in Espaulella 2000 and Schürch 1998. Moderate quantities of minerals and vitamins were also provided with the protein supplement in Espaulella 2000 and Schürch 1998; none were in sufficient doses to detract from these being predominantly protein supplements. In Neumann 2004 there were differences in vitamin and mineral intakes between the high‐ and lower‐protein supplements, and the carbohydrate intake in the lower‐protein supplement resulting in similar energy contents of the two supplements.
Comparison of different protein sources
One study with 45 participants compared 20 g daily of oral casein protein versus 20 g of oral whey protein versus 15 g of oral whey protein and 5 g of essential amino acids in a ratio identical to casein, given from a mean of 10 days post‐fracture for a month (Chevalley 2010).
Vitamin supplementation versus control or lower dose supplementation
This comparison was based on four studies involving 335 participants (Bischoff‐Ferrari 2010; Day 1988; Hoikka 1980; Papaioannou 2011). Day 1988 investigated intravenous thiamin (vitamin B1) and water soluble vitamins versus control. Hoikka 1980 investigated the use of oral 1 mcg 1‐alpha‐hydroxycholecalciferol and 1 g calcium as calcium carbonate daily versus placebo and 1 g calcium as calcium carbonate daily for four months. Bischoff‐Ferrari 2010 investigated daily 2000 IU vitamin D3 compared with daily 800 IU vitamin D3; all participants also received 1 g of calcium as calcium carbonate daily over one year. Papaioannou 2011 compared an initial oral bolus dose of 100,000 IU vitamin D2 versus 50,000 IU vitamin D2 versus placebo; followed by 1000 IU vitamin D3 for 90 days in all groups. Interventions were commenced pre‐operatively or up to a mean of four days postoperatively and continued for between five days (Day 1988) and 3 to 12 months (Bischoff‐Ferrari 2010; Hoikka 1980; Papaioannou 2011).
Comparison of different vitamin D sources
One study with 95 participants compared oral vitamin D3 1000 IU/d and calcium carbonate equivalent to 600 mg/d to vitamin D2 1000 IU/d and calcium carbonate equivalent to 600 mg/d for three months from the inpatient stay (Glendenning 2009).
Iron supplementation versus control
Three studies with 568 participants investigated oral or intravenous iron supplementation compared with no intervention or placebo, started pre‐operatively or early postoperatively, for the first month after hip fracture (Parker 2010; Prasad 2009; Serrano‐Trenas 2011).
Vitamin, mineral and amino acid supplementation versus control
One study with 107 participants investigated six weeks of an oral Restorfast supplement daily (L‐carnitine, calcium, magnesium, vitamin D3, L‐leucine) followed by 10 weeks of an oral Riabylex supplement daily (creatine, L‐carnitine, coenzyme Q10, nicotinamide, pantothenic acid, riboflavin) (Scivoletto 2010). The start time for the intervention was unclear. Creatine, coenzyme Q and L‐carnitine were also included but are not vitamins, minerals or amino acids, and can be manufactured by the body.
Isonitrogenous ornithine alpha‐ketoglutarate versus peptide supplement
One study with 59 participants made this comparison (Bean 1994). Ornithine alpha‐ketogluturate is metabolised in part to the amino acid glutamine, and is used to improve nitrogen conservation. The interventions were probably delivered orally, and were given for two months, start time unclear.
Taurine versus placebo
One trial with 236 participants compared taurine with a placebo control (Van Stijn 2015). Taurine or placebo capsules were started pre‐operatively and then supplied for six days postoperatively. Taurine, which has been described as a conditionally essential amino acid, is a semi‐essential amino acid with antioxidant action to theoretically reduce oxidative stress which can be induced by surgical tissue injury. Taurine was provided three times a day with a scheme of 2‐1‐2 capsules of 1.2 g taurine to reach 6 g per day daily dose.
Dietetic assistants versus usual care
One study, involving 318 participants, tested the provision of extra assistance in the form of dietetic assistants, above that of dietitians and nurses, to help improve people's dietary intake (Duncan 2006). The dietetic assistants gave support for a median of 16 to 17 days; the start time for this assistance was unclear.
Excluded studies
We have given reasons for excluding 43 studies in the Characteristics of excluded studies. Six excluded studies were published in languages other than English, sufficient translation having been obtained to establish non‐eligibility. The major reasons for exclusion included studies not being RCTs (Bachrach 2001; Bell 2014; Bradley 1995; Giaccaglia 1986; Groth 1988; Gunnarsson 2009; Harju 1989; Hoekstra 2011; Holst 2012; Kacmaz 2007; Lawson 2003; Ravetz 1959; Tassler 1981); studies not recruiting (or presenting separate data for) people who had sustained a hip fracture (Brocker 1994; Cameron 2011; Goldsmith 1967; Hitz 2007; Larsson 1990; Lauque 2000; Lawson 2003; Pedersen 1999; Volkert 1996); and studies not presenting the outcomes of interest (Beringer 1986; Boudville 2002; Gegerle 1986; Stumm 2001; Wong 2004; Zauber 1992).
Ongoing studies
We have given details of seven ongoing trials in the Characteristics of ongoing studies. Of the ongoing studies, two (ACTRN12612000448842; Rowlands) with a total of 350 participants will examine the use of intravenous iron supplementation. The size of the trial by NCT00497978, which will examine the use of taurine supplementation, is unclear. ACTRN12609000241235 will recruit 150 participants to examine the effect of fish oils compared with other oils. In a trial with 340 participants, ACTRN12610000392066 will examine the use of oral 250,000 IU vitamin D3 compared with placebo. NCT01505985 and NCT01404195 will examine the use of oral multinutrient supplements compared with placebo or usual care in a total of 124 participants.
Studies awaiting classification
We have given details of the six studies in this category in the Characteristics of studies awaiting classification. We have requested further details from the trial investigators, where required.
Risk of bias in included studies
The quality of trial methodology, as reported, was disappointing and we could not rule out risk of bias associated with poor trial methods. Many of the trials failed to report trial methodology in sufficient detail. We obtained additional information on methods for nine trials (Brown 1992b; Bruce 2003; Day 1988; Espaulella 2000; Hankins 1996; Hartgrink 1998; Houwing 2003; Luo 2015; Sullivan 1998). We have summarised the risk of bias judgements in Figure 2 and Figure 3.

Risk of bias graph: review authors' judgements about each risk of bias item presented as percentages across all included studies

Risk of bias summary: review authors' judgements about each risk of bias item for each included study
Allocation
Sequence generation
We judged random sequence generation as adequate resulting in low risk of bias in 13 trials (32%) (Anbar 2014; Bischoff‐Ferrari 2010; Chevalley 2010; Day 1988; Espaulella 2000; Houwing 2003; Luo 2015; Miller 2006; Papaioannou 2011; Prasad 2009; Sullivan 2004; Van Stijn 2015; Wyers 2013). Four trials (10%) were quasi‐randomised and thus at high risk of bias (Bastow 1983b; Brown 1992b; Bruce 2003; Hoikka 1980). The remaining trials we judged to be at unclear risk of risk because of insufficient details.
Allocation concealment
Concealment of allocation was judged to be adequate resulting in low risk of bias in 19 (46%) trials (Anbar 2014; Botella‐Carretero 2008; Botella‐Carretero 2010; Chevalley 2010; Duncan 2006; Espaulella 2000; Flodin 2014; Glendenning 2009; Hankins 1996; Houwing 2003; Miller 2006; Myint 2013; Papaioannou 2011; Parker 2010; Serrano‐Trenas 2011; Sullivan 1998; Sullivan 2004; Van Stijn 2015; Wyers 2013). Allocation was unlikely to be concealed in three of the quasi‐randomised studies (Bastow 1983b; Brown 1992b; Bruce 2003), which were judged to be at high risk of bias. The remaining trials were judged to be at unclear risk of risk because of insufficient details.
Blinding
We judged eight (20%) trials to be at low risk of performance bias (blinding of participants and personnel) (Bean 1994; Bischoff‐Ferrari 2010; Espaulella 2000; Glendenning 2009; Houwing 2003; Papaioannou 2011; Schürch 1998; Van Stijn 2015). These trials generally had placebo interventions, or were comparisons of different kinds of supplement. We judged 29 trials at high risk of performance bias and four at unclear risk.
We judged almost all trials (95%) to be at low risk of detection bias relating to blinding of outcome assessment for primary outcomes, with the exception of two trials reporting putative side effects of interventions (Chevalley 2010; Prasad 2009). Blinding of secondary or other outcomes was less likely to be judged low risk, with only six trials (15%) judged as being low risk of detection bias (Bischoff‐Ferrari 2010; Espaulella 2000; Houwing 2003; Myint 2013; Papaioannou 2011; Van Stijn 2015). The remaining trials we judged to be at unclear risk of detection bias for both domains.
Incomplete outcome data
We judged 15 trials to be at low risk of bias for incomplete outcome data (attrition bias) for primary outcomes. Fourteen trials were judged to be at high risk of bias in this category (Botella‐Carretero 2010; Chevalley 2010; Delmi 1990; Flodin 2014; Glendenning 2009; Luo 2015; Madigan 1994; Myint 2013; Papaioannou 2011; Prasad 2009; Scivoletto 2010; Serrano‐Trenas 2011; Tkatch 1992; Van Stijn 2015). The remainder were judged at unclear risk of attrition bias for primary outcomes, where reported.
Incomplete outcome data were more problematic for secondary outcome data, and we judged only 10 trials to be at low risk of attrition bias. Thirteen trials were judged to be at high risk of bias and the remainder, where secondary outcomes were reported, at unclear risk of attrition bias.
Selective reporting
We judged 14 trials (34%) to be at low risk of bias for selective reporting of outcomes. However, we judged seven trials to be at high risk of bias (Bischoff‐Ferrari 2010; Bruce 2003; Chevalley 2010; Day 1988; Fabian 2011; Gallagher 1992; Luo 2015), usually as a result of data not presented that would be expected from their methods, or data that were provided not mentioned in methods, for example, length of stay, mortality, functional status. The remainder were at unclear risk of selective reporting bias.
Other potential sources of bias
For other potential sources of bias, we assessed adequacy of the length of follow‐up, adequacy of information on nutritional status, whether there were major between‐group imbalances in key baseline characteristics, and whether there was drug company involvement.
Recovery from hip fracture in older people takes time, with long‐term implications for morbidity and functional status. Sixteen studies followed up participants for six months or over; with six of these extending follow‐up to one year (Bischoff‐Ferrari 2010; Flodin 2014; Miller 2006; Schürch 1998; Van Stijn 2015; Wyers 2013).
Details of the nutritional status of the groups were often missing. Related to this was the lack of information on anthropometric parameters. While it is difficult to measure height and weight in people with hip fracture, 11 trials (27%) failed to provide any information on baseline anthropometry (e.g. mid‐upper arm circumference or weight) or an anthropometry‐derived nutrition risk score.
An appraisal of the trials for baseline imbalances found important differences between the two groups for age in two trials (Papaioannou 2011; Sullivan 2004), for type of hip fracture in Tidermark 2004; and for body weight in Stableforth 1986.
Twenty trials reported receiving some drug company sponsorship or provision of supplements, and were judged to be at high risk of bias. One trial (Anbar 2014) was judged to be at high risk of bias as a result of stopping early due to poor recruitment, when the interim analysis showed a 'positive result'. Another trial (Van Stijn 2015) was judged to be at high risk of bias because the power calculation was based on a very unlikely 50% reduction in mortality.
Effects of interventions
See: Summary of findings for the main comparison Multinutrient supplements (oral) versus control for hip fracture aftercare in older people; Summary of findings 2 Multinutrient supplements (nasogastric) versus control for hip fracture aftercare in older people
We have listed the outcomes reported in the included studies in the Characteristics of included studies. These are grouped by 'main' (primary and secondary) outcomes and 'other' outcomes, as defined in the Types of outcome measures. The results presented concentrate on main outcomes.
The included studies often failed to report main outcomes. For example, only two trials reported participants' perceived quality of life after discharge (Tidermark 2004; Wyers 2013), though in the 'other' outcomes category, it was notable that carer burden and stress were also not reported.
Postoperative complications were reported as a very wide variety of individual conditions (including aspiration pneumonia, gastrointestinal ulcer, pressure sore, face flushing, deep hip joint infection, chest infection, urinary tract infection, deep venous thrombosis, pulmonary embolism, stroke, thrombophlebitis, ischaemic heart disease, cardiac failure, anaemia, hyponatraemia, confusion, anaphylaxis, and acute renal failure) and generic complications (gastrointestinal, surgical, infection, postoperative, life‐threatening). It was not possible to undertake analyses according to the severity or type of complication. Putative side‐effects of supplementation are also presented separately. Those presented for individual studies are noted in the Characteristics of included studies. In order to give a more complete picture of morbidity, we opted to present the number of participants with complications at the end of individual studies. Results were not used from those studies, such as Tkatch 1992, which provided the numbers of complications but not the numbers of participants with complications. Results from Houwing 2003 were also not pooled since this trial only recorded pressure sores.
For some trials we have presented the numbers of trial participants with 'unfavourable outcome'. As defined above, this is the sum of the participants who had died plus the survivors with complications. For most studies, we could not deduce this result from the available data. Results for 'unfavourable outcome' based on a slightly different definition (mortality or survivors with a major complication or two or more minor complications) originally presented in Delmi 1990, were available for three studies (Delmi 1990; Hankins 1996; Tkatch 1992) and we have used in them this review.
We have presented mortality results using denominators based on the numbers of participants at randomisation (intention‐to‐treat analysis). Generally, we have presented the results for other outcomes using denominators based on the numbers of participants available at follow‐up. Exceptions to this are noted below.
Lengths of hospital stay in the acute hospital and rehabilitation hospital were often reported but we have not presented them in the analyses, or pooled them. This is because, even when means and standard deviations (SD) for these outcomes were reported, it was unlikely that lengths of stay were normally distributed.
In the following,we have presented results for the fixed‐effect model. Where the conclusions reached by combining comparable groups of trials differed noticeably between the fixed‐effect and random‐effects models, we have also presented the results for the random‐effects models.
Multinutrient supplements (oral or nasogastric routes, or both) versus control
Below we present the separate results by the route (oral, nasogastric or both) used for multinutrient supplementation, and then discuss the overall results for multinutrient supplementation. Finally, we investigate whether the results varied, according to whether the trials specifically targeted people who were malnourished, or according to trial quality (represented by whether allocation was concealed or not).
Oral supplements
Eighteen studies evaluated the effect of oral multinutrient supplementation (Anbar 2014; Botella‐Carretero 2008; Botella‐Carretero 2010; Brown 1992b; Bruce 2003; Delmi 1990; Fabian 2011; Flodin 2014; Hankins 1996; Houwing 2003; Kang 2012; Luo 2015; Madigan 1994; Miller 2006; Myint 2013; Stableforth 1986; Tidermark 2004; Wyers 2013) of which five (Brown 1992b; Hankins 1996; Luo 2015; Miller 2006; Myint 2013) targeted people who were malnourished. Follow‐up was usually until discharge or for one month; three trials followed up for six months (Bruce 2003; Delmi 1990; Myint 2013) and four trials followed up for 12 months (Flodin 2014; Miller 2006; Tidermark 2004; Wyers 2013).
Mortality
Pooled mortality data from 15 studies showed no clear difference between the two groups in mortality at follow‐up ranging from until hospital discharge to one year (24/486 versus 31/481; risk ratio (RR) 0.81, 95% confidence interval (CI) 0.49 to 1.32; low‐quality evidence downgraded two levels due to risk of bias and imprecision; Analysis 1.1, Figure 4). Five of these 15 studies reported no deaths in either group; all had short‐term follow‐up of up to discharge or for one month (Botella‐Carretero 2008; Botella‐Carretero 2010; Brown 1992b; Luo 2015; Stableforth 1986). Bruce 2003 reported similar percentages of participants in the two groups who had died or were in a nursing home at six months (23.4% versus 24.6%). Kang 2012 reported that supplementation reduced mortality but provided no data to support this.

Forest plot of comparison: 1 Multinutrient supplements (oral, nasogastric, intravenous) versus control, outcome: 1.1 Mortality by end of study
Complications
Thirteen studies reported the numbers of participants with complications at the end of the study (Anbar 2014; Botella‐Carretero 2008; Botella‐Carretero 2010; Delmi 1990; Flodin 2014; Hankins 1996; Kang 2012; Luo 2015; Madigan 1994; Myint 2013; Stableforth 1986; Tidermark 2004; Wyers 2013). Follow‐up was usually until discharge or for one month but two trials followed up for six months (Delmi 1990; Myint 2013) and three trials followed up for 12 months (Flodin 2014; Tidermark 2004; Wyers 2013). Results from Houwing 2003 were not included since these were only for pressure sores: there was no difference between the two groups in the numbers of participants with this complication. Kang 2012 reported that supplementation reduced the rate of postoperative complications but did not provide any data to support this statement. Luo 2015 reported 20 adverse events in the supplemented group and 24 in the control group, with two events in the intervention group assessed as being possibly related to the supplement (nausea, pruritus); denominators were unclear. Pooled results from 11 studies showed a reduction in the participants with complications in the supplemented group (123/370 versus 157/367; RR 0.71 favouring supplementation, 95% CI 0.59 to 0.86; low‐quality evidence downgraded two levels due to serious risk of bias; Analysis 1.2, Figure 5).

Forest plot of comparison: 1 Multinutrient supplements (oral, nasogastric, intravenous) versus control, outcome: 1.2 Participants with complications at end of study
Unfavourable outcome
Six studies reported data for 'unfavourable outcome' (Botella‐Carretero 2008; Botella‐Carretero 2010; Delmi 1990; Flodin 2014; Hankins 1996; Stableforth 1986). However, three of these did not report any deaths. Data pooled using the fixed‐effect model from these six trials for the combined outcome for mortality or complications ('unfavourable outcome') at final follow‐up favoured the supplemented group (58/176 versus 67/158; RR 0.67, 95% CI 0.51 to 0.89; very low‐quality evidence downgraded two levels for serious risk of bias and one for indirectness reflecting the mixed definition of the outcome measure; Analysis 1.4; Figure 6). The pooled results using the random‐effects model showed similar results (RR 0.65, 95% CI 0.45 to 0.95; data not shown). Delmi 1990 presented results, without explanation of the missing participants, for only 52 participants out of the 59 originally randomised. Exploratory analysis for 'unfavourable outcome' based on numbers randomised (in all trials where available) in which it was assumed that all excluded participants in the supplemented group had complications at follow‐up (66/184 versus 67/169; RR 0.81, 95% CI 0.62 to 1.04; Analysis 1.5) shows these findings are not robust.
Hankins 1996 also presented data for 'unfavourable outcome' in the acute hospital (14/17 versus 12/14; RR 0.96, 99% CI 0.64 to 1.44) and post‐discharge (8/17 versus 6/14; RR 1.10, 99% CI 0.39 to 3.09); Analysis 1.5. Delmi 1990 presented data for similar outcomes but gave insufficient explanation of the denominators used in their report.
Secondary outcomes
Length of stay
The duration of hospital stay was reported in 13 studies (Anbar 2014; Botella‐Carretero 2010; Brown 1992b; Bruce 2003; Madigan 1994; Myint 2013; Sullivan 1998; Espaulella 2000; Neumann 2004; Parker 2010; Serrano‐Trenas 2011; Day 1988; Scivoletto 2010), with variable effects for the interventions. We have presented data for those trials that allowed significance testing in Table 1. Anbar 2014 reported that hospitalisation was shorter in the intervention group (10.1 days versus 12.5 days: mean difference (MD) ‐2.40 days, 99% CI ‐5.60 to 0.80 days). Botella‐Carretero 2008 reported that hospital stay was similar for all three groups (the graph of these data clearly showed no differences). Botella‐Carretero 2010 found that the length of acute hospital stay was similar in intervention and control groups (13.3 days versus 12.8 days: MD 0.50 days, 99% CI ‐2.26 to 3.26 days). Botella‐Carretero 2010 also reported that total length of hospital stay (including rehabilitation) was similar in intervention and control groups (19.0 (SD 4.2) days versus 18.9 (SD 4.4) days, denominators unclear). Brown 1992b, which included 10 participants only, reported a lower acute hospital stay for the supplementation group (27 days versus 48 days: MD ‐21.00 days, 99% CI ‐65.15 to 23.15 days). Bruce 2003 reported no significant difference between the two groups in the mean length of hospital stay (17.7 days versus 16.6 days: MD 1.10 days, 99% CI ‐3.53 to 5.73 days). Delmi 1990 reported a statistically significantly lower median length of stay in acute and rehabilitation wards for the supplementation group (24 days (range 13 to 157) versus 40 days (range 10 to 259); reported P < 0.02). Fabian 2011 reported that the duration of hospitalisation was shorter in supplemented participants (17(SD 4) versus 19 (SD 9) days, denominators unclear).
| Study ID | Intervention | Control | Mean difference (99% confidence intervaI) | ||||
| Multinutritional oral supplements | |||||||
| 22 | 10.1 | 3.2 | 28 | 12.5 | 5.5 | ‐2.40 days (‐5.60 to 0.80) | |
| 30 | 13.3 | 4.3 | 30 | 12.8 | 4.0 | 0.50 days (‐2.26 to 3.26) | |
| 5 | 27.00 | 10.00 | 5 | 48.00 | 37.00 | ‐21.00 days (‐65.15 to 23.15) | |
| 50 | 17.70 | 9.40 | 58 | 16.60 | 9.20 | 1.10 days (‐3.53 to 5.73) | |
| 18 | 16.00 | 8.00 | 12 | 15.00 | 11.00 | 1.00 day (‐8.51 to 10.51) | |
| 61 | 26.2 | 8.2 | 60 | 29.9 | 11.2 | ‐3.70 days (‐8.30 to 0.90) | |
| Nasogastric tube feeding | |||||||
| 8 | 38.20 | 36.90 | 7 | 23.70 | 20.00 | 14.50 days (‐24.34 to 53.34) | |
| High protein supplements | |||||||
| 85 | 16.40 | 6.60 | 86 | 17.20 | 7.70 | ‐0.80 days (‐3.62 to 2.02) | |
| 18 | 23.20 | 5.52 | 20 | 28.00 | 11.63 | ‐4.80 days (‐12.29 to 2.69) | |
| Iron supplementation versus control | |||||||
| 150 | 18.8 | 17.4 | 150 | 21.3 | 20.6 | ‐2.50 days (‐8.17 to 3.17) | |
| 99 | 13.5 | 7.1 | 97 | 13.1 | 6.9 | 0.40 days (‐2.18 to 2.98) | |
| Vitamin B1 | |||||||
| 28 | 35.00 | 34.00 | 30 | 29.00 | 30.00 | 6.00 days (‐15.75 to 27.75) | |
| Vitamin, mineral and amino acid supplementation versus control | |||||||
| 49 | 15.4 | 6.8 | 47 | 17.9 | 7.3 | ‐2.50 days (‐6.21 to 1.21) | |
| Semi‐essential amino acid | |||||||
| 111 | 13 | 10 | 123 | 13 | 11 | 0.00 days (‐3.54 to 3.54) | |
SD: standard deviation
Hankins 1996 found that supplemented participants had a median acute and rehabilitation stay of 26 days (range 6 to 60) versus 21 days (range 3 to 60) for participants in the control group (reported P = not significant). Madigan 1994 found that the acute hospital stay was 16 days in the combined intervention group and 15 days in the control group (MD 1.00 day, 99% CI ‐8.51 to 10.51 days). Both groups, including several patients with other lower‐limb fractures, in Miller 2006 stayed a median of 24 days in hospital. Myint 2013 found the length of stay in the rehabilitation ward was shorter in the intervention group (26.2 days versus 29.9 days: MD ‐3.70 days, 99% CI ‐8.30 to 0.90 days). Tidermark 2004 reported no significant difference in median hospital stay during the first year after surgery in intervention and control groups (20 days (range 5 to 356 days) versus 27 days (range 5 to 197 days)). Wyers 2013 found the length of stay in acute and rehabilitation hospital to be similar for intervention and control groups (36 days, range 4 to 185 days, versus 38 days, range 3 to 183 days, reported P = 0.85).
Functional status and level of care required
Trials reported a variety of functional outcomes in various ways; pooling was either not possible or not appropriate. Bruce 2003 reported no significant differences between the two groups in functional outcomes (fall in the Katz activities of daily living score: 41.7% versus 33.9%) or living at home at six months (63.8% versus 63.2%). Hankins 1996 found no statistically significant effect of the supplement at two months on the Barthel Index of functional ability; median 56 (range 0 to 100) versus 40 (range 0 to 92). Luo 2015 reported no significant difference between study groups in gait speed or modified Barthel Index at 14 or 28 days. Madigan 1994 found that the combined intervention group were more likely to return to their premorbid mobility (non‐return: 9/18 versus 7/12; RR 0.86, 99% CI 0.36 to 2.05; analysis not shown), but this may have reflected that significantly more supplemented participants were sent to a rehabilitation hospital. Myint 2013 reported no statistically significant difference between groups for the Elderly Mobility Scale or Functional Independence Measure. A higher proportion of participants in the intervention group were discharged to nursing homes (19/61 versus 15/60; RR 1.25, 99% CI 0.70 to 2.22).
Activities of daily living, assessed by the Katz score, in Tidermark 2004, were better maintained in the supplemented group at six months (dependence in bathing and one other function: 2/18 versus 8/16; RR 0.22, 99% CI 0.04 to 1.39; analysis not shown) but less so at 12 months (4/18 versus 6/16; RR 0.63, 99% CI 0.15 to 2.59; analysis not shown), compared with the control group. Tidermark 2004 also found that mobility data were not significantly different between the two groups.
At six months postoperatively, Wyers 2013 found no significant effect from the intervention on functional status, activities of daily living or household activities of daily living. The frequency of hospital readmissions did not differ between groups.
Quality of life
Tidermark 2004 reported no significant difference between the two groups for health‐related quality of life at six and 12 months, as assessed by the EuroQol questionnaire. At six months postoperation Wyers 2013 found no significant difference for Quality Adjusted Life Years (QALYs) (MD ‐0.02, 95% CI ‐0.12 to 0.08).
Fracture healing
Tidermark 2004 found no significant difference between the two groups in fracture healing complications (4/18 versus 7/17; RR 0.54, 99% CI 0.14 to 2.10; analysis not shown).
Putative side effects of treatment (e.g. vomiting and diarrhoea)
Botella‐Carretero 2008 reported vomiting, diarrhoea or both in 23% of participants taking the protein supplement, 30% of participants taking the protein and energy supplement, and 17% of controls. Botella‐Carretero 2010 found that 3% of the intervention group and 10% of controls had vomiting, diarrhoea or both. Flodin 2014 reported that three participants in the control group and none in the intervention group had constipation or diarrhoea (denominators unclear). Hankins 1996 found that 12% of participants stopped the supplement as a result of nausea or diarrhoea. Luo 2015 reported two adverse events possibly related to supplements (nausea and pruritus). Myint 2013 found that six participants (10%) reported intolerance of the supplements (including dislike of the taste, nausea, abdominal bloating and diarrhoea). Neumann 2004, Tidermark 2004 and Wyers 2013 reported no adverse effects in either group. Pooling of data from those trials providing data for both intervention and control groups showed no difference between the two groups (18/231 versus 11/211; RR 0.99, 95% CI 0.47 to 2.05; 6 studies; I2 = 49%; very low‐quality evidence downgraded three levels due to risk of bias, inconsistency and imprecision; Analysis 1.6).
Compliance
Anbar 2014 reported that the supplemented group had a significantly higher mean daily energy and protein intake during the first 11 postoperative days (reported P = 0.001). Botella‐Carretero 2008 reported mean consumption of 41% for the protein supplement and 51% for the protein and energy supplement. Botella‐Carretero 2010 found that 52% of supplementation was ingested. Bruce 2003 reported a mean consumption of 20.6 cans of supplement, out of a maximum possible of 28. Delmi 1990 reported that the supplement did not reduce volitional food intake, and compliance appeared not to be a problem. Flodin 2014 reported that 7 of 18 participants complied with supplement prescription, and the remaining participants took half the prescribed supplementation. Hankins 1996 found that only 65% of participants managed to complete the full 30 days of supplementation. However, the supplement had no significant effect on ordinary food intake. Houwing 2003 found that the mean daily intake of the active or placebo supplements was 77% in both groups. Luo 2015 reported good compliance with intervention participants consuming 91% to 100% of recommended intake. Madigan 1994 also found that the oral supplement did not significantly affect volitional intake, but made no comment on compliance. Myint 2013 reported an overall compliance rate for supplements of 78%. Wyers 2013 found that 67% of the participants adhered to the nutritional recommendations from the dietician and 79% were adherent to the supplements in hospital. After discharge, the adherence was 73% and 80%, respectively.
Neither Brown 1992b, Tidermark 2004 nor Stableforth 1986 gave details on volitional food intake or compliance with the supplements. Specific data on adherence for participants with hip fracture in the nutrition‐supplementation only group of Miller 2006 were not available.
Carer burden and stress
No study provided data for this outcome.
Economic outcomes
Wyers 2013 in the Netherlands undertook an economic evaluation of supplementation and dietetic support for three months. Based on QALYs and a societal perspective, the Incremental Cost‐Effectiveness Ratio was 36,943 EUR/QALY. Based on total societal costs and a willingness to pay of EUR 20,000, the probability that the intervention was cost‐effective was 45%.
Nasogastric tube feeding
Primary outcomes
Four studies examined nasogastric multinutrient supplementation (Bastow 1983b; Gallagher 1992; Hartgrink 1998; Sullivan 1998). Gallagher 1992, which was only published as an abstract, gave no denominators and so could not be included in the meta‐analyses. Information provided by Ronald Koretz (personal communication), based on notes taken at a conference presentation by Gallagher 1992, indicated a possible failure to undertake intention‐to‐treat analysis. It seems likely that 12 participants allocated to the intervention group, who had feeding discontinued when their tube was pulled out, were crossed over to the control group in the analysis. There were also some differences in the results presented at the conference and in the published abstract.
Gallagher 1992 gave no information on mortality in the published abstract; two deaths were reported in the conference presentation. Pooling of mortality data from the other three studies showed no evidence of an effect (14/142 versus 14/138; RR 0.99, 95% CI 0.50 to 1.97; I2 = 69%; very low‐quality evidence downgraded two levels for serious risk of bias and one level for inconsistency given the considerable heterogeneity; Analysis 1.1: Figure 4). All seven deaths in Hartgrink 1998 occurred in the intervention group during the two‐week period of observation. This could have been due to chance, as the deaths were not obviously related to tube feeding (anaesthetic death, cardiac arrest, stroke and multi‐organ failure), and did not appear to relate to aspiration pneumonia, a complication of tube feeding. Four of the deaths occurred in participants in whom tube feeding had not started, although the tube had been placed. It was evident that tube feeding was poorly tolerated, with only 26% of the intervention group tolerating feeding for the full two weeks. Conversely all five deaths occurred in the control group in Sullivan 1998; this might in part reflect the greater frailty of the control group at recruitment.
The four trials were heterogeneous in the nutritional status of the study participants. Unlike Hartgrink 1998, Bastow 1983b targeted nasogastric feeding on thin and very thin participants, defined by anthropometry. Seventy‐eight per cent of participants tolerated nasogastric feeding until discharge from the ward, although 18 in the intervention group developed diarrhoea, which was ascribed to antibiotics in 16. Bastow 1983b did not report gastrointestinal complications in the control group. Bastow 1983b provided separate mortality data for the two participant subgroups (thin group: 5/39 versus 4/35; very thin group: 2/25 versus 5/25); a test for interaction did not indicate a subgroup difference P = 0.31 (analysis not shown). Malnourished participants were not specifically targeted in Sullivan 1998. In Sullivan 1998, the intervention group received supplements until discharge or until a good oral intake was achieved. People with low serum albumin readings, described as malnourished, were targeted in Gallagher 1992.
Only Sullivan 1998 provided data on participants developing medical complications in intervention and control groups (1/8 versus 8/10; RR 1.09, 99% CI 0.64 to 1.86; very low‐quality evidence downgraded two levels for serious risk of bias and one level for imprecision; Analysis 1.2:Figure 5). No study provided information on 'unfavourable outcome'.
Secondary outcomes
Three studies provided information on length of hospital stay. In the published abstract, Gallagher 1992 found that rehabilitation length of stay was 25 days in the intervention group and 33 days in the control group (reported P = 0.058). However, in the notes taken from the conference presentation by Gallagher 1992, the length of stay was 22.7 days for the control group and 22.6 days for the intervention group. Sullivan 1998 reported no significant difference between the two groups in the length of acute care stay for survivors (38.2 days versus 23.7 days: MD 14.50 days, 99% CI ‐24.34 to 53.34 days). Bastow 1983b stated the median lengths of stay for the very thin group only (including those who died): a median of 29 days for the intervention group and 38 days for the control group (reported P = 0.04). Hartgrink 1998 gave no information about length of stay but reported that the intervention group were less likely to have left hospital by two weeks (still in hospital at two weeks: 55/62 versus 53/67; RR 1.12, 99% CI 0.92 to 1.37; analysis not shown).
Where reported, physiotherapy goals were achieved more quickly in the intervention groups: Gallagher 1992 (published abstract), 12.7 days versus 16.2 days (reported P = not significant); Bastow 1983b thin group: 10 days (range 4 to 20) versus 12 days (range 5 to 26) (reported P = 0.04); Bastow 1983b very thin group: 16 days (range 5 to 34) versus 23 days (range 10 to 45) (reported P = 0.02). Sullivan 1998 showed no statistically significant difference between intervention and control groups for activities of daily living at discharge (Katz index (0 = independent to 12 = totally dependent): 4.1 versus 5.9; MD ‐1.80, 99% CI ‐7.17 to 3.57).
Sullivan 1998 reported that three out of eight in the intervention group had bloating in the early morning and none in the control group; there was no feed‐induced diarrhoea. Sullivan 1998 did not report on aspiration pneumonia. Hartgrink 1998 reported no cases of aspiration pneumonia, a putative side effect, related to the tube feeding.
Sullivan 1998 found that volitional food intake was not significantly affected by nasogastric feeding. Bastow 1983b found that nasogastric feeding significantly suppressed oral intake in the thin group but not in the very thin group. The suppression of food intake in the thin group amounted to 1.1 MJ, compared with daily nasogastric feeding which provided 4.2 MJ.
Nasogastric tube feeding and oral supplements
Sullivan 2004 evaluated nightly nasogastric feeding tailored to the calculated energy requirements of individual participants after taking account of the intake from meals. If the difference between calculated requirements and food intake decreased to 240 to 480 kcal/day participants were asked to drink one or two cans of the supplement orally instead of nasogastric feeding. This regimen was compared with standard care. The evidence for all outcomes was very low quality, downgraded by two levels for risk of bias and one level for imprecision. At six months there was very low‐quality evidence of no significant differences between the two groups in mortality (4/27 versus 6/30; RR 0.74, 99% CI 0.16 to 3.37; Analysis 1.1; Figure 4) or postoperative complications (18/27 versus 18/30; RR 1.11, 99% CI 0.66 to 1.87; Analysis 1.2; Figure 5).
There was no significant difference in hospital length of stay. The median (interquartile range) length of hospital stay for the intervention group was 9 days (7 to 21) and for the control group 9 days (7 to 15), reported P = 0.817).
Sullivan 2004 found no significant difference between intervention and control groups in the Katz Index of activities of daily living scores on discharge (median (interquartile range): 8 (4 to 11) versus 9 (7 to 11); reported P = 0.503), or the rate of discharge to an institution (25/27 versus 27/30; RR 1.03, 99% CI 0.83 to 1.27; analysis not shown).
Five of the 27 intervention group participants never started tube feeding because of either refusal of tube placement or lack of toleration of the feeding tube. Targeted tube feeding was continued until the oral intake was deemed to be adequate in only five of the remainder, and only two participants required no tube reinsertions. Though there was no significant difference between the two groups in the incidence of diarrhoea (5/27 versus 3/30; RR 1.85, 99% CI 0.32 to 10.68; Analysis 1.6), Sullivan 2004 reported that the diarrhoea in the intervention group was more difficult to control. In the first week, the intervention group met 86% of their calculated energy requirements compared with 63% for the control group (reported P = 0.002); the difference between the two groups was not significant for the 22 trial participants assessed in the second week (96% versus 95%; reported P = 0.942).
Intravenous feeding and oral supplements
Eneroth 2006 evaluated three days of intravenous feeding followed by seven days of oral supplements compared with standard care in 80 participants. The only reported deaths were in the control group (0/40 versus 4/40: RR 0.11, 99% CI 0.00 to 4.95; very low‐quality evidence downgraded one level from serious risk of bias and two from imprecision; Analysis 1.1; Figure 4). In contrast, there was a significant reduction in participants with complications in the supplementation group (6/40 versus 28/40; RR 0.21, 99% CI 0.08 to 0.59; very low‐quality evidence downgraded one level for risk of bias, one level for imprecision (small single trial) and one for indirectness, since this intervention is usually reserved for people with non‐functioning gastrointestinal tracts, which is unlikely in this population; Analysis 1.2; Figure 5). The mean length of hospital stay for both groups was 12.5 days. There was no significant difference between the two groups for those who were discharged to their own homes (14/40 versus 22/40, RR 0.64, 99% CI 0.33 to 1.24; analysis not shown). There were three reports of venous thrombosis or thrombophlebitis in the control group and one report in the intervention group.
Multinutrient supplements ‐ overall results
There was no clear difference between intervention and control groups in overall mortality when pooling the results of oral, nasogastric and intravenous multinutrient supplementation studies (42/695 versus 55/689; RR 0.79, 95% CI 0.55 to 1.15; 1385 participants; 20 studies; I2 = 0%; low‐quality evidence downgraded two levels for risk of bias and imprecision; see Analysis 1.1; Figure 4). Funnel plot examination (Figure 6) did not show clear evidence of small study bias.

Funnel plot of comparison: 1 Multinutrient supplements (oral, nasogastric, intravenous) versus control, outcome: 1.1 Mortality by end of study
There were fewer participants with complications in the intervention compared with the control groups (154/445 versus 211/437; RR 0.69, 95% CI 0.59 to 0.81; 882 participants; 14 studies; Analysis 1.2; Figure 5). However, although there was substantial heterogeneity for this outcome (I² = 60%, Chi² = 30.16, P = 0.003); the result using the random‐effects model was similar (RR 0.70, 95% CI 0.53 to 0.91; see Analysis 1.3). Funnel plot examination (Figure 7) did not show clear evidence of small study bias. The significant heterogeneity was reduced by removing Eneroth 2006 (resulting heterogeneity: I² = 35%, Chi² = 16.87, P = 0.11); RR 0.79, 95% CI 0.64 to 0.98 from the pooled results of the remaining trials; analysis not shown.
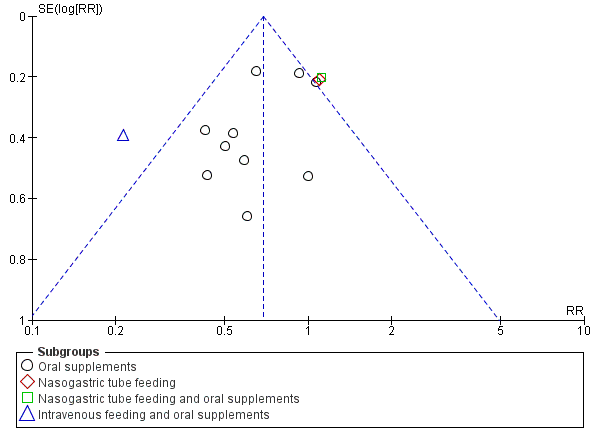
Funnel plot of comparison: 1 Multinutrient supplements (oral, nasogastric, intravenous) versus control, outcome: 1.2 Participants with complications at end of study
There were no data from nasogastric or intravenous trials on 'unfavourable outcome' (see Analysis 1.4).
Subgroup and sensitivity analysis
Nutritional status of trial populations
Subgrouping the trials according to whether they targeted malnourished participants or not showed a potential reduction in terms of mortality for supplementation in those that targeted malnourished participants (RR 0.55, 95% CI 0.27 to 1.11; 388 participants, 6 studies) compared with those that did not (RR 0.92, 95% CI 0.59 to 1.42; 997 participants, 14 studies); Analysis 2.1. The results of the groups were not statistically significantly different from each other (test for interaction: P = 0.23, I2 = 31.7%) and thus the evidence does not confirm that malnourished participants are more likely to benefit. While there was greater contrast between the two subgroup groups when the data were restricted to oral supplementation, the test for interaction similarly did not confirm a difference between the two subgroups (P = 0.15, I2 = 52.1%); Analysis 2.2.
The analyses for complications (see Analysis 2.3) and 'unfavourable outcome' (see Analysis 2.4) are also presented, but the greatly reduced available data for people who were malnourished limit their usefulness. The tests for subgroup differences indicated there were no differences for both outcomes (I2 = 0).
Methodological quality
We have presented the results for mortality subgrouped by whether allocation was concealed (low, unclear or high risk of bias) in the individual studies in Analysis 3.1. A test for interaction confirms the visual impression that the pooled results of the 10 trials with low risk of bias are not statistically significantly different from those of the three trials where allocation was high risk, or the seven trials where allocation concealment was of unclear risk (P = 0.21). The 'unclear concealment' group is clearly heterogeneous (I² = 52%) and it is inadvisable to draw any conclusions from the above test of interaction result. For the seven trials using oral supplementation alone and at low risk of allocation concealment, the risk ratio was 0.63 (95% CI 0.32 to 1.25, data not shown).
The results (Analysis 3.2) for participants with complications were subgrouped by whether allocation was concealed (low or unclear; no trials with high risk of bias). The five trials with unclear risk of bias had a lower risk of complications (19/127 versus 47/133; RR 0.38, 95% CI 0.24 to 0.61) than the nine trials with low risk of bias (135/318 versus 164/304; RR 0.78, 95% CI 0.66 to 0.92), test for subgroup differences P = 0.005, I2 = 87.5%). Both groups of trials were clearly heterogeneous, I2 was 51% and 45% respectively, and it is inadvisable, therefore, to draw any conclusions from the above test of interaction result. For the seven trials using oral supplementation alone with low risk of bias relating to allocation concealment, the risk ratio was 0.72 (95% CI 0.60 to 0.88, data not shown).
High protein‐containing supplements versus low‐protein or non‐protein‐containing supplements
Primary outcomes
Three studies (Espaulella 2000; Schürch 1998; Tkatch 1992) investigated whether approximately 20 g of protein provided within an oral supplement on a daily basis influenced outcome from hip fracture. Neumann 2004 investigated whether a high‐protein supplement providing an extra 12.2 g or more of protein (with some differences in vitamins and minerals also) influenced outcome. All four studies failed to carry out intention‐to‐treat analyses (although information was later provided on mortality and hospital complications of excluded participants in Espaulella 2000). Denominators were sometimes missing or unclear. Tkatch 1992 excluded some of the intervention group for poor compliance with supplement taking, whilst some of the controls were excluded for later taking a dietary supplement. Espaulella 2000 excluded five people from the intervention group and three from the control group for protocol violations, and two from the control group because they were unable to swallow. Thus, unavoidably, the results presented here are not intention‐to‐treat analyses. No significant effect on mortality could be demonstrated for the high protein supplement (30/181 versus 21/180; RR 1.42 favouring the control group, 95% CI 0.85 to 2.37; 4 studies; low‐quality evidence, downgraded one level for risk of bias and one level for imprecision; Analysis 4.1).
None of the four trials provided sufficient information to evaluate numbers of participants with complications at the end of the study. Espaulella 2000 reported that 44 out of 61 in the intervention group and 57 of 67 in the control group developed at least one complication during the six months of the study (RR 0.85, 99% CI 0.66 to 1.08; analysis not shown). Neumann 2004 reported that there were no differences between the groups for complications or adverse events. Taken together, these findings constitute very low‐quality evidence downgraded two levels for risk of bias and one level for imprecision.
'Unfavourable outcome' (for Espaulella 2000: death or complication by the end of the study; for Tkatch 1992: death by the end of the study or, for survivors, a major complication or two or more minor complications present at the end of the study) was significantly reduced by protein supplementation (66/113 versus 82/110; RR 0.78, 95% CI 0.65 to 0.95; very low‐quality evidence downgraded two levels for risk of bias and one for imprecision reflecting insufficiency in the available data; Analysis 4.2); this outcome was not reported by the other two studies.
An exploratory analysis looking at the effect of assuming that all excluded participants in the protein supplementation group had an 'unfavourable outcome' could not be undertaken. However the results for Espaulella 2000 should be viewed in the context of the greater number of deaths in the protein supplementation group. In Tkatch 1992, neither the results for unfavourable outcome in acute hospital (9/33 versus 13/29; RR 0.61, 99% CI 0.25 to 1.50) nor in rehabilitation hospital (4/19 versus 14/22; RR 0.33, 99% CI 0.10 to 1.12) were statistically significant; analyses not shown.
Secondary outcomes
Espaulella 2000 reported an acute hospital stay of 16.4 days in the intervention group and 17.2 days in the control group (MD ‐0.80 days, 99% CI ‐3.62 to 2.02 days). Tkatch 1992 reported a statistically significantly (P < 0.05) lower median length of acute and rehabilitation hospital stay in the intervention group (combined stay: median 69.4 days versus 101.6 days; acute hospital stay: median 23.5 days versus 24.7 days; rehabilitation hospital: 78.6 days versus 91.8 days). Schürch 1998 reported mean figures of 18.0 days versus 16.9 days on the acute ward, and median stays of 33 versus 54 days in the rehabilitation ward (reported difference 21 days, 95% CI 4 to 25 days; P = 0.018). Neumann 2004 reported the rehabilitation stay was not significantly different between the two groups (23.2 days versus 28.0 days; MD ‐4.80 days, 99% CI ‐12.29 to 2.69 days). Neumann 2004 also reported no significant difference in the destination at discharge between the two groups.
Espaulella 2000 found no difference between intervention and control groups for mobility or Barthel Index scores six months after recruitment. Schürch 1998 also reported non‐significant improvements in biceps muscle strength and activities of daily living score at six months; these were not reported as being measured by Tkatch 1992. Schürch 1998 reported that seven participants in the intervention group and 13 in the control group developed vertebral deformities after one year. Again denominators were not given; the difference was reported not to be statistically significant. Neumann 2004 found no significant difference between groups for the mobility subscale of the Functional Independence Measure at any time point including at three months post discharge.
Neither Schürch 1998 nor Tkatch 1992 gave information about the effect of the supplements on voluntary food intake. However, Schürch 1998 did report that six participants (15%) dropped out because of nausea or diarrhoea in the intervention group and five participants (12%) in the control group. Tkatch 1992 reported no digestive disturbances during hospitalisation in the protein supplemented group, and seven events in the control group. Espaulella 2000 reported that 64.7% (55/85) of the intervention group and 74.4% (64/86) of the control group had good consumption of the supplement. Neumann 2004 reported that participants had 19.8 days of the high‐protein supplement, compared with 21.1 days for the lower‐protein supplement. They found that energy intakes were not significantly different between the groups, but that the high‐protein group also had significantly greater daily intakes of dietary fibre, vitamin C and polyunsaturated fatty acids.
Comparison of different protein sources
Chevalley 2010 compared 20 g daily of oral casein protein versus 20 g of oral whey protein versus 15 g of oral whey protein and 5 g of essential amino acids in a ratio identical to casein for a month. Five people from 15 of the casein group dropped out (2 refusal, 2 nausea, 1 diarrhoea), four from 15 of the whey group (2 refusal, 1 nausea, 1 diarrhoea) and two from 15 of the whey and amino acid group (1 refusal, 1 nausea). The type of supplement was reported as not influencing adherence. No other outcomes relevant to this review were reported.
Vitamin supplementation versus control or lower dose supplementation
Day 1988 tested whether intravenous thiamin (vitamin B1) and other water soluble vitamins influenced postoperative mental function in participants. The daily dose of thiamin (250 mg) provided over 300 times the UK reference nutrient intake for this vitamin; that of riboflavin, 3.6 times; of pyridoxine, 42 times; of nicotinamide and ascorbic acid, 13 times. Sixty‐one per cent of the intervention group and 75% of the control group had satisfactory thiamin status at baseline. There was no significant difference in mortality (see Analysis 5.1: 6/28 versus 5/32; RR 1.37, 99% CI 0.33 to 5.62) or in the numbers of participants with complications (see Analysis 5.2: 15/28 versus 13/32; RR 1.32, 99% CI 0.65 to 2.69). Likewise, the incidence of acute postoperative confusion, the primary outcome of Day 1988, did not differ between the two groups (11/28 versus 12/32; RR 1.05, 99% CI 0.45 to 2.44; analysis not shown). The length of hospital stay was not affected (MD 6 days, 99% CI ‐15.75 to 27.75 days), and residence at final follow‐up was reported not to be affected by the intervention.
Hoikka 1980 compared oral 1‐alpha‐hydroxycholecalciferol (an active form of vitamin D) and 1 g calcium carbonate versus 1g calcium carbonate. No data from main outcomes were reported, except for complications. Six, including two severe cases, out of 19 in the intervention group and two out of 18 in the control group developed hypercalcaemia (see Analysis 6.1: 6/19 versus 2/18; RR 2.84, 99% CI 0.41 to 19.48). Hoikka 1980reported that there was no effect on hand muscle strength over the six months post‐fracture observation period.
Papaioannou 2011 compared an initial oral bolus dose of 100,000 IU vitamin D2 versus 50,000 IU vitamin D2 versus placebo; followed by 1000 IU vitamin D3 for 90 days in all groups. Combining both vitamin D groups and comparing these with the placebo group, there was no significant difference found in the number of participants with a serious adverse event (this included death): 4/44 versus 1/21; RR 1.91, 99% CI 0.12 to 31.32; analysis not shown. There were two serious adverse events in each of the two vitamin D groups. Compliance in hospital was 90%, 87% and 97%, for high dose, low dose vitamin D groups and placebo; and 92%, 96% and 84% at home.
Bischoff‐Ferrari 2010 investigated daily 2000 IU vitamin D3 compared with daily 800 IU vitamin D3; all participants also received 1g of calcium as calcium carbonate daily over one year, in a factorial design with standard or extended physiotherapy. Mortality (10/86 versus 10/87; RR 1.01, 99% CI 0.44 to 2.31; Analysis 6.2), participants with fall‐related injury requiring hospital readmission (7/86 versus 18/87; RR 0.39, 99% CI 0.13 to 1.16), participants with infection (1/86 versus 10/87; RR 0.10, 99% CI 0.01 to 1.47), participants with other complications requiring hospital readmission (18/86 versus 13/87; RR 1.40, 99% CI 0.60 to 3.28) did not differ significantly between the two vitamin D intervention groups. The numbers of participants with complications were not provided. Mild hypercalcaemia was reported in one participant in the high dose vitamin D group and two in the low dose early in the study, and for two participants in the high dose group and one participant in the low dose group at the end of six months' follow‐up.
Bischoff‐Ferrari 2010 reported that comparing high dose with low dose vitamin D did not reduce the rate of falls or improve muscle strength or function. The adjusted odds ratio for new nursing home admission for high versus low dose vitamin D was reported as 0.66, 95% 0.31 to 1.41). Compliance was reported as 93.6% for high dose vitamin D and 92.2% for low dose vitamin D. An abstract reported that the higher versus standard dose of vitamin D was cost neutral.
Comparison of different vitamin D sources
Glendenning 2009 compared oral vitamin D3 1000 IU/d and calcium carbonate equivalent to 600 mg/d versus vitamin D2 1000 IU/d and calcium carbonate equivalent to 600 mg/d for three months. Three of 47 participants from the vitamin D3 group died by three months compared with seven from 48 participants from the vitamin D2 group (RR 0.44, 99% CI 0.08 to 2.39). One participant from the vitamin D3 group and three participants from the vitamin D group had mild hypercalcaemia (RR 0.34, 99% CI 0.02 to 6.36). Forty‐seven percent of vitamin D3 participants compared with 59% of vitamin D2 participants took more than 80% of their tablets.
Iron supplementation versus control
Three studies with 568 participants compared oral or intravenous iron supplementation versus no intervention or placebo in the first month after hip fracture, as faster correction of anaemia as a consequence of surgery might help improve recovery (Parker 2010; Prasad 2009; Serrano‐Trenas 2011). Based on low‐quality evidence (downgraded due to risk of bias and imprecision from low number of events), there was no benefit of iron supplementation compared with not prescribing iron supplementation on mortality (39/282 versus 40/284; RR 0.97, 95% CI 0.65 to 1.46; 3 trials; Analysis 7.1) or on complications (16/132 versus 13/134; RR 1.23, 95% CI 0.63 to 2.42; 2 trials; Analysis 7.2). Purported adverse events related to supplementation were reported for 3/100 intervention participants randomised in Serrano‐Trenas 2011 (one participant skin rash, two participants 'general discomfort'); 2/32 intervention participants in Prasad 2009 (constipation requiring laxatives), and 26/150 participants randomised in Parker 2010 (13 required discontinuation as a result of abdominal pain or altered bowel habit). Length of stay was shorter for participants receiving iron in Parker 2010 (MD ‐2.50 days, 99% CI ‐8.17 to 3.17 days), and longer in Serrano‐Trenas 2011 for participants receiving iron (MD 0.40 days, 99% CI ‐2.18 to 2.98 days).
Vitamin, mineral and amino acid supplementation versus control
Scivoletto 2010 investigated six weeks of an oral Restorfast supplement daily (L‐carnitine, calcium, magnesium, vitamin D3, L‐leucine) followed by 10 weeks of an oral Riabylex supplement daily (creatine, L‐carnitine, coenzyme Q10, nicotinamide, pantothenic acid, riboflavin) compared with no supplementation. Only 53 of 107 participants were available for follow‐up at the end of the study.
Length of hospital stay was shorter for participants receiving supplementation in Scivoletto 2010 (MD ‐2.50 days, 99% CI ‐6.21 to 1.21 days); time to ambulation was also shorter (MD ‐1.20 days, 99% CI ‐10.16 to 7.76 days). There was no benefit of supplementation on pressure sores in hospital (3/38 versus 6/41; RR 0.54, 99% CI 0.10 to 3.03). For the 53 remaining participants, no difference between groups was found for functional recovery (14/27 versus 10/26; RR 1.35, 99% CI 0.61 to 2.99).
Isonitrogenous ornithine alpha‐ketoglutarate versus peptide supplements
Bean 1994, published only in abstract, investigated the effect of oral ornithine alpha‐ketoglutarate, compared to an isonitrogenous peptide supplement, in 59 relatively undernourished older women with hip fracture. Unfortunately, no denominators for the intention‐to‐treat analyses were provided in the abstract, which reported that recruitment was slow and that compliance with the supplements for the full two months was poor. Bean 1994 reported that there was no difference in mortality (ornithine alpha‐ketoglutarate supplemented 12.5%, control 11.1%, no denominators provided), compliance, duration of treatment or hospitalisation between the two groups. Bean 1994 reported there was no significant difference in complications but that major complications were significantly delayed in the intervention group (reported P < 0.03). No information was given in the abstract about the effect of the supplements on volitional food intake, although food diaries were kept.
Taurine versus placebo
Van Stijn 2015 compared oral taurine prescribed during the first six postoperative days following hip fracture surgery with placebo. Data were available for 187 participants at 12 months. There was no significant effect of the intervention on mortality (23/113 versus 27/123; RR 0.93, 99% CI 0.57 to 1.52; Analysis 8.1).
The total number of participants with complications at the end of the study was not reported. However data for six relevant postoperative complications were reported within the follow‐up period in Van Stijn 2015. There was no difference between the groups for these complications that included infection (11/110 vs 18/122, RR 0.68, 99% CI 0.27 to 1.71), cardiovascular events (5/110 vs 13/122, RR 0.43, 99% CI 0.11 to 1.58), stroke (1/110 vs 2/122, RR 0.55, 99% CI 0.02 to 12.77), delirium (26/110 vs 27/122, RR 1.07, 99% CI 0.57 to 1.99), the requirement for a blood transfusion (19/110 vs 20/122, RR 1.05, 99% CI 0.50 to 2.24) and reoperation (6/110 vs 6/122, RR 1.11, 99% CI 0.26 to 4.72). Length of hospital stay was reported as 13 days (SD 10) for the intervention group and 13 days (SD 11) for the control group, reported P = 0.83; denominators unclear.
Dietetic assistants versus usual care
Duncan 2006 evaluated the use of dietetic assistants, who checked food preferences, helped order meals and supplements, provided feeding aids, assisted with food choice, and assisted with feeding at meal times. Since this trial was a sufficiently powered trial for mortality, 95% CIs are also reported for this outcome.
Based on absolute number of deaths by four months postoperative, the risk of death was significantly lower (P = 0.03) in the intervention group (19/145 versus 36/157; RR 0.57, 95% CI 0.34 to 0.95). However, the possibility of increased mortality in the intervention group could not be ruled out when applying our stricter criteria (P < 0.01): RR 0.57, 99% CI 0.29 to 1.11; low‐quality evidence downgraded one level for risk of bias and one level for imprecision; Analysis 9.1. The incidence of complications was similar in the two groups (79/130 versus 84/125; RR 0.90, 99% CI 0.71 to 1.15; low‐quality evidence downgraded one level for risk of bias and one level for imprecision; Analysis 9.2). Duncan 2006 found no significant difference between the two groups in the lengths of stay in the acute ward (median 16 days versus 17 days; reported P = 0.44) or in hospital (34 days versus 32 days; reported P = 0.81). Using their own scoring scheme, Duncan 2006 reported that patient satisfaction was significantly greater in the intervention group at discharge (reported P < 0.0001). The mean daily energy intake was 349 kcal higher in the intervention group; this was mostly from supplements.
Discussion
Summary of main results
The variety of interventions examined for hip fracture recovery and outcomes limited data synthesis, with the exception of multinutrient supplements providing non‐protein energy, protein, some vitamins and minerals. The failure to confirm an effect does not mean that there is no effect, but may simply reflect few trials, poor study design and inadequate sample size.
Multinutrient supplementation
Oral supplements
Eighteen trials evaluated oral multinutrient feeds that provided non‐protein energy, protein, vitamins and minerals. There was low‐quality evidence that oral supplementation had little effect on mortality, with the 95% confidence interval (CI) including the possibility that oral supplementation could result in lower or higher mortality (risk ratio (RR) 0.81 favouring supplementation, 95% CI 0.49 to 1.32; 968 participants, 15 studies). Based on an illustrative risk of mortality of 72 per 1000 people with hip fracture (median mortality risk at 1 to 12 months' follow‐up from study control groups featuring at least one death), this equates to 13 fewer deaths per 1000 (95% CI 36 fewer to 23 more deaths) over 1 to 12 months' follow‐up. In high risk populations (i.e. people over 80 years old with an estimated mortality of 250 per 1000; Bentler 2009; Mariconda 2015), this equates to 47 fewer deaths per 1000 (95% CI 127 fewer to 78 more deaths; summary of findings Table for the main comparison). A subgroup analysis separating out trials that did or did not target malnourished people did not confirm a difference in treatment effect between the two subgroups.
There was low‐quality evidence that oral supplementation resulted in fewer complications (RR 0.71, 95% CI 0.59 to 0.86; 727 participants, 11 studies). Based on an illustrative risk of postoperative complications of 443 per 1000 people with hip fracture, this equates to 128 fewer people with complications per 1000 (95% CI 62 to 181 fewer) over 1 to 12 months' follow‐up. In moderate risk populations (i.e. people in the study by Mariconda 2015 with a complication rate of 290 per 1000), this equates to 84 fewer people per 1000 (95% CI 40 to 119 fewer complications).
Based on very low‐quality evidence, oral supplements may result in lower numbers of 'unfavourable outcome' (death or complications): RR 0.67, 95% CI 0.51 to 0.89; 334 participants, 6 studies. As seen in summary of findings Table for the main comparison, based on an illustrative risk of unfavourable outcomes for 500 per 1000 people with hip fracture, this equates to 165 fewer people with unfavourable outcomes per 1000 (95% CI 45 to 245 people with fewer unfavourable outcomes) over 1 to 12 months' follow‐up.
There was very low‐quality evidence that oral supplementation did not result in an increased incidence of vomiting and diarrhoea (RR 0.99, 95% CI 0.47 to 2.05; 442 participants, 6 studies).
Nasogastric tube feeding
Four trials examined nasogastric multinutrient feeding. As summarised in summary of findings Table 2, there was very low‐quality evidence that nasogastric tube feeding did not reduce mortality (RR 0.99, 95% CI 0.50 to 1.97; 280 participants, 3 studies; I2 = 69%). Based on an illustrative risk of mortality of 156 per 1000 people with hip fracture, this result equates to 1 fewer death per 1000 (95% CI 88 fewer to 152 more deaths) over 1 to 12 months. There was very low‐quality evidence from just one study of 18 male participants of no clear difference between nasogastric tube feeding and no supplementation in complications following hip fracture surgery at six months' follow‐up (7/8 versus 8/10; RR 1.09, 95% CI 0.73 to 1.64). No study reported on unfavourable outcome (death or complication). Tube feeding was often poorly tolerated. There was no report of aspiration pneumonia. While 18 intervention group participants (28% of 64) had diarrhoea in one study, only two were attributed to tube feeding and the control rate was not reported.
Nasogastric tube feeding and oral supplements
There is very low‐quality evidence from one trial of 57 participants, most of whom were male, of no clear effect of tube feeding followed by oral supplementation on mortality or complications. Tube feeding, however, was poorly tolerated.
Intravenous feeding and oral supplements
There is very low‐quality evidence from one trial of 80 participants that a combination of intravenous feeding and oral supplements may not affect mortality but could reduce complications. However, it is notable that intravenous feeding is an expensive, technically complex intervention that is usually reserved for people with non‐functioning gastrointestinal tracts, which is unlikely in this trial and thus the evidence was downgraded for 'indirectness'.
Nutritional status subgroup analysis
There was no evidence of a difference in risk or benefit between the results (mortality and participants with complications) of trials specifically targeting malnourished participants and those not targeting this population. Thus, there is no clear evidence to confirm that malnourished participants are more likely to benefit from multinutrient supplementation than those participants who are not malnourished.
Increasing protein intake
The four studies testing the effects of a higher protein intake are flawed by their failure to account for all participants. In particular, the results for mortality (greater in the high protein group) and 'unfavourable outcome' (fewer in the high protein group for Espaulella 2000 are contradictory and while many reasons for this, including that of random variation, can be put forward, none can be confirmed. Overall, there was low‐quality evidence of no clear effect of a higher intake of protein on mortality (4 trials) or number of complications (data not presented from two trials) and very low‐quality evidence for a reduction in unfavourable outcome. There was no evidence that higher protein intake led to an increase in adverse events such as nausea or diarrhoea.
Other supplements
No evidence can be found from the two studies of Day 1988 and Hoikka 1980 to recommend the supplementation of vitamin B1 and other water soluble vitamins, or 1‐alpha‐hydroxycholecalciferol. Giving bolus vitamin D soon after hip fracture did not appear to have a beneficial affect on mortality or adverse events. Giving vitamin D2 compared to vitamin D3, or 2000 IU vitamin D3 daily compared to 800 IU vitamin D3 also did not appear to influence outcomes. Intravenous or oral iron supplementation did not appear to help recovery, and may increase gastrointestinal adverse events.
Vitamin, mineral and amino acid supplementation was reported to improve functional recovery in one trial (Scivoletto 2010). However more than half the participants were lost to follow‐up, so this very low‐quality evidence should be interpreted with great caution. Based on low‐quality evidence, there was no beneficial effect of providing taurine supplements during the first six postoperative days on postoperative mortality or complications including requirement for blood transfusion in one trial (Van Stijn 2015). Ornithine alpha‐ketoglutarate, compared with an isonitrogenous peptide supplement, may delay the onset of complications post hip‐fracture, but this is based on very low‐quality evidence from one unpublished study (Bean 1994) and no benefit on reducing the risks of postoperative complications. No trials examined the effect of specific amino acid formulations.
Dietetic assistants
Based on low‐quality evidence, the use of dietetic assistants may reduce mortality but there is no clear effect on complications or length of hospital stay. Duncan 2006 reported increased consumption of supplements and greater patient satisfaction in the intervention group. These favourable results need to be checked in further randomised controlled trials involving more hospitals.
Overall completeness and applicability of evidence
Given that people with hip fracture are often malnourished, it is notable that this review gives no clear evidence that those who are malnourished are more likely to benefit from multinutrient supplementation than those who are not malnourished. The lack of difference in results of trials may be due not only to the small sample sizes, but also to the different definitions of malnutrition in individual trials. Possibly people who are malnourished benefit more from nutritional supplementation, but their malnutrition could be a marker for other co‐morbidities which are more important in determining outcomes. Many of the most frail participants, who are more likely to be malnourished, were excluded from these trials, for example, participants with cognitive impairment.
Incomplete compliance with nutritional supplementation was a major problem in these studies. Inability to tolerate nasogastric tubes and problems with palatability of oral feeds are common, particularly in confused, frail people. Malnutrition in itself produces mental apathy (Keys 1950), which may further reduce supplement intake. Ensuring increased nutritional intake thus has a major implication for nursing care, and has ethical implications when a person appears unwilling to feed or tolerate nasogastric feeding. While the combined intervention of nutritional supplementation and exercises investigated in Miller 2006 was excluded from this review, the potential interaction between these two interventions merits further investigation.
Nasogastric feeding, if tolerated, allows the provision of higher supplements of energy (3.90 MJ to 6.28 MJ, or 933 kcal to 1500 kcal daily, in the studies in this review), whereas oral supplements in the studies reviewed here generally provided under 2.51 MJ (800 kcal) daily. Thus nasogastric feeding, which potentially has more risk of complications, is likely to be targeted at those requiring higher levels of supplementation. Attempts to overcome the poor palatability of oral supplements, and thus increase intakes further, include special high energy hospital meals and the provision of frequent small snacks (Gall 1998). Related to this are other measures taken to encourage consumption of food by patients. For example, one of the excluded studies examined the effects of actively involving patients in their own dietary care, a procedure based on Salling's nursing model involving a dietary journal, information, guidance and instruction (Pedersen 1999). Dietetic assistants may be another way to increase food and supplement intake, as in Duncan 2006, which requires examination in further research, including an economic evaluation.
Intravenous feeding used in Eneroth 2006 provided an additional 1000 kcal and 53 g protein daily, thus also allowing higher levels of supplementation. However, it also carried risks of fluid and electrolyte imbalance, hyperglycaemia and thrombophlebitis when delivered through a peripheral vein.
Nutritional supplementation should also be viewed in the context of general nutrition in hospitals. Given the high numbers of hip fracture patients with prior malnutrition, and the prolonged length of stay, it is surprising that nutrition, including the provision and uptake of basic foodstuffs, is often understated, or even overlooked, as a component of rehabilitative care programmes.
There is interest in the hypothesis that nutritional supplementation may attenuate bone loss after fracture, which may also help to decrease the risk of further fractures (Schürch 1998a).
Quality of the evidence
Following the GRADE assessment for the primary outcomes in this review, the quality of the evidence ranged from very low to low. For details for the oral and nasogastric multinutrient supplementation comparisons, please see summary of findings Table for the main comparison and summary of findings Table 2. Overall, the evidence was downgraded two or three levels due to a high risk of bias, limitations in the detailed design and execution of the trials, imprecision of the data and, less frequently, inconsistency and indirectness. Items for risk of bias assessment were often inadequately reported. The studies were often small and limited further by insufficient ascertainment of important outcomes, incomplete outcome data (especially for secondary outcomes), inadequate period of follow‐up for recovery from fracture and selective reporting of outcomes. Due to the small number of events such as unfavourable outcomes and complications, the evidence was frequently downgraded due to imprecision. This was particularly the case for interventions that were tested by only a small number of trials.
Potential biases in the review process
We think that it is unlikely that the review process itself has introduced bias. Our search, updated fully on a regular basis, is comprehensive and we actively pursued unpublished trials and data as well as ongoing and newly registered trials. We have used robust methodology, including independent trial selection and review of included trials, throughout the review and updating processes. One potential issue is that we have pooled mortality, participants with complications, and unfavourable outcome data irrespective of length of follow‐up. While, the influence of nutritional supplementation is more likely in the period immediately after hip fracture, we do not anticipate that our mixed follow‐up approach would bias the results. In future updates, we will consider whether quality of life should become a main outcome.
Agreements and disagreements with other studies or reviews
One review author (AA) has contributed to two more general systematic reviews of protein and energy supplementation in older people at risk from malnutrition (Milne 2006; Milne 2009). The above described limitations in the studies of this review also apply to nutritional intervention trials for other patient groups. Milne 2009 found that while there was no significant reduction in mortality in the supplemented compared with control groups overall, mortality results were statistically significant when limited to trials in which participants (N = 2461) were defined as undernourished. They concluded that there was a beneficial effect on complications, as found here, but considered this needs confirmation.
One recent systematic review of protein and energy supplementation after hip fracture from China (Liu 2015), with studies published up until 2011, reached similar conclusions for mortality and complications, but with limited discussion of the quality of the evidence.
One systematic review of six small trials of oral nutritional support (Beck 2013) for medical and surgical patients starting after discharge from hospital was unable to demonstrate clear benefits on mortality and complications. Of note, is that our trials commenced supplementation whilst participants were still hospitalised, when they were at highest risk of underfeeding.
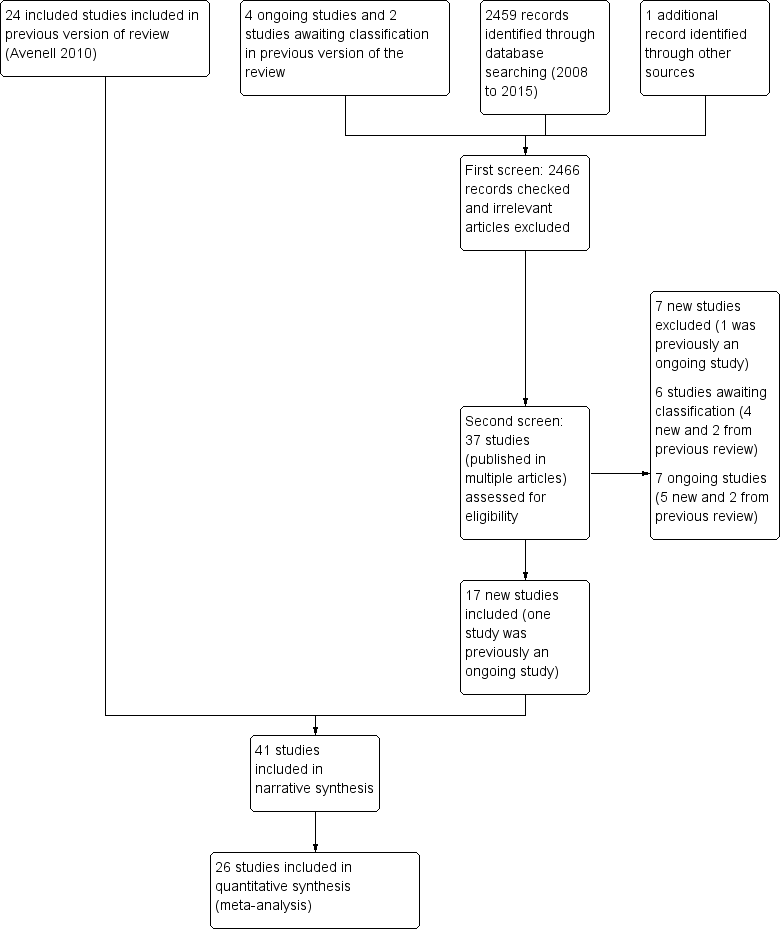
Study flow diagram
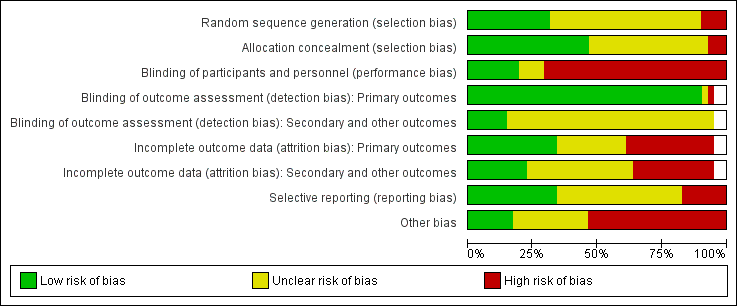
Risk of bias graph: review authors' judgements about each risk of bias item presented as percentages across all included studies
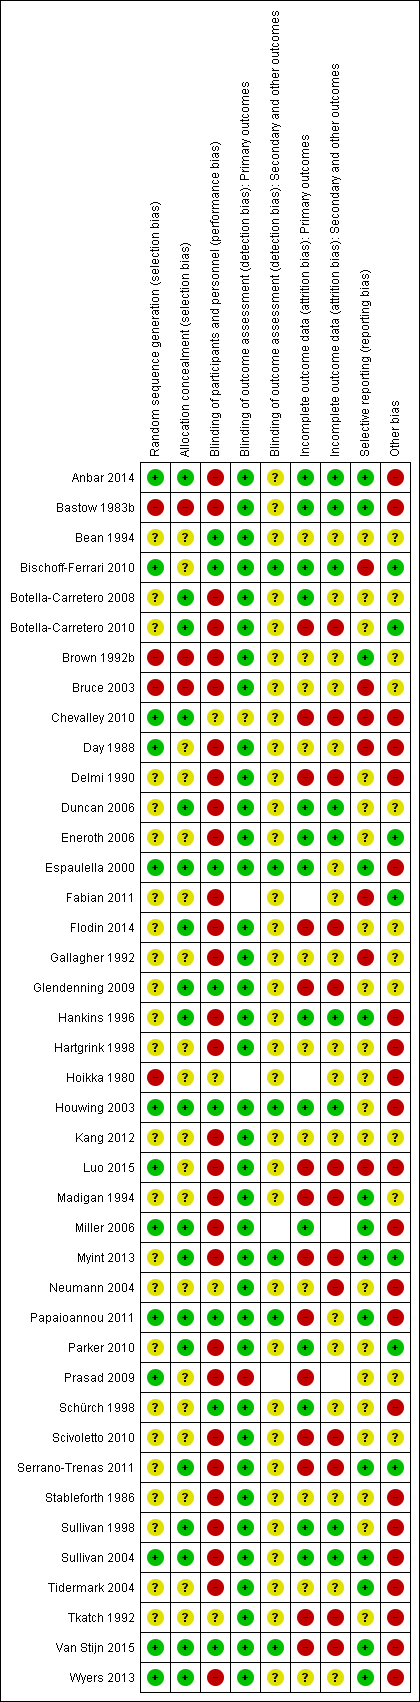
Risk of bias summary: review authors' judgements about each risk of bias item for each included study

Forest plot of comparison: 1 Multinutrient supplements (oral, nasogastric, intravenous) versus control, outcome: 1.1 Mortality by end of study
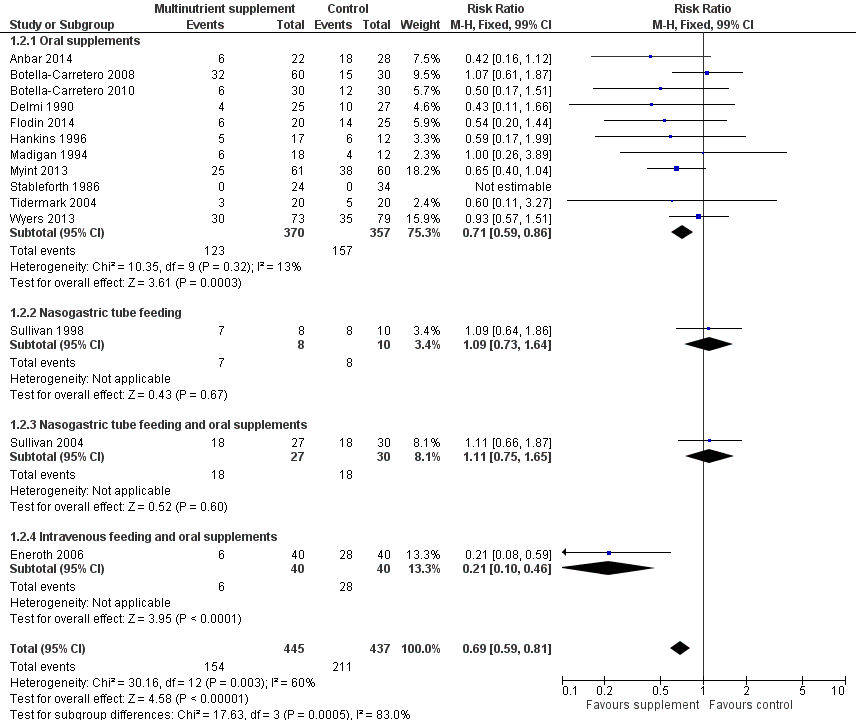
Forest plot of comparison: 1 Multinutrient supplements (oral, nasogastric, intravenous) versus control, outcome: 1.2 Participants with complications at end of study

Funnel plot of comparison: 1 Multinutrient supplements (oral, nasogastric, intravenous) versus control, outcome: 1.1 Mortality by end of study

Funnel plot of comparison: 1 Multinutrient supplements (oral, nasogastric, intravenous) versus control, outcome: 1.2 Participants with complications at end of study

Comparison 1 Multinutrient supplements (oral, nasogastric, intravenous) versus control, Outcome 1 Mortality by end of study.

Comparison 1 Multinutrient supplements (oral, nasogastric, intravenous) versus control, Outcome 2 Participants with complications at end of study.

Comparison 1 Multinutrient supplements (oral, nasogastric, intravenous) versus control, Outcome 3 Participants with complications at end of study: random‐effects model.

Comparison 1 Multinutrient supplements (oral, nasogastric, intravenous) versus control, Outcome 4 Unfavourable outcome (death or complications) at end of study.

Comparison 1 Multinutrient supplements (oral, nasogastric, intravenous) versus control, Outcome 5 Unfavourable outcome (death or complications) ‐ oral supplements extra analyses.

Comparison 1 Multinutrient supplements (oral, nasogastric, intravenous) versus control, Outcome 6 Adverse effects (putatively related to treatment).

Comparison 2 Multinutrient supplements (oral, nasogastric routes, intravenous) versus control (split by nutritional status), Outcome 1 Mortality by end of study.

Comparison 2 Multinutrient supplements (oral, nasogastric routes, intravenous) versus control (split by nutritional status), Outcome 2 Mortality by end of study ‐ oral supplements only.

Comparison 2 Multinutrient supplements (oral, nasogastric routes, intravenous) versus control (split by nutritional status), Outcome 3 Participants with complications at end of study.

Comparison 2 Multinutrient supplements (oral, nasogastric routes, intravenous) versus control (split by nutritional status), Outcome 4 Unfavourable outcome (death or complications) at end of study.
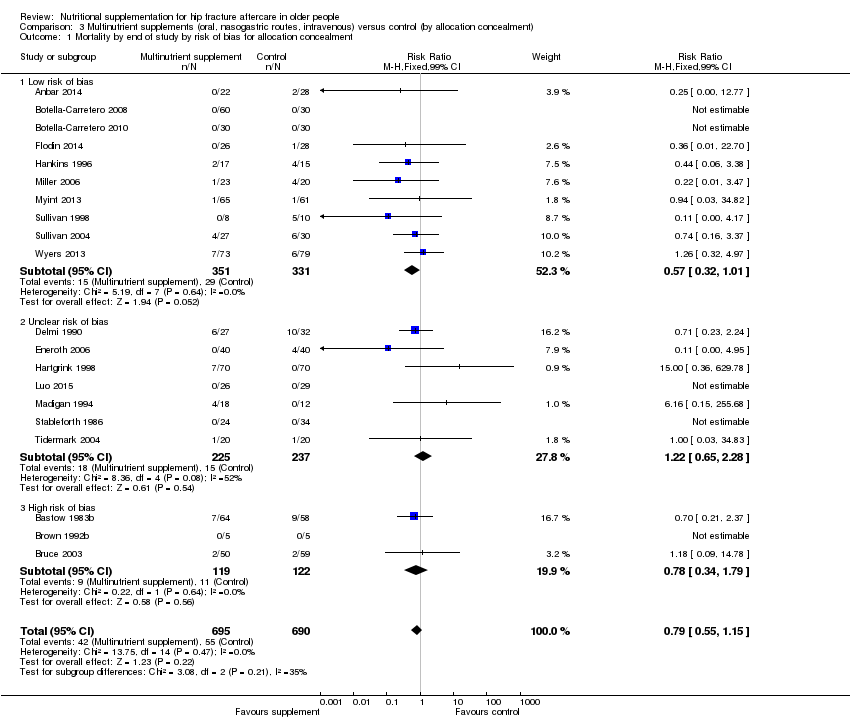
Comparison 3 Multinutrient supplements (oral, nasogastric routes, intravenous) versus control (by allocation concealment), Outcome 1 Mortality by end of study by risk of bias for allocation concealment.

Comparison 3 Multinutrient supplements (oral, nasogastric routes, intravenous) versus control (by allocation concealment), Outcome 2 Participants with complications at end of study by risk of bias for allocation concealment.

Comparison 4 High protein‐containing supplements versus low protein‐ or non‐protein‐containing supplements, Outcome 1 Mortality by end of study.

Comparison 4 High protein‐containing supplements versus low protein‐ or non‐protein‐containing supplements, Outcome 2 Unfavourable outcome (death or complications) at end of study.
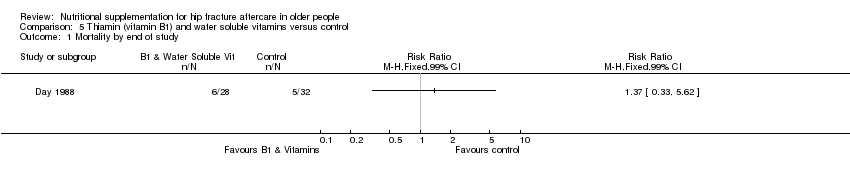
Comparison 5 Thiamin (vitamin B1) and water soluble vitamins versus control, Outcome 1 Mortality by end of study.

Comparison 5 Thiamin (vitamin B1) and water soluble vitamins versus control, Outcome 2 Participants with complications at end of study.

Comparison 6 Vitamin D versus control or lower dose supplementation, Outcome 1 Participants with complications at end of study.
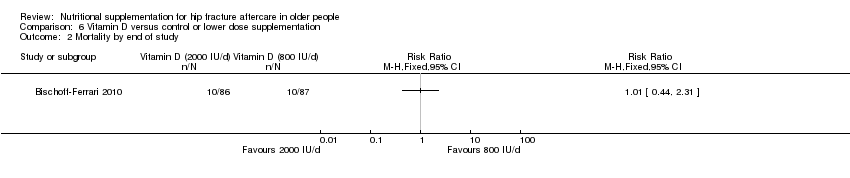
Comparison 6 Vitamin D versus control or lower dose supplementation, Outcome 2 Mortality by end of study.
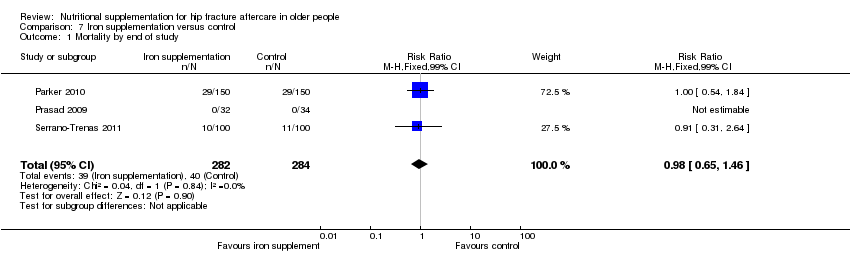
Comparison 7 Iron supplementation versus control, Outcome 1 Mortality by end of study.
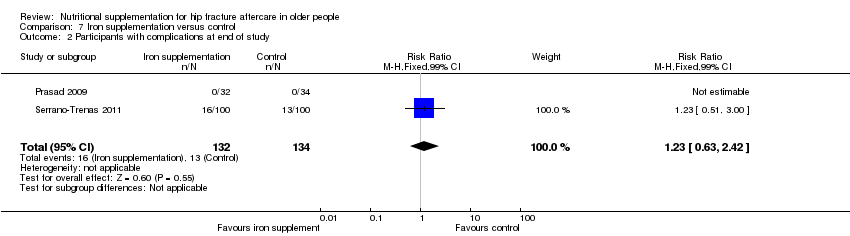
Comparison 7 Iron supplementation versus control, Outcome 2 Participants with complications at end of study.

Comparison 8 Taurine versus placebo, Outcome 1 Mortality by end of study.

Comparison 9 Dietetic assistants versus usual care, Outcome 1 Mortality by end of study.

Comparison 9 Dietetic assistants versus usual care, Outcome 2 Participants with complications at end of study.
| Multinutrient supplements (oral) versus control for hip fracture aftercare in older people | ||||||
| Patient or population: Older people undergoing hip fracture aftercare Comparison: Standard postoperative nutritional support and care in control groups | ||||||
| Outcomes | Illustrative comparative risks* (95% CI) | Relative effect | No of Participants | Quality of the evidence | Comments | |
| Assumed risk | Corresponding risk | |||||
| Control | Multinutrient supplements (oral) versus control | |||||
| Mortality by end of study Follow‐up: 1‐12 months | Study population | RR 0.81 | 968 | ⊕⊕⊝⊝ | The statistical test for subgroup differences between the results for the 5 trials targeting malnourished participants and those 10 trials not targeting malnourished participants did not confirm a difference between the two subgroups for mortality | |
| 72 per 10001 | 59 per 1000 | |||||
| High risk2 | ||||||
| 250 per 1000 | 203 per 1000 | |||||
| Participants with complications (e.g. pressure sore, chest infection) at end of study | Study population | RR 0.71 | 727 | ⊕⊕⊝⊝ | Only 2 trials targeting malnourished people reported these data | |
| 443 per 10004 | 315 per 1000 | |||||
| Moderate risk5 | ||||||
| 290 per 1000 | 206 per 1000 | |||||
| Unfavourable outcome 7 by end of study Follow‐up: 1‐12 months | Study population | RR 0.67 (0.51 to 0.89) | 334 (6 studies) | ⊕⊝⊝⊝ | Only 1 trial targeting malnourished people reported these data | |
| 500 per 10004 | 335 per 1000 (255 to 445) | |||||
| Putative side effects of treatment (e.g. vomiting and diarrhoea) Follow‐up: during supplementation period | Study population | RR 0.99 (0.47 to 2.05) | 442 (6 studies) | ⊕⊝⊝⊝ | Three of the 6 trials reported no adverse effects | |
| 50 per 10004 | 50 per 1000 (24 to 103) | |||||
| *The basis for the assumed risk (e.g. the median control group risk across studies) is provided in footnotes. The corresponding risk (and its 95% confidence interval) is based on the assumed risk in the comparison group and the relative effect of the intervention (and its 95% CI). | ||||||
| GRADE Working Group grades of evidence | ||||||
| 1. The control group risk is the median control group risk across the 9 studies that reported one or more deaths in the control group. | ||||||
| Multinutrient supplements (nasogastric) versus control for hip fracture aftercare in older people7 | ||||||
| Patient or population: Older people undergoing hip fracture aftercare Comparison: Standard postoperative nutritional support and care in control groups | ||||||
| Outcomes | Illustrative comparative risks* (95% CI) | Relative effect | No of Participants | Quality of the evidence | Comments | |
| Assumed risk | Corresponding risk | |||||
| Control | Multinutrient supplements (nasogastric) versus control | |||||
| Mortality by end of study | Study Population | RR: 0.99 (0.50 to 1.97) | 280 (3 studies) | ⊕⊝⊝⊝ | Only 1 trial targeting malnourished participants reported these data | |
| 156 per 10002 | 155 per 1000 (78 to 308) | |||||
| Participants with complications (e.g. pressure sore, aspiration pneumonia) at end of study | Study Population | RR: 1.09 (0.73 to 1.64) | 18 (1 study) | ⊕⊝⊝⊝ | For consistency we have presented 95% CI here but have used 99% CI for single trial data in the main text: 99% CI 0.64 to 1.86.6 | |
| 800 per 10004 | 872 per 1000 (584 to 1000) | |||||
| Unfavourable outcome Follow‐up: 1‐12 months | See comment | See comment | Outcome not reported | |||
| Putative side effects of treatment (e.g. aspiration pneumonia) Follow‐up: during supplementation period | See comment | See comment | Insufficient data to draw any conclusions. However, poor toleration of tube feeding was noted.1 There was no report of aspiration pneumonia (1 study; 140 participants). One study reported 18 (28% of 64) participants in the intervention group developed diarrhoea ‐ this was ascribed to antibiotics in 16 ‐ but did not report on the control group. One study (18 participants) reported 3 cases of "bloating" in the intervention group; it found no feed‐induced diarrhoea | |||
| *The basis for the assumed risk (e.g. the median control group risk across studies) is provided in footnotes. The corresponding risk (and its 95% confidence interval) is based on the assumed risk in the comparison group and the relative effect of the intervention (and its 95% CI). | ||||||
| GRADE Working Group grades of evidence the estimate. | ||||||
| 1. Nasogatric feeding was poorly tolerated but varied between studies. One study reported only 26% of the intervention group tolerated tube feeding for the full two weeks; another reported 78% completed the course (until hospital discharge). | ||||||
| Study ID | Intervention | Control | Mean difference (99% confidence intervaI) | ||||
| Multinutritional oral supplements | |||||||
| 22 | 10.1 | 3.2 | 28 | 12.5 | 5.5 | ‐2.40 days (‐5.60 to 0.80) | |
| 30 | 13.3 | 4.3 | 30 | 12.8 | 4.0 | 0.50 days (‐2.26 to 3.26) | |
| 5 | 27.00 | 10.00 | 5 | 48.00 | 37.00 | ‐21.00 days (‐65.15 to 23.15) | |
| 50 | 17.70 | 9.40 | 58 | 16.60 | 9.20 | 1.10 days (‐3.53 to 5.73) | |
| 18 | 16.00 | 8.00 | 12 | 15.00 | 11.00 | 1.00 day (‐8.51 to 10.51) | |
| 61 | 26.2 | 8.2 | 60 | 29.9 | 11.2 | ‐3.70 days (‐8.30 to 0.90) | |
| Nasogastric tube feeding | |||||||
| 8 | 38.20 | 36.90 | 7 | 23.70 | 20.00 | 14.50 days (‐24.34 to 53.34) | |
| High protein supplements | |||||||
| 85 | 16.40 | 6.60 | 86 | 17.20 | 7.70 | ‐0.80 days (‐3.62 to 2.02) | |
| 18 | 23.20 | 5.52 | 20 | 28.00 | 11.63 | ‐4.80 days (‐12.29 to 2.69) | |
| Iron supplementation versus control | |||||||
| 150 | 18.8 | 17.4 | 150 | 21.3 | 20.6 | ‐2.50 days (‐8.17 to 3.17) | |
| 99 | 13.5 | 7.1 | 97 | 13.1 | 6.9 | 0.40 days (‐2.18 to 2.98) | |
| Vitamin B1 | |||||||
| 28 | 35.00 | 34.00 | 30 | 29.00 | 30.00 | 6.00 days (‐15.75 to 27.75) | |
| Vitamin, mineral and amino acid supplementation versus control | |||||||
| 49 | 15.4 | 6.8 | 47 | 17.9 | 7.3 | ‐2.50 days (‐6.21 to 1.21) | |
| Semi‐essential amino acid | |||||||
| 111 | 13 | 10 | 123 | 13 | 11 | 0.00 days (‐3.54 to 3.54) | |
| SD: standard deviation | |||||||
| Outcome or subgroup title | No. of studies | No. of participants | Statistical method | Effect size |
| 1 Mortality by end of study Show forest plot | 20 | 1385 | Risk Ratio (M‐H, Fixed, 99% CI) | 0.79 [0.55, 1.15] |
| 1.1 Oral supplements | 15 | 968 | Risk Ratio (M‐H, Fixed, 99% CI) | 0.81 [0.49, 1.32] |
| 1.2 Nasogastric tube feeding | 3 | 280 | Risk Ratio (M‐H, Fixed, 99% CI) | 0.99 [0.50, 1.97] |
| 1.3 Nasogastric tube feeding and oral supplements | 1 | 57 | Risk Ratio (M‐H, Fixed, 99% CI) | 0.74 [0.23, 2.35] |
| 1.4 Intravenous feeding and oral supplements | 1 | 80 | Risk Ratio (M‐H, Fixed, 99% CI) | 0.11 [0.01, 2.00] |
| 2 Participants with complications at end of study Show forest plot | 14 | 882 | Risk Ratio (M‐H, Fixed, 99% CI) | 0.69 [0.59, 0.81] |
| 2.1 Oral supplements | 11 | 727 | Risk Ratio (M‐H, Fixed, 99% CI) | 0.71 [0.59, 0.86] |
| 2.2 Nasogastric tube feeding | 1 | 18 | Risk Ratio (M‐H, Fixed, 99% CI) | 1.09 [0.73, 1.64] |
| 2.3 Nasogastric tube feeding and oral supplements | 1 | 57 | Risk Ratio (M‐H, Fixed, 99% CI) | 1.11 [0.75, 1.65] |
| 2.4 Intravenous feeding and oral supplements | 1 | 80 | Risk Ratio (M‐H, Fixed, 99% CI) | 0.21 [0.10, 0.46] |
| 3 Participants with complications at end of study: random‐effects model Show forest plot | 14 | 882 | Risk Ratio (M‐H, Random, 99% CI) | 0.70 [0.53, 0.91] |
| 3.1 Oral supplements | 11 | 727 | Risk Ratio (M‐H, Random, 99% CI) | 0.72 [0.58, 0.89] |
| 3.2 Nasogastric tube feeding | 1 | 18 | Risk Ratio (M‐H, Random, 99% CI) | 1.09 [0.73, 1.64] |
| 3.3 Nasogastric tube feeding and oral supplements | 1 | 57 | Risk Ratio (M‐H, Random, 99% CI) | 1.11 [0.75, 1.65] |
| 3.4 Intravenous feeding and oral supplements | 1 | 80 | Risk Ratio (M‐H, Random, 99% CI) | 0.21 [0.10, 0.46] |
| 4 Unfavourable outcome (death or complications) at end of study Show forest plot | 6 | 334 | Risk Ratio (M‐H, Fixed, 99% CI) | 0.67 [0.51, 0.89] |
| 4.1 Oral supplements | 6 | 334 | Risk Ratio (M‐H, Fixed, 99% CI) | 0.67 [0.51, 0.89] |
| 4.2 Nasogastric tube feeding | 0 | 0 | Risk Ratio (M‐H, Fixed, 99% CI) | 0.0 [0.0, 0.0] |
| 4.3 Nasogastric tube feeding and oral supplements | 0 | 0 | Risk Ratio (M‐H, Fixed, 99% CI) | 0.0 [0.0, 0.0] |
| 4.4 Intravenous feeding and oral supplements | 0 | 0 | Risk Ratio (M‐H, Fixed, 99% CI) | 0.0 [0.0, 0.0] |
| 5 Unfavourable outcome (death or complications) ‐ oral supplements extra analyses Show forest plot | 6 | Risk Ratio (M‐H, Fixed, 99% CI) | Subtotals only | |
| 5.1 Oral supplements: worst case scenario | 6 | 353 | Risk Ratio (M‐H, Fixed, 99% CI) | 0.81 [0.62, 1.04] |
| 5.2 Oral supplements: Hankins 1996 acute hospital data | 1 | 31 | Risk Ratio (M‐H, Fixed, 99% CI) | 0.96 [0.71, 1.31] |
| 5.3 Oral supplements: Hankins 1996 post discharge | 1 | 31 | Risk Ratio (M‐H, Fixed, 99% CI) | 1.10 [0.50, 2.41] |
| 6 Adverse effects (putatively related to treatment) Show forest plot | 8 | Risk Ratio (M‐H, Fixed, 99% CI) | Subtotals only | |
| 6.1 Oral supplements (mainly diarrhoea or/and vomiting) | 6 | 442 | Risk Ratio (M‐H, Fixed, 99% CI) | 0.99 [0.47, 2.05] |
| 6.2 Nasogatric tube feeding | 1 | 18 | Risk Ratio (M‐H, Fixed, 99% CI) | 8.56 [0.51, 144.86] |
| 6.3 Intravenous feeding and oral supplements | 1 | 57 | Risk Ratio (M‐H, Fixed, 99% CI) | 1.85 [0.49, 7.03] |
| 6.4 Nasogastric tube feeding and oral supplements | 0 | 0 | Risk Ratio (M‐H, Fixed, 99% CI) | 0.0 [0.0, 0.0] |
| Outcome or subgroup title | No. of studies | No. of participants | Statistical method | Effect size |
| 1 Mortality by end of study Show forest plot | 20 | 1385 | Risk Ratio (M‐H, Fixed, 99% CI) | 0.79 [0.55, 1.15] |
| 1.1 Malnourished targeted | 6 | 388 | Risk Ratio (M‐H, Fixed, 99% CI) | 0.55 [0.27, 1.11] |
| 1.2 Malnourished not targeted | 14 | 997 | Risk Ratio (M‐H, Fixed, 99% CI) | 0.92 [0.59, 1.42] |
| 2 Mortality by end of study ‐ oral supplements only Show forest plot | 15 | 968 | Risk Ratio (M‐H, Fixed, 99% CI) | 0.81 [0.49, 1.32] |
| 2.1 Malnourished targeted | 5 | 266 | Risk Ratio (M‐H, Fixed, 99% CI) | 0.39 [0.13, 1.20] |
| 2.2 Malnourished not targeted | 10 | 702 | Risk Ratio (M‐H, Fixed, 99% CI) | 0.99 [0.56, 1.72] |
| 3 Participants with complications at end of study Show forest plot | 14 | 882 | Risk Ratio (M‐H, Fixed, 99% CI) | 0.69 [0.59, 0.81] |
| 3.1 Malnourished targeted | 2 | 150 | Risk Ratio (M‐H, Fixed, 99% CI) | 0.64 [0.46, 0.89] |
| 3.2 Malnourished not targeted | 12 | 732 | Risk Ratio (M‐H, Fixed, 99% CI) | 0.70 [0.59, 0.84] |
| 4 Unfavourable outcome (death or complications) at end of study Show forest plot | 6 | 334 | Risk Ratio (M‐H, Fixed, 99% CI) | 0.67 [0.51, 0.89] |
| 4.1 Malnourished targeted | 1 | 29 | Risk Ratio (M‐H, Fixed, 99% CI) | 0.47 [0.17, 1.31] |
| 4.2 Malnourished not targeted | 5 | 305 | Risk Ratio (M‐H, Fixed, 99% CI) | 0.70 [0.52, 0.93] |
| Outcome or subgroup title | No. of studies | No. of participants | Statistical method | Effect size |
| 1 Mortality by end of study by risk of bias for allocation concealment Show forest plot | 20 | 1385 | Risk Ratio (M‐H, Fixed, 99% CI) | 0.79 [0.55, 1.15] |
| 1.1 Low risk of bias | 10 | 682 | Risk Ratio (M‐H, Fixed, 99% CI) | 0.57 [0.32, 1.01] |
| 1.2 Unclear risk of bias | 7 | 462 | Risk Ratio (M‐H, Fixed, 99% CI) | 1.22 [0.65, 2.28] |
| 1.3 High risk of bias | 3 | 241 | Risk Ratio (M‐H, Fixed, 99% CI) | 0.78 [0.34, 1.79] |
| 2 Participants with complications at end of study by risk of bias for allocation concealment Show forest plot | 14 | 882 | Risk Ratio (M‐H, Fixed, 99% CI) | 0.69 [0.59, 0.81] |
| 2.1 Low risk of bias | 9 | 622 | Risk Ratio (M‐H, Fixed, 99% CI) | 0.78 [0.66, 0.92] |
| 2.2 Unclear risk of bias | 5 | 260 | Risk Ratio (M‐H, Fixed, 99% CI) | 0.38 [0.24, 0.61] |
| 2.3 High risk of bias | 0 | 0 | Risk Ratio (M‐H, Fixed, 99% CI) | 0.0 [0.0, 0.0] |
| Outcome or subgroup title | No. of studies | No. of participants | Statistical method | Effect size |
| 1 Mortality by end of study Show forest plot | 4 | 361 | Risk Ratio (M‐H, Fixed, 99% CI) | 1.42 [0.85, 2.37] |
| 1.1 Protein‐containing supplement v non‐protein‐containing supplement | 3 | 315 | Risk Ratio (M‐H, Fixed, 99% CI) | 1.38 [0.82, 2.34] |
| 1.2 High protein‐containing supplement v low protein‐containing supplement | 1 | 46 | Risk Ratio (M‐H, Fixed, 99% CI) | 2.18 [0.21, 22.42] |
| 2 Unfavourable outcome (death or complications) at end of study Show forest plot | 2 | 223 | Risk Ratio (M‐H, Fixed, 99% CI) | 0.78 [0.65, 0.95] |
| 2.1 Protein‐containing supplement v non‐protein‐containing supplement | 2 | 223 | Risk Ratio (M‐H, Fixed, 99% CI) | 0.78 [0.65, 0.95] |
| Outcome or subgroup title | No. of studies | No. of participants | Statistical method | Effect size |
| 1 Mortality by end of study Show forest plot | 1 | Risk Ratio (M‐H, Fixed, 99% CI) | Totals not selected | |
| 2 Participants with complications at end of study Show forest plot | 1 | Risk Ratio (M‐H, Fixed, 99% CI) | Totals not selected | |
| Outcome or subgroup title | No. of studies | No. of participants | Statistical method | Effect size |
| 1 Participants with complications at end of study Show forest plot | 1 | Risk Ratio (M‐H, Fixed, 99% CI) | Totals not selected | |
| 2 Mortality by end of study Show forest plot | 1 | Risk Ratio (M‐H, Fixed, 95% CI) | Totals not selected | |
| Outcome or subgroup title | No. of studies | No. of participants | Statistical method | Effect size |
| 1 Mortality by end of study Show forest plot | 3 | 566 | Risk Ratio (M‐H, Fixed, 99% CI) | 0.98 [0.65, 1.46] |
| 2 Participants with complications at end of study Show forest plot | 2 | 266 | Risk Ratio (M‐H, Fixed, 99% CI) | 1.23 [0.63, 2.42] |
| Outcome or subgroup title | No. of studies | No. of participants | Statistical method | Effect size |
| 1 Mortality by end of study Show forest plot | 1 | Risk Ratio (M‐H, Fixed, 99% CI) | Totals not selected | |
| Outcome or subgroup title | No. of studies | No. of participants | Statistical method | Effect size |
| 1 Mortality by end of study Show forest plot | 1 | Risk Ratio (M‐H, Fixed, 99% CI) | Totals not selected | |
| 2 Participants with complications at end of study Show forest plot | 1 | Risk Ratio (M‐H, Fixed, 99% CI) | Totals not selected | |