Scolaris Content Display Scolaris Content Display

Comparison 1 Multinutrient supplement (oral or nasogastric routes, or both) versus control, Outcome 1 Mortality by end of study.
Figuras y tablas -
Analysis 1.1

Comparison 1 Multinutrient supplement (oral or nasogastric routes, or both) versus control, Outcome 1 Mortality by end of study.

Comparison 1 Multinutrient supplement (oral or nasogastric routes, or both) versus control, Outcome 2 Patients with complications at end of study.
Figuras y tablas -
Analysis 1.2

Comparison 1 Multinutrient supplement (oral or nasogastric routes, or both) versus control, Outcome 2 Patients with complications at end of study.

Comparison 1 Multinutrient supplement (oral or nasogastric routes, or both) versus control, Outcome 3 Unfavourable outcome (death or complications) at end of study.
Figuras y tablas -
Analysis 1.3

Comparison 1 Multinutrient supplement (oral or nasogastric routes, or both) versus control, Outcome 3 Unfavourable outcome (death or complications) at end of study.

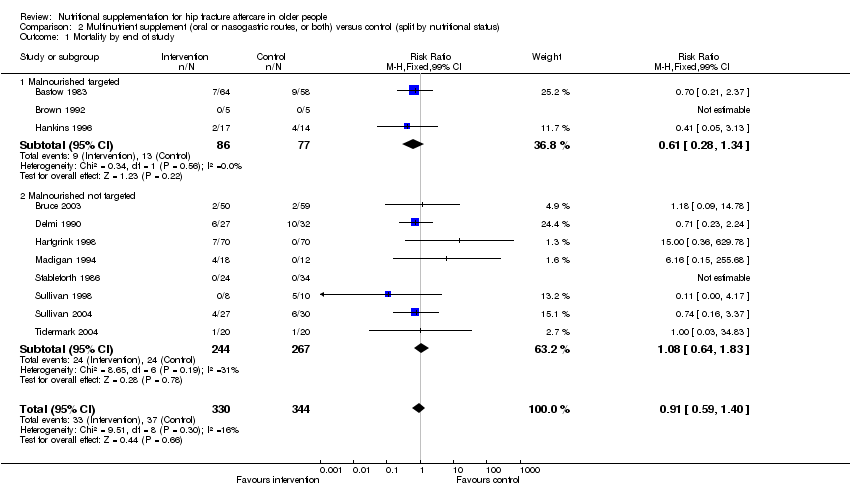
Comparison 2 Multinutrient supplement (oral or nasogastric routes, or both) versus control (split by nutritional status), Outcome 1 Mortality by end of study.
Figuras y tablas -
Analysis 2.1

Comparison 2 Multinutrient supplement (oral or nasogastric routes, or both) versus control (split by nutritional status), Outcome 1 Mortality by end of study.

Comparison 2 Multinutrient supplement (oral or nasogastric routes, or both) versus control (split by nutritional status), Outcome 2 Patients with complications at end of study.
Figuras y tablas -
Analysis 2.2

Comparison 2 Multinutrient supplement (oral or nasogastric routes, or both) versus control (split by nutritional status), Outcome 2 Patients with complications at end of study.

Comparison 2 Multinutrient supplement (oral or nasogastric routes, or both) versus control (split by nutritional status), Outcome 3 Unfavourable outcome (death or complications) at end of study.
Figuras y tablas -
Analysis 2.3

Comparison 2 Multinutrient supplement (oral or nasogastric routes, or both) versus control (split by nutritional status), Outcome 3 Unfavourable outcome (death or complications) at end of study.

Comparison 3 Multinutrient supplement (oral or nasogastric routes, or both) versus control (by allocation concealment), Outcome 1 Mortality by end of study (concealed? = yes; unknown; no).
Figuras y tablas -
Analysis 3.1

Comparison 3 Multinutrient supplement (oral or nasogastric routes, or both) versus control (by allocation concealment), Outcome 1 Mortality by end of study (concealed? = yes; unknown; no).

Comparison 4 High protein containing supplement versus low protein or non‐protein containing supplement, Outcome 1 Mortality by end of study.
Figuras y tablas -
Analysis 4.1

Comparison 4 High protein containing supplement versus low protein or non‐protein containing supplement, Outcome 1 Mortality by end of study.

Comparison 4 High protein containing supplement versus low protein or non‐protein containing supplement, Outcome 2 Unfavourable outcome (death or complications) at end of study.
Figuras y tablas -
Analysis 4.2

Comparison 4 High protein containing supplement versus low protein or non‐protein containing supplement, Outcome 2 Unfavourable outcome (death or complications) at end of study.

Comparison 5 Thiamin (vitamin B1) and water soluble vitamins versus control, Outcome 1 Mortality by end of study.
Figuras y tablas -
Analysis 5.1

Comparison 5 Thiamin (vitamin B1) and water soluble vitamins versus control, Outcome 1 Mortality by end of study.

Comparison 5 Thiamin (vitamin B1) and water soluble vitamins versus control, Outcome 2 Patients with complications at end of study.
Figuras y tablas -
Analysis 5.2

Comparison 5 Thiamin (vitamin B1) and water soluble vitamins versus control, Outcome 2 Patients with complications at end of study.

Comparison 6 Vitamin D versus control, Outcome 1 Patients with complications at end of study.
Figuras y tablas -
Analysis 6.1

Comparison 6 Vitamin D versus control, Outcome 1 Patients with complications at end of study.

Comparison 7 Dietetic assistants versus usual care, Outcome 1 Mortality by end of study.
Figuras y tablas -
Analysis 7.1

Comparison 7 Dietetic assistants versus usual care, Outcome 1 Mortality by end of study.

Comparison 7 Dietetic assistants versus usual care, Outcome 2 Patients with complications at end of study.
Figuras y tablas -
Analysis 7.2

Comparison 7 Dietetic assistants versus usual care, Outcome 2 Patients with complications at end of study.

Table 1. Quality assessment items

Items and scores

a. Was the assigned treatment adequately concealed prior to allocation?
2 = method did not allow disclosure of assignment (A)
1 = small but possible chance of disclosure of assignment or states random but no description(B)
0 = quasi‐randomised (C)

b. Were the outcomes of patients who withdrew described and included in the analysis (intention to treat)?
2 = intention‐to‐treat analysis based on all cases randomised possible or carried out
1 = states number and reasons for withdrawal but intention‐to‐treat analysis not possible
0 = not mentioned or not possible

c. Were the outcome assessors blinded to treatment status?
2 = action taken to blind assessors, or outcomes such that bias is unlikely
1 = small or moderate chance of unblinding of assessors
0 = not mentioned

d. Were the treatment and control group comparable at entry?
2 = good comparability of groups, or confounding adjusted for in analysis
1 = confounding small; mentioned but not adjusted for
0 = large potential for confounding, or not discussed

e. Were care programmes, other than the trial options, identical?
2 = care programmes clearly identical
1 = clear but unimportant differences
0 = not mentioned or clear and important differences in care programmes

f. Were the inclusion and exclusion criteria clearly defined?
2 = clearly defined
1 = inadequately defined
0 = not defined

g. Were the interventions clearly defined (including estimates of nutritional value)?
2 = clearly defined interventions are applied with a standardised protocol
1 = clearly defined interventions are applied but the application protocol is not standardised
0 = intervention and/or application protocol are poorly or not defined

h. Were the participants blind to assignment status following allocation?
2 = effective action taken to blind subjects
1 = small or moderate chance of unblinding subjects
0 = not possible, or not mentioned (unless double‐blind), or possible but not done

i. Were the treatment providers blind to assignment status?
2 = effective action taken to blind treatment providers
1 = small or moderate chance of unblinding of treatment providers
0 = not possible, or not mentioned (unless double‐blind), or possible but not done

j. Was follow‐up active and appropriate?
2 = optimal
1 = adequate
0 = not defined or not adequate

k. Was the overall duration of surveillance clinically appropriate?
2 = optimal (six months or more)
1 = adequate (one up to six months)
0 = not defined, or not adequate

Figuras y tablas -
Table 1. Quality assessment items
Comparison 1. Multinutrient supplement (oral or nasogastric routes, or both) versus control

Outcome or subgroup title

No. of studies

No. of participants

Statistical method

Effect size

1 Mortality by end of study Show forest plot

11

674

Risk Ratio (M‐H, Fixed, 99% CI)

0.91 [0.59, 1.40]

1.1 Oral supplement

7

337

Risk Ratio (M‐H, Fixed, 99% CI)

0.89 [0.47, 1.68]

1.2 Nasogastric tube feeding

3

280

Risk Ratio (M‐H, Fixed, 99% CI)

0.99 [0.50, 1.97]

1.3 Nasogastric tube feeding and oral supplement

1

57

Risk Ratio (M‐H, Fixed, 99% CI)

0.74 [0.23, 2.35]

2 Patients with complications at end of study Show forest plot

7

284

Risk Ratio (M‐H, Fixed, 99% CI)

0.85 [0.64, 1.13]

2.1 Oral supplement

5

209

Risk Ratio (M‐H, Fixed, 99% CI)

0.61 [0.36, 1.03]

2.2 Nasogastric tube feeding

1

18

Risk Ratio (M‐H, Fixed, 99% CI)

1.09 [0.73, 1.64]

2.3 Nasogastric tube feeding and oral supplement

1

57

Risk Ratio (M‐H, Fixed, 99% CI)

1.11 [0.75, 1.65]

3 Unfavourable outcome (death or complications) at end of study Show forest plot

3

139

Risk Ratio (M‐H, Fixed, 99% CI)

0.52 [0.32, 0.84]

3.1 Oral supplement

3

139

Risk Ratio (M‐H, Fixed, 99% CI)

0.52 [0.32, 0.84]

3.2 Nasogastric tube feeding

0

0

Risk Ratio (M‐H, Fixed, 99% CI)

0.0 [0.0, 0.0]

3.3 Nasogastric tube feeding and oral supplement

0

0

Risk Ratio (M‐H, Fixed, 99% CI)

0.0 [0.0, 0.0]

Figuras y tablas -
Comparison 1. Multinutrient supplement (oral or nasogastric routes, or both) versus control
Comparison 2. Multinutrient supplement (oral or nasogastric routes, or both) versus control (split by nutritional status)

Outcome or subgroup title

No. of studies

No. of participants

Statistical method

Effect size

1 Mortality by end of study Show forest plot

11

674

Risk Ratio (M‐H, Fixed, 99% CI)

0.91 [0.59, 1.40]

1.1 Malnourished targeted

3

163

Risk Ratio (M‐H, Fixed, 99% CI)

0.61 [0.28, 1.34]

1.2 Malnourished not targeted

8

511

Risk Ratio (M‐H, Fixed, 99% CI)

1.08 [0.64, 1.83]

2 Patients with complications at end of study Show forest plot

7

284

Risk Ratio (M‐H, Fixed, 99% CI)

0.85 [0.64, 1.13]

2.1 Malnourished targeted

1

29

Risk Ratio (M‐H, Fixed, 99% CI)

0.59 [0.23, 1.49]

2.2 Malnourished not targeted

6

255

Risk Ratio (M‐H, Fixed, 99% CI)

0.89 [0.66, 1.20]

3 Unfavourable outcome (death or complications) at end of study Show forest plot

3

139

Risk Ratio (M‐H, Fixed, 99% CI)

0.52 [0.32, 0.84]

3.1 Malnourished targeted

1

29

Risk Ratio (M‐H, Fixed, 99% CI)

0.47 [0.17, 1.31]

3.2 Malnourished not targeted

2

110

Risk Ratio (M‐H, Fixed, 99% CI)

0.54 [0.32, 0.92]

Figuras y tablas -
Comparison 2. Multinutrient supplement (oral or nasogastric routes, or both) versus control (split by nutritional status)
Comparison 3. Multinutrient supplement (oral or nasogastric routes, or both) versus control (by allocation concealment)

Outcome or subgroup title

No. of studies

No. of participants

Statistical method

Effect size

1 Mortality by end of study (concealed? = yes; unknown; no) Show forest plot

11

674

Risk Ratio (M‐H, Fixed, 99% CI)

0.91 [0.59, 1.40]

1.1 Allocation concealed

3

106

Risk Ratio (M‐H, Fixed, 99% CI)

0.44 [0.19, 1.02]

1.2 Uncertain if allocation concealed

5

327

Risk Ratio (M‐H, Fixed, 99% CI)

1.66 [0.83, 3.31]

1.3 Allocation not concealed (quasi‐randomised)

3

241

Risk Ratio (M‐H, Fixed, 99% CI)

0.78 [0.34, 1.79]

Figuras y tablas -
Comparison 3. Multinutrient supplement (oral or nasogastric routes, or both) versus control (by allocation concealment)
Comparison 4. High protein containing supplement versus low protein or non‐protein containing supplement

Outcome or subgroup title

No. of studies

No. of participants

Statistical method

Effect size

1 Mortality by end of study Show forest plot

4

361

Risk Ratio (M‐H, Fixed, 99% CI)

1.42 [0.85, 2.37]

1.1 Protein containing supplement v non‐protein containing supplement

3

315

Risk Ratio (M‐H, Fixed, 99% CI)

1.38 [0.82, 2.34]

1.2 High protein containing supplement v low protein containing supplement

1

46

Risk Ratio (M‐H, Fixed, 99% CI)

2.18 [0.21, 22.42]

2 Unfavourable outcome (death or complications) at end of study Show forest plot

2

223

Risk Ratio (M‐H, Fixed, 99% CI)

0.78 [0.65, 0.95]

2.1 Protein containing supplement v non‐protein containing supplement

2

223

Risk Ratio (M‐H, Fixed, 99% CI)

0.78 [0.65, 0.95]

2.2 High protein containing supplement v low protein containing supplement

0

0

Risk Ratio (M‐H, Fixed, 99% CI)

0.0 [0.0, 0.0]

Figuras y tablas -
Comparison 4. High protein containing supplement versus low protein or non‐protein containing supplement
Comparison 5. Thiamin (vitamin B1) and water soluble vitamins versus control

Outcome or subgroup title

No. of studies

No. of participants

Statistical method

Effect size

1 Mortality by end of study Show forest plot

1

Risk Ratio (M‐H, Fixed, 99% CI)

Totals not selected

2 Patients with complications at end of study Show forest plot

1

Risk Ratio (M‐H, Fixed, 99% CI)

Totals not selected

Figuras y tablas -
Comparison 5. Thiamin (vitamin B1) and water soluble vitamins versus control
Comparison 6. Vitamin D versus control

Outcome or subgroup title

No. of studies

No. of participants

Statistical method

Effect size

1 Patients with complications at end of study Show forest plot

1

Risk Ratio (M‐H, Fixed, 99% CI)

Totals not selected

Figuras y tablas -
Comparison 6. Vitamin D versus control
Comparison 7. Dietetic assistants versus usual care

Outcome or subgroup title

No. of studies

No. of participants

Statistical method

Effect size

1 Mortality by end of study Show forest plot

1

Risk Ratio (M‐H, Fixed, 99% CI)

Totals not selected

2 Patients with complications at end of study Show forest plot

1

Risk Ratio (M‐H, Fixed, 99% CI)

Totals not selected

Figuras y tablas -
Comparison 7. Dietetic assistants versus usual care