Cribaje con mamografía para el cáncer de mama
Información
- DOI:
- https://doi.org/10.1002/14651858.CD001877.pub5Copiar DOI

- Base de datos:
-
- Cochrane Database of Systematic Reviews
- Versión publicada:
-
- 04 junio 2013see what's new
- Tipo:
-
- Intervention
- Etapa:
-
- Review
- Grupo Editorial Cochrane:
-
Grupo Cochrane de Cáncer de mama
- Copyright:
-
- Copyright © 2013 The Cochrane Collaboration. Published by John Wiley & Sons, Ltd.
Cifras del artículo
Altmetric:
Citado por:
Autores
Contributions of authors
PCG wrote the draft protocol and did the searches. Two authors extracted the main data independently and contributed to the review. PCG is guarantor.
Sources of support
Internal sources
-
Rigshospitalet, Denmark.
External sources
-
Danish Institute for Health Technology Assessment, Denmark.
Declarations of interest
None. We had no a priori opinion on the effect of screening for breast cancer when we were asked by the Danish National Board of Health in 1999 to review the randomised trials.
Acknowledgements
We thank Freda Alexander, Ingvar Andersson, Cornelia Baines, Niels Bjurstam, Gunnar Fagerberg, Jan Frisell, Anthony B Miller and Sam Shapiro for comments on their trials, Friederike M Perl for pointing out an inconsistency in one of the trials, Mike Clarke for advice, Ole Olsen who was an author on the 2001 version of this review and wrote the draft section on methodological quality of the trials for that version, Kay Dickersin for comments on the 2006 update of the review, and Margrethe Nielsen who was an author on the 2006 and 2009 updates.
Version history
| Published | Title | Stage | Authors | Version |
| 2013 Jun 04 | Screening for breast cancer with mammography | Review | Peter C Gøtzsche, Karsten Juhl Jørgensen | |
| 2011 Jan 19 | Screening for breast cancer with mammography | Review | Peter C Gøtzsche, Margrethe Nielsen | |
| 2009 Oct 07 | Screening for breast cancer with mammography | Review | Peter C Gøtzsche, Margrethe Nielsen | |
| 2009 Jul 08 | Screening for breast cancer with mammography | Review | Peter C Gøtzsche, Margrethe Nielsen | |
| 2001 Oct 23 | Screening for breast cancer with mammography | Review | Ole Olsen, Peter C Gøtzsche | |
Differences between protocol and review
A new outcome was added when we discovered that breast cancer mortality is an unreliable outcome. This was mortality from any cancer.
Keywords
MeSH
Medical Subject Headings (MeSH) Keywords
Medical Subject Headings Check Words
Adult; Aged; Female; Humans; Middle Aged;
PICO
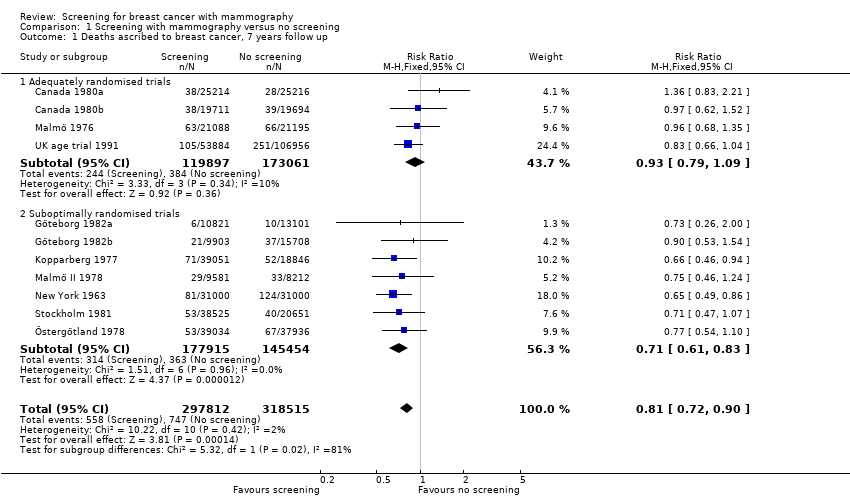
Comparison 1 Screening with mammography versus no screening, Outcome 1 Deaths ascribed to breast cancer, 7 years follow up.
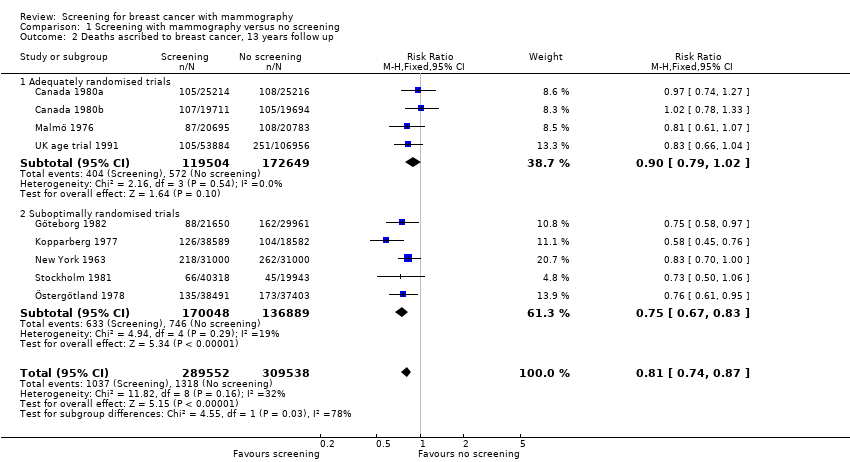
Comparison 1 Screening with mammography versus no screening, Outcome 2 Deaths ascribed to breast cancer, 13 years follow up.

Comparison 1 Screening with mammography versus no screening, Outcome 3 Deaths ascribed to breast cancer, 7 years follow up, women below 50 years of age (Malmö 55).

Comparison 1 Screening with mammography versus no screening, Outcome 4 Deaths ascribed to breast cancer, 7 years follow up, women at least 50 years of age (Malmö 55).

Comparison 1 Screening with mammography versus no screening, Outcome 5 Deaths ascribed to breast cancer, 13 years follow up, women below 50 years of age.
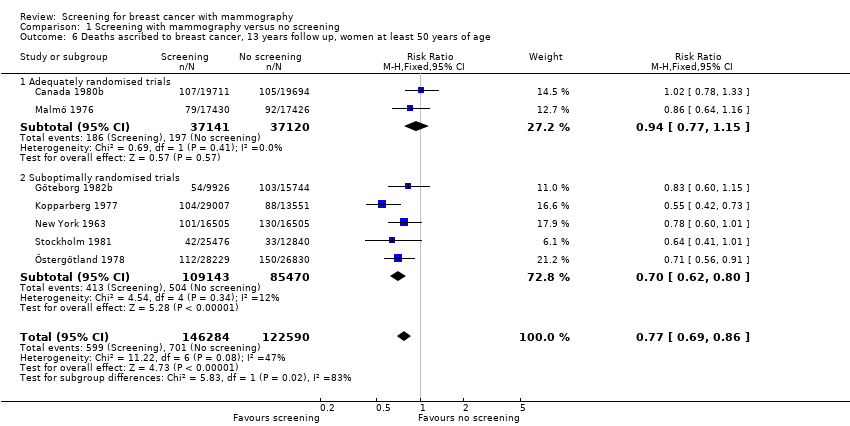
Comparison 1 Screening with mammography versus no screening, Outcome 6 Deaths ascribed to breast cancer, 13 years follow up, women at least 50 years of age.

Comparison 1 Screening with mammography versus no screening, Outcome 7 Deaths ascribed to any cancer, all women.

Comparison 1 Screening with mammography versus no screening, Outcome 8 Overall mortality, 7 years follow up.

Comparison 1 Screening with mammography versus no screening, Outcome 9 Overall mortality, 13 years follow up.
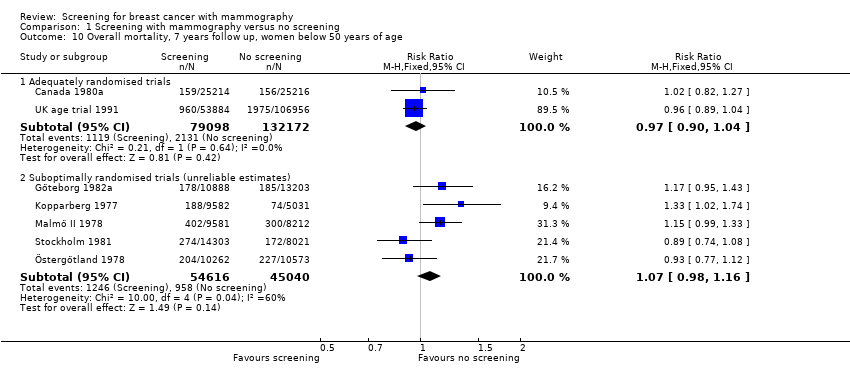
Comparison 1 Screening with mammography versus no screening, Outcome 10 Overall mortality, 7 years follow up, women below 50 years of age.

Comparison 1 Screening with mammography versus no screening, Outcome 11 Overall mortality, 7 years follow up, women at least 50 years of age.

Comparison 1 Screening with mammography versus no screening, Outcome 12 Overall mortality, 13 years follow up, women below 50 years of age.

Comparison 1 Screening with mammography versus no screening, Outcome 13 Overall mortality, 13 years follow up, women at least 50 years of age.

Comparison 1 Screening with mammography versus no screening, Outcome 14 Number of mastectomies and lumpectomies.

Comparison 1 Screening with mammography versus no screening, Outcome 15 Number of mastectomies.

Comparison 1 Screening with mammography versus no screening, Outcome 16 Number treated with radiotherapy.
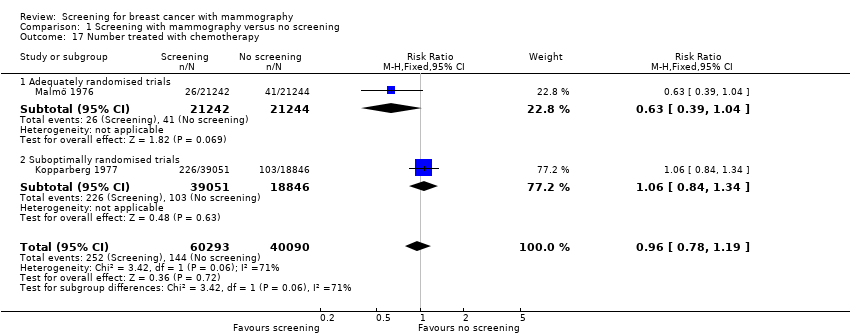
Comparison 1 Screening with mammography versus no screening, Outcome 17 Number treated with chemotherapy.
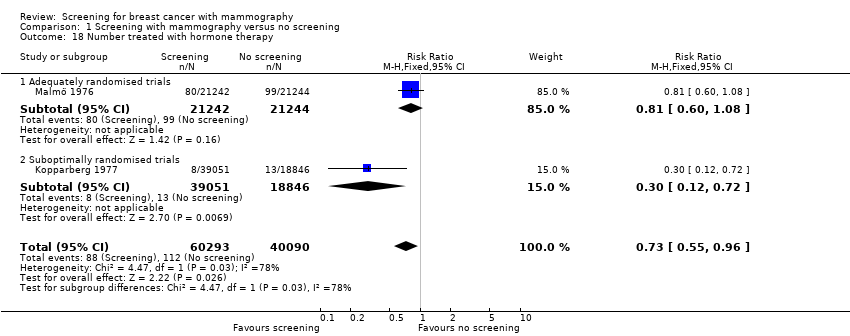
Comparison 1 Screening with mammography versus no screening, Outcome 18 Number treated with hormone therapy.
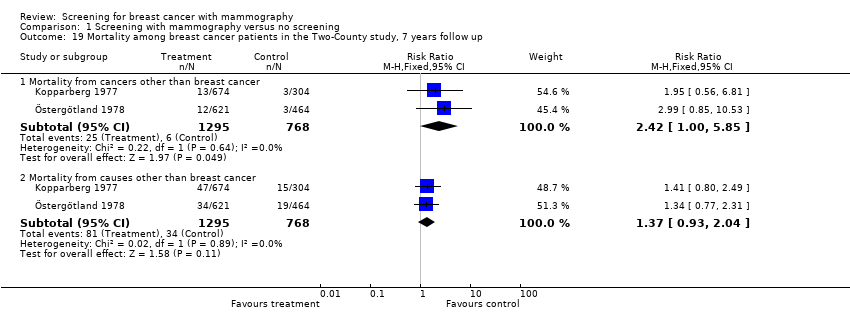
Comparison 1 Screening with mammography versus no screening, Outcome 19 Mortality among breast cancer patients in the Two‐County study, 7 years follow up.
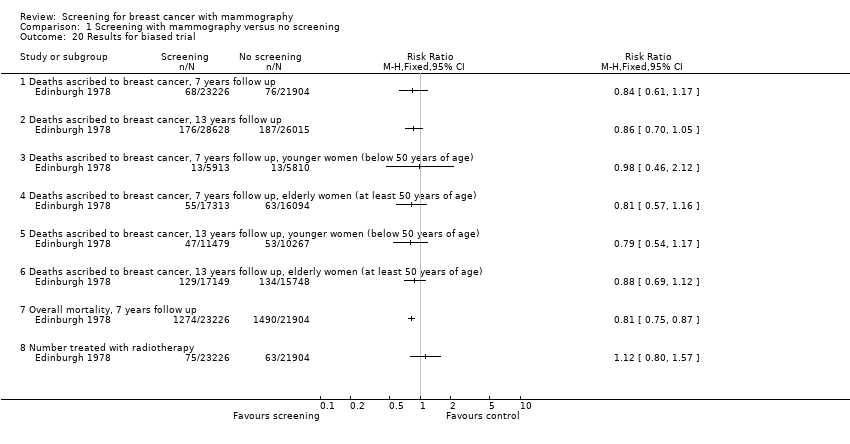
Comparison 1 Screening with mammography versus no screening, Outcome 20 Results for biased trial.

Comparison 1 Screening with mammography versus no screening, Outcome 21 Number of cancers.
| Study | Age range | Study group | Control group | Reference |
| Malmö | 40‐74 | 21242 | 21240 | |
| 40‐74 | 21242 | 21244 | ||
| 40‐74 | 21088 | 21195 | ||
| Kopparberg | total | 47389 | 22658 | |
| 40‐74 | 39051 | 18846 | ||
| 40‐74 | 38589 | 18582 | ||
| 40‐74 | 38562 | 18478 | ||
| 40‐74 | 38589 | 18582 | ||
| 40‐74 | 38568 | 18479 | ||
| 40‐74 | 38588 | 18582 | ||
| 40‐74 | data not available | data not available | ||
| 40‐49 | 9625 | 5053 | ||
| 40‐49 | data not available | data not available | ||
| 40‐49 | 9582 | 5031 | ||
| 40‐49 | 9650 | 5009 | ||
| Östergötland | total | 47001 | 45933 | |
| 40‐74 | 39034 | 37936 | ||
| 40‐74 | 38491 | 37403 | ||
| 40‐74 | 38405 | 37145 | ||
| 40‐74 | 38491 | 37403 | ||
| 40‐74 | 38942 | 37675 | ||
| 40‐74 | 39105 | 37858 | ||
| 40‐74 | 38942 | 37675 | ||
| 40‐49 | 10312 | 10625 | ||
| 40‐49 | data not available | data not available | ||
| 40‐49 | 10262 | 10573 | ||
| 40‐49 | 10240 | 10411 | ||
| Stockholm | 40‐64 | 40318 | 19943 | |
| 40‐65 (sic) | 38525 | 20651 | ||
| 40‐64 | 40318 | 19943 | ||
| 40‐69 | 39139 | 20978 | ||
| 40‐49 | data not available | data not available | ||
| 40‐49 | 14842 | 7103 | ||
| 40‐49 | 14185 | 7985 | ||
| 40‐49 | 14303 | 8021 | ||
| Göteborg | 40‐59 | 20724 | 28809 | |
| 39‐59 | 21650 | 29961 | ||
| 40‐59 | 21000 | 29200 | ||
| 40‐49 | 10821 | 13101 | ||
| 39‐49 | 11724 | 14217 | ||
| 40‐49 | 10888 | 13203 |
| Outcome or subgroup title | No. of studies | No. of participants | Statistical method | Effect size |
| 1 Deaths ascribed to breast cancer, 7 years follow up Show forest plot | 11 | 616327 | Risk Ratio (M‐H, Fixed, 95% CI) | 0.81 [0.72, 0.90] |
| 1.1 Adequately randomised trials | 4 | 292958 | Risk Ratio (M‐H, Fixed, 95% CI) | 0.93 [0.79, 1.09] |
| 1.2 Suboptimally randomised trials | 7 | 323369 | Risk Ratio (M‐H, Fixed, 95% CI) | 0.71 [0.61, 0.83] |
| 2 Deaths ascribed to breast cancer, 13 years follow up Show forest plot | 9 | 599090 | Risk Ratio (M‐H, Fixed, 95% CI) | 0.81 [0.74, 0.87] |
| 2.1 Adequately randomised trials | 4 | 292153 | Risk Ratio (M‐H, Fixed, 95% CI) | 0.90 [0.79, 1.02] |
| 2.2 Suboptimally randomised trials | 5 | 306937 | Risk Ratio (M‐H, Fixed, 95% CI) | 0.75 [0.67, 0.83] |
| 3 Deaths ascribed to breast cancer, 7 years follow up, women below 50 years of age (Malmö 55) Show forest plot | 9 | 356368 | Risk Ratio (M‐H, Fixed, 95% CI) | 0.89 [0.77, 1.04] |
| 3.1 Adequately randomised trials | 3 | 227333 | Risk Ratio (M‐H, Fixed, 95% CI) | 0.94 [0.78, 1.14] |
| 3.2 Suboptimally randomised trials | 6 | 129035 | Risk Ratio (M‐H, Fixed, 95% CI) | 0.81 [0.63, 1.05] |
| 4 Deaths ascribed to breast cancer, 7 years follow up, women at least 50 years of age (Malmö 55) Show forest plot | 7 | 261044 | Risk Ratio (M‐H, Fixed, 95% CI) | 0.72 [0.62, 0.85] |
| 4.1 Adequately randomised trials | 2 | 65625 | Risk Ratio (M‐H, Fixed, 95% CI) | 0.88 [0.64, 1.20] |
| 4.2 Suboptimally randomised trials | 5 | 195419 | Risk Ratio (M‐H, Fixed, 95% CI) | 0.67 [0.56, 0.81] |
| 5 Deaths ascribed to breast cancer, 13 years follow up, women below 50 years of age Show forest plot | 8 | 329511 | Risk Ratio (M‐H, Fixed, 95% CI) | 0.84 [0.73, 0.96] |
| 5.1 Adequately randomised trials | 3 | 218697 | Risk Ratio (M‐H, Fixed, 95% CI) | 0.87 [0.73, 1.03] |
| 5.2 Suboptimally randomised trials | 5 | 110814 | Risk Ratio (M‐H, Fixed, 95% CI) | 0.80 [0.64, 0.98] |
| 6 Deaths ascribed to breast cancer, 13 years follow up, women at least 50 years of age Show forest plot | 7 | 268874 | Risk Ratio (M‐H, Fixed, 95% CI) | 0.77 [0.69, 0.86] |
| 6.1 Adequately randomised trials | 2 | 74261 | Risk Ratio (M‐H, Fixed, 95% CI) | 0.94 [0.77, 1.15] |
| 6.2 Suboptimally randomised trials | 5 | 194613 | Risk Ratio (M‐H, Fixed, 95% CI) | 0.70 [0.62, 0.80] |
| 7 Deaths ascribed to any cancer, all women Show forest plot | 6 | Risk Ratio (M‐H, Fixed, 95% CI) | Subtotals only | |
| 7.1 Adequately randomised trials | 3 | 132118 | Risk Ratio (M‐H, Fixed, 95% CI) | 1.02 [0.95, 1.10] |
| 7.2 Suboptimally randomised trials (unreliable estimates) | 3 | 195871 | Risk Ratio (M‐H, Fixed, 95% CI) | 0.99 [0.93, 1.06] |
| 8 Overall mortality, 7 years follow up Show forest plot | 11 | Risk Ratio (M‐H, Fixed, 95% CI) | Subtotals only | |
| 8.1 Adequately randomised trials | 4 | 292958 | Risk Ratio (M‐H, Fixed, 95% CI) | 0.98 [0.94, 1.03] |
| 8.2 Suboptimally randomised trials (unreliable estimates) | 7 | 324977 | Risk Ratio (M‐H, Fixed, 95% CI) | 0.99 [0.96, 1.02] |
| 9 Overall mortality, 13 years follow up Show forest plot | 8 | Risk Ratio (M‐H, Fixed, 95% CI) | Subtotals only | |
| 9.1 Adequately randomised trials | 4 | 292958 | Risk Ratio (M‐H, Fixed, 95% CI) | 0.99 [0.95, 1.03] |
| 9.2 Suboptimally randomised trials (unreliable estimates) | 4 | 244868 | Risk Ratio (M‐H, Fixed, 95% CI) | 0.99 [0.97, 1.01] |
| 10 Overall mortality, 7 years follow up, women below 50 years of age Show forest plot | 7 | Risk Ratio (M‐H, Fixed, 95% CI) | Subtotals only | |
| 10.1 Adequately randomised trials | 2 | 211270 | Risk Ratio (M‐H, Fixed, 95% CI) | 0.97 [0.90, 1.04] |
| 10.2 Suboptimally randomised trials (unreliable estimates) | 5 | 99656 | Risk Ratio (M‐H, Fixed, 95% CI) | 1.07 [0.98, 1.16] |
| 11 Overall mortality, 7 years follow up, women at least 50 years of age Show forest plot | 5 | Risk Ratio (M‐H, Fixed, 95% CI) | Subtotals only | |
| 11.1 Adequately randomised trials | 1 | 39405 | Risk Ratio (M‐H, Fixed, 95% CI) | 1.01 [0.85, 1.20] |
| 11.2 Suboptimally randomised trials (unreliable estimates) | 4 | 161519 | Risk Ratio (M‐H, Fixed, 95% CI) | 0.97 [0.94, 1.00] |
| 12 Overall mortality, 13 years follow up, women below 50 years of age Show forest plot | 6 | Risk Ratio (M‐H, Fixed, 95% CI) | Subtotals only | |
| 12.1 Adequately randomised trials | 3 | 219324 | Risk Ratio (M‐H, Fixed, 95% CI) | 0.98 [0.92, 1.04] |
| 12.2 Suboptimally randomised trials (unreliable estimates) | 3 | 61344 | Risk Ratio (M‐H, Fixed, 95% CI) | 1.00 [0.92, 1.10] |
| 13 Overall mortality, 13 years follow up, women at least 50 years of age Show forest plot | 4 | Risk Ratio (M‐H, Fixed, 95% CI) | Subtotals only | |
| 13.1 Adequately randomised trials | 2 | 73634 | Risk Ratio (M‐H, Fixed, 95% CI) | 1.00 [0.95, 1.04] |
| 13.2 Suboptimally randomised trials (unreliable estimates) | 2 | 98261 | Risk Ratio (M‐H, Fixed, 95% CI) | 0.99 [0.97, 1.02] |
| 14 Number of mastectomies and lumpectomies Show forest plot | 5 | 250479 | Risk Ratio (M‐H, Fixed, 95% CI) | 1.35 [1.26, 1.44] |
| 14.1 Adequately randomised trials | 3 | 132321 | Risk Ratio (M‐H, Fixed, 95% CI) | 1.31 [1.22, 1.42] |
| 14.2 Suboptimally randomised trials | 2 | 118158 | Risk Ratio (M‐H, Fixed, 95% CI) | 1.42 [1.26, 1.61] |
| 15 Number of mastectomies Show forest plot | 5 | 250479 | Risk Ratio (M‐H, Fixed, 95% CI) | 1.20 [1.11, 1.30] |
| 15.1 Adequately randomised trials | 3 | 132321 | Risk Ratio (M‐H, Fixed, 95% CI) | 1.20 [1.08, 1.32] |
| 15.2 Suboptimally randomised trials | 2 | 118158 | Risk Ratio (M‐H, Fixed, 95% CI) | 1.21 [1.06, 1.38] |
| 16 Number treated with radiotherapy Show forest plot | 2 | 100383 | Risk Ratio (M‐H, Fixed, 95% CI) | 1.32 [1.16, 1.50] |
| 16.1 Adequately randomised trials | 1 | 42486 | Risk Ratio (M‐H, Fixed, 95% CI) | 1.24 [1.04, 1.49] |
| 16.2 Suboptimally randomised trials | 1 | 57897 | Risk Ratio (M‐H, Fixed, 95% CI) | 1.40 [1.17, 1.69] |
| 17 Number treated with chemotherapy Show forest plot | 2 | 100383 | Risk Ratio (M‐H, Fixed, 95% CI) | 0.96 [0.78, 1.19] |
| 17.1 Adequately randomised trials | 1 | 42486 | Risk Ratio (M‐H, Fixed, 95% CI) | 0.63 [0.39, 1.04] |
| 17.2 Suboptimally randomised trials | 1 | 57897 | Risk Ratio (M‐H, Fixed, 95% CI) | 1.06 [0.84, 1.34] |
| 18 Number treated with hormone therapy Show forest plot | 2 | 100383 | Risk Ratio (M‐H, Fixed, 95% CI) | 0.73 [0.55, 0.96] |
| 18.1 Adequately randomised trials | 1 | 42486 | Risk Ratio (M‐H, Fixed, 95% CI) | 0.81 [0.60, 1.08] |
| 18.2 Suboptimally randomised trials | 1 | 57897 | Risk Ratio (M‐H, Fixed, 95% CI) | 0.30 [0.12, 0.72] |
| 19 Mortality among breast cancer patients in the Two‐County study, 7 years follow up Show forest plot | 2 | Risk Ratio (M‐H, Fixed, 95% CI) | Subtotals only | |
| 19.1 Mortality from cancers other than breast cancer | 2 | 2063 | Risk Ratio (M‐H, Fixed, 95% CI) | 2.42 [1.00, 5.85] |
| 19.2 Mortality from causes other than breast cancer | 2 | 2063 | Risk Ratio (M‐H, Fixed, 95% CI) | 1.37 [0.93, 2.04] |
| 20 Results for biased trial Show forest plot | 1 | Risk Ratio (M‐H, Fixed, 95% CI) | Totals not selected | |
| 20.1 Deaths ascribed to breast cancer, 7 years follow up | 1 | Risk Ratio (M‐H, Fixed, 95% CI) | 0.0 [0.0, 0.0] | |
| 20.2 Deaths ascribed to breast cancer, 13 years follow up | 1 | Risk Ratio (M‐H, Fixed, 95% CI) | 0.0 [0.0, 0.0] | |
| 20.3 Deaths ascribed to breast cancer, 7 years follow up, younger women (below 50 years of age) | 1 | Risk Ratio (M‐H, Fixed, 95% CI) | 0.0 [0.0, 0.0] | |
| 20.4 Deaths ascribed to breast cancer, 7 years follow up, elderly women (at least 50 years of age) | 1 | Risk Ratio (M‐H, Fixed, 95% CI) | 0.0 [0.0, 0.0] | |
| 20.5 Deaths ascribed to breast cancer, 13 years follow up, younger women (below 50 years of age) | 1 | Risk Ratio (M‐H, Fixed, 95% CI) | 0.0 [0.0, 0.0] | |
| 20.6 Deaths ascribed to breast cancer, 13 years follow up, elderly women (at least 50 years of age) | 1 | Risk Ratio (M‐H, Fixed, 95% CI) | 0.0 [0.0, 0.0] | |
| 20.7 Overall mortality, 7 years follow up | 1 | Risk Ratio (M‐H, Fixed, 95% CI) | 0.0 [0.0, 0.0] | |
| 20.8 Number treated with radiotherapy | 1 | Risk Ratio (M‐H, Fixed, 95% CI) | 0.0 [0.0, 0.0] | |
| 21 Number of cancers Show forest plot | 7 | 512246 | Risk Ratio (M‐H, Fixed, 95% CI) | 1.29 [1.23, 1.35] |
| 21.1 Adequately randomised trials (after 7‐9 years) | 4 | 292979 | Risk Ratio (M‐H, Fixed, 95% CI) | 1.25 [1.18, 1.34] |
| 21.2 Suboptimally randomised trials (before control group screen) | 3 | 219267 | Risk Ratio (M‐H, Fixed, 95% CI) | 1.33 [1.24, 1.44] |