| 1 Deaths ascribed to breast cancer, 7 years follow up Show forest plot | 10 | 455487 | Risk Ratio (M‐H, Fixed, 95% CI) | 0.80 [0.70, 0.91] |
|
| 1.1 Adequately randomised trials | 3 | 132118 | Risk Ratio (M‐H, Fixed, 95% CI) | 1.05 [0.83, 1.33] |
| 1.2 Suboptimally randomised trials | 7 | 323369 | Risk Ratio (M‐H, Fixed, 95% CI) | 0.71 [0.61, 0.83] |
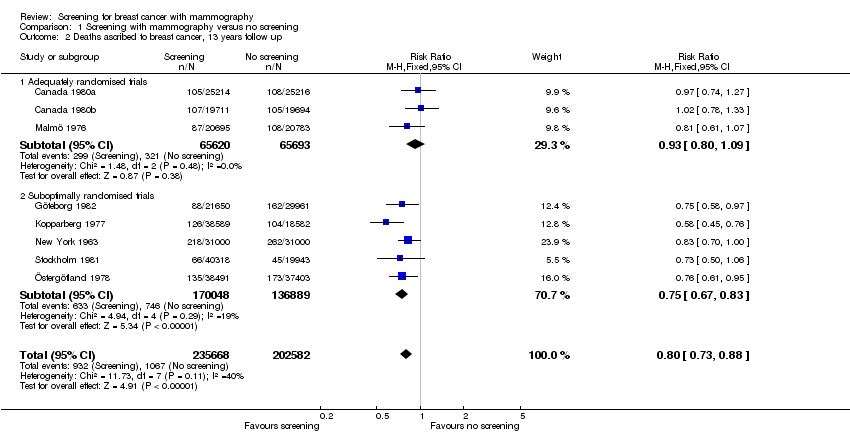
| 2 Deaths ascribed to breast cancer, 13 years follow up Show forest plot | 8 | 438250 | Risk Ratio (M‐H, Fixed, 95% CI) | 0.80 [0.73, 0.88] |
|
| 2.1 Adequately randomised trials | 3 | 131313 | Risk Ratio (M‐H, Fixed, 95% CI) | 0.93 [0.80, 1.09] |
| 2.2 Suboptimally randomised trials | 5 | 306937 | Risk Ratio (M‐H, Fixed, 95% CI) | 0.75 [0.67, 0.83] |
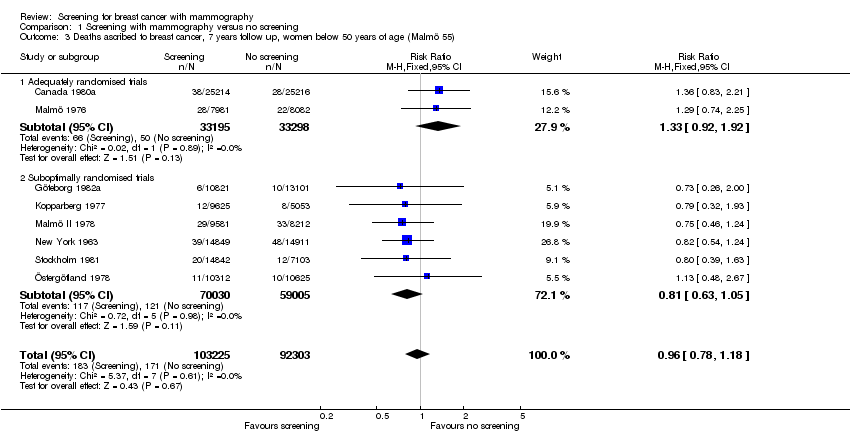
| 3 Deaths ascribed to breast cancer, 7 years follow up, women below 50 years of age (Malmö 55) Show forest plot | 8 | 195528 | Risk Ratio (M‐H, Fixed, 95% CI) | 0.96 [0.78, 1.18] |
|
| 3.1 Adequately randomised trials | 2 | 66493 | Risk Ratio (M‐H, Fixed, 95% CI) | 1.33 [0.92, 1.92] |
| 3.2 Suboptimally randomised trials | 6 | 129035 | Risk Ratio (M‐H, Fixed, 95% CI) | 0.81 [0.63, 1.05] |
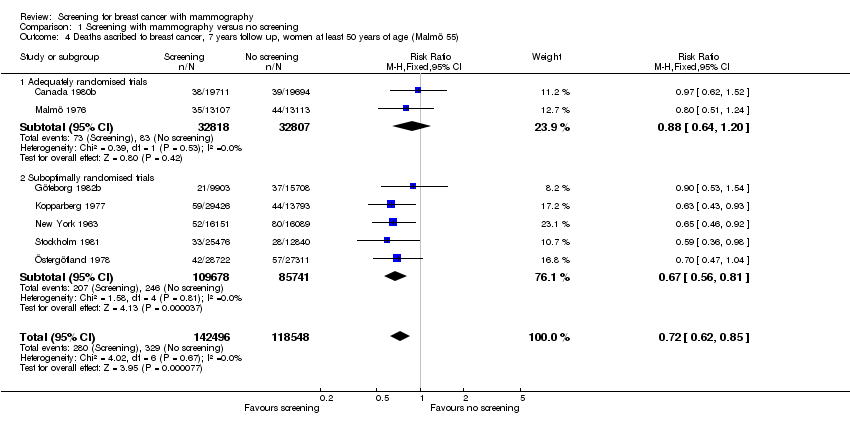
| 4 Deaths ascribed to breast cancer, 7 years follow up, women at least 50 years of age (Malmö 55) Show forest plot | 7 | 261044 | Risk Ratio (M‐H, Fixed, 95% CI) | 0.72 [0.62, 0.85] |
|
| 4.1 Adequately randomised trials | 2 | 65625 | Risk Ratio (M‐H, Fixed, 95% CI) | 0.88 [0.64, 1.20] |
| 4.2 Suboptimally randomised trials | 5 | 195419 | Risk Ratio (M‐H, Fixed, 95% CI) | 0.67 [0.56, 0.81] |
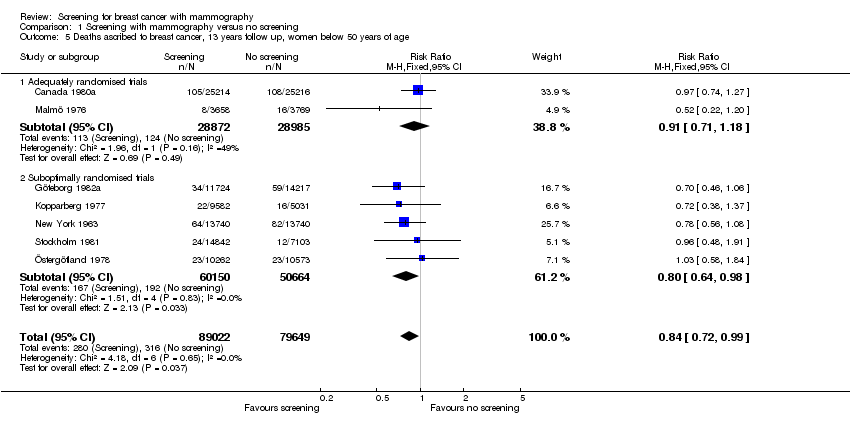
| 5 Deaths ascribed to breast cancer, 13 years follow up, women below 50 years of age Show forest plot | 7 | 168671 | Risk Ratio (M‐H, Fixed, 95% CI) | 0.84 [0.72, 0.99] |
|
| 5.1 Adequately randomised trials | 2 | 57857 | Risk Ratio (M‐H, Fixed, 95% CI) | 0.91 [0.71, 1.18] |
| 5.2 Suboptimally randomised trials | 5 | 110814 | Risk Ratio (M‐H, Fixed, 95% CI) | 0.80 [0.64, 0.98] |
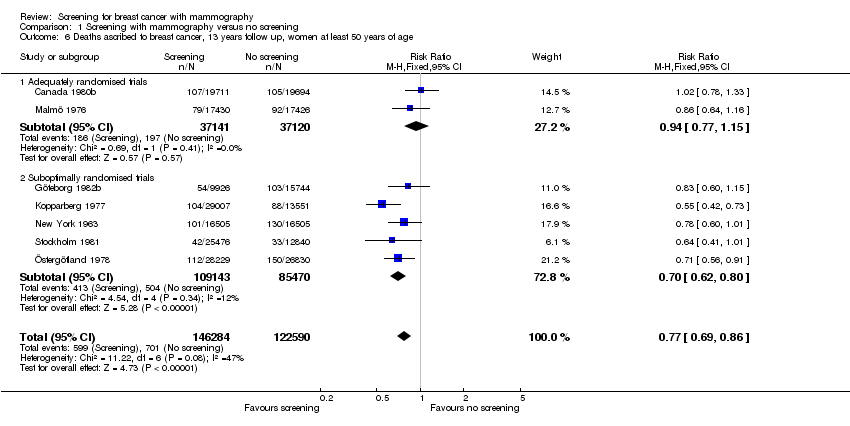
| 6 Deaths ascribed to breast cancer, 13 years follow up, women at least 50 years of age Show forest plot | 7 | 268874 | Risk Ratio (M‐H, Fixed, 95% CI) | 0.77 [0.69, 0.86] |
|
| 6.1 Adequately randomised trials | 2 | 74261 | Risk Ratio (M‐H, Fixed, 95% CI) | 0.94 [0.77, 1.15] |
| 6.2 Suboptimally randomised trials | 5 | 194613 | Risk Ratio (M‐H, Fixed, 95% CI) | 0.70 [0.62, 0.80] |
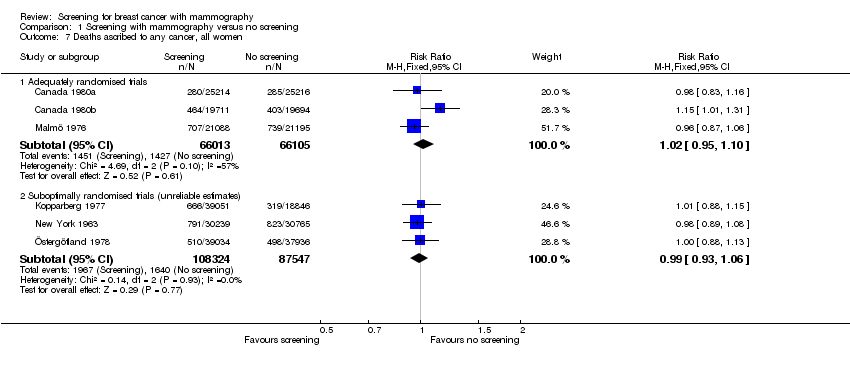
| 7 Deaths ascribed to any cancer, all women Show forest plot | 6 | | Risk Ratio (M‐H, Fixed, 95% CI) | Subtotals only |
|
| 7.1 Adequately randomised trials | 3 | 132118 | Risk Ratio (M‐H, Fixed, 95% CI) | 1.02 [0.95, 1.10] |
| 7.2 Suboptimally randomised trials (unreliable estimates) | 3 | 195871 | Risk Ratio (M‐H, Fixed, 95% CI) | 0.99 [0.93, 1.06] |
| 8 Overall mortality, 7 years follow up Show forest plot | 10 | | Risk Ratio (M‐H, Fixed, 95% CI) | Subtotals only |
|
| 8.1 Adequately randomised trials | 3 | 132118 | Risk Ratio (M‐H, Fixed, 95% CI) | 0.99 [0.94, 1.05] |
| 8.2 Suboptimally randomised trials (unreliable estimates) | 7 | 324977 | Risk Ratio (M‐H, Fixed, 95% CI) | 0.99 [0.96, 1.02] |
| 9 Overall mortality, 13 years follow up Show forest plot | 7 | | Risk Ratio (M‐H, Fixed, 95% CI) | Subtotals only |
|
| 9.1 Adequately randomised trials | 3 | 132118 | Risk Ratio (M‐H, Fixed, 95% CI) | 1.00 [0.96, 1.04] |
| 9.2 Suboptimally randomised trials (unreliable estimates) | 4 | 244868 | Risk Ratio (M‐H, Fixed, 95% CI) | 0.99 [0.97, 1.01] |
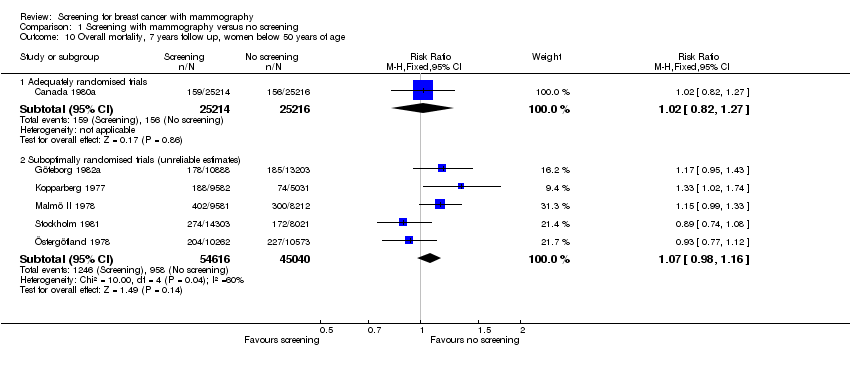
| 10 Overall mortality, 7 years follow up, women below 50 years of age Show forest plot | 6 | | Risk Ratio (M‐H, Fixed, 95% CI) | Subtotals only |
|
| 10.1 Adequately randomised trials | 1 | 50430 | Risk Ratio (M‐H, Fixed, 95% CI) | 1.02 [0.82, 1.27] |
| 10.2 Suboptimally randomised trials (unreliable estimates) | 5 | 99656 | Risk Ratio (M‐H, Fixed, 95% CI) | 1.07 [0.98, 1.16] |
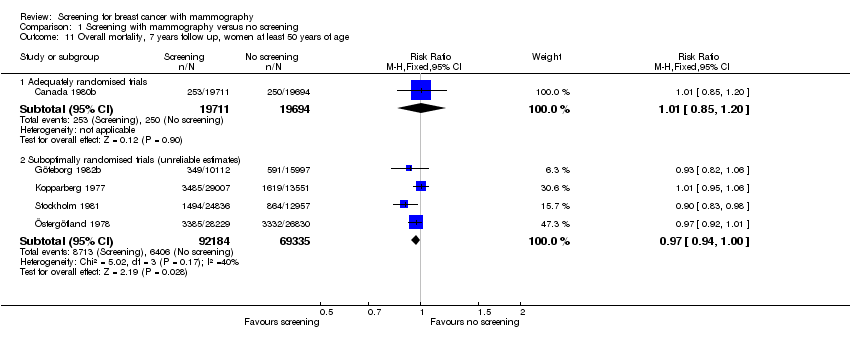
| 11 Overall mortality, 7 years follow up, women at least 50 years of age Show forest plot | 5 | | Risk Ratio (M‐H, Fixed, 95% CI) | Subtotals only |
|
| 11.1 Adequately randomised trials | 1 | 39405 | Risk Ratio (M‐H, Fixed, 95% CI) | 1.01 [0.85, 1.20] |
| 11.2 Suboptimally randomised trials (unreliable estimates) | 4 | 161519 | Risk Ratio (M‐H, Fixed, 95% CI) | 0.97 [0.94, 1.00] |
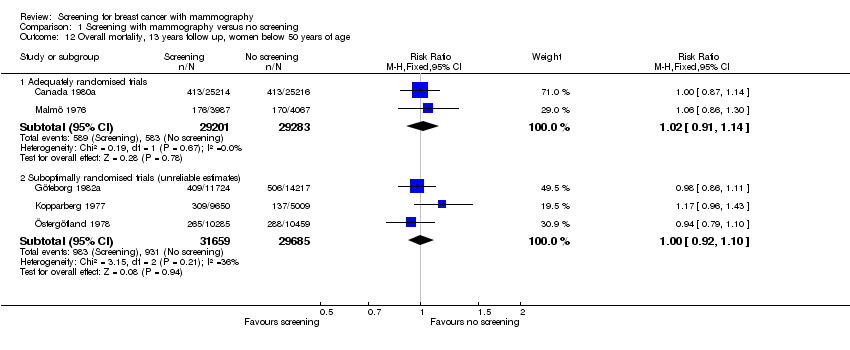
| 12 Overall mortality, 13 years follow up, women below 50 years of age Show forest plot | 5 | | Risk Ratio (M‐H, Fixed, 95% CI) | Subtotals only |
|
| 12.1 Adequately randomised trials | 2 | 58484 | Risk Ratio (M‐H, Fixed, 95% CI) | 1.02 [0.91, 1.14] |
| 12.2 Suboptimally randomised trials (unreliable estimates) | 3 | 61344 | Risk Ratio (M‐H, Fixed, 95% CI) | 1.00 [0.92, 1.10] |
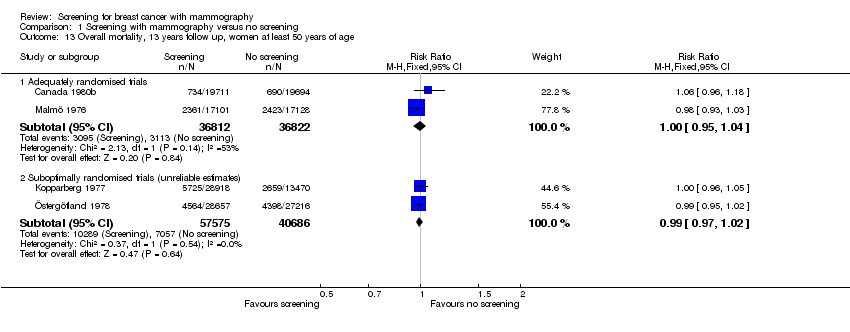
| 13 Overall mortality, 13 years follow up, women at least 50 years of age Show forest plot | 4 | | Risk Ratio (M‐H, Fixed, 95% CI) | Subtotals only |
|
| 13.1 Adequately randomised trials | 2 | 73634 | Risk Ratio (M‐H, Fixed, 95% CI) | 1.00 [0.95, 1.04] |
| 13.2 Suboptimally randomised trials (unreliable estimates) | 2 | 98261 | Risk Ratio (M‐H, Fixed, 95% CI) | 0.99 [0.97, 1.02] |
| 14 Number of mastectomies and lumpectomies Show forest plot | 5 | 250479 | Risk Ratio (M‐H, Fixed, 95% CI) | 1.35 [1.26, 1.44] |
|
| 14.1 Adequately randomised trials | 3 | 132321 | Risk Ratio (M‐H, Fixed, 95% CI) | 1.31 [1.22, 1.42] |
| 14.2 Suboptimally randomised trials | 2 | 118158 | Risk Ratio (M‐H, Fixed, 95% CI) | 1.42 [1.26, 1.61] |
| 15 Number of mastectomies Show forest plot | 5 | 250479 | Risk Ratio (M‐H, Fixed, 95% CI) | 1.20 [1.11, 1.30] |
|
| 15.1 Adequately randomised trials | 3 | 132321 | Risk Ratio (M‐H, Fixed, 95% CI) | 1.20 [1.08, 1.32] |
| 15.2 Suboptimally randomised trials | 2 | 118158 | Risk Ratio (M‐H, Fixed, 95% CI) | 1.21 [1.06, 1.38] |
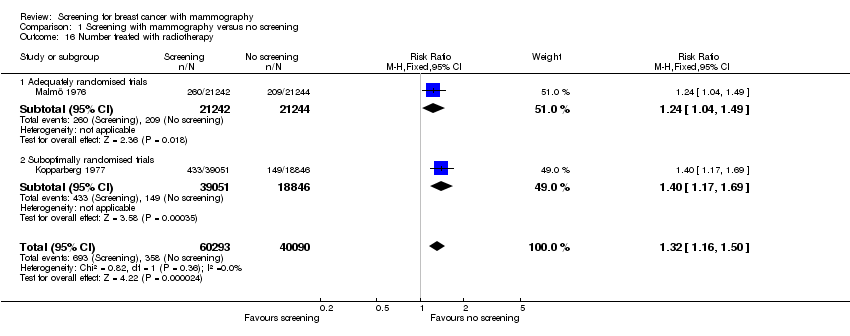
| 16 Number treated with radiotherapy Show forest plot | 2 | 100383 | Risk Ratio (M‐H, Fixed, 95% CI) | 1.32 [1.16, 1.50] |
|
| 16.1 Adequately randomised trials | 1 | 42486 | Risk Ratio (M‐H, Fixed, 95% CI) | 1.24 [1.04, 1.49] |
| 16.2 Suboptimally randomised trials | 1 | 57897 | Risk Ratio (M‐H, Fixed, 95% CI) | 1.40 [1.17, 1.69] |
| 17 Number treated with chemotherapy Show forest plot | 2 | 100383 | Risk Ratio (M‐H, Fixed, 95% CI) | 0.96 [0.78, 1.19] |
|
| 17.1 Adequately randomised trials | 1 | 42486 | Risk Ratio (M‐H, Fixed, 95% CI) | 0.63 [0.39, 1.04] |
| 17.2 Suboptimally randomised trials | 1 | 57897 | Risk Ratio (M‐H, Fixed, 95% CI) | 1.06 [0.84, 1.34] |
| 18 Number treated with hormone therapy Show forest plot | 2 | 100383 | Risk Ratio (M‐H, Fixed, 95% CI) | 0.73 [0.55, 0.96] |
|
| 18.1 Adequately randomised trials | 1 | 42486 | Risk Ratio (M‐H, Fixed, 95% CI) | 0.81 [0.60, 1.08] |
| 18.2 Suboptimally randomised trials | 1 | 57897 | Risk Ratio (M‐H, Fixed, 95% CI) | 0.30 [0.12, 0.72] |
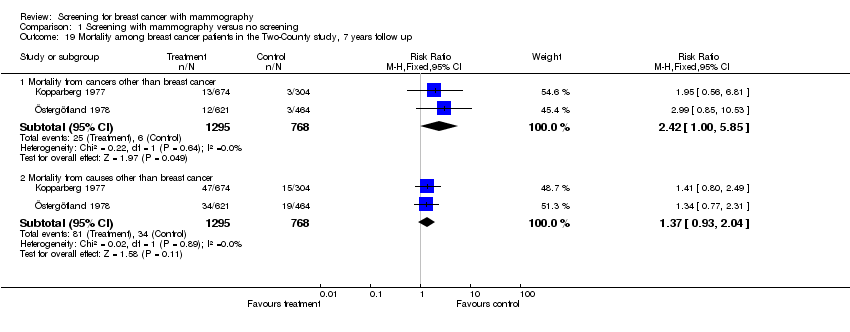
| 19 Mortality among breast cancer patients in the Two‐County study, 7 years follow up Show forest plot | 2 | | Risk Ratio (M‐H, Fixed, 95% CI) | Subtotals only |
|
| 19.1 Mortality from cancers other than breast cancer | 2 | 2063 | Risk Ratio (M‐H, Fixed, 95% CI) | 2.42 [1.00, 5.85] |
| 19.2 Mortality from causes other than breast cancer | 2 | 2063 | Risk Ratio (M‐H, Fixed, 95% CI) | 1.37 [0.93, 2.04] |
| 20 Results for biased trial Show forest plot | 1 | | Risk Ratio (M‐H, Fixed, 95% CI) | Totals not selected |
|
| 20.1 Deaths ascribed to breast cancer, 7 years follow up | 1 | | Risk Ratio (M‐H, Fixed, 95% CI) | 0.0 [0.0, 0.0] |
| 20.2 Deaths ascribed to breast cancer, 13 years follow up | 1 | | Risk Ratio (M‐H, Fixed, 95% CI) | 0.0 [0.0, 0.0] |
| 20.3 Deaths ascribed to breast cancer, 7 years follow up, younger women (below 50 years of age) | 1 | | Risk Ratio (M‐H, Fixed, 95% CI) | 0.0 [0.0, 0.0] |
| 20.4 Deaths ascribed to breast cancer, 7 years follow up, elderly women (at least 50 years of age) | 1 | | Risk Ratio (M‐H, Fixed, 95% CI) | 0.0 [0.0, 0.0] |
| 20.5 Deaths ascribed to breast cancer, 13 years follow up, younger women (below 50 years of age) | 1 | | Risk Ratio (M‐H, Fixed, 95% CI) | 0.0 [0.0, 0.0] |
| 20.6 Deaths ascribed to breast cancer, 13 years follow up, elderly women (at least 50 years of age) | 1 | | Risk Ratio (M‐H, Fixed, 95% CI) | 0.0 [0.0, 0.0] |
| 20.7 Overall mortality, 7 years follow up | 1 | | Risk Ratio (M‐H, Fixed, 95% CI) | 0.0 [0.0, 0.0] |
| 20.8 Number treated with radiotherapy | 1 | | Risk Ratio (M‐H, Fixed, 95% CI) | 0.0 [0.0, 0.0] |
| 21 Number of cancers Show forest plot | 6 | | Risk Ratio (M‐H, Fixed, 95% CI) | Subtotals only |
|
| 21.1 Adequately randomised trials (after 7‐9 years) | 3 | 132118 | Risk Ratio (M‐H, Fixed, 95% CI) | 1.30 [1.20, 1.40] |
| 21.2 Suboptimally randomised trials (before control group screen) | 3 | 219267 | Risk Ratio (M‐H, Fixed, 95% CI) | 1.33 [1.24, 1.44] |