نقش کورتیکواستروئیدها در مدیریت درمانی پلورزی سل
چکیده
پیشینه
گزارش شده که تجویز کورتیکواستروئیدها همراه با درمان ضد‐سل، برای افراد مبتلا به پلورزی توبرکلوز (tuberculous pleurisy) مفید هستند. با این حال، یافتههای پژوهشی در این زمینه متناقض بوده و باعث تردید در مورد این موضوع میشود که چنین درمانی ارزشمند است یا خیر. همچنین نگرانیهایی در مورد عوارض جانبی بالقوه کورتیکواستروئیدها، به ویژه در افراد مبتلا به HIV‐مثبت، وجود دارد.
اهداف
ارزیابی اثرات افزودن کورتیکواستروئیدها به رژیمهای دارویی مورد استفاده در درمان پلورال افیوژن توبرکلوز (tuberculous pleural effusion).
روشهای جستوجو
در اپریل 2016، پایگاه ثبت تخصصی گروه بیماریهای عفونی در کاکرین؛ CENTRAL (کتابخانه کاکرین)؛ MEDLINE؛ Embase؛ LILACS؛ Current Controlled Trials، و فهرست منابع مقالات شناسایی شده را در جستوجوی متون علمی، بررسی کردیم.
معیارهای انتخاب
کارآزماییهای تصادفیسازی و کنترل شده (randomised controlled trials; RCTs) و شبه‐RCTهایی که هر نوعی را از کورتیکواستروئید با عدم درمان، دارونما (placebo) یا هر درمان فعال دیگری (هر دو گروه باید رژیم دارویی ضد‐سل مشابه را دریافت کنند) در افراد مبتلا به پلورزی توبرکلوز مقایسه کردند.
گردآوری و تجزیهوتحلیل دادهها
دو نویسنده مرور بهطور مستقل از هم نتایج جستوجو را غربالگری کردند، دادهها را از کارآزماییهای وارد شده استخراج کردند، و کیفیت روششناسی کارآزمایی را با استفاده از ابزار «خطر سوگیری» (bias) کاکرین ارزیابی کردند. دادهها را با استفاده از خطر نسبی (RR) با 95% فاصله اطمینان (CI) تجزیهوتحلیل کردیم. در صورت عدم وجود ناهمگونی آماری معنیدار، مدل اثر ثابت را به کار بردیم.
نتایج اصلی
شش کارآزمایی با 590 شرکتکننده، که در آسیا (سه کارآزمایی)، آفریقا (دو کارآزمایی)، و اروپا (یک کارآزمایی) انجام شدند، معیارهای ورود را داشتند. دو کارآزمایی شامل افراد مبتلا به HIV‐منفی، یک کارآزمایی شامل افراد مبتلا به HIV‐مثبت، و در سه کارآزمایی وضعیت HIV بیماران گزارش نشد.
کورتیکواستروئیدها ممکن است زمان لازم را تا برطرف شدن پلورال افیوژن کاهش دهند. خطر پلورال افیوژن باقیمانده در رادیوگرافی قفسه سینه تا 45% در هشت هفته (RR: 0.54؛ 95% CI؛ 0.37 تا 0.78؛ 237 شرکتکننده؛ 2 کارآزمایی؛ شواهد با قطعیت پائین) و 65% در 24 هفته (RR: 0.35؛ 95% CI؛ 0.18 تا 0.66؛ 237 شرکتکننده؛ 2 کارآزمایی؛ شواهد با قطعیت پائین) کاهش یافت.
کورتیکواستروئیدها در مقایسه با کنترل ممکن است خطر تغییرات پلورال (مانند ضخامت پلورال یا چسبندگی پلورال) را در رادیوگرافی قفسه سینه در پایان دوره پیگیری تقریبا تا یک‐سوم کاهش دهند (RR: 0.72؛ 95% CI؛ 0.57 تا 0.92؛ 393 شرکتکننده؛ 5 کارآزمایی؛ شواهد با قطعیت پائین) که به معنای کاهش خطر مطلق معادل 16% است.
یک کارآزمایی، مرگومیررا در افرادی که HIV‐مثبت داشتند، بدون هیچ تفاوت واضحی میان گروهها گزارش کرد؛ تجزیهوتحلیل نویسندگان کارآزمایی نشان میدهد که مرگومیر مشاهده شده در این کارآزمایی، به جای TB پلورال، با بیماریHIV مرتبط بود (RR: 0.91؛ 95% CI؛ 0.64 تا 1.31؛ 197 شرکتکننده؛ 1 کارآزمایی).
در دو کارآزمایی، دادههای محدودی را در مورد اختلالات تنفسی عملکردی طولانی‐مدت در 187 نفر یافتیم، که میانگین درصد پیشبینی شده ظرفیت حیاتی اجباری در گروه دریافت کننده پردنیزولون و کنترل مشابه بود (شواهد با قطعیت بسیار پائین).
خطر بروز عوارض جانبی که منجر به قطع مصرف داروهای کارآزمایی شد، در افراد مبتلا به TB پلورال دریافت کننده کورتیکواستروئیدها بالاتر بود (RR: 2.78؛ 95% CI؛ 11.1 تا 6.94؛ 587 شرکتکننده؛ 6 کارآزمایی؛ شواهد با قطعیت پائین). کارآزمایی مربوط به افراد مبتلا به HIV‐مثبت، شش عفونت مختلف مرتبط با HIV را، بدون تفاوتهای آشکار، گزارش کرد. با این حال، موارد سارکوم کاپوزی (Kaposi's sarcoma) فقط در گروه کورتیکواستروئید دیده شدند (6/99 مورد در گروه استروئید در مقایسه با 0/98 مورد در گروه کنترل) (شواهد با قطعیت بسیار پائین).
نتیجهگیریهای نویسندگان
عملکرد تنفسی بلند‐مدت بهطور بالقوه مهمترین پیامد برای ارزیابی اثرات درمانهای کمکی برای افراد مبتلا به سل پلورال است. با این حال، اطلاعات در مورد تاثیر TB پلورال بر عملکرد تنفسی طولانی‐مدت ناشناخته است و میتواند توسط سایر عوامل خطرساز مانند TB ریوی همزمان، سیگار کشیدن، و HIV تحت تاثیر قرار بگیرد. این یافته احتمالا برای کمک به تصمیمگیری در مورد اینکه انجام کارآزماییهای بیشتر درباره کورتیکواستروئیدها برای TB پلورال ارزشمند خواهد بود یا خیر، نیاز به بررسی دارد.
PICO
خلاصه به زبان ساده
پلورزی سلی (tuberculous pleurisy) چیست و کورتیکواستروئیدها چگونه عمل میکنند؟
پلورزی سلی ناشی از التهاب غشای پوشاننده ریهها (پلورال (pleura)) است که از طریق مواجهه با باکتری Mycobacterium tuberculosis که ریهها را درگیر میکند، ایجاد میشود. این وضعیت باعث تجمع مایع اطراف ریه (پلورال افیوژن (pleural effusion)) شده که موجب درد و تب، اختلال در تنفس شده، و در بلند‐مدت به اختلال در عملکرد ریه میانجامد.
برخی از پزشکان بر این باورند که تجویز کورتیکواستروئیدها در ترکیب با داروهای ضد‐سل، میتوانند بهبود پلورزی سلی را تسریع کرده و به پیشگیری از بروز عوارض طولانی‐مدت کمک کنند.
شواهد چه چیزی را نشان می دهد؟
شواهد موجود را تا 13 اپریل 2016 بررسی کرده و شش کارآزمایی را با 590 نفر انتخاب کردیم، که تجویز پردنیزولون را با درمان ضد‐سل (antituberculous treatment; ATT) ارزیابی کردند. یک کارآزمایی وارد شده کیفیت بالایی داشت؛ درحالی که سایر کارآزماییها، از نظر کیفیت دارای عدم اطمینان بودند. تمام کارآزماییهای وارد شده شامل بزرگسالان بودند؛ یک کارآزمایی فقط افراد مبتلا به HIV‐مثبت را وارد کرد، دو کارآزمایی فقط شامل افراد مبتلا به HIV‐منفی بود، و سه کارآزمایی وضعیت شرکتکنندگان را از نظرHIV گزارش نکردند.
کورتیکواستروئیدها ممکن است زمان لازم تا برطرف شدن نشانههای پلورزی سلی و زمان لازم تا برطرف شدن پلورال افیوژن را در عکس اشعه X قفسه سینه کاهش دهند (شواهد با قطعیت پائین). کورتیکواستروئیدها همچنین میتوانند خطر ابتلا را به علائم اسکار پلورال روی عکس اشعه X قفسه سینه (ضخامت پلورال و چسبندگیهای پلورال) پس از برطرف شدن بیماری (شواهد با قطعیت پائین) کاهش دهند. اطلاعات کافی در مورد عملکرد ریه وجود نداشت تا مطمئن شویم که کورتیکواستروئیدها پس از پلورزی سلی، خطر اختلال عملکرد ریه را کاهش میدهند یا خیر (شواهد با قطعیت بسیار پائین).
کورتیکواستروئیدها میتوانند خطر بروز عوارض جانبی منجر به قطع مصرف دارو را افزایش دهند (شواهد با اطمینان پائین). از یک کارآزمایی با حضور افراد مبتلا به HIV، هیچ افزایش قابل ملاحظهای در شرایط مرتبط با HIV با کورتیکواستروئیدها دیده نشد، هرچند موارد سارکوم کاپوزی فقط در گروه کورتیکواستروئید مشاهده شد و تعداد اندک شرکتکنندگان و عوارض، اثر کورتیکواستروئیدها را حذف نکردند (شواهد با قطعیت بسیار پائین).
از آنجایی که خطر ناتوانی و بیماری طولانی‐مدت پس از پلورزی سلی مشخص نیست، تحقیق برای یافتن ارتباط بین پلورزی سلی و اختلال عملکرد ریه، برای اطلاعرسانی تحقیقات آینده پیرامون کورتیکواستروئیدها در درمان پلورزی سلی میتواند مفید باشد.
Authors' conclusions
Summary of findings
| Steroids compared with placebo for pleural TB | |||||
| Patient or population: adults and adolescents with pleural TB Settings: hospital care and community follow‐up Intervention: corticosteroids Comparison: placebo | |||||
| Outcomes | Illustrative comparative risks¹ (95% CI) | Relative effect | Number of participants | Certainty of the evidence | |
| Assumed risk | Corresponding risk | ||||
| Control | Corticosteroids | ||||
| Residual pleural fluid on chest X‐ray at 8 weeks | 62 per 100 | 33 per 100 (23 to 48) | RR 0.54 (0.37 to 0.78) | 237 (2 trials) | ⊕⊕⊝⊝1,2,3,4 |
| Residual pleural fluid on chest X‐ray at 24 weeks | 29 per 100 | 10 per 100 (5 to 19) | RR 0.35 (0.18 to 0.66) | 237 (2 trials) | ⊕⊕⊝⊝1,2,3,4 low |
| Pleural changes at the end of follow‐up (pleural adhesions or pleural thickening on chest X‐ray; follow‐up 6 to 24 months) | 50 per 100 | 36 per 100 (29 to 46) | RR 0.72 (0.57 to 0.92) | 393 (5 trials) | ⊕⊕⊝⊝5,6,7 |
| Long‐term functional respiratory impairment (> 6 months) | — | — | Average percentage predicted FVC similar in corticosteroid and control groups. | 187 (2 trials) | ⊕⊝⊝⊝8 |
| Adverse events leading to treatment discontinuation (follow‐up 6 to 24 months) | 1 per 100 | 3 per 100 | RR 2.78 (1.11 to 6.94) | 590 | ⊕⊕⊝⊝9,10 |
| HIV‐related infections (cryptococcal meningitis) | 5 per 100 | 3 per 100 (1 to 12) | RR 0.59 (0.15 to 2.42) | 103 (1 trial) | ⊕⊝⊝⊝11,12 |
| HIV‐related cancer (Kaposi's sarcoma) | 14 per 100013 | 180 per 1000 (1 to 316) | RR 12.87 (0.73 to 225.40) | 103 (1 trial) | ⊕⊝⊝⊝14,15 |
| ¹The basis for the assumed risk (for example, the median control group risk across studies) is provided in footnotes. The corresponding risk (and its 95% CI) is based on the assumed risk in the comparison group and the relative effect of the intervention (and its 95% CI). | |||||
| GRADE Working Group grades of evidence | |||||
| 1Downgraded by one for risk of bias: of the four trials that reported this outcome, we excluded two trials from the final analysis due to high risk of selection bias, after a subgroup analysis suggested the pooled estimate including these studies could be misleading (Bang 1997; Lee 1999). We judged this to be our best estimate of effect. However because we excluded trials from this analysis this generates uncertainty, so we have downgraded the quality of the evidence. | |||||
Background
Tuberculosis (TB) is an infectious disease caused by Mycobacterium tuberculosis complex, and is a major cause of illness and death worldwide. In 2014 approximately 9.6 million people newly developed the disease and there were 1.5 million deaths globally (WHO 2015). TB infects the lungs, and is transmitted by droplet spread from coughing people with active pulmonary TB, but it can also spread to other body sites and cause extrapulmonary TB (EPTB).
Description of the condition
Pleural TB is one of the most common forms of EPTB, with an incidence of 3% to 25% of people with TB (Light 2010; Sharma 2004). The incidence is higher in high TB prevalence settings (Jeon 2014). Immune compromise is an important risk factor for all forms of TB, and evidence suggests that pleural TB is more common in people living with HIV (Batungwanayo 1993; Frye 1997; Pozniak 1995; Saks 1992). Pleural TB can be a manifestation of TB disease post‐primary infection, or due to reactivation of latent TB (Light 2010).
Clinically, pleural TB presents as an acute illness consisting of cough, fever, chest pain, and shortness of breath (Morehead 1998), and usually a pleural effusion is demonstrated on chest X‐ray. Pleural TB usually resolves without treatment of any kind, but untreated patients may experience longer duration of the acute symptoms and risk recurrence of active TB at a later point in time (Light 2010). Pleural TB can be complicated by massive effusion leading to respiratory compromise in the short term, and pleural thickening, fibrosis, and pleural adhesions causing impaired respiratory function in the medium‐ to long‐term.
Pleural TB is thought to be caused by a delayed type (type IV) hypersensitivity reaction following release of mycobacterial antigens into the pleural space (Rossi 1987), as a result of rupture of a subpleural focus of TB infection in the lung (Stead 1955). This explains the tendency towards resolution of the effusion and associated symptoms with or without treatment of the TB infection, and the fact that culture of pleural fluid is nearly always negative for M. tuberculosis. There appears to be a spectrum of disease in pleural TB in terms of the extent of the underlying lung infection, which could be important in terms of patient outcomes and the potential for corticosteroids to be effective (Table 1). A systematic review that includes 18 trials and 3816 participants suggests that corticosteroids probably do not improve mortality rates, sputum smear or culture conversion in people with pulmonary TB (Critchley 2014). One cohort study of people with pleural TB in Spain reported evidence of pulmonary TB infection on chest X‐ray in 20% of 254 participants (Valdés 1998). Pulmonary involvement rose to 86% in another cohort where computed tomography (CT) scanning was used (Kim 2006). Shu 2011 demonstrated that pulmonary involvement (as defined by positive sputum culture and/or chest X‐ray appearances) was an important predictor of mortality in hospitalised pleural TB patients in Korea, and was associated with a longer hospital stay.
| Clinical Feature | Isolated pleural TB | Pleuro‐pulmonary TB |
| Sputum microscopy/culture | Negative | Some positive |
| Pleural fluid | Usually demonstrates exudative effusion Usually negative for M. tuberculosis on smear and culture | Usually demonstrates exudative effusion Usually negative for M. tuberculosis on smear and culture |
| Chest X‐ray | Discrete pleural effusion, or pleural thickening, or both | Pleural effusion with other changes such as consolidation, cavities, atelectasis, or hilar enlargement |
| Chest computed tomography (CT) | May demonstrate underlying lung infection | Demonstrates underlying lung infection |
| Pathogenesis | Predominantly driven by delayed type hypersensitivity reaction | Predominantly driven by TB infection of the lung |
| Prognosis | Most people will improve with no antituberculous treatment (ATT), but may experience a relapse of TB infection | People may deteriorate and die without ATT |
Diagnosis of pleural TB can be challenging with traditional microscopy and culture methods being relatively insensitive when used on pleural fluid, and newer modalities such as Xpert® MTB/RIF have similar limitations (Denkinger 2014). Histopathological examination and mycobacterial culture performed on pleural biopsy samples are regarded as more reliable tests, and yielded a diagnosis in 227/248 patients (91%) in one cohort study (Valdés 1998).
Description of the intervention
Corticosteroids are hormones produced by the adrenal cortex which have a variety of physiological functions, including carbohydrate metabolism, protein catabolism, regulation of electrolytes, the stress response and control of inflammation. Corticosteroids induce their anti‐inflammatory effect through the regulation of gene expression in cells, leading to increased expression of genes which inhibit inflammatory pathways, and repression of genes encoding pro‐inflammatory proteins (Barnes 2006). Multiple synthetic forms of these hormones have been produced and are used in the treatment of a wide variety of inflammatory conditions. Prednisolone is a synthetic corticosteroid derived from cortisol, and prednisone is a pro‐drug that is converted into the active form prednisolone by the liver. Several formulations of each drug are used for different conditions and diseases; in TB pleurisy patients are usually offered them in tablet form.
Corticosteroids have been used in medicine for many decades, and have well‐characterised adverse effect profiles. Adverse effects for medium to long‐term use include hyperglycaemia, hypertension, increased risk of infection, osteoporosis, gastric ulceration and gastrointestinal bleeding, thinning of the skin, proximal myopathy, psychiatric symptoms, and development of moon face, striae and acne (Cushing's syndrome). The use of synthetic corticosteroids can induce adrenocorticoid insufficiency, and so patients receiving more than one week's treatment must have the dose slowly reduced to avoid acute adrenal insufficiency causing hypotension and hypoglycaemia which can be life‐threatening (BNF 2016).
How the intervention might work
Therapeutic options for pleural space infections include intravenous antibiotic administration, chest tube drainage, intrapleural administration of a fibrinolytic agent to dissolve fibrous adhesions, thoracotomy to remove fibrinous and infected tissue, and steroid therapy (Chapman 2004).
The theoretical basis for using corticosteroids is that they suppress the delayed type hypersensitivity inflammatory response triggered by the release of tubercular antigens into the pleural space which is believed to be responsible for tuberculous pleurisy. One corticosteroid is prednisone, which is converted in the liver into the active drug, prednisolone. Prednisolone is recommended at a daily dose of about 1 mg/kg gradually reducing after one to two weeks, with a total treatment course sometimes being as long as three months (Lemaistre 1951; Mathur 1960; Morehead 1998; Blumberg 2003).
Corticosteroids have anti‐inflammatory properties, produced mainly via suppression of pro‐inflammatory gene expression and activation of anti‐inflammatory genes (Barnes 2006). While the inflammatory response is necessary to control the infection, excessive inflammation can lead to tissue damage and fibrosis, which could cause long‐term morbidity. Suppression of the inflammatory response in pleural TB could reduce the symptoms and signs associated with the inflammatory process: fever, progression of the pleural effusion, malaise. Corticosteroids could therefore reduce the duration or severity of symptoms in the short term, and also reduce the risk of tissue damage leading to lung impairment in the long term.
Why it is important to do this review
Studies of adjunctive corticosteroids for the treatment of tuberculous pleural effusion show conflicting results. Non‐randomized studies in the pre‐HIV era found that corticosteroids led to more rapid resolution of the effusion and reduced likelihood of residual pleural thickening and pleural adhesions (Menon 1964; Singh 1965). An observational study of 165 HIV‐positive participants with tuberculous pleural effusion found that prednisolone was associated with decreasing rates of lymphadenopathy and cough as well as improved survival (Elliott 1992; Elliott personal communication).
In contrast, a critical appraisal of published studies demonstrated beneficial effects of corticosteroids on acute symptoms, but it found no benefit for chronic endpoints such as fibrosis, irrespective of dose (Dooley 1997). The authors noted that many of the studies lacked rigour and clinical correlations. The previous version of this Cochrane review (Engel 2007), which included six trials and 633 participants, concluded that data were insufficient to support the use of corticosteroids in pleural TB.
In addition to the uncertainty about benefits of corticosteroid therapy, there is concern about potential risks. In immunocompromised patients, such as those infected with HIV, corticosteroids may further constrain the immune system leading to an increased frequency of opportunistic infections and tumours such as Kaposi's sarcoma, a vascular tumour accompanied by numerous unconnected lesions of the skin and associated with human herpes virus‐8 infection (Ensoli 2001). More generally, adverse effects of corticosteroids such as fluid retention and gastrointestinal disturbances have also been documented in people with TB (Anonymous 1983). Other adverse effects associated with corticosteroids include high blood pressure, high blood glucose or exacerbation of existing diabetes mellitus, weight gain, increased susceptibility to infection, gastrointestinal bleeding and in long‐term use osteoporosis and changes to the skin and face.
We updated this review with the aim of adding any new evidence that may have been published since the previous search in 2007. For this version, we revised the protocol, and in particular altered the outcomes of interest. This was informed by discussions with expert clinicians which took place during the development of a new guideline on extrapulmonary TB in India, the INDEX‐TB guidelines (INDEX‐TB 2016).
Objectives
To evaluate the effects of adding corticosteroids to drug regimens for tuberculous pleural effusion.
Methods
Criteria for considering studies for this review
Types of studies
Randomized controlled trials (RCTs) and quasi‐RCTs.
Types of participants
People diagnosed with tuberculous pleurisy by chest x‐ray (as defined by trial authors) plus any of the following: pleural biopsy for histology; staining and microscopy for acid‐fast bacilli, or culture of sputum, or both; pleural fluid; or pleural biopsy.
Types of interventions
Intervention
Any corticosteroid at any dose.
Control
Placebo or no adjunctive treatment.
Both treatment groups should receive the same antituberculous drug regimen.
Types of outcome measures
Short term (under six months)
-
Time to resolution of clinical symptoms (as defined by the authors, including fever and pain)
-
Time to resolution of pleural effusion
Long term (six months or more)
-
Pleural changes at the end of treatment (pleural thickening and pleural adhesions)
-
Change in respiratory function
-
Disability (as defined by authors)
-
Deaths from any cause
We will also report on other outcomes of resolution as defined by the author.
Adverse effects
-
Corticosteroid‐associated adverse effects
-
HIV‐associated adverse effects
Search methods for identification of studies
We attempted to identify all relevant trials regardless of language or publication status (published, unpublished, in press, and in progress).
Electronic searches
We searched the following databases using the search terms and strategy described in Appendix 1: the Cochrane Infectious Diseases Group Specialized Register (18 November 2016); the Cochrane Central Register of Controlled Trials (CENTRAL), published in the Cochrane Library (18 November 2016); MEDLINE (1966 to 18 November 2016); Embase (1974 to 18 November 2016); and LILACS (1982 to 18 November 2016). We also searched Current Controlled Trials (18 November 2016) using 'tuberculosis' and 'pleur*' as search terms.
Searching other resources
We performed hand searches of the reference lists of all studies identified with the above methods.
Data collection and analysis
Selection of studies
The review authors screened the results of the search for potentially relevant studies. We independently applied eligibility criteria and resolved differences in opinion through discussion. Where the abstracts were unclear or if there was any other reason for uncertainty, we obtained the full‐text article before we made a decision on study eligibility, and we contacted the study authors where necessary. We consulted translators when abstracts were unavailable in English. We assessed the full‐text articles of potentially relevant studies and included trials that met the inclusion criteria. We listed studies that did not meet our inclusion criteria and stated the reason for exclusion in a 'Characteristics of excluded studies' table. We constructed a PRISMA diagram to illustrate the study selection process.
Data extraction and management
Two review authors (PD and HR) independently extracted data from the included trials on participant characteristics, diagnostic criteria, HIV status, antituberculous drug regimen, corticosteroid regimen, and outcome measures using a pre‐piloted data extraction form. One review author (JY) extracted data from Bang 1997 and Lee 1999 as both trial reports were in Korean. We resolved disagreements through discussion and contacted the corresponding trial author in the case of unclear or missing data.
For dichotomous outcomes, we recorded the number of participants that experienced the event and the number of participants in each treatment group. For continuous outcomes, we extracted the arithmetic means and standard deviations for each treatment group together with the numbers of participants in each group.
Assessment of risk of bias in included studies
Two review authors (PD and HR, or JY and HR) independently assessed the risk of bias for each included trial using the Cochrane 'Risk of bias' tool (Higgins 2011). We resolved any differences of opinion through discussion with reference to the trial reports, and through discussion with the Cochrane Infectious Diseases Group Co‐ordinating Editor, Paul Garner. We followed the guidance to assess whether adequate steps had been taken to reduce the risk of bias across six domains.
-
Random sequence generation
-
Allocation concealment
-
Blinding of participants and personnel
-
Blinding of outcome assessors
-
Incomplete outcome data
-
Selective reporting
-
Other bias
When assessing risk of bias related to blinding (performance bias or detection bias), we planned to consider the implications of blinding separately for each outcome, as appropriate.
For assessment of bias related to incomplete outcome data (attrition bias), we used the following criteria to assess risk of bias.
-
Low risk: less than 5% of participants were lost to follow‐up
-
Unclear risk: between 5 and 10% of participants were lost to follow‐up
-
High risk: more than 10% of participants were lost to follow‐up
For selective reporting (reporting bias), we used the following criteria to determine the risk of bias.
-
Low risk: the trial authors stated in the introduction or method sections the outcomes they would look at, and they reported all of them in the results section
-
Unclear risk: the trial authors did not state in the introduction or method sections the outcomes they would look at
-
High risk: the trial authors stated the outcomes they would look at but they did not report all of them in the results section
We categorized these judgments as either at low, high, or unclear risk of bias. We attempted to contact the trial authors for clarification if any details were unclear; where our judgement is recorded as 'unclear' we were unable to amend our judgement after we contacted the trial authors. The results of the 'Risk of bias' assessment are displayed in the 'Characteristics of included studies' tables.
Measures of treatment effect
For dichotomous outcomes, we used relative risk as the measure of treatment effect for analysis. For continuous outcomes we planned to use mean difference, but this was not necessary in the final review draft.
Unit of analysis issues
There were no cluster‐RCTs amongst the included trials, so individual participants were the unit of analysis.
Dealing with missing data
The primary analysis was an intention‐to‐treat analysis where all participants randomized to treatment were included in the denominator, where possible. This analysis assumes that all losses to follow‐up have good outcomes. We planned to explore the effect of losses to follow‐up on the overall effect estimates by performing sensitivity analyses.
Assessment of heterogeneity
We assessed heterogeneity by visually inspecting the forest plots to determine closeness of point estimates with each other and overlap of confidence intervals (CIs). We used the Chi² test with a P value of 0.10 to indicate statistical significance, and the I² statistic to assess heterogeneity with a value of 50% taken to indicate statistical heterogeneity. We planned to investigate heterogeneity through the following subgroup analyses: corticosteroid dose, HIV status, and methodological quality.
Assessment of reporting biases
We planned to look for publication bias by constructing a funnel plot, but there were too few studies to do this.
Data synthesis
We analysed the data using Review Manager 5 (RevMan 5) (Review Manager 5). For outcomes where it was possible to combine data and clinical heterogeneity was low, we decided to perform a meta‐analysis. We used risk ratios (RR) with 95% CIs and the fixed‐effect model. For outcomes where it was not possible to combine data, we described the results in tables. We summarized the adverse event data in tables and performed meta‐analysis for adverse events leading to discontinuation of the trial drug, and HIV‐associated adverse events.
Subgroup analysis and investigation of heterogeneity
Where there was substantial unexplained statistical heterogeneity, we carried out subgroup analyses to investigate possible causes.
Sensitivity analysis
To explore the possible effect of losses to follow‐up, we planned to conduct a worst case scenario analysis and compare it with an available‐case analysis for the outcome pleural changes at the end of treatment. There were few losses to follow‐up in the included trials, and the two trials with the highest number of losses to follow‐up did not state which treatment groups these participants were randomized to. Therefore we did not conduct the sensitivity analysis as planned.
Quality of the evidence
We assessed the quality of the evidence using the GRADE approach (Jüni 2001). We used GRADEpro Guideline Development Tool (GDT) software to construct a 'Summary of findings' table (GRADEpro GDT 2014).
Results
Description of studies
Results of the search
In the 2007 version of this Cochrane Review, we screened 48 studies, of which we identified 27 published trials for possible inclusion into the review. Six trials met the inclusion criteria (Engel 2007). In this review update, the search returned one new study, which we excluded. Figure 1 shows the study selection process. We have described the characteristics of the included studies in the 'Characteristics of included studies' tables and summarized the results in Table 2.
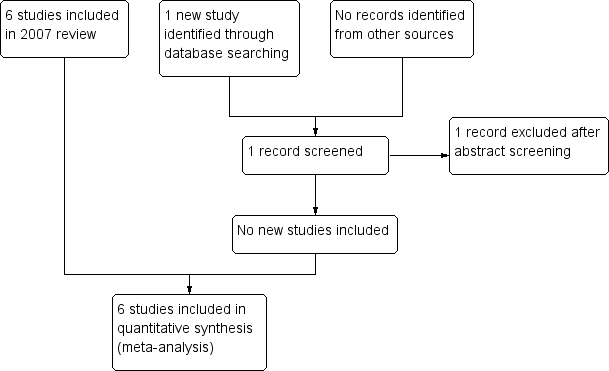
Study flow diagram.
| Trial | Country | Year | Participants | Adults or children | HIV status | ATT regimen | Therapeutic thoracocentesis performed | |
| Steroid group | Control group | |||||||
| South Korea | 1991 to 1994 | 34 | 50 | Adults | Not reported | 2RHZE/7RHE | No | |
| Uganda | 1998 to 2002 | 99 | 98 | Adults | Positive | 2RHZE/4RH | No | |
| Spain | 1985 to 1992 | 57 | 60 | Both | Negative | 6RH | Yes | |
| Taiwan | 1983 to 1987 | 21 | 19 | Adults | Not reported | 3RHE/6‐9RH | No | |
| South Korea | 1990 to 1997 | 50 | 32 | Adults | Not reported | 6RHZE or 2RHZS/4RHZ | No | |
| South Africa | 1994 to 1995 | 34 | 36 | Adults | Negative | 6RHZ | Yes | |
Abbreviations: ATT: antituberculous treatment; E: ethambutol; H: isoniazid; R: rifampicin; S: streptomycin; Z: pyrazinamide.
Included studies
Settings
The six trials included 633 participants, with a range of 45 to 197 per trial, and were conducted in a various countries: Taiwan (Lee 1988), Spain (Galarza 1995), South Africa (Wyser 1996), Korea (Bang 1997; Lee 1999), and Uganda (Elliott 2004). All trials were single centre trials based in large tertiary care hospitals.
Participants
All participants were adults except in one trial, Galarza 1995, which included people aged 11 years and older. All trials included participants of both sexes; overall 59% were male, with a range of 51% to 64% across trials.
One trial included only HIV‐positive participants (Elliott 2004), two trials excluded HIV‐positive participants (Galarza 1995; Wyser 1996), while the other included trials did not mention the HIV status of the participants.
All but one trial, Galarza 1995, specified the exclusion of participants with co‐morbidities that may be exacerbated by the use of corticosteroids, particularly hypertension, diabetes mellitus, and peptic ulcer disease. Elliott 2004 also specified the exclusion of participants with another major HIV‐related disease.
We have described the diagnostic tests performed in each included trial in Table 3. Diagnosis of pleural TB was made on the basis of either characteristic histopathological features on pleural biopsy or positive culture or acid‐fast bacilli (AFB) on smear microscopy staining from pleural fluid, biopsy or sputum in three trials (Elliott 2004; Lee 1999; Wyser 1996). Galarza 1995 also included participants with a diagnosis of tuberculous pleurisy based on a combination of at least two of: reactive Mantoux test, lymphocytic pleural fluid, and raised adenosine deaminase activity in pleural fluid. Bang 1997 only included participants who had positive microscopy for AFB from sputum, pleural fluid, or pleural biopsy. Lee 1988 included participants with pleural biopsy "reported as pleural tuberculosis or chronic granulomatous inflammation".
| Trial | Diagnostic criteria for pleural TB | Other diagnostic tests |
| Microscopy positive for AFB or culture positive from sputum, pleural fluid, or pleural biopsy. |
| |
| Positive culture from pleural biopsy, pleural fluid, or sputum, or histopathologic analysis of pleural biopsy consistent with tuberculous pleurisy |
| |
| At least one of the following
|
| |
| Pleural biopsy reported as pleural TB or chronic granulomatous inflammation |
| |
| TB on pleural biopsy, or pleural effusion plus AFB stain positive or culture positive from sputum, pleural fluid, or pleural biopsy |
| |
| Pleural biopsy with caseating granulomata with or without AFB on histological examination, or positive culture. |
|
Abbreviations: ADA: adenosine deaminase activity; AFB: acid‐fast bacilli; CT: computed tomography; ELISA: enzyme‐linked immunosorbent assay; FEV1: forced expiratory volume at one second; FVC: forced vital capacity; HIV: human immunodeficiency virus; PPD: purified protein derivative; PPD‐S: purified protein derivative‐standard; TB: tuberculosis
Interventions
We have summarized the antituberculous therapy (ATT) regimens used in the included trials in Table 2, and the corticosteroid regimens used in Table 4.
| Trial | Steroid | Regimen |
| Prednisolone | 1 mg/kg twice daily, tapered by 10 mg each week until cessation | |
| Prednisolone | 50 mg daily for 2 weeks, 40 mg daily for 2 weeks, then 25 mg daily for 2 weeks, then 15 mg daily for 2 weeks, then stopped | |
| Prednisone | 1 mg/kg/day for 15 days, tapering over the next 15 days | |
| Prednisolone | 0.75 mg/kg/day, tapered by 5 mg per week until discontinued once radiological improvement was seen | |
| Prednisolone | 30 mg four times daily for 1 month and tapered over the following month | |
| Prednisone | 0.75 mg/kg/day for 2 to 4 weeks; dose tapered by 5 mg/day over 2 weeks after clinical and radiological improvement |
Abbreviations: mg: milligrams
Four trials compared either prednisone or prednisolone with placebo as an adjunct to an established antituberculous regimen containing at least isoniazid and rifampicin (Elliott 2004; Galarza 1995; Lee 1988; Wyser 1996). Bang 1997 and Lee 1999 did not use any comparative treatment in the control group.
Four trials used weight‐based dosing of corticosteroids; Bang 1997 started at 1.0 mg/kg twice daily, Galarza 1995 started at 1.0 mg/kg/day, and Lee 1988 and Wyser 1996 started at 0.75 mg/kg/day. Elliott 2004 started at 50 mg/day for all participants, and Lee 1999 started at 30 mg four times daily. Lee 1988 and Wyser 1996 tapered the dose of corticosteroid according to the participant's clinical progress; the other included trials either had fixed tapering regimens or did not describe the tapering regimen.
All included trials described performing diagnostic pleural aspiration (thoracocentesis) as part of eligibility screening and diagnosis of pleural TB. Two trials also performed therapeutic thoracocentesis (Galarza 1995; Wyser 1996). In Galarza 1995, pleural fluid was drained in all participants before discharge "until a third of the hemithorax was observed to be occupied in a standard chest radiograph". In Wyser 1996, thoracoscopy and bronchoscopy were performed in all participants under general anaesthesia at admission, and chest drains were left in situ for 48 hours following the procedure to drain remaining pleural fluid.
Outcomes
Follow‐up varied from six months to 24 months. Two trials did not clearly state the length of follow‐up (Bang 1997; Lee 1999).
None of the included trials reported all the outcome measures chosen for this review.
Five trials reported on resolution or improvement of clinical symptoms in some way. Bang 1997 and Wyser 1996 both used self‐reported questionnaires to assess the time until symptom improvement and resolution in all participants; Wyser 1996 asked participants to grade the severity of a range of symptoms on a visual analogue scale. Lee 1988 reported the time to resolution of symptoms "including fever, chest pain and dyspnoea" for all participants, but did not specify how this was assessed. Elliott 2004 reported on improvement of anorexia, weight loss, and cough, but data for other symptoms was not reported. Galarza 1995 reported on time to resolution of fever.
Five trials reported on time to resolution of pleural effusion (Bang 1997; Elliott 2004; Galarza 1995; Lee 1988; Lee 1999). Four trials reported the number of participants with residual pleural effusion at various time points during treatment (Bang 1997; Elliott 2004; Lee 1988; Lee 1999). Bang 1997 and Lee 1988 also reported the mean number of days to resolution of pleural effusion. Galarza 1995 reported the mean reabsorption index for all participants over time. The trial authors calculated the reabsorption index as follows: (length of affected hemithorax/length of healthy hemithorax) x 100. Wyser 1996 reported recurrence of pleural effusion, rather than time to resolution, as all participants had therapeutic thoracocentesis at the start of treatment.
Five trials reported on pleural changes at various time points throughout treatment and at the end of follow‐up (Bang 1997; Galarza 1995; Lee 1988; Lee 1999; Wyser 1996). Galarza 1995 and Wyser 1996 described the diagnostic criteria for pleural thickening on chest X‐ray (Wyser 1996 also used high‐resolution computed tomography). Three trials did not describe the criteria for classifying participants as having pleural adhesions or pleural thickening (Bang 1997; Lee 1988; Lee 1999).
Two trials reported on respiratory function (Galarza 1995; Wyser 1996). In Wyser 1996, spirometry and body plethysmography were performed at admission and at various points during follow‐up. In Galarza 1995, spirometry was performed at the start and end of treatment. Neither trial reported the complete data for this outcome.
Disability was not reported in any of the included trials. Only one trial reported any deaths (Elliott 2004).
Elliott 2004 reported on CD4+ cell count at enrolment to the trial and at 1, 2, 6, and 18 months after start of treatment. A subset of participants (N = 40) also had blood and pleural fluid specimens analysed for HIV viral load.
All trials reported adverse events, although there was variation in the level of detail. Elliott 2004 reported on HIV‐related disease as well as corticosteroid‐related adverse events.
Excluded studies
We have listed the reasons for excluding 22 studies in the 'Characteristics of excluded studies' section.
Risk of bias in included studies
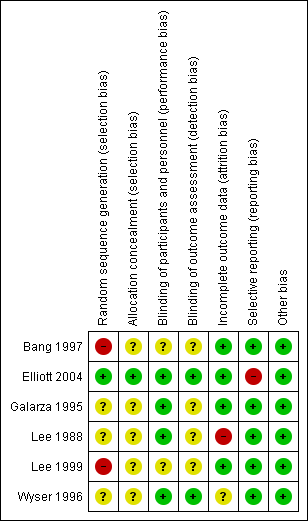
See the 'Characteristics of included studies' tables for details of individual included trials. The results of the 'Risk of bias' assessment are summarized in Figure 2 and Figure 3.
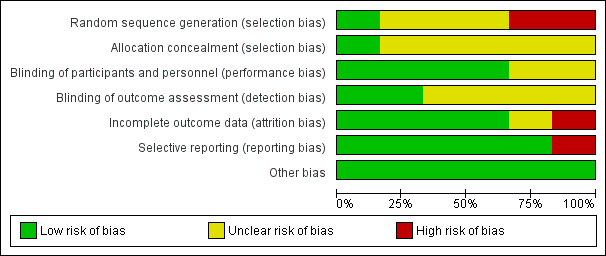
'Risk of bias' graph: review authors' judgements about each 'Risk of bias' item presented as percentages across all included trials.

'Risk of bias' summary: review authors' judgements about each 'Risk of bias' item for each included trial.
Allocation
All included trials were reported as randomized. Elliott 2004 explicitly stated that random numbers were computer‐generated, which we considered to be low risk of bias. The other included trials did not indicate how the sequence was generated, and we assessed them as at unclear risk of bias.
One trial gave a detailed description of the method of allocation concealment and we assessed it as at low risk of bias; briefly, prednisolone and matching placebo tablets were packaged in identical sequentially numbered plastic bags labelled with the randomization code by two people unrelated to the trial (Elliott 2004). The rest did not describe the method of allocation concealment, and so we classified them as at unclear risk of bias.
Blinding
Four trials described blinding of participants and personnel and we assessed them as at low risk of bias (Elliott 2004; Galarza 1995; Lee 1988; Wyser 1996). Bang 1997 and Lee 1999 did not mention blinding, and therefore we classified them as at unclear risk of bias.
Two trials specified blinding of outcome assessors and we assessed them as being at low risk of bias (Elliott 2004; Wyser 1996). None of the other trials reported whether or not outcome assessors were blinded to treatment allocation, and so we assessed them as at unclear risk of bias.
Incomplete outcome data
Three trials did not report any losses to follow‐up (Bang 1997; Galarza 1995; Lee 1999). Bang 1997 excluded one participant in the corticosteroid group from the analysis as the trial drug had to be stopped due to epigastric pain. Elliott 2004 reported 3/197 (1.5%) participants lost to follow‐up; one from the placebo group and two from the corticosteroid group. We categorised these trials as at low risk for attrition bias.
Wyser 1996 excluded 4/74 (5.4%) from the analysis; three due to noncompliance with treatment and one due to a diagnosis of oesophageal cancer during treatment. The authors do not report which groups the excluded participants were allocated to. We categorised this trial as at unclear risk of attrition bias.
Lee 1988 excluded 5/45 (11.1%) from the analysis; one due to a diagnosis of renal cell carcinoma during treatment, and four were lost to follow‐up. We classified this trial as at high risk of attrition bias.
Selective reporting
Trial protocols were unavailable for all of the included trials. Five trials stated the outcomes clearly in the introduction and methods sections of the study reports, and reported all stated outcomes (Bang 1997; Galarza 1995; Lee 1988; Lee 1999; Wyser 1996).
Elliott 2004 reported that the hypothesis of the trial was that prednisolone would improve long‐term survival, and decrease HIV viral replication, but did not list the planned outcomes. We assessed this trial as at high risk of reporting bias because in the results section it implied that data on resolution of symptoms that did not demonstrate a statistically significant positive effect of prednisolone was not reported, whereas data were reported for the outcomes of anorexia, weight, and cough where a statistically significant positive effect was found.
Other potential sources of bias
We did not find enough trials that met the inclusion criteria for us to conduct a funnel plot to look for possible publication bias.
Effects of interventions
See: Summary of findings for the main comparison
Time to resolution of clinical symptoms
Due to the different units of measurement used in the trials, and insufficient reported data, it was not possible to combine the effects in a meta‐analysis for this outcome. We have presented the results from the included trials in Table 5. Qualitatively, corticosteroids appear to be associated with more rapid resolution of symptoms, but we were unable to assess the relative effect of corticosteroids statistically.
| Trial | Indicator | Units | Corticosteroids | Control | |
| Mean values | “Fever, pleuritic pain, malaise and breathlessness” | Mean days to resolution | 3.8 (N = 34) | 7.41 (N = 50) | |
| “Fever duration” | Mean days | 3.32 (N = 57) | 4.15 (N = 60) | ||
| “Fever, pleuritic pain, malaise and breathlessness” | Mean days to resolution | 2.4 (N = 21) | 5.6 (N = 19) | ||
| Cut‐offs (categorical) | “Anorexia” | Number of participants with anorexia at 4 weeks | 3/99 (3%) | 18/98 (18.4%) | |
| “Cough” | Number of participants with cough at 4 weeks | 35/99 (35.4%) | 57/98 (58.2%) | ||
| “Weight” | Mean weight in kg at 4 weeks | 57 | 52.5 | ||
| Symptoms resolved in all patients (VAS score) | Weeks | 12 | 16 |
Abbreviations: kg: kilograms; VAS: visual analogue scale
1P < 0.05.
Time to resolution of pleural effusion
Five trials reported on time to resolution of pleural effusion (Bang 1997; Elliott 2004; Galarza 1995; Lee 1988; Lee 1999). We combined data for the number of participants with a residual pleural effusion on chest X‐ray in each treatment group from four trials. Bang 1997, Elliott 2004, and Lee 1988 reported data across three time points (4 weeks, 8 weeks, and 24 weeks), and Lee 1999 reported data for two time points (8 weeks and 24 weeks). Galarza 1995 presented the mean reabsorption index for each treatment group at four weeks, and so we could not use data from this trial in the meta‐analysis. We have presented the results from each trial in Table 6. Wyser 1996 reported on recurrence of pleural effusion, as all participants had drainage of their pleural effusions at admission to the trial, and reported no recurrences of pleural effusion in either group.
| Trial | Units | Corticosteroids | Control | |
| Mean values | Mean days to resolution | 88 (N=34) | 100 (N=50) | |
| Mean days to resolution | 54.5 (N=21) | 123.2 (N=19) | ||
| Reabsorption index1 at 4 weeks | 93% | 89%2 | ||
| Categorical values | Number of participants with residual effusion at 4 weeks | 26/34 (76.5%) | 39/50 (78%) | |
| Number of participants with residual effusion at 8 weeks | 19/34 (55.9%) | 30/50 (60%) | ||
| Number of participants with residual effusion at 24 weeks | 2/34 (5.9%) | 3/50 (6%) | ||
| Number of participants with residual effusion at 4 weeks | 38/99 (38.4%) | 56/98 (57.1%) | ||
| Number of participants with residual effusion at 8 weeks | 25/99 (30.3%) | 42/98 (56.1%) | ||
| Number of participants with residual effusion at 24 weeks | 10/99 (10.1%) | 25/98 (25.5%)3 | ||
| Number of participants with residual effusion at 4 weeks | 9/21 (42.9%) | 15/19 (78.9%) | ||
| Number of participants with residual effusion at 8 weeks | 5/21 (23.8%) | 12/19 (63.2%) | ||
| Number of participants with residual effusion at 24 weeks | 1/21 (4.8%) | 6/19 (31.6%) | ||
| Number of participants with residual effusion at 8 weeks | 29/32 (90.6%) | 49/50 (98%) | ||
| Number of participants with residual effusion at 24 weeks | 20/32 (62.5%) | 44/50 (88%) |
Abbreviations: N: number of participants
1Reabsorption index = (length of affected hemithorax/length of healthy hemithorax) x 100.
2P = 0.01.
3Data at this time point extrapolated from graph. Data for 4 weeks and 8 weeks from the trial authors (unpublished data).
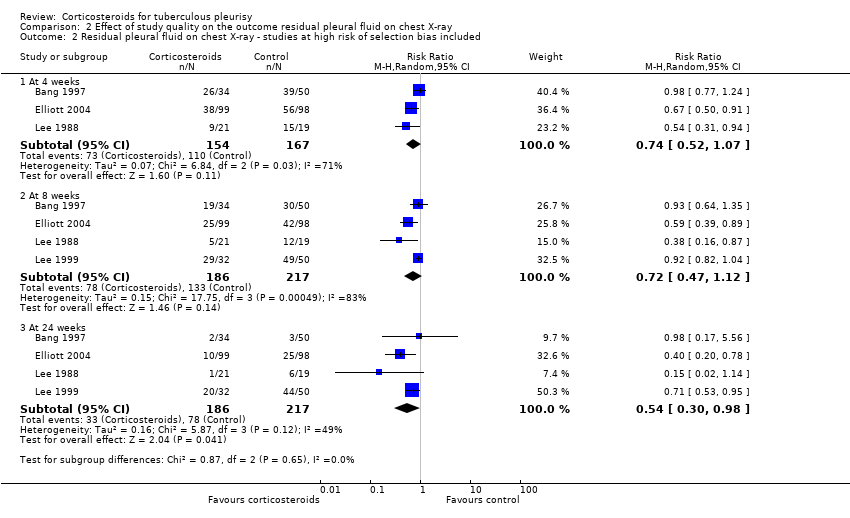
The initial meta‐analysis, which includes data from Bang 1997, Elliott 2004, Lee 1988, and Lee 1999, found substantial statistical heterogeneity at all three time points, and we conducted a subgroup analysis to explore this (Analysis 2.1; Analysis 2.2). When we excluded trials that were at high risk of bias for selection bias (randomization and allocation concealment) from the meta‐analysis, the statistical heterogeneity resolved. In these two trials it is possible that the trial investigators allocated a greater proportion of participants with more severe pleural effusions to the corticosteroid group, believing that corticosteroids would be of benefit to them (Bang 1997; Lee 1999). This would lead to bias towards the null, and a misleading summary effects estimate. For this reason, we excluded the trials that were at high risk of selection bias from the meta‐analysis.
The results showed a reduction in the risk of having residual pleural fluid on chest X‐ray at all three time points in participants treated with corticosteroids: by 36% at four weeks (RR 0.64, 95% CI 0.49 to 0.84; 237 participants, 2 trials), 45% at eight weeks (RR 0.54, 95% CI 0.37 to 0.78; 237 participants, 2 trials), and 65% at 24 weeks (RR 0.35, 95% CI 0.18 to 0.66; 237 participants, 2 trials).
Pleural changes on chest X‐ray at the end of treatment
Five trials reported on chest X‐ray changes to the pleura at the end of treatment (Bang 1997; Galarza 1995; Lee 1988; Lee 1999; Wyser 1996). The terms 'pleural thickening' and 'pleural adhesions' were used to describe these changes, and in some cases seemed to be used interchangeably. We found that corticosteroids may reduce the risk of having pleural changes on chest X‐ray after at least six months by 28% (RR 0.72, 95% CI 0.57 to 0.92; 393 participants, 5 trials, low certainty evidence; Analysis 1.2).
One trial, Galarza 1995, attempted to quantify the degree of pleural thickening by measuring the maximal pleural thickening in millimetres at 1, 6, and 12 months after enrolment, and reported the mean maximal pleural thickness for each treatment group. The prednisolone group had a mean maximal pleural thickness of 1.77 mm (range 0 to 40 mm), and for the placebo group 2.23 mm (0 to 15 mm), with a P value of more than 0.05.
Wyser 1996 also performed high resolution CT scan of the chest in most participants, and found 17/32 participants in the prednisolone group and 21/35 participants in the placebo group had pleural thickening at the end of treatment using this test (P = 0.52).
None of the included trials looked at the extent of pleural changes on chest X‐ray in terms of area of pleural change.
Change in respiratory function
Two trials with 191 participants measured improvement in respiratory function and found no difference between the groups (Galarza 1995; Wyser 1996). We have summarized the results in Table 7.
| Trial | Indicator | Units | Corticosteroids | Control |
| Percentage predicted FVC | Mean percentage predicted FVC | 95% (N = 57) | 95% (N = 60)1 | |
| Percentage predicted FVC | Mean percentage predicted FVC | 85% (N = 34) | 80% (N = 36)2 | |
| Lung function impairment | Number of participants with restrictive PFT results | 11/34 (33.3%) | 14/36 (39.4%)3 |
Abbreviations: FVC: forced vital capacity; N: number of participants; PFT: pulmonary function tests
1Range 65% to 130% in steroid group, 63% to 140% in placebo group.
2Read from graph, P = 0.65.
3P = 0.72. Results extrapolated from percentages.
In Galarza 1995, mean forced vital capacity (FVC) was 95% in both the treatment and control groups at the end of treatment; in Wyser 1996 it was 85% in the corticosteroids group and 80% in the placebo group (P = 0.65). We could not perform a meta‐analysis due to insufficient reported data.
Disability
None of the included trials looked at disability or functional impairment after treatment for TB pleurisy.
Death from any cause
Only Elliott 2004 reported any deaths, with 36/99 deaths in the prednisolone group, and 39/98 deaths in the placebo group, meaning the relative risk of death in the prednisolone group was 0.91 (95% CI 0.64 to 1.31; 197 participants, 1 trial; Analysis 1.3), which indicated that prednisolone did not confer a survival benefit. The trial authors commented that mortality rates were higher in participants with low CD4+ cell counts on enrolment to the trial.
Adverse effects of treatment
More participants in the corticosteroid group had adverse events leading to discontinuation of the study drug (RR 2.78, 95% CI 1.11 to 6.94; 590 participants, 6 trials, low certainty evidence; Analysis 1.4). We have summarized the results in Table 8.
| Trial | Corticosteroid | Control |
| 1/34 (2.9%)1 | 0/50 | |
| 9/99 (9.1%)2 | 2/98 (2.0%) | |
| 0/57 | NR | |
| 1/21 (4.8%)3 | NR | |
| NR | NR | |
| 4/34 (11.8%) | 3/36 (8.3%)4 |
Abbreviations: NR: not reported
1Aggravation of epigastric pain in one patient, steroids stopped, and patient withdrawn from the trial.
2Trial drug discontinued for hyperglycaemia (two participants), hypertension (three participants), herpes zoster (three participants), oesophageal candidiasis (one participant) in the corticosteroid group; in the placebo group hyperglycaemia (one participant) and hypertension (one participant).
3One participant developed moon facies, epigastric pain, and lower limb oedema, all of which resolved on tapering the dosage.
4Epigastric pain was the only adverse effect noted, and affected four participants in the steroid group and three in the control group.
There was variation in the level of detail reported across the different trials, and assessment of participants to detect adverse effects of treatment also varied.
Bang 1997 reported one participant from the corticosteroid group was withdrawn from the study due to aggravation of epigastric pain.
Lee 1988 reported one participant from the corticosteroid group developed moon‐shaped face, epigastric pain, and lower limb oedema which resolved on tapering the study drug.
Wyser 1996 reported that the only adverse effect observed was epigastric pain, which affected 4/34 participants in the corticosteroid group and 3/36 participants in the placebo group.
Elliott 2004 reported 9/99 participants in the corticosteroid group stopped the trial drug due to hyperglycaemia (two participants), hypertension (three participants), herpes zoster (three participants), or oesophageal candidiasis (one participant). In the placebo group 2/98 participants stopped the trial drug; one participant due to hyperglycaemia and one participant due to hypertension.
Galarza 1995 reported no adverse events in either treatment group, and Lee 1999 reported no significant adverse events in the participants treated with steroids.
HIV‐associated adverse events
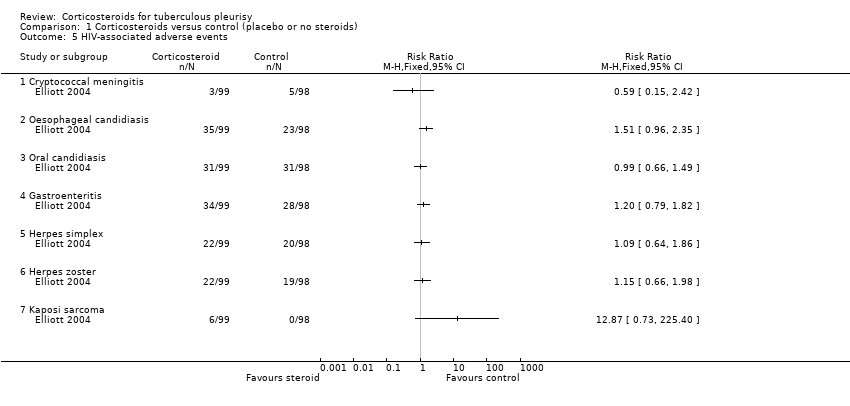
Only Elliott 2004 included HIV‐positive participants. The trial reported adverse events related to HIV, including candidiasis, herpes simplex and herpes zoster, cryptococcal meningitis, gastroenteritis, and Kaposi's sarcoma (summarized in Table 9). For most of these adverse events there was no difference between the corticosteroid and placebo groups. For Kaposi's sarcoma, there was a statistically non‐significant trend towards increased risk with corticosteroids: 6/99 in the corticosteroid group developed Kaposi's sarcoma compared with 0/98 in the placebo group (RR 12.87, 95% CI 0.73 to 225.40; 197 participants, 1 trial, very low certainty evidence).
| Trial | Indicator | Control (N/98) | Corticosteroid (N/99) |
| Kaposi’s sarcoma | 0 | 6 (6.1%) | |
| Cryptococcal meningitis | 5 (5.1%) | 3 (3.0%) | |
| Oesophageal candidiasis | 23 (23.5%) | 35 (35.4%) | |
| Oral candidiasis | 31 (32.6%) | 31 (31.3%) | |
| Herpes zoster | 19 (19.4%) | 22 (22.2%) | |
| Oral or genital herpes simplex | 20 (20.4%) | 22 (22.2%) | |
| Gastroenteritis | 28 (28.6%) | 34 (34.3%) |
Abbreviations: N: number of participants
Discussion
Summary of main results
See 'Summary of findings' table 1 (summary of findings Table for the main comparison).
Six trials met the inclusion criteria; we have not included any new trials since the 2007 version of this Cochrane Review (Engel 2007), and we did not find any trials in progress that address this question.
There was a trend towards faster resolution of symptoms, such as fever and chest pain, with corticosteroids across all included trials, but the trials reported insufficient data to produce a meta‐analysis addressing time to resolution of symptoms, and there were variations across studies in terms of which symptoms were reported and who the participants were monitored and assessed.
Corticosteroids probably reduce the time to resolution of pleural effusion.
Corticosteroids may reduce risk of pleural changes on chest X‐ray at the end of treatment by 28% (RR 0.72, 95% CI 0.57 to 0.92; 393 participants, 5 trials, low certainty evidence). On average, half the participants in the control group had pleural changes at the end of at least six months, giving an estimated absolute risk reduction of 14% with corticosteroids.
There was insufficient data to draw conclusions about the effect of corticosteroids on respiratory function after treatment, and none of the included trials reported on disability after treatment. Only one trial reported on death (Elliott 2004), and the trial authors' analysis suggests that death was related to low CD4+ cell counts, which implied that death was related to severity of HIV disease. Corticosteroids had no effect on all‐cause mortality in this trial (RR 0.91, 95% CI 0.64 to 1.31; 197 participants, 1 trial).
Corticosteroids may increase risk of adverse events leading to discontinuation of the study drug (RR 2.78, 95% CI 1.11 to 6.94; 587 participants, 6 trials, low certainty evidence). Commonly reported adverse effects included epigastric pain, hypertension, and hyperglycaemia.
Only one trial included HIV‐positive people and reported on HIV‐associated adverse events (Elliott 2004). While there was no significant difference between the corticosteroid and placebo groups for any of the conditions observed, Kaposi's sarcoma was only observed in the group receiving steroids: 6/99 in the corticosteroid group developed Kaposi's sarcoma compared with 0/98 in the placebo group (RR 12.87, 95% CI 0.73 to 225.40; 197 participants, 1 trial, very low certainty evidence).
Overall completeness and applicability of evidence
The six trials included male and female participants, who were mostly HIV‐negative adults. One trial included children over the age of 11 years (Galarza 1995), and one trial included only HIV‐positive adults (Elliott 2004). The trials reflected the fact that pleural TB is more common in adults, but HIV‐positive people are under‐represented in this review, and the results of the pooled estimates may be less applicable to HIV‐positive people. The included trials were all conducted in tertiary hospital settings, in a countries varying from low to high TB burden and HIV prevalence.
The method of diagnosis of pleural TB varied between the included trials (see Table 3), but were representative of diagnostic tests commonly available in high‐ and middle‐income settings. Culture and histopathology are less accessible in low‐income settings, where diagnosis may be based on clinical presentation and X‐ray findings alone.
The antituberculous treatment (ATT) that participants received varied across the included trials, and in some trials the treatment given was significantly different from widely recommended first‐line treatment for drug‐sensitive TB (see Table 2). Most notably, the older trials included either two drugs (Lee 1988), or three drugs (Galarza 1995; Wyser 1996), in their regimens rather than all four currently recommended first‐line drugs in the intensive phase of treatment. Participants were given at least six months of ATT in all trials. This variation in ATT was not associated with statistically significant heterogeneity in any of our analyses. As the more recent trials used regimens that are the same or very similar to currently recommended regimens for drug‐sensitive TB, it is unlikely that the variation in ATT regimens between the trials limits the applicability of the evidence.
For some outcomes, such as respiratory function and time to resolution of symptoms, incomplete reporting of data and differences in units meant that we could not combine data to generate a summary effects estimate.
Quality of the evidence
We assessed the quality of the evidence using the GRADE approach (Jüni 2001), and reported the outcomes in a 'Summary of findings' table (summary of findings Table for the main comparison).
For time to resolution of pleural effusion, we combined data on residual pleural fluid on chest X‐ray from four trials. As described in the results section, after exploring high unexplained statistical heterogeneity for this outcome, we chose to exclude the two trials that were at high risk of selection bias from the final analysis to avoid a misleading summary estimate of effect. The exclusion of studies from the meta analysis generates uncertainty, and therefore we chose to downgrade by one because of this. We also downgraded for imprecision; the number of participants and events is small, the meta analysis is probably underpowered.
We graded the summary effects estimate for pleural changes at the end of treatment as low certainty evidence, and downgraded due to concerns about risk of bias relating to randomization and allocation methods, and for imprecision relating to the relatively small number of events and participants.
For long‐term functional respiratory impairment, we graded the quality of the evidence as very low. Meta‐analysis was not possible for this outcome due to insufficient reporting of data, and we reported the available data in Table 7. Although two trials reported the mean percentage predicted forced vital capacity (FVC) at the end of treatment (Galarza 1995, Wyser 1996), neither the results per participant nor the variance were reported.
For adverse events leading to discontinuation of the trial drug, we assessed the quality of the evidence as low. We downgraded for risk of bias relating to randomization and allocation concealment, and also reporting as some trials did not report on adverse events in detail. Also a few only referred to adverse effects associated with steroids in the steroid group, which raised the concern that adverse events in the control group were not detected or reported.
For adverse events relating to HIV, we graded the estimates of effect relating to two serious, life‐threatening HIV‐related diseases — cryptococcal meningitis and Kaposi's sarcoma — and judged the quality of the evidence to be very low. We downgraded by two for imprecision caused by the small number of events and participants, and also by one for indirectness as the participants were all from one single‐centre trial and none were on antiretroviral therapy. These estimates of effect may not be applicable to HIV‐positive people in other settings or those taking antiretroviral therapy.
Potential biases in the review process
We attempted to limit bias in the review process. Vittoria Lutje, the Cochrane Infectious Diseases Group Information Specialist, conducted the literature searches, and it is unlikely that these searches missed any major trials; however, we cannot rule out the possibility that we missed some small unpublished trials. The funnel plot did not assist with this because there were too few included trials. To limit bias in the trial selection process and data extraction, we independently examined the search results, determined study selection, and extracted data.
Agreements and disagreements with other studies or reviews
There are relatively few studies and reviews on this topic in the literature. We could find no other systematic reviews that address this question. Chapman 2004, a narrative review of the diagnosis and management of pleural space infection, comments that the role of steroids is uncertain as study findings are conflicting, and do not provide information about the effect of steroids on long‐term lung function and mortality. Another narrative review, Ferreiro 2014, drew similar conclusions, and noted that the conflicting results between studies and the possibility raised by Elliott 2004 that use of corticosteroids in HIV‐positive patients with TB pleurisy may lead to increased risk of Kaposi's sarcoma. Kadhiravan 2010 commented on the previous version of this review (Engel 2007), and noted that while there appears to be an effect of corticosteroids on pleural thickening, the available evidence does not show an effect on lung function.

Study flow diagram.

'Risk of bias' graph: review authors' judgements about each 'Risk of bias' item presented as percentages across all included trials.
'Risk of bias' summary: review authors' judgements about each 'Risk of bias' item for each included trial.

Comparison 1 Corticosteroids versus control (placebo or no steroids), Outcome 1 Residual pleural effusion on chest X‐ray.

Comparison 1 Corticosteroids versus control (placebo or no steroids), Outcome 2 Pleural changes at the end of treatment (pleural thickening and pleural adhesions).

Comparison 1 Corticosteroids versus control (placebo or no steroids), Outcome 3 Death from any cause.

Comparison 1 Corticosteroids versus control (placebo or no steroids), Outcome 4 Adverse events leading to study drug discontinuation.
Comparison 1 Corticosteroids versus control (placebo or no steroids), Outcome 5 HIV‐associated adverse events.
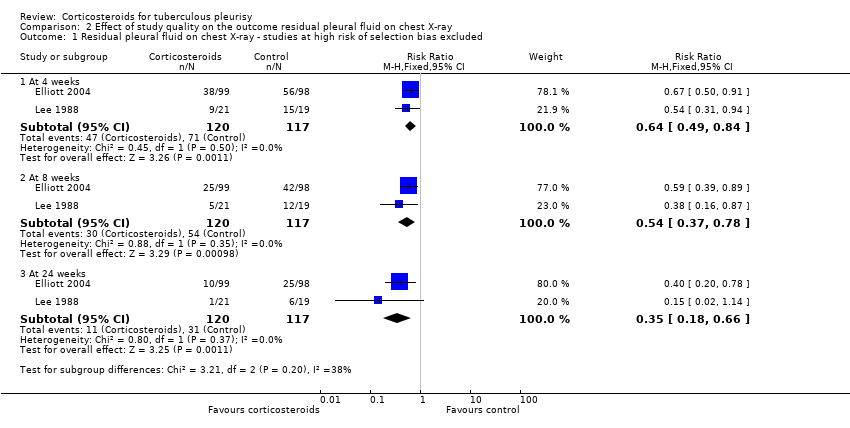
Comparison 2 Effect of study quality on the outcome residual pleural fluid on chest X‐ray, Outcome 1 Residual pleural fluid on chest X‐ray ‐ studies at high risk of selection bias excluded.
Comparison 2 Effect of study quality on the outcome residual pleural fluid on chest X‐ray, Outcome 2 Residual pleural fluid on chest X‐ray ‐ studies at high risk of selection bias included.
| Steroids compared with placebo for pleural TB | |||||
| Patient or population: adults and adolescents with pleural TB Settings: hospital care and community follow‐up Intervention: corticosteroids Comparison: placebo | |||||
| Outcomes | Illustrative comparative risks¹ (95% CI) | Relative effect | Number of participants | Certainty of the evidence | |
| Assumed risk | Corresponding risk | ||||
| Control | Corticosteroids | ||||
| Residual pleural fluid on chest X‐ray at 8 weeks | 62 per 100 | 33 per 100 (23 to 48) | RR 0.54 (0.37 to 0.78) | 237 (2 trials) | ⊕⊕⊝⊝1,2,3,4 |
| Residual pleural fluid on chest X‐ray at 24 weeks | 29 per 100 | 10 per 100 (5 to 19) | RR 0.35 (0.18 to 0.66) | 237 (2 trials) | ⊕⊕⊝⊝1,2,3,4 low |
| Pleural changes at the end of follow‐up (pleural adhesions or pleural thickening on chest X‐ray; follow‐up 6 to 24 months) | 50 per 100 | 36 per 100 (29 to 46) | RR 0.72 (0.57 to 0.92) | 393 (5 trials) | ⊕⊕⊝⊝5,6,7 |
| Long‐term functional respiratory impairment (> 6 months) | — | — | Average percentage predicted FVC similar in corticosteroid and control groups. | 187 (2 trials) | ⊕⊝⊝⊝8 |
| Adverse events leading to treatment discontinuation (follow‐up 6 to 24 months) | 1 per 100 | 3 per 100 | RR 2.78 (1.11 to 6.94) | 590 | ⊕⊕⊝⊝9,10 |
| HIV‐related infections (cryptococcal meningitis) | 5 per 100 | 3 per 100 (1 to 12) | RR 0.59 (0.15 to 2.42) | 103 (1 trial) | ⊕⊝⊝⊝11,12 |
| HIV‐related cancer (Kaposi's sarcoma) | 14 per 100013 | 180 per 1000 (1 to 316) | RR 12.87 (0.73 to 225.40) | 103 (1 trial) | ⊕⊝⊝⊝14,15 |
| ¹The basis for the assumed risk (for example, the median control group risk across studies) is provided in footnotes. The corresponding risk (and its 95% CI) is based on the assumed risk in the comparison group and the relative effect of the intervention (and its 95% CI). | |||||
| GRADE Working Group grades of evidence | |||||
| 1Downgraded by one for risk of bias: of the four trials that reported this outcome, we excluded two trials from the final analysis due to high risk of selection bias, after a subgroup analysis suggested the pooled estimate including these studies could be misleading (Bang 1997; Lee 1999). We judged this to be our best estimate of effect. However because we excluded trials from this analysis this generates uncertainty, so we have downgraded the quality of the evidence. | |||||
| Clinical Feature | Isolated pleural TB | Pleuro‐pulmonary TB |
| Sputum microscopy/culture | Negative | Some positive |
| Pleural fluid | Usually demonstrates exudative effusion Usually negative for M. tuberculosis on smear and culture | Usually demonstrates exudative effusion Usually negative for M. tuberculosis on smear and culture |
| Chest X‐ray | Discrete pleural effusion, or pleural thickening, or both | Pleural effusion with other changes such as consolidation, cavities, atelectasis, or hilar enlargement |
| Chest computed tomography (CT) | May demonstrate underlying lung infection | Demonstrates underlying lung infection |
| Pathogenesis | Predominantly driven by delayed type hypersensitivity reaction | Predominantly driven by TB infection of the lung |
| Prognosis | Most people will improve with no antituberculous treatment (ATT), but may experience a relapse of TB infection | People may deteriorate and die without ATT |
| Trial | Country | Year | Participants | Adults or children | HIV status | ATT regimen | Therapeutic thoracocentesis performed | |
| Steroid group | Control group | |||||||
| South Korea | 1991 to 1994 | 34 | 50 | Adults | Not reported | 2RHZE/7RHE | No | |
| Uganda | 1998 to 2002 | 99 | 98 | Adults | Positive | 2RHZE/4RH | No | |
| Spain | 1985 to 1992 | 57 | 60 | Both | Negative | 6RH | Yes | |
| Taiwan | 1983 to 1987 | 21 | 19 | Adults | Not reported | 3RHE/6‐9RH | No | |
| South Korea | 1990 to 1997 | 50 | 32 | Adults | Not reported | 6RHZE or 2RHZS/4RHZ | No | |
| South Africa | 1994 to 1995 | 34 | 36 | Adults | Negative | 6RHZ | Yes | |
| Abbreviations: ATT: antituberculous treatment; E: ethambutol; H: isoniazid; R: rifampicin; S: streptomycin; Z: pyrazinamide. | ||||||||
| Trial | Diagnostic criteria for pleural TB | Other diagnostic tests |
| Microscopy positive for AFB or culture positive from sputum, pleural fluid, or pleural biopsy. |
| |
| Positive culture from pleural biopsy, pleural fluid, or sputum, or histopathologic analysis of pleural biopsy consistent with tuberculous pleurisy |
| |
| At least one of the following
|
| |
| Pleural biopsy reported as pleural TB or chronic granulomatous inflammation |
| |
| TB on pleural biopsy, or pleural effusion plus AFB stain positive or culture positive from sputum, pleural fluid, or pleural biopsy |
| |
| Pleural biopsy with caseating granulomata with or without AFB on histological examination, or positive culture. |
| |
| Abbreviations: ADA: adenosine deaminase activity; AFB: acid‐fast bacilli; CT: computed tomography; ELISA: enzyme‐linked immunosorbent assay; FEV1: forced expiratory volume at one second; FVC: forced vital capacity; HIV: human immunodeficiency virus; PPD: purified protein derivative; PPD‐S: purified protein derivative‐standard; TB: tuberculosis | ||
| Trial | Steroid | Regimen |
| Prednisolone | 1 mg/kg twice daily, tapered by 10 mg each week until cessation | |
| Prednisolone | 50 mg daily for 2 weeks, 40 mg daily for 2 weeks, then 25 mg daily for 2 weeks, then 15 mg daily for 2 weeks, then stopped | |
| Prednisone | 1 mg/kg/day for 15 days, tapering over the next 15 days | |
| Prednisolone | 0.75 mg/kg/day, tapered by 5 mg per week until discontinued once radiological improvement was seen | |
| Prednisolone | 30 mg four times daily for 1 month and tapered over the following month | |
| Prednisone | 0.75 mg/kg/day for 2 to 4 weeks; dose tapered by 5 mg/day over 2 weeks after clinical and radiological improvement | |
| Abbreviations: mg: milligrams | ||
| Trial | Indicator | Units | Corticosteroids | Control | |
| Mean values | “Fever, pleuritic pain, malaise and breathlessness” | Mean days to resolution | 3.8 (N = 34) | 7.41 (N = 50) | |
| “Fever duration” | Mean days | 3.32 (N = 57) | 4.15 (N = 60) | ||
| “Fever, pleuritic pain, malaise and breathlessness” | Mean days to resolution | 2.4 (N = 21) | 5.6 (N = 19) | ||
| Cut‐offs (categorical) | “Anorexia” | Number of participants with anorexia at 4 weeks | 3/99 (3%) | 18/98 (18.4%) | |
| “Cough” | Number of participants with cough at 4 weeks | 35/99 (35.4%) | 57/98 (58.2%) | ||
| “Weight” | Mean weight in kg at 4 weeks | 57 | 52.5 | ||
| Symptoms resolved in all patients (VAS score) | Weeks | 12 | 16 | ||
| Abbreviations: kg: kilograms; VAS: visual analogue scale | |||||
| Trial | Units | Corticosteroids | Control | |
| Mean values | Mean days to resolution | 88 (N=34) | 100 (N=50) | |
| Mean days to resolution | 54.5 (N=21) | 123.2 (N=19) | ||
| Reabsorption index1 at 4 weeks | 93% | 89%2 | ||
| Categorical values | Number of participants with residual effusion at 4 weeks | 26/34 (76.5%) | 39/50 (78%) | |
| Number of participants with residual effusion at 8 weeks | 19/34 (55.9%) | 30/50 (60%) | ||
| Number of participants with residual effusion at 24 weeks | 2/34 (5.9%) | 3/50 (6%) | ||
| Number of participants with residual effusion at 4 weeks | 38/99 (38.4%) | 56/98 (57.1%) | ||
| Number of participants with residual effusion at 8 weeks | 25/99 (30.3%) | 42/98 (56.1%) | ||
| Number of participants with residual effusion at 24 weeks | 10/99 (10.1%) | 25/98 (25.5%)3 | ||
| Number of participants with residual effusion at 4 weeks | 9/21 (42.9%) | 15/19 (78.9%) | ||
| Number of participants with residual effusion at 8 weeks | 5/21 (23.8%) | 12/19 (63.2%) | ||
| Number of participants with residual effusion at 24 weeks | 1/21 (4.8%) | 6/19 (31.6%) | ||
| Number of participants with residual effusion at 8 weeks | 29/32 (90.6%) | 49/50 (98%) | ||
| Number of participants with residual effusion at 24 weeks | 20/32 (62.5%) | 44/50 (88%) | ||
| Abbreviations: N: number of participants | ||||
| Trial | Indicator | Units | Corticosteroids | Control |
| Percentage predicted FVC | Mean percentage predicted FVC | 95% (N = 57) | 95% (N = 60)1 | |
| Percentage predicted FVC | Mean percentage predicted FVC | 85% (N = 34) | 80% (N = 36)2 | |
| Lung function impairment | Number of participants with restrictive PFT results | 11/34 (33.3%) | 14/36 (39.4%)3 | |
| Abbreviations: FVC: forced vital capacity; N: number of participants; PFT: pulmonary function tests | ||||
| Trial | Corticosteroid | Control |
| 1/34 (2.9%)1 | 0/50 | |
| 9/99 (9.1%)2 | 2/98 (2.0%) | |
| 0/57 | NR | |
| 1/21 (4.8%)3 | NR | |
| NR | NR | |
| 4/34 (11.8%) | 3/36 (8.3%)4 | |
| Abbreviations: NR: not reported 1Aggravation of epigastric pain in one patient, steroids stopped, and patient withdrawn from the trial. | ||
| Trial | Indicator | Control (N/98) | Corticosteroid (N/99) |
| Kaposi’s sarcoma | 0 | 6 (6.1%) | |
| Cryptococcal meningitis | 5 (5.1%) | 3 (3.0%) | |
| Oesophageal candidiasis | 23 (23.5%) | 35 (35.4%) | |
| Oral candidiasis | 31 (32.6%) | 31 (31.3%) | |
| Herpes zoster | 19 (19.4%) | 22 (22.2%) | |
| Oral or genital herpes simplex | 20 (20.4%) | 22 (22.2%) | |
| Gastroenteritis | 28 (28.6%) | 34 (34.3%) | |
| Abbreviations: N: number of participants | |||
| Outcome or subgroup title | No. of studies | No. of participants | Statistical method | Effect size |
| 1 Residual pleural effusion on chest X‐ray Show forest plot | 2 | Risk Ratio (M‐H, Fixed, 95% CI) | Subtotals only | |
| 1.1 At 4 weeks | 2 | 237 | Risk Ratio (M‐H, Fixed, 95% CI) | 0.64 [0.49, 0.84] |
| 1.2 At 8 weeks | 2 | 237 | Risk Ratio (M‐H, Fixed, 95% CI) | 0.54 [0.37, 0.78] |
| 1.3 At 24 weeks | 2 | 237 | Risk Ratio (M‐H, Fixed, 95% CI) | 0.35 [0.18, 0.66] |
| 2 Pleural changes at the end of treatment (pleural thickening and pleural adhesions) Show forest plot | 5 | 393 | Risk Ratio (M‐H, Fixed, 95% CI) | 0.72 [0.57, 0.92] |
| 3 Death from any cause Show forest plot | 1 | 197 | Risk Ratio (M‐H, Fixed, 95% CI) | 0.91 [0.64, 1.31] |
| 4 Adverse events leading to study drug discontinuation Show forest plot | 6 | 590 | Risk Ratio (M‐H, Fixed, 95% CI) | 2.78 [1.11, 6.94] |
| 5 HIV‐associated adverse events Show forest plot | 1 | Risk Ratio (M‐H, Fixed, 95% CI) | Totals not selected | |
| 5.1 Cryptococcal meningitis | 1 | Risk Ratio (M‐H, Fixed, 95% CI) | 0.0 [0.0, 0.0] | |
| 5.2 Oesophageal candidiasis | 1 | Risk Ratio (M‐H, Fixed, 95% CI) | 0.0 [0.0, 0.0] | |
| 5.3 Oral candidiasis | 1 | Risk Ratio (M‐H, Fixed, 95% CI) | 0.0 [0.0, 0.0] | |
| 5.4 Gastroenteritis | 1 | Risk Ratio (M‐H, Fixed, 95% CI) | 0.0 [0.0, 0.0] | |
| 5.5 Herpes simplex | 1 | Risk Ratio (M‐H, Fixed, 95% CI) | 0.0 [0.0, 0.0] | |
| 5.6 Herpes zoster | 1 | Risk Ratio (M‐H, Fixed, 95% CI) | 0.0 [0.0, 0.0] | |
| 5.7 Kaposi sarcoma | 1 | Risk Ratio (M‐H, Fixed, 95% CI) | 0.0 [0.0, 0.0] | |
| Outcome or subgroup title | No. of studies | No. of participants | Statistical method | Effect size |
| 1 Residual pleural fluid on chest X‐ray ‐ studies at high risk of selection bias excluded Show forest plot | 2 | Risk Ratio (M‐H, Fixed, 95% CI) | Subtotals only | |
| 1.1 At 4 weeks | 2 | 237 | Risk Ratio (M‐H, Fixed, 95% CI) | 0.64 [0.49, 0.84] |
| 1.2 At 8 weeks | 2 | 237 | Risk Ratio (M‐H, Fixed, 95% CI) | 0.54 [0.37, 0.78] |
| 1.3 At 24 weeks | 2 | 237 | Risk Ratio (M‐H, Fixed, 95% CI) | 0.35 [0.18, 0.66] |
| 2 Residual pleural fluid on chest X‐ray ‐ studies at high risk of selection bias included Show forest plot | 4 | Risk Ratio (M‐H, Random, 95% CI) | Subtotals only | |
| 2.1 At 4 weeks | 3 | 321 | Risk Ratio (M‐H, Random, 95% CI) | 0.74 [0.52, 1.07] |
| 2.2 At 8 weeks | 4 | 403 | Risk Ratio (M‐H, Random, 95% CI) | 0.72 [0.47, 1.12] |
| 2.3 At 24 weeks | 4 | 403 | Risk Ratio (M‐H, Random, 95% CI) | 0.54 [0.30, 0.98] |