Interventions for preventing obesity in children
Referencias
References to studies included in this review
References to studies excluded from this review
References to ongoing studies
Additional references
References to other published versions of this review
Characteristics of studies
Characteristics of included studies [ordered by study ID]
| Methods | Trial design: Cluster randomised controlled trial Intervention period: 24 weeks Follow‐up period (post‐intervention): Nil Differences in baseline characteristics: Reported Reliable outcomes: Reported Protection against contamination: Not Reported Unit of allocation: Classrooms Unit of analysis: Child (controlling for clustering effect of classroom) | |
| Participants | N (controls baseline) = 103 N (controls follow‐up) = 88 N (interventions baseline) = 188 N (interventions follow‐up) = 153 Setting: Schools (n = 3; Intervention: 10 classrooms, Control: 6 classrooms) Recruitment: Middle school students in Naples Geographic Region: Italy Percentage of eligible population enrolled: 95% Mean Age: Intervention: 12.3 ± 0.8; Control: 12.5 ± 0.7 Sex: Males and females | |
| Interventions | Board game Kaledo to increase nutrition knowledge:
Dietary intervention versus control | |
| Outcomes | Height, weight Physical activity Nutrition knowledge Dietary Intake Process evaluation: Not reported | |
| Implementation related factors | Theoretical basis: Not Reported Resources for intervention implementation (e.g. funding needed or staff hours required): Reported Who delivered the intervention: Reported PROGRESS categories assessed at baseline: Reported (Race) PROGRESS categories analysed at outcome: Not Reported Outcomes relating to harms/unintended effects: Not Reported Intervention included strategies to address diversity or disadvantage: Not Reported Economic evaluation: Not Reported | |
| Notes | ||
| Risk of bias | ||
| Bias | Authors' judgement | Support for judgement |
| Random sequence generation (selection bias) | Unclear risk | Cannot be determined |
| Allocation concealment (selection bias) | Unclear risk | Cannot be determined |
| Blinding (performance bias and detection bias) | Unclear risk | Cannot be determined |
| Incomplete outcome data (attrition bias) | Low risk | |
| Selective reporting (reporting bias) | Unclear risk | Protocol not available |
| Other bias | Low risk | Analysis controlled for clustering effect of classroom |
| Methods | Trial Design: Randomised controlled trial All analyses were performed according to intention to treat principles | |
| Participants | N (controls baseline) = 16 Recruitment: all consenting 8‐year old, African American girls = 50th percentile for age and gender BMI, with a parent willing to be involved. Set in Texas, US. Proportion of eligibles participating: Not stated, but children needed access to Internet Mean Age: Intervention: 8.3 (SD 0.3); Controls: 8.4 (SD 0.3) years. | |
| Interventions | Set in summer camps and homes, the intervention was delivered by trained personnel in camp and researchers via a website. The intervention was designed to prevent obesity and aimed to increase fruit, vegetable and water consumption, and enhance physical activity. Intervention continued via a website with weekly visits. The pilot also evaluated the feasibility of a larger trial. [Combined effects of dietary interventions and physical activity interventions versus control] | |
| Outcomes | BMI Physical activity: CSA accelerometer, Dietary intake measured by two 24 hour recalls using Nutrition Data System computer programme (NDS‐R). Monitoring website usage. Process Evaluation: Reported | |
| Implementation related factors | Theoretical basis: Social cognitive theory and family systems theory Resources for intervention implementation (e.g. funding needed or staff hours required): Not Reported Who delivered the intervention: Reported PROGRESS categories assessed at baseline: Reported (Race, Education, SES) PROGRESS categories analysed at outcome: Not Reported Outcomes relating to harms/unintended effects: Not Reported Intervention included strategies to address diversity or disadvantage: Reported Economic evaluation: Not Reported | |
| Notes | ||
| Risk of bias | ||
| Bias | Authors' judgement | Support for judgement |
| Random sequence generation (selection bias) | Low risk | "Random assignment was conducted in an urn randomisation procedure, through telephone contact to the coordinating centre…" |
| Allocation concealment (selection bias) | Unclear risk | Cannot be determined |
| Blinding (performance bias and detection bias) | Unclear risk | Cannot be determined |
| Incomplete outcome data (attrition bias) | Unclear risk | Cannot be determined |
| Selective reporting (reporting bias) | High risk | Did not report % body fat at follow‐up despite noting this as a measure and recording at baseline |
| Other bias | High risk | Statistically significant differences between groups in BMI at baseline |
| Methods | Trial Design: Randomised controlled trial Intervention period: Twelve weeks Follow‐up period (post‐intervention): Nil | |
| Participants | ||
| Interventions | ||
| Outcomes | Body Mass Index Physical activity: accelerometer CSA, Dietary intake measured by two 24 hour recalls using Nutrition Data System computer programme (NDS‐R). Psychological variables: Process evaluation: Reported | |
| Implementation related factors | ||
| Notes | ||
| Risk of bias | ||
| Bias | Authors' judgement | Support for judgement |
| Random sequence generation (selection bias) | Low risk | "...urn randomization procedure was used to generate the treatment allocation sequences. The different sequences were stored on a computer at the CC, and accessed using an interactive voice‐response telephone system." (Rochon 2003) |
| Allocation concealment (selection bias) | Unclear risk | Cannot be determined |
| Blinding (performance bias and detection bias) | Unclear risk | Cannot be determined |
| Incomplete outcome data (attrition bias) | Low risk | no missing outcome data |
| Selective reporting (reporting bias) | High risk | Did not report % body fat at endpoint despite noting this as a measure and recording at baseline |
| Other bias | Low risk | |
| Methods | Trial Design: Cluster randomised controlled trial Follow‐up (post‐intervention): Nil Primary analysis applied the intention to treat principle and missing data at follow‐up was imputed based on a prediction equation developed using control school data and Rubin's multiple imputation method. | |
| Participants | N (controls baseline) = 835 Proportion of eligibles participating: Not stated, but schools had to provide: >15 3rd graders; 90% American Indian; retention of 3‐5 grades over 70% in past 3 years; school meals prepared on site; facilities for PA programme; approval of study by school, community and tribal authorities. Mean Age: 7.6 (SD 0.6) years | |
| Interventions | School‐based multi‐component trial utilising school curriculum and existing staff resources trained by licensed SPARK (Sports, Play and active Recreation for Kids, see Sallis et al. 1993) instructors and Pathways personnel who also acted as mentors. The intervention aimed to attenuate obesity and reduce percentage body fat. Combined effects of dietary interventions and physical activity interventions versus control | |
| Outcomes | BMI Process Evaluation: Reported | |
| Implementation related factors | Theoretical basis: Social learning theory and principles of American Indian culture and practice Resources for intervention implementation (e.g. funding needed or staff hours required): Reported Who delivered the intervention: Reported PROGRESS categories assessed at baseline: Reported (Gender) PROGRESS categories analysed at outcome: Reported (Gender) Outcomes relating to harms/unintended effects: Not Reported Intervention included strategies to address diversity or disadvantage: Reported Economic evaluation: Not Reported | |
| Notes | ||
| Risk of bias | ||
| Bias | Authors' judgement | Support for judgement |
| Random sequence generation (selection bias) | Unclear risk | Cannot be determined |
| Allocation concealment (selection bias) | Unclear risk | Cannot be determined |
| Blinding (performance bias and detection bias) | Low risk | Assessors were not involved in delivering intervention so as a result were likely blinded |
| Incomplete outcome data (attrition bias) | Low risk | Missing data balanced across groups and imputation method given |
| Selective reporting (reporting bias) | Unclear risk | Protocol not available |
| Other bias | Low risk | Unit of analysis issues addressed |
| Methods | Trial design: Cluster randomised controlled trial Intervention period: 4 years Follow‐up period (post‐intervention): Nil Differences in baseline characteristics: Reported Reliable outcomes: Reported Protection against contamination: Not Reported Unit of allocation: School Unit of analysis: School All analyses were performed according to intention to treat principles | |
| Participants | N (controls baseline) = 473 N (interventions baseline) = 423 N (interventions follow‐up) = 744 Setting [and number by trial group]: 8 schools (n = 4 intervention; n = 4 control) Recruitment: Intervention schools chosen randomly from schools that had applied to participate in the programme in 1999. Control schools matched by district and geographic location. All children in 3rd grade invited to participate. Geographic Region: El Paso, Texas ‐ along US‐Mexico border region Percentage of eligible population enrolled: 94% Mean Age: Control: 8.3 ± 0.5 years (boys); 8.3 ± 0.5 years (girls) Intervention: 8.3 ± 0.5 years (boys); 8.2 ± 0.45 years (girls) Sex Intervention: 47% female | |
| Interventions | Intervention schools: received money ($3500 in first year, $2500 in second year, $1500 for third year and $1000 for fourth year) for purchasing equipment and paying substitutes so that PE teachers and food service staff could attend training, and for promotion of CATCH programme at each school. Classroom materials were also subsidised (CATCH PE guidebook, PE activity box for grades 3 through 5, curriculum material for grades 3 through 5 and the EATSMART manual). Control schools: did not receive any of the El Paso CATCH programme materials and did not attend any training for the programme. Received $1000 at the start of each school year to encourage participation. Also received some data i.e. at start of 4th grade, the 3rd grade summary results were provided to both intervention and control schools. Combined effects of dietary interventions and physical activity interventions versus control | |
| Outcomes |
Process evaluation: Reported | |
| Implementation related factors | Theoretical basis: Not reported Resources for intervention implementation (e.g. funding needed or staff hours required): Reported Who delivered the intervention: Reported PROGRESS categories assessed at baseline: Reported (Race, Gender, SES) PROGRESS categories analysed at outcome: Reported (Gender) Outcomes relating to harms/unintended effects: Not Reported Intervention included strategies to address diversity or disadvantage: Reported Economic evaluation: Not Reported | |
| Notes | ||
| Risk of bias | ||
| Bias | Authors' judgement | Support for judgement |
| Random sequence generation (selection bias) | High risk | "Participant schools were chosen randomly from those schools that had completed an application to participate" in CATCH programme. Not clear how this was done. Control schools matched and assigned, probably not using randomly generated sequence. Authors describe design as quasi‐experimental |
| Allocation concealment (selection bias) | Unclear risk | Allocation may have been concealed but it is not clear. There was cluster allocation. |
| Blinding (performance bias and detection bias) | High risk | blinding probably not carried out for participants or outcome assessors |
| Incomplete outcome data (attrition bias) | Low risk | Intention to treat analysis conducted |
| Selective reporting (reporting bias) | High risk | Incomplete reporting of outcome data. No anthropometry data at endpoint (authors state no effect but no data provided) |
| Other bias | Low risk | School‐level dependent measures were analysed by group and time |
| Methods | Trial Design: Cluster randomised controlled trial Follow‐up (Post‐intervention): Nil | |
| Participants | N (controls baseline) = 83 Proportion of eligibles participating: Not stated Mean Age: 4.0 years | |
| Interventions | Preschool and day care centre based intervention delivered by one early childhood teacher and a music teacher. This was part of larger 'Brocodile the Crocodile' health promotion programme which lasted for 39 weeks for 1 hour each week including 32 sessions on healthy eating. Seven educational sessions assessed intervention to encourage reduction of TV viewing for both parents and children. Physical activity interventions versus control | |
| Outcomes | BMI Parental estimates of child's sedentary activity in previous week in hours, and to estimate number of hours usually spent in these activities for each weekend day and each week day Alternate activities as a result of reduced TV viewing were not stated/measured Process Evaluation: Not Reported | |
| Implementation related factors | Theortetical basis: Not Reported Resources for intervention implementation (e.g. funding needed or staff hours required): Reported Who delivered the intervention: Reported PROGRESS categories assessed at baseline: Reported (Race, Occupation, ) PROGRESS categories analysed at outcome: Not Reported Outcomes relating to harms/unintended effects: Not Reported Intervention included strategies to address diversity or disadvantage: Not Reported Economic evaluation: Not Reported | |
| Notes | ||
| Risk of bias | ||
| Bias | Authors' judgement | Support for judgement |
| Random sequence generation (selection bias) | Low risk | "Randomisation performed in random permutations of the numbers 1 and 2…" |
| Allocation concealment (selection bias) | Low risk | Centres agreed to participate, then randomisation was performed at the centre level on all centres at the start of the study |
| Blinding (performance bias and detection bias) | High risk | Not blinded |
| Incomplete outcome data (attrition bias) | Low risk | Participant flow through study provided and reasons given for missing data |
| Selective reporting (reporting bias) | Unclear risk | Protocol not available |
| Other bias | High risk | Unit of analysis issues not addressed |
| Methods | Trial design: cluster randomised controlled trial Intervention period: 3 years Follow‐up period (post‐intervention): Teachers surveyed 9 months after completion Differences in baseline characteristics: Reported Reliable outcomes: Reported Protection against contamination: Not reported Unit of allocation: School Unit of analysis: Individual; School (correlation between BMI change and weekly PAAC minutes) All analyses were performed according to intention to treat principles | |
| Participants | N (controls baseline) = 713 N (controls follow‐up) = 698 N (interventions baseline) = 814 N (interventions follow‐up) = 792 Setting [and number by trial group]: Schools (n = 14 intervention, n = 10 control) Recruitment: All students in grades 2 and 3 at baseline in participating schools (since it was adopted as a curriculum) Geographic Region: Northeast Kansas, USA Percentage of eligible population enrolled: 92% Mean Age: Grade 2: Female (C: 7.8, 0.4; I: 7.7, 0.3); Male (C: 7.8, 0.3; I: 7.7, 0.4) Grade 3: Female (C: 8.7, 0.4; I: 8.7, 0.4); Male (C: 8.8, 0.4; I: 8.7, 0.3) Sex: Both Males and Females | |
| Interventions |
Physical activity interventions versus control | |
| Outcomes | BMI Accelerometry (sub‐sample only) Learning outcomes Process evaluation: Reported | |
| Implementation related factors | Theoretical basis: Not reported Resources for intervention implementation (e.g. funding needed or staff hours required): Reported Who delivered the intervention: Reported PROGRESS categories assessed at baseline: Reported (Race, Gender, SES) PROGRESS categories analysed at outcome: Reported (Gender) Outcomes relating to harms/unintended effects: Not Reported Intervention included strategies to address diversity or disadvantage: Not Reported Economic evaluation: Not Reported | |
| Notes | ||
| Risk of bias | ||
| Bias | Authors' judgement | Support for judgement |
| Random sequence generation (selection bias) | Unclear risk | Cannot be determined |
| Allocation concealment (selection bias) | Unclear risk | Cannot be determined |
| Blinding (performance bias and detection bias) | Low risk | RAs blinded to condition for measurement of primary and secondary outcomes and data entry. RA who conducted classroom visitations not blinded |
| Incomplete outcome data (attrition bias) | Low risk | |
| Selective reporting (reporting bias) | Unclear risk | Cannot be determined |
| Other bias | Low risk | Analysis conducted at both individual and school level |
| Methods | Trial Design: randomised controlled trial | |
| Participants | N (controls baseline) = 50 Setting [and number by trial group]: Home (intervention n = 53; control n = 50) Geographic Region: USA Percentage of eligible population enrolled: 77% Mean Age: Control: 15.8 ± 1.1 years Sex: Control: 54% female | |
| Interventions | Intervention
Control
Dietary interventions vs control | |
| Outcomes | BMI Process Evaluation: Reported | |
| Implementation related factors | Theoretical basis: Not Reported Resources for intervention implementation (e.g. funding needed or staff hours required): Reported Who delivered the intervention: Reported PROGRESS categories assessed at baseline: Reported (Race, Gender, SES) PROGRESS categories analysed at outcome: Reported (Gender) Outcomes relating to harms/unintended effects: Not Reported Intervention included strategies to address diversity or disadvantage: Not Reported Economic evaluation: Not Reported | |
| Notes | ||
| Risk of bias | ||
| Bias | Authors' judgement | Support for judgement |
| Random sequence generation (selection bias) | Low risk | Eligible subjects were entered sequentially onto a list of random group assignments prepared in advance by the study statistician, stratified by gender and BMI. Sequence of random assignments was permutated within stratum in blocks of 2, 4 and 6 |
| Allocation concealment (selection bias) | Low risk | To avoid any bias in the enrolment procedure, personnel conducting recruitment were masked to the sequence |
| Blinding (performance bias and detection bias) | Unclear risk | Interviewer for dietary and PA recall interviews was masked to group assignment. Not clear whether people conducting BMI measures (primary endpoint) were masked to group assignment. Participants not masked. |
| Incomplete outcome data (attrition bias) | Low risk | All participants completed study |
| Selective reporting (reporting bias) | Unclear risk | Protocol not available |
| Other bias | Low risk | |
| Methods | Trial Design: randomised controlled trial | |
| Participants | For percentage of overweight (height and weight measured but not reported) | |
| Interventions |
Dietary interventions versus control | |
| Outcomes | Percentage of overweight Process Evaluation: Not Reported | |
| Implementation related factors | Theoretical basis: Not Reported Resources for intervention implementation (e.g. funding needed or staff hours required): Reported Who delivered the intervention: Reported PROGRESS categories assessed at baseline: Reported (Gender) PROGRESS categories analysed at outcome: Reported (Gender) Outcomes relating to harms/unintended effects: Not Reported Intervention included strategies to address diversity or disadvantage: Not Reported Economic evaluation: Not Reported | |
| Notes | ||
| Risk of bias | ||
| Bias | Authors' judgement | Support for judgement |
| Random sequence generation (selection bias) | Unclear risk | Cannot be determined |
| Allocation concealment (selection bias) | Unclear risk | Cannot be determined |
| Blinding (performance bias and detection bias) | Unclear risk | Cannot be determined |
| Incomplete outcome data (attrition bias) | Low risk | No missing outcome data |
| Selective reporting (reporting bias) | Unclear risk | Protocol not available |
| Other bias | Low risk | |
| Methods | Trial design: controlled before and after study Intervention period: 16 weeks Follow‐up period (post‐intervention): Nil Differences in baseline characteristics: Reported Reliable outcomes: Reported (anthropometric, dietary intake) Protection against contamination: Contamination likely as there were control and intervention classes within the same school. Teachers of control classes were instructed not to teach about diet and nutrition during the study period. Unit of allocation: Class Unit of analysis: Individual | |
| Participants | N (controls baseline) = 80 N (controls follow‐up) = 80 N (interventions baseline) = 55 N (interventions follow‐up) = 55 Setting [and number by trial group]: 9 classes within 2 schools (n = 4 classes, intervention; n = 5 classes control) Recruitment: All schoolchildren enrolled in the 2nd grade at the 2 schools whose parents gave consent and who attended on both data collection days Geographic Region: Florianópolis, Brazil Percentage of eligible population enrolled: 70% Mean Age: Control: 8.1 ± 0.48 years Intervention: 8.2 ± 0.76 years Sex: Both Males and Females | |
| Interventions | Nutritional education programme delivered via 8 fortnightly meetings (each 50 mins) and taught using learning‐through‐play teaching methods Dietary interventions versus control | |
| Outcomes | Prevalence overweight/obese (i.e. BMI <85th percentile) Number of days on which children ate prohibited foods (0‐1 day or 2‐3 days) over two dietary recalls Distribution of children eating certain foods over the two dietary recalls Process evaluation: Not reported | |
| Implementation related factors | Theoretical basis: learning‐through‐play Resources for intervention implementation (e.g. funding needed or staff hours required): Not Reported Who delivered the intervention: Reported PROGRESS categories assessed at baseline: Reported (Gender) PROGRESS categories analysed at outcome: Not Reported Outcomes relating to harms/unintended effects: Not Reported Intervention included strategies to address diversity or disadvantage: Not Reported Economic evaluation: Not Reported | |
| Notes | ||
| Risk of bias | ||
| Bias | Authors' judgement | Support for judgement |
| Random sequence generation (selection bias) | High risk | Not randomised |
| Allocation concealment (selection bias) | High risk | |
| Blinding (performance bias and detection bias) | High risk | |
| Incomplete outcome data (attrition bias) | Low risk | |
| Selective reporting (reporting bias) | Unclear risk | No BMI/zBMI presented |
| Other bias | High risk | Foods provided in schools available to all students and outside of control of students. Different food environment between the 2 schools (public, private). For the food recall results, there are important differences between the results recorded in the text compared with that in the tables (values from the tables have been used for this review where possible). |
| Methods | Trial design: Cluster randomised controlled trial Intervention period: 14 weeks Follow‐up period (post‐intervention): 2 years Differences in baseline characteristics: Reported Reliable outcomes: Reported Protection against contamination: Not reported Unit of allocation: preschool Unit of analysis: Individual To assess possible bias in results because of children leaving school or missing anthropometric data at a specific follow‐up, two additional analyses were conducted in which authors imputed BMI 1 and 2 years post‐intervention from prior (baseline, post‐intervention, or Year 1) or subsequent (Year 2) values of BMI. | |
| Participants | N (controls baseline) = 212 N (controls follow‐up) = post‐intervention (n = 183); 1‐year follow‐up (n = 146); 2‐year follow‐up (n = 154) N (interventions baseline) = 197 N (interventions follow‐up) = post‐intervention (n = 179); 1‐year follow‐up (n = 143); 2‐year follow‐up (n = 146) Setting [and number by trial group]: Preschools (intervention n = 6; control n = 6) Recruitment: Twelve Head Start sites administered through the Archdiocese of Chicago and that served primarily African‐American children were recruited to participate. All children at these sites were eligible to participate. Geographic Region: Chicago, USA Percentage of eligible population enrolled: Not reported Mean Age: Intervention: 48.6 ± 7.6 months; Control: 50.8 ± 6.4 months Sex: Intervention: 49.7% female; Control: 50.5% female | |
| Interventions | Child intervention:
Parent intervention:
Control intervention:
Combined effects of dietary interventions and physical activity interventions versus control | |
| Outcomes | Primary: Change in BMI from baseline to Year 1 post‐intervention and Year 2 post‐intervention. Secondary:
Process evaluation: Reported | |
| Implementation related factors | Theoretical basis: Reported (social cognitive theory as the primary framework, Resources for intervention implementation (e.g. funding needed or staff hours required): Reported Who delivered the intervention: Reported PROGRESS categories assessed at baseline: Reported (Gender, Race, Education) PROGRESS categories analysed at outcome: Not Reported Outcomes relating to harms/unintended effects: Reported Intervention included strategies to address diversity or disadvantage: Reported Economic evaluation: Not Reported | |
| Notes | Intervention design reported in Fitzgibbon et al Prev Med. 2002;34:289‐97. This study is linked with results reported for another 12 preschools servicing Latino communities in Fitzgibbon et al. Obesity 2006;14:1616‐1625. | |
| Risk of bias | ||
| Bias | Authors' judgement | Support for judgement |
| Random sequence generation (selection bias) | Unclear risk | Cannot be determined |
| Allocation concealment (selection bias) | Unclear risk | Cannot be determined |
| Blinding (performance bias and detection bias) | Unclear risk | Cannot be determined |
| Incomplete outcome data (attrition bias) | Low risk | Performed adjusted analysis using two different approaches for imputation of missing data and reported both results |
| Selective reporting (reporting bias) | Unclear risk | Cannot be determined |
| Other bias | Low risk | Analysis accounted for clustering by preschool |
| Methods | Trial design: Cluster randomised controlled trial Intervention period: 14 weeks Follow‐up period (post‐intervention): 2 years Differences in baseline characteristics: Reported Reliable outcomes: Reported Protection against contamination: Not reported Unit of allocation: Preschool Unit of analysis: Individual All analyses were performed according to intention to treat principles | |
| Participants | N (controls baseline) = 199 N (controls follow‐up) = post‐intervention (n = 193); 1‐year follow‐up (n = 165); 2‐year follow‐up (n = 165) N (interventions baseline) = 202 N (interventions follow‐up) = post‐intervention (n = 196); 1‐year follow‐up (n = 178); 2‐year follow‐up (n =176) Setting [and number by trial group]: Preschools (intervention n=6; control n=6) Recruitment: Twelve Head Start sites administered through the Archdiocese of Chicago and that served primarily Latino children were recruited to participate. All children at these sites were eligible to participate. Geographic Region: Chicago, USA Percentage of eligible population enrolled: Not reported Mean Age: Intervention: 50.8 ± 7.3 months Control: 51.0 ± 7.0 months Sex: Intervention: 47.5% female Control: 51.3% female | |
| Interventions | Child intervention:
Parent intervention:
Control intervention:
Combined effects of dietary interventions and physical activity interventions versus control | |
| Outcomes | Primary: Change in BMI from baseline to Year 1 post‐intervention and Year 2 post‐intervention. Secondary:
Process evaluation: Reported | |
| Implementation related factors | Theoretical basis: Reported Resources for intervention implementation (e.g. funding needed or staff hours required): Reported Who delivered the intervention: Reported PROGRESS categories assessed at baseline: Reported (Gender, Race, Education) PROGRESS categories analysed at outcome: Not Reported Outcomes relating to harms/unintended effects: Reported Intervention included strategies to address diversity or disadvantage: Reported Economic evaluation: Not Reported | |
| Notes | Intervention design reported in Fitzgibbon et al Prev Med. 2002;34:289‐97. This study is linked with results reported for another 12 preschools primarily servicing African‐American children in Fitzgibbon et al. J Pediatr 2005;146:618‐25. | |
| Risk of bias | ||
| Bias | Authors' judgement | Support for judgement |
| Random sequence generation (selection bias) | Unclear risk | Cannot be determined |
| Allocation concealment (selection bias) | Unclear risk | Cannot be determined |
| Blinding (performance bias and detection bias) | Unclear risk | Cannot be determined |
| Incomplete outcome data (attrition bias) | Low risk | Participant flow provided with numbers missing similar between intervention and control groups |
| Selective reporting (reporting bias) | Unclear risk | Cannot be determined |
| Other bias | Low risk | Analysis accounted for clustering by preschool |
| Methods | Trial design: Cluster randomised controlled trial Intervention period: 2 years Follow‐up period (post‐intervention): Nil Differences in baseline characteristics: Reported Reliable outcomes: Reported (anthropometry, dietary intake, PA and sedentary behaviour) Protection against contamination: All schools were under the direction of the districts Food Service Division, which agreed to make the necessary changes in intervention schools, while making no changes to the control schools. Unit of allocation: School Unit of analysis: Individual Missing data was imputed using the multiple imputation procedure with the Markov chain Monte Carlo algorithm as well as the last observation carried forward method for comparison | |
| Participants | N (controls baseline) = 600 N (controls follow‐up) = 365 N (interventions baseline) = 749 N (interventions follow‐up) = 479 Setting [and number by trial group]: Schools (n = 5 intervention, n = 5 control) Recruitment: Within schools, written parental consent and child assent required. Geographic Region: Philadelphia, USA Percentage of eligible population enrolled: School level: 83%. Across participating schools, consent rate was 70 ± 15% Mean Age: Intervention: 11.13 ± 1 years; Control: 11.2 ± 1 years Sex: Intervention: 52% female; control: 55% female | |
| Interventions | SNPI‐School Nutrition Policy Initiative ‐ 5 components school self assessment
nutrition education
nutrition policy
social marketing
Family/parent outreach
Staff training
Combined effects of dietary interventions and physical activity interventions versus control | |
| Outcomes | Incidence of overweight and obesity Prevalence and remission of overweight and obesity Dietary intake and Physical Activity Sedentary behaviours Potential adverse effects Process evaluation: Not reported | |
| Implementation related factors | Theoretical basis: Settings‐based approach; CDC Guidelines to Promote Lifelong Healthy Eating and Physical Activity. Resources for intervention implementation (e.g. funding needed or staff hours required): Not Reported Who delivered the intervention: Reported PROGRESS categories assessed at baseline: Reported (Race, Gender, SES) PROGRESS categories analysed at outcome: Reported (Race, Gender) Outcomes relating to harms/unintended effects: Reported Intervention included strategies to address diversity or disadvantage: Not Reported Economic evaluation: Not Reported | |
| Notes | ||
| Risk of bias | ||
| Bias | Authors' judgement | Support for judgement |
| Random sequence generation (selection bias) | Unclear risk | Cannot be determined |
| Allocation concealment (selection bias) | Unclear risk | Cannot be determined |
| Blinding (performance bias and detection bias) | Unclear risk | Cannot be determined |
| Incomplete outcome data (attrition bias) | Low risk | |
| Selective reporting (reporting bias) | Unclear risk | Protocol not available |
| Other bias | Low risk | Analysis accounting for clustering within schools |
| Methods | Trial design: Cluster randomised Controlled Trial Intervention period: 8 months (1 academic year) Follow‐up period (post‐intervention): 6 months Differences in baseline characteristics: Reported Reliable outcomes: Reported Protection against contamination: Reported Unit of allocation: School Unit of analysis: Individual (with adjustment for school) | |
| Participants | N (controls baseline) = 653 N (controls follow‐up) = 619 (post‐intervention), 587 (follow‐up) N (interventions baseline) = 670 N (interventions follow‐up) = 582 (post‐intervention), 529 (follow‐up) Setting: School (intervention n = 5, Control n = 5) Recruitment: Students in 3rd ‐ 5th grade from 10 schools in two States Geographic Region: USA Percentage of eligible population enrolled: 63% Mean Age: Intervention: 9.6 (0.9) years Control: 9.6 (0.9) years Sex: Both males and females | |
| Interventions |
Combined effects of dietary interventions and physical activity interventions versus control | |
| Outcomes | Height and weight, Screen time, fruit and vegetable intake, physical activity (steps) Process evaluation: Not reported | |
| Implementation related factors | Theoretical basis: Socio‐ecological theory Resources for intervention implementation (e.g. funding needed or staff hours required): Not Reported Who delivered the intervention: Reported PROGRESS categories assessed at baseline: Reported (Race, Gender) PROGRESS categories analysed at outcome: Reported (Gender) Outcomes relating to harms/unintended effects: Not Reported Intervention included strategies to address diversity or disadvantage: Not Reported Economic evaluation: Not Reported | |
| Notes | ||
| Risk of bias | ||
| Bias | Authors' judgement | Support for judgement |
| Random sequence generation (selection bias) | Unclear risk | Cannot be determined |
| Allocation concealment (selection bias) | Unclear risk | Cannot be determined |
| Blinding (performance bias and detection bias) | Unclear risk | Cannot be determined |
| Incomplete outcome data (attrition bias) | Unclear risk | Cannot be determined |
| Selective reporting (reporting bias) | Unclear risk | Cannot be determined |
| Other bias | Low risk | Analysis adjusted for clustering within schools |
| Methods | Trial Design: cluster randomised controlled trial All analyses were performed according to intention to treat principles. Also used indicator variables with mean substitution to control for missing behavioural data and re‐estimated regressions that excluded observations with missing data for sensitivity analyses. | |
| Participants | N (intervention follow‐up) = 641 Age: mean age 11.7 years | |
| Interventions | School‐based interdisciplinary intervention utilising the school curriculum and existing school teachers to promote four major subjects and physical education. Sessions focused on decreasing television viewing, decreasing consumption of high‐fat foods, increasing fruit and vegetable consumption and increasing moderate and vigorous physical activity. Combined effects of dietary interventions and physical activity interventions versus control | |
| Outcomes | Body Mass Index | |
| Implementation related factors | Theoretical basis: Behavioural choice and Social Cognitive Theory Resources for intervention implementation (e.g. funding needed or staff hours required): Reported Who delivered the intervention: Reported PROGRESS categories assessed at baseline: Reported (Race, Gender) PROGRESS categories analysed at outcome: Reported (Race, Gender) Outcomes relating to harms/unintended effects: Reported Intervention included strategies to address diversity or disadvantage: Not Reported Economic evaluation: Not Reported | |
| Notes | ||
| Risk of bias | ||
| Bias | Authors' judgement | Support for judgement |
| Random sequence generation (selection bias) | Low risk | "… were randomly assigned (using a random number table)…" |
| Allocation concealment (selection bias) | Low risk | Randomisation was conducted at school level and all were randomised at start of study. Student intervention status was assigned based on school enrolment. |
| Blinding (performance bias and detection bias) | Low risk | Outcome assessors were blinded |
| Incomplete outcome data (attrition bias) | Low risk | Missing data balanced across groups and reasons for missing data given |
| Selective reporting (reporting bias) | Unclear risk | Protocol not available |
| Other bias | Low risk | Unit of analysis issues addressed |
| Methods | Trial design: cluster randomised controlled trial Intervention period: 3 years Follow‐up period (post‐intervention): Nil Differences in baseline characteristics: Reported Reliable outcomes: Reported Protection against contamination: Not reported Unit of allocation: School Unit of analysis: Individual All analyses were performed according to intention to treat principles | |
| Participants | N (controls baseline) = 289 N (controls 1 year follow‐up) = 265 (for analysis, N = 265) N (controls 3 year follow‐up) = 168 (for analysis, N = 168) N (interventions baseline) = 312 N (interventions 1 year follow‐up) = 260 (for analysis, N = 182) N (interventions 3 year follow‐up) = 148 (for analysis, N = 42) Setting [and number by trial group]: School (n = 9 intervention; n = 9 control) Recruitment: All consenting students in participating schools who would be beginning 3rd grade at the start of the intervention. Geographic Region: Augusta/Richmond County, Georgia, USA Percentage of eligible population enrolled: 52% Mean Age: 8.5 ± 0.6 years Sex: 52% female | |
| Interventions | 2‐hour after‐school intervention sessions were offered 5 days/wk on school days for 3 school years, however students did not have to attend every day to continue in the programme. The programme included:
Control group received regular health screenings and diet/PA information. Physical activity interventions versus control | |
| Outcomes | Percent body fat (%BF), bone density, fat mass, fat‐free soft tissue (FFST), BMI, waist circumference, cardiovascular (CV) fitness, CV risk factors (total cholesterol, HDL cholesterol, resting blood pressure), self‐reported free‐living PA, PA enjoyment, motivation for PA, perceived competence, goal orientation. For reported outcomes at 1 year and 3 years, participants who stayed in the same schools for the intervention period and who returned for all measurements were included. Of these, control participants were compared with intervention participants who had an adequate exposure to the intervention, as indicated by ?40% attendance at the after school sessions (N for analysis reported above). Process evaluation: Reported | |
| Implementation related factors | Theoretical basis: Environmental change Resources for intervention implementation (e.g. funding needed or staff hours required): Reported Who delivered the intervention: Reported PROGRESS categories assessed at baseline: Reported (Race, Gender, Education, SES) PROGRESS categories analysed at outcome: Not Reported Outcomes relating to harms/unintended effects: Not Reported Intervention included strategies to address diversity or disadvantage: Reported Economic evaluation: Not Reported | |
| Notes | Data extracted from 4 publications: Yin et al. Eval Health Prof 2005;28:67 (intervention rationale, design, process and implementation factors) Yin et al. Obes Res 2005;13:2153 (1 year outcomes) Yin et al. Int J Obes 2005;29:S40 (1 year outcomes: post‐hoc analysis of dose response relationship between outcomes and level of programme attendance) Gutin et al. Int J Ped Obes 2008 (3 year outcomes) | |
| Risk of bias | ||
| Bias | Authors' judgement | Support for judgement |
| Random sequence generation (selection bias) | Low risk | Sequence generated using random number table |
| Allocation concealment (selection bias) | High risk | Performed recruitment over two periods. During the second recruitment period, parents/students were informed of intervention assignment of school. Found no interaction effect of time of consent on primary outcome variables. |
| Blinding (performance bias and detection bias) | High risk | |
| Incomplete outcome data (attrition bias) | Unclear risk | Cannot be determined |
| Selective reporting (reporting bias) | Unclear risk | Cannot be determined |
| Other bias | High risk | Analysis was not intention to treat. Analysis conducting taking clustering into account. |
| Methods | Trial design: cluster randomised controlled trial Intervention period: Two school years Follow‐up period (post‐intervention): Nil Differences in baseline characteristics: Reported Reliable outcomes: Reported Protection against contamination: Not Reported Unit of allocation: School Unit of analysis: Individual | |
| Participants | N (baseline) = 2840 (not available by condition) N (controls follow‐up) =1452 N (interventions follow‐up) = 554 Setting: Schools (Intervention: 10 (5 standard intervention, 5 standard intervention + parent support), Control: 5) Recruitment: Students in seventh and eighth grades from schools with technical and vocational education in West‐Flanders Geographic Region: Belgium Percentage of eligible population enrolled: 95% Mean Age: 13.1(0.8) years (no breakdown by condition) Sex: Both males and females | |
| Interventions | Two intervention groups:
The standard intervention comprised:
Parent involvement comprised:
Combined effects of dietary interventions and physical activity interventions versus control | |
| Outcomes |
Process evaluation: Reported | |
| Implementation related factors | Theoretical basis: Reported (Theory of Planned Behaviour, transtheoretical model) Resources for intervention implementation (e.g. funding needed or staff hours required): Reported Who delivered the intervention: Reported PROGRESS categories assessed at baseline: Reported (Gender, SES) PROGRESS categories analysed at outcome: Reported (Gender) Outcomes relating to harms/unintended effects: Not Reported Intervention included strategies to address diversity or disadvantage: Not Reported Economic evaluation: Not Reported | |
| Notes | ||
| Risk of bias | ||
| Bias | Authors' judgement | Support for judgement |
| Random sequence generation (selection bias) | Unclear risk | Cannot be determined |
| Allocation concealment (selection bias) | Unclear risk | Cannot be determined |
| Blinding (performance bias and detection bias) | Unclear risk | Cannot be determined |
| Incomplete outcome data (attrition bias) | High risk | "Pupils not participating at follow‐up were significantly older and consumed significantly more soft drinks than pupils participating at follow‐up." |
| Selective reporting (reporting bias) | Unclear risk | Protocol not available |
| Other bias | High risk | Unit of analysis issues not addressed |
| Methods | Trial design: Controlled clinical trial/cohort analytic Intervention period: 12 months Follow‐up period (post‐intervention): Nil Differences in baseline characteristics: Not Reported Reliable outcomes: Not Reported Protection against contamination: Not Reported Unit of allocation: School Unit of analysis: Individual | |
| Participants | N (controls baseline) = 80 N (controls follow‐up) = 77 N (interventions baseline) = 393 N (interventions follow‐up) = 349 Setting: School (Intervention: 8 , Control:1) Recruitment: Primary school children from Rhenen (intervention schools) and Elst (control school) Geographic Region: Netherlands Percentage of eligible population enrolled: Intervention: 89%, Control: 96% Mean Age: children aged 5‐6 years (class group 2‐3) and aged 9‐10 years (class group 6‐7) Sex: Both males and females | |
| Interventions |
Combined effects of dietary interventions and physical activity interventions versus control) | |
| Outcomes | Height, Weight Nutrition knowledge, diet, behaviours and lifestyle Process evaluation: Not Reported | |
| Implementation related factors | Theoretical basis: Not Reported Resources for intervention implementation (e.g. funding needed or staff hours required): Not Reported Who delivered the intervention: Reported PROGRESS categories assessed at baseline: Reported (Place. Gender) PROGRESS categories analysed at outcome: Reported (Gender) Outcomes relating to harms/unintended effects: Not Reported Intervention included strategies to address diversity or disadvantage: Not Reported Economic evaluation: Not Reported | |
| Notes | ||
| Risk of bias | ||
| Bias | Authors' judgement | Support for judgement |
| Random sequence generation (selection bias) | High risk | Not randomised |
| Allocation concealment (selection bias) | High risk | |
| Blinding (performance bias and detection bias) | Unclear risk | Cannot be determined |
| Incomplete outcome data (attrition bias) | Unclear risk | Cannot be determined |
| Selective reporting (reporting bias) | Unclear risk | Cannot be determined |
| Other bias | Unclear risk | Cannot be determined |
| Methods | Trial design: Controlled clinical trial/cohort analytic Intervention period: 16 weeks Follow‐up period (post‐intervention): Nil Differences in baseline characteristics: Reported Reliable outcomes: Reported Protection against contamination: Not Reported Unit of allocation: School Unit of analysis: Individual | |
| Participants | N (controls baseline) = 130 N (controls follow‐up) = Not reported (91% successfully followed up) N (interventions baseline) = 182 N (interventions follow‐up) = Not reported (91% successfully followed up) Setting: School (Intervention: 5, Control: 4) Recruitment: Children aged 9‐11 years from schools in towns and rural areas of the South‐East region (disadvantaged) Geographic Region: Ireland Percentage of eligible population enrolled: 99% Mean Age: Intervention: 10.2 (1.2), Control: 10.3 (0.8) years Sex: Both males and females | |
| Interventions |
Physical activity interventions versus control | |
| Outcomes | Height, weight Physical activity and Screen time (measured using a one‐day Previous Day Physical Activity Recall (PDPAR) Physical activity self‐efficacy Aerobic fitness (20m shuttle test) Process evaluation: Reported | |
| Implementation related factors | Theoretical basis: Social cognitive theory Resources for intervention implementation (e.g. funding needed or staff hours required): Reported Who delivered the intervention: Reported PROGRESS categories assessed at baseline: Reported (Gender, SES) PROGRESS categories analysed at outcome: Not Reported Outcomes relating to harms/unintended effects: Not Reported Intervention included strategies to address diversity or disadvantage: Reported Economic evaluation: Not Reported | |
| Notes | ||
| Risk of bias | ||
| Bias | Authors' judgement | Support for judgement |
| Random sequence generation (selection bias) | High risk | Not randomised |
| Allocation concealment (selection bias) | High risk | |
| Blinding (performance bias and detection bias) | Unclear risk | Cannot be determined |
| Incomplete outcome data (attrition bias) | Unclear risk | Cannot be determined |
| Selective reporting (reporting bias) | Low risk | |
| Other bias | Low risk | Analysis conducted taking clustering into account |
| Methods | Trial Design: randomised controlled trial Follow‐Up (Post‐intervention): Nil | |
| Participants | N (controls baseline) =20 Recruitment: Child between the ages of 9 months and 3 years, child was walking, mother BMI >25, mother agreed to keep all appointments. Set in Northern New York State, US, Quebec and Ontario, Canada. Proportion of eligibles participating: Not stated Mean Age: 21 months (no SD reported). | |
| Interventions | Home visiting programme delivered by an indigenous peer educator who was extensively trained. The intervention was an adaptation of the Active Parenting Curriculum where 11 parenting topics were covered in 16 weeks. The focus for the treatment group was exclusively on how to improve parenting skills to develop appropriate eating and exercise behaviours to prevent obesity. Combined effects of dietary interventions and physical activity interventions versus control | |
| Outcomes | Maternal BMI Diet: 3 day food records analysed for total calorie and fat intake using Nutritionist IV computer programme. Process Evaluation: Not Reported | |
| Implementation related factors | Theoretical basis: Not Reported Resources for intervention implementation (e.g. funding needed or staff hours required): Reported Who delivered the intervention: Reported PROGRESS categories assessed at baseline: Reported (Race, Occupation, Gender, Education) PROGRESS categories analysed at outcome: Not Reported Outcomes relating to harms/unintended effects: Not Reported Intervention included strategies to address diversity or disadvantage: Reported Economic evaluation: Not Reported | |
| Notes | ||
| Risk of bias | ||
| Bias | Authors' judgement | Support for judgement |
| Random sequence generation (selection bias) | Unclear risk | Cannot be determined |
| Allocation concealment (selection bias) | Unclear risk | Cannot be determined |
| Blinding (performance bias and detection bias) | Low risk | Outcome assessors were blinded |
| Incomplete outcome data (attrition bias) | Low risk | Reasons reported for missing data |
| Selective reporting (reporting bias) | Unclear risk | Cannot be determined |
| Other bias | Low risk | |
| Methods | Trial Design: cluster randomised controlled trial | |
| Participants | N (intervention baseline and post‐intervention follow‐up) 325 (15 classes) N (control baseline and post‐intervention follow‐up) = 319 (14 classes) N (control 2‐year follow‐up) = 215 Outcome data collected for: 100% of sample post‐intervention; 67% of sample at 2 year follow‐up Setting: School | |
| Interventions | School‐based educational intervention aiming to prevent obesity by reducing consumption of carbonated drinks, delivered by the author and supported by existing staff. Three sessions, one per term, promoted drinking water and a reduction of carbonated drinks. Dietary intervention versus controls | |
| Outcomes | Body Mass Index Process Evaluation: Not Reported | |
| Implementation related factors | Theoretical Basis: Not Reported Resources for intervention implementation (e.g. funding needed or staff hours required): Not Reported Who delivered the intervention: Reported PROGRESS categories assessed at baseline: Reported (Gender) PROGRESS categories analysed at outcome: Reported (Gender) Outcomes relating to harms/unintended effects: Not Reported Intervention included strategies to address diversity or disadvantage: Not Reported Economic evaluation: Not Reported | |
| Notes | 2‐year follow‐up data reported in: James et al. Preventing childhood obesity: two‐year follow‐up results from the Chirstchurch obesity prevention programme in schools (CHOPPS). BMJ 2007;335(7623):762 | |
| Risk of bias | ||
| Bias | Authors' judgement | Support for judgement |
| Random sequence generation (selection bias) | Low risk | "clusters were randomised according to a random number table, with blinding to schools or classes" |
| Allocation concealment (selection bias) | Low risk | |
| Blinding (performance bias and detection bias) | Unclear risk | Cannot be determined |
| Incomplete outcome data (attrition bias) | Unclear risk | Low return rate of drink diaries at baseline and completion |
| Selective reporting (reporting bias) | Unclear risk | Protocol not available |
| Other bias | Low risk | No unit of analysis issues |
| Methods | Trial design: Controlled before and after study/Cohort analytic Intervention period: 2 years Follow‐up period (post‐intervention): Nil Differences in baseline characteristics: Reported Reliable outcomes: Reported Protection against contamination: Not Reported Unit of allocation: Kindergarten Unit of analysis: Individual | |
| Participants | N (controls baseline) = 410 (retrospective data) N (controls follow‐up) = 410 N (interventions baseline) = EPIPOI‐1: 750; EPIPOI‐2: 1030 N (interventions follow‐up) = EPIPOI‐1: 556; EPIPOI‐2: 697 Setting: Kindergartens (79 randomised to either intervention 1 (EPIPOI‐1) or intervention 2 (EPIPOI‐2) group; 40 matched control kindergartens selected) Recruitment: Preschool children in Haute‐Garonne Department Geographic Region: France Percentage of eligible population enrolled: 51% Mean Age (mean, SD EPIPOI‐1 (3.8, 0.4); EPIPOI‐2 (3.7, 0.3); Control (3.9, 0.3) Sex: Both males and females | |
| Interventions | This study involved two levels of intervention EPIPOI‐1 Basic strategy only; EPIPOI‐2 Basic plus Education‐based reinforcement Basic strategy
Reinforced strategy (provided to intervention group 2; EPIPOI‐2)
Combined effects of dietary interventions and physical activity interventions versus control | |
| Outcomes | Prevalence of overweight (BMI≥ 90 percentile); weight, height; change in BMI Z‐score in relation to age and sex using the French curves Process evaluation: Not reported | |
| Implementation related factors | Theoretical basis: Not reported Resources for intervention implementation (e.g. funding needed or staff hours required): Not reported Who delivered the intervention: Reported PROGRESS categories assessed at baseline: Reported (Place, Gender, S‐for SES) PROGRESS categories analysed at outcome: Reported (Place, S‐for SES) Outcomes relating to harms/unintended effects: Not Reported Intervention included strategies to address diversity or disadvantage: Not Reported Economic evaluation: Not Reported | |
| Notes | ||
| Risk of bias | ||
| Bias | Authors' judgement | Support for judgement |
| Random sequence generation (selection bias) | High risk | Not randomised ‐ used historic control group |
| Allocation concealment (selection bias) | High risk | |
| Blinding (performance bias and detection bias) | Unclear risk | Historic control group |
| Incomplete outcome data (attrition bias) | Unclear risk | Cannot be determined |
| Selective reporting (reporting bias) | Unclear risk | Cannot be determined |
| Other bias | Low risk | Unit of analysis issues were addressed |
| Methods | Trial Design: CCT (cluster case controlled trial) Intervention period: Six months Follow‐up (post‐intervention): Nil | |
| Participants | N (Intervention and control at baseline) = 2375 N (intervention follow‐up) = 2141; N of schools: 5 Setting: School Age: 10.6 (SD 2.6) | |
| Interventions | School‐based multi‐component intervention aimed to change adiposity and physical activity levels, delivered by a nutritionist and a Physical Education (PE) teacher. Nutrition education was available for children and parents supported by healthier food kiosks. Sessions included 90 minutes additional physical activity weekly for 3rd to 8th grade for 6 months and 15minutes of activity in recess per day, for last 3 months. Combined effects of dietary interventions and physical activity interventions versus control | |
| Outcomes | Body Mass Index Fitness: Process Evaluation: Reported | |
| Implementation related factors | Theoretical Basis: Not Reported Resources for intervention implementation (e.g. funding needed or staff hours required): Reported Who delivered the intervention: Reported PROGRESS categories assessed at baseline: Reported (Gender) PROGRESS categories analysed at outcome: Reported (Gender) Outcomes relating to harms/unintended effects: Not Reported Intervention included strategies to address diversity or disadvantage: Reported Economic evaluation: Not Reported | |
| Notes | ||
| Risk of bias | ||
| Bias | Authors' judgement | Support for judgement |
| Random sequence generation (selection bias) | High risk | Not randomised |
| Allocation concealment (selection bias) | High risk | |
| Blinding (performance bias and detection bias) | High risk | Not blinded |
| Incomplete outcome data (attrition bias) | Low risk | Reasons for missing data given |
| Selective reporting (reporting bias) | Unclear risk | Cannot be determined |
| Other bias | High risk | Group assignment was made according to perception of overweight prevalence and willingness of the schools director to accept a research study. Boys in intervention schools had higher BMIs at baseline. Unit of analysis issues not addressed |
| Methods | Trial design: Randomised Controlled Trial Intervention period: 12 months Follow‐up period (post‐intervention): Nil Differences in baseline characteristics: N/A Reliable outcomes: N/A Protection against contamination: N/A Unit of allocation: Individual Unit of analysis: Individual | |
| Participants | N (controls baseline) = 185 N (controls follow‐up) = 134 N (interventions baseline) = 59 N (interventions follow‐up) = 49 Setting: Home Recruitment: The network CrescNet collected data (patient height and weight) from more than 300,000 children and 365 were selected at risk of obesity (age 4 to 7 years) to participate Geographic Region: Germany Percentage of eligible population enrolled: 33% Mean Age: Intervention: 5.9 ± 1.4; control: 5.6 ± 1.2 Sex: Both males and females | |
| Interventions |
Combined effects of dietary interventions and physical activity interventions versus control | |
| Outcomes | Height, weight Diet Process evaluation: N/A | |
| Implementation related factors | Theoretical basis: Not Reported Resources for intervention implementation (e.g. funding needed or staff hours required): N/A Who delivered the intervention: Reported PROGRESS categories assessed at baseline: Reported (Gender) PROGRESS categories analysed at outcome: Reported (Gender) Outcomes relating to harms/unintended effects: Not Reported Intervention included strategies to address diversity or disadvantage: Not Reported Economic evaluation: Not Reported | |
| Notes | ||
| Risk of bias | ||
| Bias | Authors' judgement | Support for judgement |
| Random sequence generation (selection bias) | Unclear risk | Cannot be determined |
| Allocation concealment (selection bias) | Unclear risk | Cannot be determined |
| Blinding (performance bias and detection bias) | Unclear risk | Cannot be determined |
| Incomplete outcome data (attrition bias) | Unclear risk | Cannot be determined |
| Selective reporting (reporting bias) | Unclear risk | Cannot be determined |
| Other bias | Unclear risk | Cannot be determined |
| Methods | Trial design: pilot cluster randomised controlled trial Intervention period: 5 months Follow‐up period (post‐intervention): Nil Differences in baseline characteristics: Reported Reliable outcomes: Reported Protection against contamination: Not reported Unit of allocation: School Unit of analysis: Individual (analysed both with and without taking clustering within schools into account) All analyses were performed according to intention to treat principles | |
| Participants | N (controls baseline) = 256 (for BMI) N (controls follow‐up) = 223 (for BMI) N (interventions baseline) = 275 (for BMI) N (interventions follow‐up) = 249 (for BMI) Setting [and number by trial group]: Schools (n=10 intervention; n = 9 control) Recruitment: Children were recruited from year 5 classes in 19 primary schools. Geographic Region: South Gloucestershire, England Percentage of eligible population enrolled: 70% of invited schools; 78% of eligible children within participating schools. Mean Age: Intervention 9.4 (0.5) years Control 9.4 (0.49) years Sex: Intervention 49.6% female Control 54.7% female | |
| Interventions | The programme was adapted from the Eat Well Keep Moving programme implemented in the US.
Combined effects of dietary interventions and physical activity interventions versus control | |
| Outcomes |
Process evaluation: Reported | |
| Implementation related factors | Theoretical basis: Social cognitive theory and behavioural choice theories Resources for intervention implementation (e.g. funding needed or staff hours required): Reported Who delivered the intervention: Reported PROGRESS categories assessed at baseline: Reported (Gender) PROGRESS categories analysed at outcome: Reported (Gender) Outcomes relating to harms/unintended effects: Not Reported Intervention included strategies to address diversity or disadvantage: Not Reported Economic evaluation: Not reported (however cost of intervention materials was included) | |
| Notes | ||
| Risk of bias | ||
| Bias | Authors' judgement | Support for judgement |
| Random sequence generation (selection bias) | Unclear risk | Cannot be determined |
| Allocation concealment (selection bias) | Low risk | Allocation was at the school level and all schools allocated at the start of the study, after schools were invited to participate and notified that they would be allocated to either intervention or control groups. |
| Blinding (performance bias and detection bias) | Low risk | Outcome assessors and analysts were blinded |
| Incomplete outcome data (attrition bias) | Unclear risk | Cannot be determined |
| Selective reporting (reporting bias) | Unclear risk | Cannot be determined |
| Other bias | Low risk | Clustering taken into account in analyses |
| Methods | Trial design: Cluster randomised controlled trial Intervention period: 6 months Follow‐up period (post‐intervention): Nil Differences in baseline characteristics: Reported Reliable outcomes: Reported Protection against contamination: Not Reported Unit of allocation: School Unit of analysis: Individual | |
| Participants | N (obese: controls baseline) = 41 N (obese: controls follow‐up) = Not Reported* N (non obese: controls baseline) = 187 N (non obese: controls follow‐up) = Not Reported* N (obese: interventions baseline) = 59 N (obese: interventions follow‐up) = Not Reported* N (non obese: interventions baseline) = 138 N (non obese: interventions follow‐up) = Not Reported* *Data at 6 months collected from 98.9% of study participants overall. Numbers are not reported by group. Setting [and number by trial group]: School (intervention n = 14; control n = 5). Intervention and control groups were further divided into obese (BMI>97th percentile) and non obese children to give a total of 4 trial groups (2 x intervention and 2 x control) Recruitment: Children from participating local state schools were eligible if they were in their first or second grade of elementary school, participating in the scheduled school physical education classes, participating in less than 3h of extra‐school sports activity per week, free of any known disease and not participating in other studies. Geographic Region: France Percentage of eligible population enrolled: Not Reported Mean Age: 7.4±0.8 years (not reported by group) Sex: 50% female (not reported by group) | |
| Interventions | Control: All children took part in scheduled school physical education (SPE) classes:
Intervention: children in the intervention group were required to follow an additional physical activity (PA) programme:
Physical activity interventions versus control | |
| Outcomes | Primary: Obesity status Secondary:
Process evaluation: Reported | |
| Implementation related factors | Theoretical basis: Not Reported Resources for intervention implementation (e.g. funding needed or staff hours required): Not Reported Who delivered the intervention: Reported PROGRESS categories assessed at baseline: Reported (Gender) PROGRESS categories analysed at outcome: Reported (Gender) Outcomes relating to harms/unintended effects: Not Reported Intervention included strategies to address diversity or disadvantage: Not Reported Economic evaluation: Not Reported | |
| Notes | ||
| Risk of bias | ||
| Bias | Authors' judgement | Support for judgement |
| Random sequence generation (selection bias) | Low risk | A draw was carried out to choose intervention schools |
| Allocation concealment (selection bias) | Low risk | All eligible children from within schools were automatically assigned to groups based according to school assignment and based on their individual BMI |
| Blinding (performance bias and detection bias) | Unclear risk | Cannot be determined |
| Incomplete outcome data (attrition bias) | Low risk | |
| Selective reporting (reporting bias) | Unclear risk | No protocol available |
| Other bias | High risk | Unit of analysis issues not addressed |
| Methods | Trial design: Randomised Controlled Trial Intervention period: 12 weeks Follow‐up period (post‐intervention): Nil Differences in baseline characteristics: Reported Reliable outcomes: Reported Protection against contamination: Not Reported Unit of allocation: Individual Unit of analysis: Individual | |
| Participants | N (controls baseline) = 38 N (controls follow‐up) = 30 N (interventions baseline) = 38 N (interventions follow‐up) =32 Setting: Home Recruitment: Children aged 6‐9 years attending public schools in four neighbourhoods in León, Guanajuato, Mexico Geographic Region: Mexico Percentage of eligible population enrolled: Not Reported Median Age: Control: 7.5 (6.9‐8.4); Intervention: 8 (6.1‐9.1) Sex: Both Males and Females | |
| Interventions | Intervention children were instructed to modify their physical activity to obtain an increase of at least 2,500 steps per day over the baseline level. To attain this, two strategies were used: (a) to increase incidental physical activity (i.e., walk to school, to accompany their parents at shopping and to help in the domestic work at home (b) involvement in recreational activities three times per week in a Municipal Sport Center (60 min sessions of age‐appropriate recreational activities) Physical activity interventions versus control | |
| Outcomes | Anthropometric measurements: height, weight, waist circumference, triceps skinfold Laboratory measurements: glucose, triglycerides, cholesterol, HDL‐C, LDL‐C, HOMA‐IR Basal physical activity (steps/day, by pedometer) Cardiovascular fitness (VO2 max): by treadmill Food intake
Process evaluation: Reported | |
| Implementation related factors | Theoretical basis: Not Reported Resources for intervention implementation (e.g. funding needed or staff hours required): Not Reported Who delivered the intervention: Reported PROGRESS categories assessed at baseline: Reported (Gender) PROGRESS categories analysed at outcome: Not Reported Outcomes relating to harms/unintended effects: Not Reported Intervention included strategies to address diversity or disadvantage: Not Reported Economic evaluation: Not Reported | |
| Notes | ||
| Risk of bias | ||
| Bias | Authors' judgement | Support for judgement |
| Random sequence generation (selection bias) | Unclear risk | Cannot be determined |
| Allocation concealment (selection bias) | Unclear risk | Cannot be determined |
| Blinding (performance bias and detection bias) | Low risk | Not blinded but unlikely to influence results |
| Incomplete outcome data (attrition bias) | Low risk | |
| Selective reporting (reporting bias) | Unclear risk | Cannot be determined |
| Other bias | High risk | |
| Methods | Trial design: Cluster Randomised Controlled Trial Intervention period: 4 years Follow‐up period (post‐intervention): Nil Differences in baseline characteristics: Reported Reliable outcomes: Reported (anthropometry and accelerometry) Protection against contamination: Not reported Unit of allocation: School Unit of analysis: Child Primary analysis used observed cases, but sensitivity analyses were carried out using FAS population (evaluated with replacement for missing data by last observation carried forward) | |
| Participants | N (controls baseline) = 1465 N (controls follow‐up) = 1300 N (interventions baseline) = 1670 N (interventions follow‐up) = 1538 Setting: Schools (n = 5 intervention, n = 5 control) Recruitment: All consenting students in selected schools up to 4th school year Geographic Region: Sweden Percentage of eligible population enrolled: 90% to 100% Mean Age: Control: 7.5 (1.3) years; Intervention: 7.4 (1.3) years Sex: both sexes included | |
| Interventions |
Combined effects of dietary interventions and physical activity interventions versus control | |
| Outcomes |
Process evaluation: Reported | |
| Implementation related factors | Theoretical basis: Not reported Resources for intervention implementation (e.g. funding needed or staff hours required): Not reported Who delivered the intervention: Reported PROGRESS categories assessed at baseline: Reported (Place, Race, Occupation, Gender, Education, Social status) PROGRESS categories analysed at outcome: Reported (Gender. Education) Outcomes relating to harms/unintended effects: Reported Intervention included strategies to address diversity or disadvantage: Not reported Economic evaluation: Not reported | |
| Notes | ||
| Risk of bias | ||
| Bias | Authors' judgement | Support for judgement |
| Random sequence generation (selection bias) | Unclear risk | Cannot be determined |
| Allocation concealment (selection bias) | Unclear risk | Cannot be determined |
| Blinding (performance bias and detection bias) | Unclear risk | Cannot be determined |
| Incomplete outcome data (attrition bias) | Unclear risk | Cannot be determined |
| Selective reporting (reporting bias) | Unclear risk | Cannot be determined |
| Other bias | Low risk | Unit of analysis issues addressed. |
| Methods | Trial Design: Cluster randomised controlled trial | |
| Participants | Follow‐up at 6 months: Outcome data collected for: Age: 4.5 (SD 0.4) years | |
| Interventions | Kindergarten‐based physical activity programme conducted by specially trained staff and including a 15 minute walk and a twenty minute aerobic dance session 3‐times a week. Study objective was to evaluate the effect of a school‐based aerobic exercise programme on the obesity indexes of preschool children. Physical activity interventions versus control | |
| Outcomes |
Process Evaluation: Not Reported | |
| Implementation related factors | Theoretical basis: Not Reported Resources for intervention implementation (e.g. funding needed or staff hours required): Not Reported Who delivered the intervention: Reported PROGRESS categories assessed at baseline: Reported (Gender, SES) PROGRESS categories analysed at outcome: Reported (Gender) Outcomes relating to harms/unintended effects: Not Reported Intervention included strategies to address diversity or disadvantage: Not Reported Economic evaluation: Not Reported | |
| Notes | ||
| Risk of bias | ||
| Bias | Authors' judgement | Support for judgement |
| Random sequence generation (selection bias) | Unclear risk | Cannot be determined |
| Allocation concealment (selection bias) | Unclear risk | Cannot be determined |
| Blinding (performance bias and detection bias) | Unclear risk | Cannot be determined |
| Incomplete outcome data (attrition bias) | Low risk | Loss to follow‐up was minimal and reasons given for 2 exclusions from analysis |
| Selective reporting (reporting bias) | Unclear risk | Cannot be determined |
| Other bias | Low risk | Unit of analysis issues addressed |
| Methods | Trial Design: Cluster randomised controlled trial | |
| Participants | For weight, height and TSF Recruitment: all consenting school pupils aged 5‐7 years. General recruitment took place as part of health examinations by the school physicians. Geographical setting: Kiel, Germany. | |
| Interventions | School‐based intervention which included an 8 hour course of nutrition education including 'active' breaks was given by a skilled nutritionist and a trained teacher. The course included the following messages: 'eat fruit and vegetables each day', 'reduce intake of high fat foods', keep active at least 1 hour each day', 'decrease TV consumption to less than 1 hour per day'. Combined effects of dietary interventions and physical activity interventions versus control | |
| Outcomes |
Process Evaluation: Not Reported | |
| Implementation related factors | Theoretical basis: Not Reported Resources for intervention implementation (e.g. funding needed or staff hours required): Reported Who delivered the intervention: Reported PROGRESS categories assessed at baseline: Reported (Race, Occupation, Gender, Education, Social status) PROGRESS categories analysed at outcome: Not Reported Outcomes relating to harms/unintended effects: Not Reported Intervention included strategies to address diversity or disadvantage: Reported Economic evaluation: Not Reported | |
| Notes | ||
| Risk of bias | ||
| Bias | Authors' judgement | Support for judgement |
| Random sequence generation (selection bias) | High risk | Not reported for school intervention. Family intervention was not randomised. |
| Allocation concealment (selection bias) | High risk | |
| Blinding (performance bias and detection bias) | Unclear risk | Cannot be determined |
| Incomplete outcome data (attrition bias) | High risk | Low completion rate for family intervention (25%) with no reasons given or exploration of differences between completers and non‐completers |
| Selective reporting (reporting bias) | Unclear risk | Cannot be determined |
| Other bias | High risk | "Every alternating year schools changed and the 'control' schools became 'intervention' schools and vice versa." This will affect all outcome measures due to carryover effects of the intervention. Unit of analysis issues not addressed. |
| Methods | Trial Design: Cluster randomised controlled trial | |
| Participants | N (intervention baseline) = 89 Geographical setting; Mean Age: Intervention: 14.9 (SD0.9) years: Controls: 15.8 (SD1.1). | |
| Interventions | High‐school based girls only, intervention with priority given to girls with BMI at or above 75th percentile and who did less than 30 minutes per day 3 times per week physical activity (eating disorders excluded). Delivery was by school staff and research team, with local guest instructors. Intervention addressed socio‐environmental, personal and behavioural factors, with physical activity four times per week, nutrition and social support session every other week for total of 16 weeks with an 8 week maintenance component of lunch time meetings. Combined effects of dietary interventions and physical activity interventions versus control | |
| Outcomes |
Process Evaluation: Reported | |
| Implementation related factors | Theoretical basis:Reported (Social Cognitive Theory) Resources for intervention implementation (e.g. funding needed or staff hours required): Reported Who delivered the intervention: Reported PROGRESS categories assessed at baseline: Reported (Race, Gender) PROGRESS categories analysed at outcome: Not Reported Outcomes relating to harms/unintended effects: Reported Intervention included strategies to address diversity or disadvantage: Reported Economic evaluation: Not Reported | |
| Notes | ||
| Risk of bias | ||
| Bias | Authors' judgement | Support for judgement |
| Random sequence generation (selection bias) | Unclear risk | Cannot be determined |
| Allocation concealment (selection bias) | High risk | Girls were recruited after the schools were randomised. Girls in intervention schools knew they were enrolling in an alternative physical education class. Girls in control schools were recruited to participate in a research study about eating and exercise patterns of teens. |
| Blinding (performance bias and detection bias) | Unclear risk | Cannot be determined |
| Incomplete outcome data (attrition bias) | Low risk | Reasons for missing data given and missing data balanced across groups and with similar baseline characteristics to completers. |
| Selective reporting (reporting bias) | Unclear risk | Cannot be determined |
| Other bias | High risk | Girls in the intervention group had higher BMI values than girls in control group, although not statistically significant. Unit of analysis issues not addressed. |
| Methods | Trial design: Cluster randomised Controlled Trial Intervention period: 8 months Follow‐up period (post‐intervention): Nil Differences in baseline characteristics: Reported Reliable outcomes: Reported Protection against contamination: Not reported Unit of allocation: School Unit of analysis: Family/Individual All analyses were performed according to intention to treat principles. Missing data for BMI were imputed using the mean value in the whole cohort. | |
| Participants | N (controls baseline) = 418 families N (controls follow‐up) = 393 children 394 adults N (intervention A [reduce fat, increase high‐complex carbohydrates] baseline) = 297 families N (intervention A follow‐up) = 280 children 280 adults N (intervention B [reduce both fat and sugar and to increase complex carbohydrates] baseline) = 298 families N (intervention B follow‐up) = 274 children 275 adults Setting [and number by trial group]: School ( intervention, control) Recruitment: Particpants recruited from 54 schools. In each family, one second‐ or third‐grade pupil (aged 7‐9 years) and one of his or her parents participated. Geographic Region: France Percentage of eligible population enrolled: <10% Mean Age: Children: Intervention A 7.7 (0.6) , Intervention B 7.8 (0.6), Control 7.6 (0.6) Parents: Intervention A 40.4 (5.3), Intervention B 40.3 (5.4) , Control 40.6 (5.4) Sex: Both males and females | |
| Interventions | Intervention group A received advice on how to reduce dietary fats (<35% of total energy intake) and how to increase complex carbohydrates (>50% of total energy intake);Intervention group B received advice on how to reduce both dietary fats (<35% of total energy intake) and sugars (‐25% of initial crude intake) and how to increase complex carbohydrates (>50% of total energy intake)
Dietary interventions versus control | |
| Outcomes | Dietary intake: total energy intake, fats, sugars, complex carbohydrates; Anthropometric measures: height, weight, BMI, z BMI, chest, waist, hip and knee circumferences, blood pressure, heart rate, fat mass, fat free mass, overall physical activity: daily screen viewing and activities for clubs
Process evaluation: Not reported | |
| Implementation related factors | Theoretical basis: Not Reported Resources for intervention implementation (e.g. funding needed or staff hours required): Reported Who delivered the intervention: Reported PROGRESS categories assessed at baseline: Not Reported (Occupation, Gender, Race, Education, S for SES) PROGRESS categories analysed at outcome: Not Reported Outcomes relating to harms/unintended effects: Not Reported Intervention included strategies to address diversity or disadvantage: Not Reported Economic evaluation: Not Reported | |
| Notes | ||
| Risk of bias | ||
| Bias | Authors' judgement | Support for judgement |
| Random sequence generation (selection bias) | Low risk | Randomisation performed according to a computer‐generated randomisation list |
| Allocation concealment (selection bias) | Low risk | Randomisation occurred at the school level and performed on all units at start of study |
| Blinding (performance bias and detection bias) | Unclear risk | Cannot be determined |
| Incomplete outcome data (attrition bias) | Unclear risk | Cannot be determined |
| Selective reporting (reporting bias) | Unclear risk | No protocol available |
| Other bias | High risk | Unit of analysis issues not addressed |
| Methods | Controlled before and after study (CBA) Follow‐up (post‐intervention): Nil | |
| Participants | N at baseline 606 Recruitment: all consenting 4th grade children in 35 schools in Arizona, New Mexico, US. Proportion of eligibles participating: Not stated, but restricted to 4th graders (9 to10 years) as they would not know about PLAY. Mean Age: 9.8 (SD 0.6) years | |
| Interventions | School based intervention aimed at increased physical activity with a secondary intention of preventing obesity and delivered by school staff who were specially trained. There were three conditions and a control: 1) PLAY (9 schools); 2) PLAY and PE (10 schools); 3) PE only (10 schools). The intervention has three elements: to promote play behaviour, followed by teacher directed activities and then self‐directed activity was encouraged. This was achieved by incorporating 15 minutes of daily activity in the school day and encouraging 30 minutes of out of school play by the end of the intervention. Physical activity interventions versus control | |
| Outcomes |
Process evaluation: Not Reported | |
| Implementation related factors | Theoretical basis: Not Reported Resources for intervention implementation (e.g. funding needed or staff hours required): Reported Who delivered the intervention: Reported PROGRESS categories assessed at baseline: Reported (Gender) PROGRESS categories analysed at outcome: Reported (Gender) Outcomes relating to harms/unintended effects: Reported Intervention included strategies to address diversity or disadvantage: Not Reported Economic evaluation: Not Reported | |
| Notes | ||
| Risk of bias | ||
| Bias | Authors' judgement | Support for judgement |
| Random sequence generation (selection bias) | High risk | Not randomised |
| Allocation concealment (selection bias) | High risk | Cannot be determined |
| Blinding (performance bias and detection bias) | High risk | Not blinded |
| Incomplete outcome data (attrition bias) | Unclear risk | Baseline data not reported, Group Ns not reported |
| Selective reporting (reporting bias) | High risk | Baseline data not reported, Group Ns not reported |
| Other bias | High risk | Schools were stratified into groups based on their participation in PLAY and/or the existence of a PE programme (the intervention groups of interest). Participating schools were selected from within these groups, so they were already motivated and participating in the program, and were followed over time. The No Treatment group (control) was comprised of schools who did not have PLAY or a PE programme already in place. Unit of analysis issues not addressed. |
| Methods | Trial design: Cluster randomised controlled trial Intervention period: 12 months Follow‐up period (post‐intervention): Nil Differences in baseline characteristics: Reported Reliable outcomes: Reported Protection against contamination: Not Reported Unit of allocation: School Unit of analysis: School Missing data at follow‐up were imputed by applying a regression method. | |
| Participants | N (controls baseline) = 741 N (controls follow‐up) = 712‐741 N (interventions baseline) = 863 N (interventions follow‐up) = 827‐863 Setting [and number by trial group]: School (intervention n = 12; control n = 12) Recruitment: All eighth‐grade girls who attended 1 of the 31 middle schools that fed students to the 24 participating high schools were invited to complete the measures. Geographic Region: 14 South Carolina counties Percentage of eligible population enrolled: 34% Mean Age: Intervention: 13.6±0.6 years Control: 13.6±0.6 years Sex: 100% female | |
| Interventions | LEAP (Lifestyle Education for Activity Programme) Designed to change both instructional practices and school environment to increase support for PA among girls Instructional:
Environmental:
Physical activity interventions versus control | |
| Outcomes | Primary outcome: % of girls in who reported participating in vigorous physical activity Secondary outcomes: prevalence of overweight and at‐risk for overweight Process evaluation: Not Reported | |
| Implementation related factors | Theoretical basis: Reported (Socio‐ecological model drawn from Social Cognitive Theory) Resources for intervention implementation (e.g. funding needed or staff hours required): Not Reported Who delivered the intervention: Reported PROGRESS categories assessed at baseline: Reported (Race) PROGRESS categories analysed at outcome: Reported (Race) Outcomes relating to harms/unintended effects: Not Reported Intervention included strategies to address diversity or disadvantage: Not Reported Economic evaluation: Not Reported | |
| Notes | ||
| Risk of bias | ||
| Bias | Authors' judgement | Support for judgement |
| Random sequence generation (selection bias) | Unclear risk | Cannot be determined |
| Allocation concealment (selection bias) | Unclear risk | Cannot be determined |
| Blinding (performance bias and detection bias) | Unclear risk | Cannot be determined |
| Incomplete outcome data (attrition bias) | Low risk | |
| Selective reporting (reporting bias) | Unclear risk | Protocol not available |
| Other bias | Low risk | No unit of analysis issues |
| Methods | Trial design: Randomised controlled trial Intervention period: 12 months Follow‐up period (post‐intervention): Nil Differences in baseline characteristics: Reported Reliable outcomes: Reported Protection against contamination: Not Reported Unit of allocation: Individual Unit of analysis: Individual Analyses were conducted under the intent‐to‐treat assumption by replacing missing values at the 12‐month end point with the most recent available data from either the 6‐month or baseline assessment. | |
| Participants | N (controls baseline) = 395 N (controls follow‐up) = 334 N (interventions baseline) = 424 N (interventions follow‐up) = 356 Setting [and number by trial group]: Community (intervention n = 424; control n = 395) Recruitment: Healthy adolescents scheduled for a well child visit were recruited through their primary care providers (n = 45 primary care providers) from 6 private clinic sites Geographic Region: San Diego County, California, USA Percentage of eligible population enrolled: 59% Mean Age: Intervention: 12.8 ± 1.3 years (girls); 12.6 ± 1.4 years (boys) Control: 12.6 ± 1.4 years (girls); 12.8 ± 1.3 years (boys) Sex: 53% female | |
| Interventions | PACE+ intervention: designed to promote adoption and maintenance of improved eating and PA behaviours
Control
Combined effects of dietary interventions and physical activity interventions versus control | |
| Outcomes | Primary outcomes
Secondary outcomes
Process Evaluation: Not Reported | |
| Implementation related factors | Theoretical basis: Reported (Behavioural determinants model; Social Cognitive Theory; Transtheoretical model behaviour of change) Resources for intervention implementation (e.g. funding needed or staff hours required): Not Reported Who delivered the intervention: Reported PROGRESS categories assessed at baseline: Reported (Race, Gender. Education) PROGRESS categories analysed at outcome: Reported (Gender) Outcomes relating to harms/unintended effects: Not Reported Intervention included strategies to address diversity or disadvantage: Not Reported Economic evaluation: Not Reported | |
| Notes | ||
| Risk of bias | ||
| Bias | Authors' judgement | Support for judgement |
| Random sequence generation (selection bias) | Unclear risk | Method for sequence generation not reported |
| Allocation concealment (selection bias) | Unclear risk | Method for allocation concealment not reported |
| Blinding (performance bias and detection bias) | Unclear risk | Participants were not blinded. Not reported whether or not outcome assessors were blinded. |
| Incomplete outcome data (attrition bias) | Low risk | Participant flow through study reported and similar rates of attrition across groups |
| Selective reporting (reporting bias) | Unclear risk | Protocol not available |
| Other bias | Low risk | |
| Methods | Trial design: Randomised Controlled Trial Intervention period: 6 months Follow‐up period (post‐intervention): Nil Differences in baseline characteristics: Not Reported Reliable outcomes: Reported Protection against contamination: Not Reported Unit of allocation: Child Unit of analysis: Child All analyses were performed according to intention to treat principles | |
| Participants | N (controls baseline) = 17 N (controls follow‐up) = 16 N (interventions baseline) =16 N (interventions follow‐up) = 16 Setting [and number by trial group]: Secondary school (n = 1) Recruitment: 7th Graders completing less than 49 laps using Multistage Fitness Test Geographic Region: Australia Percentage of eligible population enrolled: 58% Mean Age: 12.5 ± 0.4 years Sex: Males only | |
| Interventions |
[Combined effects of dietary interventions and physical activity interventions versus control] | |
| Outcomes | Height and weight, Waist circumference, percentage body fat, cardiorespiratory fitness, physical activity using accelerometry, time spent using small screen recreation and sweetened beverage and fruit consumption Process evaluation: Reported | |
| Implementation related factors | Theoretical basis: Reported (Social Cognitive Theory) Resources for intervention implementation (e.g. funding needed or staff hours required): Not Reported Who delivered the intervention: Reported PROGRESS categories assessed at baseline: Reported (Gender) PROGRESS categories analysed at outcome: Not Reported Outcomes relating to harms/unintended effects: Not Reported Intervention included strategies to address diversity or disadvantage: Not Reported Economic evaluation: Not Reported | |
| Notes | All analyses performed according to intention to treat principles | |
| Risk of bias | ||
| Bias | Authors' judgement | Support for judgement |
| Random sequence generation (selection bias) | Low risk | randomised "using a computer‐based number producing algorithm..." |
| Allocation concealment (selection bias) | Unclear risk | Cannot be determined |
| Blinding (performance bias and detection bias) | Low risk | Assessors blinded |
| Incomplete outcome data (attrition bias) | Unclear risk | Cannot be determined |
| Selective reporting (reporting bias) | Unclear risk | Protocol not available |
| Other bias | Low risk | Intervention conducted in one school with an absence of a "true" control group since it was compulsory for all boys to participate in physical activity |
| Methods | Trial design: Cluster randomized Controlled Trial Intervention period: 1 school year Follow‐up period (post‐intervention): Nil Differences in baseline characteristics: Not Reported Reliable outcomes: Reported Protection against contamination: Not Reported Unit of allocation: School Unit of analysis: Individual | |
| Participants | N (controls baseline) = 90 N (controls follow‐up) = 81 N (interventions baseline) = 178 N (interventions follow‐up) = 156 Setting: 10 participating schools randomised, 3 assigned to usual practice and 7 assigned to intervention. Of the 10 schools, 2 from the usual practice group and 6 from the intervention group took part in cardiovascular assessment. Recruitment: Elementary schools in Vancouver and Richmond school districts, British Colombia, Canada; 4th and 5th grade children Geographic Region: Canada Percentage of eligible population enrolled: 52% Mean Age: 9‐11 years Sex: Both males and females | |
| Interventions |
Physical activity interventions versus control | |
| Outcomes | Outcome measures: Cardiovascular fitness (measured by 20‐m shuttle run test), blood pressure (systolic and diastolic), BMI, total cholesterol, HDL, LDL, Apo B, C‐reactive protein and fibrinogen at the end of the intervention period. Process evaluation: Not Reported | |
| Implementation related factors | Theoretical basis: Reported (Social Ecological model) Resources for intervention implementation (e.g. funding needed or staff hours required): Reported Who delivered the intervention: Reported PROGRESS categories assessed at baseline: Place, Race, Gender PROGRESS categories analysed at outcome: Not Reported Outcomes relating to harms/unintended effects: Not Reported Intervention included strategies to address diversity or disadvantage: Not Reported Economic evaluation: Not Reported | |
| Notes | ||
| Risk of bias | ||
| Bias | Authors' judgement | Support for judgement |
| Random sequence generation (selection bias) | Unclear risk | Cannot be determined |
| Allocation concealment (selection bias) | Unclear risk | Cannot be determined |
| Blinding (performance bias and detection bias) | Unclear risk | Cannot be determined |
| Incomplete outcome data (attrition bias) | Low risk | |
| Selective reporting (reporting bias) | Unclear risk | Cannot be determined |
| Other bias | High risk | Unit of analysis not addressed |
| Methods | Trial design: Cluster randomised controlled trial Intervention period: 24 weeks Follow‐up period (post‐intervention): 6 months Differences in baseline characteristics: Reported Reliable outcomes: Reported Protection against contamination: Reported Unit of allocation: Nursery Unit of analysis: Individual | |
| Participants | N (controls baseline) = 277 N (controls follow‐up) = 259 (at 12 months) N (interventions baseline) = 268 N (interventions follow‐up) = 245 (at 12 months) Setting [and number by trial group]: Nurseries (intervention n = 18; control n = 18) Recruitment: 36 nurseries were randomly selected from a total of 104 nurseries that were willing to participate (124 nurseries in total were initially invited). All families with children in their preschool year attending the 36 nurseries were eligible to participate. Geographic Region: Glasgow, Scotland Percentage of eligible population enrolled: 47% (from original 124 invited nurseries) Mean Age: Intervention: 4.2 ± 0.3 years Control: 4.1 ± 0.3 years Sex: Intervention: 52% female Control: 48% female | |
| Interventions | Nursery element:
Home element:
Control:
Physical activity interventions versus control | |
| Outcomes | Primary outcome: BMI, expressed as a standard deviation score relative to UK 1990 reference data. Secondary outcomes: physical activity; sedentary behaviour; fundamental movement skills; process evaluation Process evaluation: Reported | |
| Implementation related factors | Theoretical basis: Not Reported Resources for intervention implementation (e.g. funding needed or staff hours required): Reported Who delivered the intervention: Reported PROGRESS categories assessed at baseline: Reported (Gender) PROGRESS categories analysed at outcome: Reported (Gender) Outcomes relating to harms/unintended effects: Not Reported Intervention included strategies to address diversity or disadvantage: Not Reported Economic evaluation: No formal evaluation, however costs of materials provided. | |
| Notes | ||
| Risk of bias | ||
| Bias | Authors' judgement | Support for judgement |
| Random sequence generation (selection bias) | Low risk | |
| Allocation concealment (selection bias) | Low risk | Allocation was by nursery and "allocations were concealed by carrying out randomisation of the 36 nurseries at the same time..." |
| Blinding (performance bias and detection bias) | Low risk | Researchers who made the outcome measures were blinded to nursery allocation with the exception of the statistician who carried out the allocation and the contact between the research team and the nurseries. Nurseries were made aware of their allocation status. |
| Incomplete outcome data (attrition bias) | Low risk | Participant flow provided and similar proportion of missing data from both groups |
| Selective reporting (reporting bias) | Unclear risk | Cannot be determined |
| Other bias | Low risk | Analysis conducted at the individual and nursery level. |
| Methods | Trial design: Cluster randomised controlled trial Intervention period: 12 weeks Follow‐up period (post‐intervention): Nil Differences in baseline characteristics: Not Reported Reliable outcomes: Reported Protection against contamination: Not Reported Unit of allocation: Grade Unit of analysis: Individual | |
| Participants | N (controls baseline) = 32 N (controls follow‐up) = 32 N (interventions baseline) = 45 N (interventions follow‐up) = 45 Setting: School (n=2, Intervention: 3 grades; Control: 3 grades) Recruitment: Girls who were inactive most days of the week and had no health condition limiting physical activity in grades 6, 7 and 8 from two middle schools in low socio‐economic areas in the Midwest Geographic Region: United States of America Percentage of eligible population enrolled: 100% of eligible Mean Age: Intervention Grade 6: 11.45 (0.80), Grade 7: 12.37 (0.50), Grade 8: 13.00 (0.00) Control Grade 6: 11.25 (0.46), Grade 7: 12.27 (0.59), Grade 8: 13.44 (0.53) Sex: Girls only | |
| Interventions |
Physical activity interventions versus control | |
| Outcomes | Height, Weight Physical activity frequency, intensity, duration, and readiness Physical activity determinants: interpersonal influences, activity‐related affect (physical activity enjoyment), self efficacy, and perceived benefits and barriers of physical activity Process evaluation: Reported | |
| Implementation related factors | Theoretical basis: Health Promotion Model and Transtheoretical Model Resources for intervention implementation (e.g. funding needed or staff hours required): Reported Who delivered the intervention: Reported PROGRESS categories assessed at baseline: Not Reported PROGRESS categories analysed at outcome: Not Reported Outcomes relating to harms/unintended effects: Not Reported Intervention included strategies to address diversity or disadvantage: Reported Economic evaluation: Not Reported | |
| Notes | ||
| Risk of bias | ||
| Bias | Authors' judgement | Support for judgement |
| Random sequence generation (selection bias) | Low risk | "Computer assignment to either an intervention or control group was based upon a numerical code that included school group and grade. Flip‐of‐a‐coin randomisation identified the grade and school assigned to each condition" |
| Allocation concealment (selection bias) | Low risk | Randomisation was at school level and was performed on all units at the start of the study |
| Blinding (performance bias and detection bias) | Unclear risk | Cannot be determined |
| Incomplete outcome data (attrition bias) | Low risk | |
| Selective reporting (reporting bias) | High risk | |
| Other bias | High risk | Unit of analysis issues not addressed |
| Methods | Trial Design: Randomised controlled trial All analyses were performed according to intention to treat principles | |
| Participants | N (controls‐ baseline) = 33 Recruitment: all consenting 8‐10 year old, African American girls with BMI >=50th percentile for age and gender, and a parent with a BMI = 25. Set in Oakland and Palo Alto, California, US. Proportion of eligibles participating: Not stated, but criteria kept broad. Intended to recruit 50 and 61 were enrolled. Mean Age: Intervention: 9.5 (SD 0.8) years; Controls: 9.5 (SD 0.9) | |
| Interventions | After school dance classes set in community centers designed to improve physical activity, reduce sedentary behaviours and enhance diet. The intervention called START (sisters taking action to reduce television) was delivered by trained university based dance instructors and a female African American intervention specialist. The programme consisted daily dance classes during school weeks and reducing television was covered in five home based lessons. Four community lectures were also provided. Combined effects of dietary interventions and physical activity interventions versus control | |
| Outcomes |
Process evaluation: Reported | |
| Implementation related factors | Theoretical basis: Social cognitive theory Resources for intervention implementation (e.g. funding needed or staff hours required): Reported Who delivered the intervention: Reported PROGRESS categories assessed at baseline: Reported (Education, SES) PROGRESS categories analysed at outcome: Not Reported Outcomes relating to harms/unintended effects: Not Reported Intervention included strategies to address diversity or disadvantage: Reported Economic evaluation: Not Reported | |
| Notes | ||
| Risk of bias | ||
| Bias | Authors' judgement | Support for judgement |
| Random sequence generation (selection bias) | Low risk | "...urn randomization procedure was used to generate the treatment allocation sequences. The different sequences were stored on a computer at the CC, and accessed using an interactive voice‐response telephone system." (Rochon 2003) |
| Allocation concealment (selection bias) | Unclear risk | Cannot be determined |
| Blinding (performance bias and detection bias) | Low risk | Outcome assessors were blinded |
| Incomplete outcome data (attrition bias) | Low risk | Missing data minimal and reasons given |
| Selective reporting (reporting bias) | High risk | Did not report % body fat at endpoint despite noting this as a measure and recording at baseline |
| Other bias | Low risk | |
| Methods | Trial design: Cluster randomised controlled trial Intervention period: 13 weeks Follow‐up period (post‐intervention): Nil Differences in baseline characteristics: Reported Reliable outcomes: Reported Protection against contamination: Reported Unit of allocation: Family Unit of analysis: Individual | |
| Participants | N (controls baseline): Families n=23 Target girls n = 14; Target boys n = 11 Other girls n = 9; Other boys n = 10 N (controls follow‐up): Families n = 19; Target girls n = 12; Target boys n = 8; Other girls n = 6; Other boys n = 6 N (interventions baseline): Families n = 82; Target girls n = 40; Target boys n = 53; Other girls n = 30; Other boys n = 22 N (interventions follow‐up): Families n = 62; Target girls n = 29; Target boys n = 39; Other girls n = 16; Other boys n = 18 Setting [and number by trial group]: Families (intervention n = 82; control n = 23) Recruitment: Families from Fort Collins, CO area with at least one 8‐ to 12‐year old child who was at‐risk‐for‐overweight or overweight (?85th percentile BMI‐for‐age) (target child) who would participate with at least one parent or guardian were recruited. Recruitment by printed flyers and email advertising. Geographic Region: Fort Collins, Colorado, USA Percentage of eligible population enrolled: Not Reported Mean Age: Intervention:
Control:
Sex: Intervention 55% female; Control 56% female | |
| Interventions | Intervention group:
Control group:
Both groups:
Combined effects of dietary interventions and physical activity interventions versus control | |
| Outcomes |
Process evaluation: Reported | |
| Implementation related factors | Theoretical basis: Not Reported Resources for intervention implementation (e.g. funding needed or staff hours required): Reported Who delivered the intervention: Reported PROGRESS categories assessed at baseline: Reported (Gender) PROGRESS categories analysed at outcome: Reported (Gender) Outcomes relating to harms/unintended effects: Not Reported Intervention included strategies to address diversity or disadvantage: Not Reported Economic evaluation: Not Reported | |
| Notes | ||
| Risk of bias | ||
| Bias | Authors' judgement | Support for judgement |
| Random sequence generation (selection bias) | Unclear risk | Cannot be determined |
| Allocation concealment (selection bias) | Unclear risk | Cannot be determined |
| Blinding (performance bias and detection bias) | Unclear risk | Cannot be determined |
| Incomplete outcome data (attrition bias) | Unclear risk | Higher proportion of drop outs in intervention group. Not clear how this may have affected results. |
| Selective reporting (reporting bias) | Unclear risk | Cannot be determined |
| Other bias | High risk | This study chose to enrol more families into the intervention group then control, so as a result the numbers of participants in the control group are very small, limiting the power for comparison. Not known if unit of analysis issues were addressed |
| Methods | Trial Design: Cluster randomised controlled trial | |
| Participants | For weight and height: Mean Age: | |
| Interventions | School‐based intervention ‐ Active Programme Promoting Lifestyle in Schools (APPLES). The programme was designed to influence diet and physical activity and not simply knowledge. Targeted at the whole school community including parents, teachers and catering staff. The programme consisted of teacher training, modifications of school meals and the development and implementation of school action plans designed to promote healthy eating and physical activity. Combined effects of dietary interventions and physical activity interventions versus control | |
| Outcomes | Body Mass Index Process evaluation: Reported | |
| Implementation related factors | Theoretical basis: multicomponent health promotion programme, based on the Health Promoting Schools concept Resources for intervention implementation (e.g. funding needed or staff hours required): Reported Who delivered the intervention: Reported PROGRESS categories assessed at baseline: Reported (Race, Gender) PROGRESS categories analysed at outcome: Not Reported Outcomes relating to harms/unintended effects: Reported Intervention included strategies to address diversity or disadvantage: Not Reported Economic evaluation: Not Reported | |
| Notes | ||
| Risk of bias | ||
| Bias | Authors' judgement | Support for judgement |
| Random sequence generation (selection bias) | Low risk | "We randomised them to receive the intervention or to serve as the comparison school using the toss of a coin." |
| Allocation concealment (selection bias) | Low risk | Schools were recruited, then all were randomised at the same time at the start of the study and interventions were implemented throughout participating schools. |
| Blinding (performance bias and detection bias) | High risk | Outcome assessment was not blinded |
| Incomplete outcome data (attrition bias) | Low risk | Participant flow provided and completion rate by outcome measure given |
| Selective reporting (reporting bias) | Unclear risk | Cannot be determined |
| Other bias | Low risk | Unit of analysis issues addressed |
| Methods | Trial Design: Cluster randomised controlled trial Intervention period: Two years Follow‐up period (post‐intervention): Nil Differences in baseline characteristics: Reported Reliable outcomes: Reported | |
| Participants | N (controls and intervention not reported separately ) = 740 Setting: School Age range (mean) 9.25 years | |
| Interventions | School‐based intervention. Followed the (Sports, Play and Active Recreation for Kids) SPARK intervention, incorporating physical education and self‐management into the school curriculum. Two intervention schools, led by either 1) certified physical education specialists or 2) classroom teachers evaluated against a control. Physical activity interventions versus control | |
| Outcomes | Weight Status: BMI presented at fall 1990, spring 1991, fall 1991 and spring 1992 Process evaluation: Not Reported | |
| Implementation related factors | Theoretical basis: Behaviour change and self‐management Resources for intervention implementation (e.g. funding needed or staff hours required): Reported Who delivered the intervention: Reported PROGRESS categories assessed at baseline: Reported (Race, Gender) PROGRESS categories analysed at outcome: Reported (Gender) Outcomes relating to harms/unintended effects: Not Reported Intervention included strategies to address diversity or disadvantage: Not Reported Economic evaluation: Not Reported | |
| Notes | ||
| Risk of bias | ||
| Bias | Authors' judgement | Support for judgement |
| Random sequence generation (selection bias) | High risk | 12 schools were "randomly assigned" to the 3 experimental conditions, however an additional school was recruited and added to the control group after this process was conducted. |
| Allocation concealment (selection bias) | Unclear risk | Cannot be determined |
| Blinding (performance bias and detection bias) | Unclear risk | Cannot be determined |
| Incomplete outcome data (attrition bias) | High risk | Missing data (26%) not provided by study group and reasons for attrition not given |
| Selective reporting (reporting bias) | Unclear risk | Protocol not available |
| Other bias | High risk | Unit of analysis issues not addressed. |
| Methods | Trial design: Cluster randomised controlled trial Intervention period: 6 months Follow‐up period (post‐intervention): 1 year (assessments at 6, 12 months post‐intervention) Differences in baseline characteristics: Reported Reliable outcomes: Reported Protection against contamination: Reported Unit of allocation: Class Unit of analysis: Individual | |
| Participants | N (controls baseline) = 62 N (controls 12 month follow‐up) = 55 N (behavioural modification (BM) intervention baseline) = 66 N (BM 12 month follow‐up) = 60 N (fundamental motor skills (FMS) intervention baseline) = 74 N (FMS 12 month follow‐up) = 69 N (BM/FMS baseline) = 93 N (BM/FMS 12 month follow‐up) = 84 Setting [and number by trial group]: 17 classes across 3 schools. Number of classes in each trial group not reported. Recruitment: All Grade 5 students within 3 selected government schools located across 4 campuses in low SES areas Geographic Region: Melbourne, Australia Percentage of eligible population enrolled: 78% Mean Age: Male 10 years 8 months ± 5 months Female 10 years 8 months ± 4 months Sex: 51% female | |
| Interventions | Three intervention groups:
Physical activity interventions versus control | |
| Outcomes |
Process evaluation: Reported | |
| Implementation related factors | Theoretical basis: Social cognitive theory and behavioural choice theory Resources for intervention implementation (e.g. funding needed or staff hours required): Reported Who delivered the intervention: Reported PROGRESS categories assessed at baseline: Reported (Place, Gender, Education, SES) PROGRESS categories analysed at outcome: Reported (Gender) Outcomes relating to harms/unintended effects: Reported Intervention included strategies to address diversity or disadvantage: Reported Economic evaluation: Not Reported | |
| Notes | ||
| Risk of bias | ||
| Bias | Authors' judgement | Support for judgement |
| Random sequence generation (selection bias) | Low risk | Randomised by withdrawing a ticket from a container |
| Allocation concealment (selection bias) | Low risk | Allocation was by class and all classes were randomised at the start of the study |
| Blinding (performance bias and detection bias) | Low risk | The five specialist evaluators who examined video tapes of children performing the fundamental movement skills to assess the children's mastery of these skills were blind to the group assignment. |
| Incomplete outcome data (attrition bias) | Unclear risk | Cannot be determined |
| Selective reporting (reporting bias) | Unclear risk | Cannot be determined |
| Other bias | Low risk | Adjusting for clustering by class |
| Methods | Trial design: Cohort Analytic Intervention period: 3 years Follow‐up period (post‐intervention): Nil Differences in baseline characteristics: Reported Reliable outcomes: Reported Protection against contamination: Reported Unit of allocation: School Unit of analysis: School | |
| Participants | N (controls baseline) = 1183 N (controls follow‐up) = 974 N (interventions baseline) = 1001 N (interventions follow‐up) = 833 Setting [and number by trial group]: preschools and primary schools (n=10 intervention) Recruitment: All preschools (n = 4, age 4 years) and primary schools (n = 6, age 5‐12 years) in Colac with ?20 enrolled children were included in sample frame. Comparison group sampled from a regionally representative population. Geographic Region: Colac, Australia Percentage of eligible population enrolled: 49.5% Mean Age: Intervention 8.21 (2.26) years Control 8.34 (2.22) years Sex: Intervention 54% female Control 50% female | |
| Interventions |
Combined effects of dietary interventions and physical activity interventions versus control | |
| Outcomes |
Process evaluation: Reported (www.goforyourlife.vic.gov.au/hav/articles.nsf/pracpages/Be_Active_Eat_Well) | |
| Implementation related factors | Theoretical basis: Reported Resources for intervention implementation (e.g. funding needed or staff hours required): Reported Who delivered the intervention: Reported PROGRESS categories assessed at baseline: Reported (Gender, SES) PROGRESS categories analysed at outcome: Reported (Education, SES) Outcomes relating to harms/unintended effects: Reported Intervention included strategies to address diversity or disadvantage: Not Reported Economic evaluation: Not Reported | |
| Notes | ||
| Risk of bias | ||
| Bias | Authors' judgement | Support for judgement |
| Random sequence generation (selection bias) | High risk | Not randomised |
| Allocation concealment (selection bias) | High risk | Not randomised |
| Blinding (performance bias and detection bias) | Low risk | Blinding not feasible, however primary outcomes were objective and not likely to be affected |
| Incomplete outcome data (attrition bias) | Low risk | |
| Selective reporting (reporting bias) | Low risk | |
| Other bias | Low risk | No unit of analysis issues |
| Methods | Trial design: Cluster randomised controlled trial Intervention period: 7 months of 1 school year Follow‐up period (post‐intervention): Nil Differences in baseline characteristics: Reported Reliable outcomes: Reported Protection against contamination: Reported Unit of allocation: School Unit of analysis: Individual with clustering by class All analyses were performed according to intention to treat principles | |
| Participants | N (controls baseline) = 608 N (controls follow‐up) = 493 N (interventions baseline) = 526 N (interventions follow‐up) = 434 Setting [and number by trial group]: 47 classes (n = 23 intervention; n = 24 control) in 22 schools Recruitment: All fourth graders from 22 public schools in metropolitan city of Niteroi were invited to participate. Geographic Region: Niteroi, Rio de Janeiro, Brazil Percentage of eligible population enrolled: 98% Mean Age: (intervention + control) Intervention: 10.9 ± 0.81 Control: 10.9 ± 0.75 Sex: Intervention: 53.1% female; Control: 52.6% female | |
| Interventions | Focus on the reduction in consumption of sugar‐sweetened carbonated beverages by students:
Dietary interventions versus control | |
| Outcomes | Outcome measures:
Process evaluation: Not reported | |
| Implementation related factors | Theoretical basis: Not reported Resources for intervention implementation (e.g. funding needed or staff hours required): Reported Who delivered the intervention: Reported PROGRESS categories assessed at baseline: Reported (Gender, Race) PROGRESS categories analysed at outcome: Reported (Gender) Outcomes relating to harms/unintended effects: Not Reported Intervention included strategies to address diversity or disadvantage: Not Reported Economic evaluation: Not Reported | |
| Notes | ||
| Risk of bias | ||
| Bias | Authors' judgement | Support for judgement |
| Random sequence generation (selection bias) | Unclear risk | Cannot be determined |
| Allocation concealment (selection bias) | Low risk | Randomisation at school level and all schools randomised at start of study |
| Blinding (performance bias and detection bias) | Unclear risk | Cannot be determined |
| Incomplete outcome data (attrition bias) | Low risk | |
| Selective reporting (reporting bias) | Unclear risk | Protocol not available |
| Other bias | Low risk | ITT analysis performed taking into account clustering by class |
| Methods | Trial design: Cluster randomised controlled trial Intervention period: 4 years Follow‐up period (post‐intervention): Nil Differences in baseline characteristics: Reported Reliable outcomes: Reported Protection against contamination: Reported Unit of allocation: School Unit of analysis: School, Individual Sensitvity analysis conducted using intention to treat population to compare this with analysis using data from only those participants who completed the study. | |
| Participants | N (controls baseline) = 479 (blood samples n=326) N (controls follow‐up) = 358 N (interventions baseline) = 475 (blood samples n=304) N (interventions follow‐up) = 374 Setting [and number by trial group]: 8 schools (4 in each group) Recruitment: Four pairs of matched schools randomly selected out of 77 public middle schools of the Department of Bas‐Rhin. All six‐graders in randomised schools were eligible. Geographic Region: Eastern France Percentage of eligible population enrolled: 91% (surveys); 73% (blood samples) Mean Age: Intervention: 11.7 ± 0.7 Control: 11.6 ± 0.6 Sex: Intervention: 52.6% female Control: 47.4% female | |
| Interventions | programme began during first school year and ran until end of fourth school year
[Physical activity interventions versus control] | |
| Outcomes | Primary Outcome: BMI Secondary Outcomes:
Process evaluation: Reported | |
| Implementation related factors | Theoretical basis: Behaviour change and socio‐ecological model Resources for intervention implementation (e.g. funding needed or staff hours required): Not Reported Who delivered the intervention: Reported PROGRESS categories assessed at baseline: Reported (Gender,, SES) PROGRESS categories analysed at outcome: Reported (Gender,, SES) Outcomes relating to harms/unintended effects: Not Reported Intervention included strategies to address diversity or disadvantage: Not Reported Economic evaluation: Not Reported | |
| Notes | Study rationale, research design, intervention programme and process evaluation described in additional papers (Simon et al. Int J Obes Relat Metab Disord 2004; 28 (Suppl 3):S96‐S103; Simon et al. Diabetes Metab 2006;32:41‐49) | |
| Risk of bias | ||
| Bias | Authors' judgement | Support for judgement |
| Random sequence generation (selection bias) | Unclear risk | Cannot be determined |
| Allocation concealment (selection bias) | Low risk | Randomised at the school level and all schools randomised at start of study |
| Blinding (performance bias and detection bias) | Unclear risk | Cannot be determined |
| Incomplete outcome data (attrition bias) | Low risk | |
| Selective reporting (reporting bias) | Unclear risk | Cannot be determined |
| Other bias | Low risk | Analysis at school and individual level |
| Methods | Trial design: Cluster randomised controlled trial Intervention period: 8 months Follow‐up period (post‐intervention): 4 months and 12 months post‐intervention (12 and 20 month observations respectively) Differences in baseline characteristics: Reported Reliable outcomes: Reported Protection against contamination: Reported Unit of allocation: School Unit of analysis: Individual with multilevel analysis that included student, class, school All analyses were performed according to intention to treat principles | |
| Participants | N (controls baseline) = 476 N (controls follow‐up) = Not reported by group N (interventions baseline) = 632 N (interventions follow‐up) = Not reported by group Setting [and number by trial group]: schools (n = 10 intervention; n = 8 control). Three classes in each school were included. Recruitment: Participating schools were asked to select 3 classes of first‐year students. Selection of classes was based on practical reasons. Geographic Region: The Netherlands Percentage of eligible population enrolled: 84% Mean Age: Intervention: Boys = 12.8±0.5; Girls = 12.6 ± 0.5 Control: Boys = 12.9±0.5; Girls = 12.7 ± 0.5 Sex: Intervention: 53% female Control: 47% female | |
| Interventions | Aim was to increase awareness and induce behavioural changes:
Combined effects of dietary interventions and physical activity interventions versus control | |
| Outcomes | Outcome measures
Process evaluation: Reported | |
| Implementation related factors | Theoretical basis: Reported (Intervention mapping protocol, behaviour change and environmental frameworks) Resources for intervention implementation (e.g. funding needed or staff hours required): Reported Who delivered the intervention: Reported PROGRESS categories assessed at baseline: Reported (Gender, Race) PROGRESS categories analysed at outcome: Reported (Gender, Race) Outcomes relating to harms/unintended effects: Not Reported Intervention included strategies to address diversity or disadvantage: Reported Economic evaluation: Not Reported | |
| Notes | Protocol published separately. Refer to: Singh et al. BMC Public Health 2006, 6:304 doi:10.1186/1471‐2458‐6‐304 This also includes 8‐month outcome data published in Singh et al. Arch Pediatr Adolesc Med 2007;161:565‐571 | |
| Risk of bias | ||
| Bias | Authors' judgement | Support for judgement |
| Random sequence generation (selection bias) | Low risk | |
| Allocation concealment (selection bias) | Low risk | Randomisation occurred at the school level and was performed on all units at the start of the study |
| Blinding (performance bias and detection bias) | High risk | Research assistants involved in conducting measurements and delivering intervention materials were not blinded. Other members of the research team who helped with the measurements were blinded. |
| Incomplete outcome data (attrition bias) | Low risk | |
| Selective reporting (reporting bias) | Low risk | Study protocol published |
| Other bias | Low risk | Multilevel analysis included student, class, school |
| Methods | Trial design: Cluster randomised controlled trial Intervention period: 5‐6 months Follow‐up period (post‐intervention): Nil Differences in baseline characteristics: Not Reported Reliable outcomes: Reported Protection against contamination: Reported Unit of allocation: Classroom Unit of analysis: Individual (not adjusted for clustering by classroom) | |
| Participants | N (controls baseline) = 572 N (controls follow‐up) = 479 N (interventions baseline) = 619 N (interventions follow‐up) = 534 Setting: Classrooms in Schools Recruitment: Fourth and fifth graders from 16 schools (69 classes) in four states (Delaware, Florida, Kansas, and North Carolina) Geographic Region: United States of America Percentage of eligible population enrolled: Not Reported Mean Age: Not Reported (fourth and fifth graders) Sex: Both males and females | |
| Interventions |
Combined effects of dietary interventions and physical activity interventions versus control | |
| Outcomes | Height, Weight Diet (survey) Physical activity levels (survey) Process evaluation: Reported | |
| Implementation related factors | Theoretical basis: Reported (Theory of Reasoned Action, Constructivism) Resources for intervention implementation (e.g. funding needed or staff hours required): Reported Who delivered the intervention: Reported PROGRESS categories assessed at baseline: Reported (Place, SES) PROGRESS categories analysed at outcome: Not Reported Outcomes relating to harms/unintended effects: Not Reported Intervention included strategies to address diversity or disadvantage: Reported Economic evaluation: Not Reported | |
| Notes | ||
| Risk of bias | ||
| Bias | Authors' judgement | Support for judgement |
| Random sequence generation (selection bias) | Unclear risk | Cannot be determined |
| Allocation concealment (selection bias) | Unclear risk | Cannot be determined |
| Blinding (performance bias and detection bias) | Unclear risk | Cannot be determined |
| Incomplete outcome data (attrition bias) | Low risk | |
| Selective reporting (reporting bias) | Unclear risk | Cannot be determined |
| Other bias | High risk | Analysis not adjusted for clustering by classroom |
| Methods | Trial Design: Randomised controlled trial Follow‐up (post‐intervention): Nil Protection against contamination: Not possible | |
| Participants | N (intervention baseline) = 32mothers and 32 daughters Unable to separate intervention from control figures with data provided. Age: 7 to 12 years, mean age Intervention 9.9 (SD I.3); Controls 10.0 (SD 1.5) years | |
| Interventions | Set up within a community based tutoring programme this intervention examined the effectiveness of a culturally specific obesity prevention programme for low‐income, inner‐city African American, preadolescent girls and their mothers. Combined effects of dietary interventions and physical activity interventions versus control | |
| Outcomes | Mother and daughters: Body weight and height % overweight Daily caloric intake, total fat gram intake, % calories from fat, sat fat, dietary cholesterol assessed by Quick Check for Fat (QCF) and analysed with Quick Check Diet (QCD). Parental completion of a self‐report measure of parental support and role modelling around food. Process evaluation: Reported | |
| Implementation related factors | Theoretical basis: Not Reported Resources for intervention implementation (e.g. funding needed or staff hours required):Not Reported Who delivered the intervention: Reported PROGRESS categories assessed at baseline: Reported (Occupation, Gnder, Education, SES) PROGRESS categories analysed at outcome: Not Reported Outcomes relating to harms/unintended effects: Not Reported Intervention included strategies to address diversity or disadvantage: Reported Economic evaluation: Not Reported | |
| Notes | ||
| Risk of bias | ||
| Bias | Authors' judgement | Support for judgement |
| Random sequence generation (selection bias) | Unclear risk | Cannot be determined |
| Allocation concealment (selection bias) | Unclear risk | Cannot be determined |
| Blinding (performance bias and detection bias) | Unclear risk | Cannot be determined |
| Incomplete outcome data (attrition bias) | High risk | 78% of mothers completed the study with a difference in weight between completers and dropouts. Thinner mothers were more likely to drop out (p<0.05). |
| Selective reporting (reporting bias) | Unclear risk | Cannot be determined |
| Other bias | Low risk | |
| Methods | Trial Design: Randomised controlled trial | |
| Participants | N (controls baseline) = 27 Proportion of eligibles participating: Not stated, but criteria kept broad. Intended to recruit 50 and 61 were enrolled Geographical setting: Minnesota, US. Mean Age: Intervention 9.4 (SD 0.9); Controls 9.1 (SD 0.8) years | |
| Interventions |
Combined effects of dietary interventions and physical activity interventions versus control | |
| Outcomes |
Process evaluation: Reported | |
| Implementation related factors | Theoretical basis: Social cognitive theory, youth development, and resiliency based approach Resources for intervention implementation (e.g. funding needed or staff hours required): Reported Who delivered the intervention: Reported PROGRESS categories assessed at baseline: Reported (Race, Education, SES) PROGRESS categories analysed at outcome: Not Reported Outcomes relating to harms/unintended effects: Reported Intervention included strategies to address diversity or disadvantage: Reported Economic evaluation: Not Reported | |
| Notes | ||
| Risk of bias | ||
| Bias | Authors' judgement | Support for judgement |
| Random sequence generation (selection bias) | Low risk | "...urn randomization procedure was used to generate the treatment allocation sequences. The different sequences were stored on a computer at the CC, and accessed using an interactive voice‐response telephone system." (Rochon 2003) |
| Allocation concealment (selection bias) | Unclear risk | Cannot be determined |
| Blinding (performance bias and detection bias) | Unclear risk | Cannot be determined |
| Incomplete outcome data (attrition bias) | Low risk | Missing data minimal (1 participant). |
| Selective reporting (reporting bias) | High risk | Did not report % body fat at endpoint despite noting this as a measure and recording at baseline |
| Other bias | Low risk | |
| Methods | Trial design: Controlled clinical trial Intervention period: 2 years Follow‐up period (post‐intervention): two years Differences in baseline characteristics: Reported Reliable outcomes: Reported Protection against contamination: Not Reported Unit of allocation: Community Unit of analysis: Individual | |
| Participants | N (controls baseline) = 270 N (controls post‐intervention) = 207 N (controls follow‐up) = 274 N (interventions baseline) = 302 N (intervention post‐intervention) = 177 N (intervention follow‐up) = 280 Setting: Primary schools (4 intervention, 3 control) Recruitment: Children aged 5‐12 years from 7 primary schools from 2 geographic regions Geographic Region: New Zealand Percentage of eligible population enrolled: Intervention: 92%, Control: 87% Mean Age: Intervention: 8.0 (1.7) years; Control: 7.9 (1.5) years Sex: Both males and females | |
| Interventions |
Combined effects of dietary interventions and physical activity interventions versus control | |
| Outcomes |
Process evaluation: Not reported | |
| Implementation related factors | Theoretical basis: Not reported Resources for intervention implementation (e.g. funding needed or staff hours required): Reported Who delivered the intervention: Reported PROGRESS categories assessed at baseline: Reported (Place, Race, Gender) PROGRESS categories analysed at outcome: Not Reported Outcomes relating to harms/unintended effects: Not Reported Intervention included strategies to address diversity or disadvantage: Not Reported Economic evaluation: Not Reported | |
| Notes | Taylor 2006, 2007 & 2008 | |
| Risk of bias | ||
| Bias | Authors' judgement | Support for judgement |
| Random sequence generation (selection bias) | High risk | Not Randomised |
| Allocation concealment (selection bias) | Unclear risk | Not Randomised |
| Blinding (performance bias and detection bias) | Unclear risk | Cannot be determined |
| Incomplete outcome data (attrition bias) | Low risk | Reasons given for missing data and demographic characteristics of those lost to follow‐up were similar to those remaining in the study. |
| Selective reporting (reporting bias) | Unclear risk | Cannot be determined |
| Other bias | Unclear risk | Cannot be determined |
| Methods | Trial design: Cluster randomised controlled trial Intervention period: 24 weeks (during the 2004‐2005 academic year) Follow‐up period (post‐intervention): Nil Differences in baseline characteristics: Reported Reliable outcomes: Reported Protection against contamination: Reported Unit of allocation: School Unit of analysis: Individual All analyses were performed according to intention to treat principles | |
| Participants | N (controls baseline) = 606 N (controls follow‐up) = 579 N (interventions baseline) = 513 N (interventions follow‐up) = 465 Setting [and number by trial group]: Schools (n = 10 intervention; n = 10 control) Recruitment: Selected 20 schools in 20 towns in the Province of Cuenca, Spain. Fourth and fifth‐grade children in participating schools were invited to participate. Geographic Region: Cuenca, Spain Percentage of eligible population enrolled: 79% Mean Age: Intervention: boys = 9.4 ± 0.7 years; girls = 9.4 ± 0.7 years Control: boys = 9.5 ± 0.7 years; girls = 9.4 ± 0.6 years Sex: Intervention : 48.9% female Control: 49.6% female | |
| Interventions |
Physical activity intervention versus control | |
| Outcomes |
Process evaluation: Reported | |
| Implementation related factors | Theoretical basis: Not Reported Resources for intervention implementation (e.g. funding needed or staff hours required): Reported Who delivered the intervention: Reported PROGRESS categories assessed at baseline: Reported (Gender) PROGRESS categories analysed at outcome: Reported (Gender) Outcomes relating to harms/unintended effects: Not reported Intervention included strategies to address diversity or disadvantage: Reported Economic evaluation: No formal evaluation, however average cost per child was provided (28 euros per child per month) | |
| Notes | ||
| Risk of bias | ||
| Bias | Authors' judgement | Support for judgement |
| Random sequence generation (selection bias) | Low risk | used a computer‐generated procedure |
| Allocation concealment (selection bias) | Low risk | Randomisation occurred at the school level and "Schools were informed of the result of randomisation after they agreed to participate in the study" |
| Blinding (performance bias and detection bias) | High risk | Nurses who made the anthropometric and blood pressure measurements were not blinded to intervention allocation. Laboratory analysts who determined blood lipids were blinded to school allocation |
| Incomplete outcome data (attrition bias) | Low risk | Low rates of attrition between groups |
| Selective reporting (reporting bias) | Unclear risk | Protocol not available |
| Other bias | Low risk | Analysis conducted taking clustering into account |
| Methods | RCT Intervention period: Fourteen moths Follow‐up (post‐intervention): Nil | |
| Participants | N (controls and interventions ‐ baseline) = 218 Recruitment: all consenting 5‐7 year‐olds from 3 primary schools. Set in central UK. Proportion of eligibles participating: Not stated Mean Age: all groups 6.1 (SD 0.6) years; | |
| Interventions |
Combined effects of dietary interventions and physical activity interventions versus control | |
| Outcomes |
Process Evaluation: Reported | |
| Implementation related factors | Theoretical basis: Social learning theory Resources for intervention implementation (e.g. funding needed or staff hours required): Reported Who delivered the intervention: Reported PROGRESS categories assessed at baseline: Reported (Gender, Education) PROGRESS categories analysed at outcome: Not Reported Outcomes relating to harms/unintended effects: Not Reported Intervention included strategies to address diversity or disadvantage: Reported Economic evaluation: Not Reported | |
| Notes | ||
| Risk of bias | ||
| Bias | Authors' judgement | Support for judgement |
| Random sequence generation (selection bias) | Unclear risk | Cannot be determined |
| Allocation concealment (selection bias) | Unclear risk | Cannot be determined |
| Blinding (performance bias and detection bias) | Unclear risk | Cannot be determined |
| Incomplete outcome data (attrition bias) | Low risk | Similar numbers missing from each group. Reasons for withdrawal given and characteristics of withdrawals investigated. |
| Selective reporting (reporting bias) | Unclear risk | Cannot be determined |
| Other bias | Low risk | |
| Methods | Trial design: Repeated cross‐sectional design (cluster randomisation to determine intervention allocation) Intervention period: 2 year staff‐directed intervention followed by 1 year Programme Champion component Follow‐up period (post‐intervention): Nil Differences in baseline characteristics: Reported Reliable outcomes: Reported Protection against contamination: Reported Unit of allocation: School Unit of analysis: Individual with group randomisation and the nesting of students within schools, sites and conditions taken into account | |
| Participants | N* (baseline) = 1721 (intervention + control) N* (follow‐up; primary outcome) = 3504 (intervention + control) *Note: The larger N at follow‐up was possible due to the cross‐sectional sampling design and the study team decision to recruit twice as many participants at follow‐up compared with baseline Setting [and number by trial group]: School (intervention n = 18; control n = 18) Recruitment: Public middle schools in which a majority of students lived in the surrounding community, with enrolment of at least 90 8th‐grade girls at least one semester of PE in each grade were eligible to participate. Student and parental consent obtained prior to each measurement period during which cross‐sectional, random samples of girls were recruited for measurement. Geographic Region: Louisiana and South Carolina, USA Percentage of eligible population sampled at baseline: 79.7% Mean Age: Intervention = 11.9 years Control: boys = 12.0 years Sex: 100% female | |
| Interventions | Intervention activities targeted to create:
Activities included:
Control schools received a delayed intervention after all measurements were obtained. Physical activity intervention vs control | |
| Outcomes |
Process Evaluation: Reported | |
| Implementation related factors | Theoretical basis:
Resources for intervention implementation (e.g. funding needed or staff hours required): Reported Who delivered the intervention: Reported PROGRESS categories assessed at baseline: Reported (Race) PROGRESS categories analysed at outcome: Reported (Race) Outcomes relating to harms/unintended effects: Not Reported Intervention included strategies to address diversity or disadvantage: Not Reported Economic evaluation: Not Reported | |
| Notes | ||
| Risk of bias | ||
| Bias | Authors' judgement | Support for judgement |
| Random sequence generation (selection bias) | Unclear risk | Method of sequence generation not reported |
| Allocation concealment (selection bias) | Low risk | Allocation at the school level and all schools were allocated at the start of the study |
| Blinding (performance bias and detection bias) | Unclear risk | Blinding not reported. Separate intervention and measurement staff were employed, however it is not clear whether measurement staff were blinded. |
| Incomplete outcome data (attrition bias) | Low risk | Due to repeated cross‐sectional design, the same participants were not followed throughout the study, however all girls in participating schools received the intervention. This design was used to assess intervention effects in the entire population of girls enrolled in participating schools. |
| Selective reporting (reporting bias) | Unclear risk | Could not be determined |
| Other bias | Low risk | |
Glossary
BMI, Body Mass Index
CSA accelerometer, COmputer Sciences Applicvations accelerometer
GEMS, Acronym for Girlsl health Enrichment Multi site Studies
SD, standard deviation
TSF, Triceps Skinfold
WHCU weight/height cubed.
Characteristics of excluded studies [ordered by study ID]
| Study | Reason for exclusion |
| Longitudinal cohort study‐No intervention | |
| Intervention designed for the treatment of childhood obesity | |
| Longitudinal cohort study‐No intervention | |
| Aim of the trial was to prevent cardiovascular disease | |
| Cluster allocation with fewer than six groups | |
| Parent‐targeted intervention designed specifically for the treatment of obesity | |
| Aim of the trial was to improve nutritional intake | |
| Aim of the trial was to improve nutritional intake | |
| Aim was to improve dietary habits of families | |
| Aim was to improve physical activity | |
| Aim was to improve nutritional intake | |
| Intervention recruited only overweight or obese participants so considered treatment for the purposes of this review | |
| Intervention was less than 12 weeks | |
| Aim was to increase parent awareness of child weight status | |
| Aim of the trial was to prevent children's behaviour disorders | |
| Aim of the trial was to improve nutritional intake | |
| Intervention designed specifically for the treatment of obesity | |
| Intervention was less than 12 weeks | |
| Aim of the trial was to improve nutritional intake | |
| Cluster allocation with fewer than six groups | |
| Cluster allocation with fewer than six groups | |
| Intervention designed specifically for the treatment of obesity | |
| Intervention designed specifically for the treatment of obesity | |
| Cluster allocation with fewer than six groups | |
| Comparative study‐No intervention | |
| Intervention duration less than 12 weeks | |
| Intervention duration less than 12 weeks | |
| Intervention duration was less than 12 weeks | |
| Study did not report to be measuring any of the primary outcomes of the review | |
| Intervention less than 12 weeks duration | |
| Intervention less than 12 weeks duration | |
| Intervention designed specifically for the treatment of obesity | |
| Aim of the trial was to prevent cardiovascular disease | |
| Aim of the trial was to improve nutritional intake | |
| Aim of the trial was to prevent cardiovascular disease | |
| Intervention designed specifically for the treatment of obesity | |
| Intervention duration less than 12 weeks | |
| Cluster allocation with fewer than six groups | |
| Study did not report to be measuring any of the primary outcomes of the review | |
| Aim of the trial was to improve nutritional intake | |
| Aim of the trial was to improve nutritional intake | |
| Aim of the trial was to assess the effects of a health education intervention aimed at reducing risk for CVD and cancer | |
| Aim of the trial was to prevent cardiovascular disease | |
| Aim of the trial was to improve nutritional intake. | |
| Aim of the trial was to improve physical activity and fitness | |
| Aim of the trial was to improve nutritional intake | |
| Intervention designed specifically for the treatment of obesity | |
| Intervention duration less than 12 weeks | |
| Intervention less than 12 weeks duration | |
| Intervention was less than 12 weeks | |
| Aim was to improve nutritional intake | |
| Aim of the trial was to improve nutritional intake | |
| Aim of trial was to improve cardiovascular risk factors | |
| Aim of trial was to examine neurological development | |
| Intervention designed specifically for the treatment of obesity | |
| Intervention designed specifically for the treatment of obesity | |
| Cluster allocation with fewer than six groups | |
| Intervention duration less than 12 weeks | |
| This trial was conducted before 1990 and so had been excluded from this review | |
| Aim of the trial was to improve nutritional intake | |
| Aim of the trial was to improve bone health outcomes | |
| Aim of the trial was to improve fitness levels. | |
| Aim was to improve nutritional intake | |
| Cluster allocation with fewer than six groups | |
| Aim of trial was to improve nutritional intake. | |
| Aim of the trial was to prevent cardiovascular disease | |
| Intervention duration less than 12 weeks | |
| Trial conducted in hypercholesterolaemic children | |
| Cross‐sectional study design. Not evaluating the intervention | |
| This was not an intervention study | |
| Aim of the trial was to prevent cardiovascular disease | |
| Aim of the trial was to prevent cardiovascular disease | |
| Intervention recruited only overweight or obese participants so considered treatment for the purposes of this review | |
| Cluster allocation with fewer than 6 groups |
Characteristics of ongoing studies [ordered by study ID]
| Trial name or title | Birmingham Healthy Eating and Active Lifestyle for Children Study (BEACHES) |
| Methods | |
| Participants | School children aged 6 to 8 years particularly focusing on South Asians |
| Interventions | Intervention still in development phase. Baseline data is being analysed along with reviewing evidence base and receiving expert input. Baseline data consisted of focus groups undertaken with a range of stakeholders to gauge views of childhood obesity and potential prevention interventions explored. Baseline measurements were also taken from participants including: height, weight, waist circumference, skinfolds, BIA, Blood Pressure, Physical Activity assessment, Dietary Assessment, HRQoL, Self concept, Body Image, Demographics (each involved follow‐up measures). |
| Outcomes | |
| Starting date | TBC |
| Contact information | Adab Peymane, University of Birmingham |
| Notes | Communication with the lead author (Adab) has confirmed that no outcomes from this study have been published yet. ISRCTN51016370 |
| Trial name or title | Tooty Fruity Vegie in Preschools (TFV) |
| Methods | Controlled before and after study evaluating a one‐year intervention conducted during 2006‐2007 in 18 preschools (matched with 13 control preschools). |
| Participants | Recruited from preschools in NSW, Australia. Those in towns with a high proportion of disadvantaged populations were prioritised. |
| Interventions | Intervention strategies included skills development and awareness‐raising for parents, staff and children, and social support for parents to foster behaviour changes in their children through feedback and reinforcement. Included healthy eating and physical activity strategies. |
| Outcomes | Primary outcome measures were BMI and waist circumference. Intermediary impact indicators include FMS proficiency, access to and consumption of fruits and vegetables, EDNP food and sweet drinks, time spent in screen‐based activities and outdoors. Outcome measures assessed at baseline and 10 months. |
| Starting date | 2007 |
| Contact information | Jillian Adams, North Coast Area Health Service. [email protected] |
| Notes |
| Trial name or title | Empowering Mothers to Prevent Obesity at Weaning |
| Methods | |
| Participants | Women with pre‐pregnancy obesity (BMI >35). |
| Interventions | Feasibility RCT of the effectiveness of an intervention aimed at empowering mothers to prevent obesity at weaning |
| Outcomes | |
| Starting date | 01/04/2007 Project End Date: 31/08/2009 |
| Contact information | Jane Barlow, Professor of Public Health in the Early Years, University of Warwick, Conventary. [email protected] |
| Notes |
| Trial name or title | The Infant Food Activity and Nutrition Trial (INFANT) an early intervention to prevent childhood obesity: cluster‐randomised controlled trial |
| Methods | Cluster RCT (with first‐time parent groups as the unit of randomisation) to be conducted with a sample of 600 first‐time parents and their newborn children who attend the first‐time parents' group at Maternal and Child Health Centres in Victoria, Australia. Groups randomly allocated to intervention or control groups. |
| Participants | First‐time parents and their new born children who attend first‐time parents groups |
| Interventions | The INFANT project will employ an anticipatory guidance approach to support first‐time parents in skilled approaches to their infants emerging dietary, physical activity and sedentary behaviours. The intervention will be delivered by an experienced dietician during infants’ first 18 months of life at first‐time parents groups within Maternal and Chid Health (MCH) centers. |
| Outcomes | Early health promotion programme delivered to first‐time parents in their existing social groups promotes healthy eating, physical activity and reduced sedentary behaviour. |
| Starting date | TBC |
| Contact information | Dr Karen Campbell |
| Notes | ISRCTN81847050 |
| Trial name or title | Positive feeding practices and food preferences in very early childhood: an innovative approach to obesity prevention |
| Methods | |
| Participants | First time mothers of healthy infants 4‐7 months at enrolment |
| Interventions | Will provide anticipatory guidance via 2 x 12 week parent education and peer support modules (6x1.5 hours sessions), each followed by 6 x monthly maintenance contact (choice support phone/email) The modules will commence at ages 4‐7m and 13‐16m to coincide with establishment of solid feeding and development of autonomy and independence. |
| Outcomes | assessed at baseline (age 4‐7m), 9 m (age 13‐16 m) and 18 m (final, age 2y). |
| Starting date | |
| Contact information | Professor Lynn Daniels, Institute of Healthand Biomedical Innovation (IHBI), School of Public Health (SPH), Queensland University of Technology [email protected] |
| Notes |
| Trial name or title | ‘Go for your life’ Health Promoting Communities: Being Active Eating Well HPC: BAEW |
| Methods | A quasi‐experimental multi‐level intervention demonstration project with comparison group to increase community capacity to promote healthy eating and physical activity, measured by changes in community capacity, environments, health behaviours and anthropometry. |
| Participants | Inclusion criteria: Each project has a primary and secondary target group, with comparison groups selected to match primary targets. Target groups include children 0‐12, adolescents 12‐18, young people newly arrived to Australia, families, carers, working adults, older adults, seniors and an indigenous community. Exclusion criteria: None Age minimum: 0 No limit |
| Interventions | Intervention groups: multiple strategies in schools, workplaces and community organisations to promote healthy eating and physical activity. Examples of strategies include school and workplace food policies, community kitchens and gardens, walking groups, parent education programs, social marketing, training of local professionals and promoting active transport. The duration of the trial is approximately 4 years. |
| Outcomes | Primary: BMI z‐score Secondary: BMI Community capacity to effect behaviour change around overweight and obesity, as evidenced by the development of new structures and partnerships, staff development, community awareness etc (measured by expert assessment) Prevalence of overweight and obesity, measured by BMI and waist circumference School and workplace environmental changes, as measured by school/workplace environmental audits and expert assessment. Waist circumference |
| Starting date | 2006 |
| Contact information | Michelle Haby: [email protected] |
| Notes | ACTRN12609000892213 |
| Trial name or title | Lekker Fit! |
| Methods | Cluster RCT in 20 primary schools comparing intervention with control |
| Participants | Children aged 6‐12 years in grades 3 through to 8 within primary schools in Rotterdam with large populations of foreign ethnicity |
| Interventions | Main components of the intervention are the re‐establishment of a professional physical education teacher; three (instead of two) PE classes per week; additional sport and play activities outside school hours; fitness testing; classroom education on health nutrition, active living and healthy lifestyle choices; and the involvement of parents. |
| Outcomes | Primary outcome measures are BMI, waist circumference and fitness. Secondary outcomes are assessed in a subgroup of grade 6‐8 pupils and consist of nutrition and physical activity behaviours and behavioural determinants. |
| Starting date | |
| Contact information | Wilma Jansen: [email protected] |
| Notes | ISRCTN84383524 |
| Trial name or title | The HIKCUPS trial: a multi‐site ramdomised controlled trial of a combined physical activity skill‐development and dietary modification programme in overweight and obese children |
| Methods | Multi‐site randomised controlled trial in overweight/obese children comparing the efficacy of three interventions: 1) a parent‐centered dietary modification programme; 2) a child‐centered physical activity skill‐development programme; and 3) a programme combining both 1 and 2 above. |
| Participants | Overweight/obese 5‐9 year old children. Approximately 200 families are being recruited, three cohorts during 2005 and one cohort during 2006 from the Hunter and Illawarra regions of New South Wales, Australia. |
| Interventions | Each intervention consists of three components: i) 10‐weekly face‐to‐face group sessions; ii) a weekly homework component, completed between each face‐to‐face session and iii) three telephone calls at monthly intervals following completion of the 10‐week programme. |
| Outcomes | The primary outcome measures are BMI z‐score and waist circumference. The secondary outcomes include: metabolic profile, dietary intake, Child Feeding Questionnaire, fundamental movement skill proficiency and perceived competence, objectively measured physical activity, time spent in sedentary activities, proficiency in performing an activity of daily living, and health‐related quality of life. Outcome measures are assessed at baseline and at 6‐, 12‐ and 24‐months. |
| Starting date | |
| Contact information | Rachel Jones: [email protected] |
| Notes |
| Trial name or title | The electronic games to aid motivation to exercise study (eGAME) |
| Methods | Standard 2‐arm parallel RCT. 330 participants will be randomised to receive either an active video game upgrade package or to a control group |
| Participants | Children aged 10‐14 years living in the greater metropolitan Auckland area, who are overweight and play>= two hours of video games per week. |
| Interventions | Intervention involves an upgrade of children's existing gaming technology to enable them to play active video games at home. |
| Outcomes | Primary outcome: change in BMI from baseline to 12 and 24 weeks. Secondary outcomes: changes in % body fat, waist circumference, physical fitness, physical activity (time spent), psychological variables |
| Starting date | |
| Contact information | Louise Foley: [email protected] |
| Notes |
| Trial name or title | eat well be active Community Programs |
| Methods | Controlled before and after study evaluating a five‐year intervention conducted during 2006‐2010 in 18 preschools, 27 schools and 20 additional community settings (matched with similar numbers of comparison settings by non‐random allocation). |
| Participants | Recruited from preschools, schools and community settings in two geographically distinct communities in SA, Australia. All communities were more socio‐economic disadvantaged than the State average. |
| Interventions | Intervention strategies included workforce development and peer education for staff, healthy eating and physical activity policy, infrastructure (such as drinking water facilities and canteen improvements), resources and programs, local marketing and promotion of key messages (fruit and vegetables, water, active play and breastfeeding), and community development via the establishment of local stakeholder action groups. |
| Outcomes | Primary outcome measures included BMI of preschool children, and BMI and waist circumference of primary school children. Impact indicators included primary school children’s behaviours, attitudes and knowledge; and environments of preschools, primary school and high schools via staff surveys of policy, access, attitudes and knowledge relating to healthy eating, breastfeeding, physical activity and sedentary time. Evaluation measures assessed at baseline and 5 years. |
| Starting date | 2005 |
| Contact information | Nadia Mastersson, SA Health [email protected] |
| Notes | Intervention implementation concluded June 2010. Final evaluation report released February 2011. http://www.health.sa.gov.au/pehs/branches/health‐promotion/ewba/publications.htm |
| Trial name or title | |
| Methods | Cluster RCT conducted in preschools to test a multidisciplinary lifestyle intervention versus control. |
| Participants | Twenty preschool classes in the German and another 20 in the French part of Switzerland (areas with a high migrant population) were selected to participate. |
| Interventions | The multidisciplinary lifestyle intervention aimed to increase physical activity and sleep duration, to reinforce healthy nutrition and eating behaviour and to reduce media use. It included children, their parents and the teachers. The intervention included physical activity lessons, adaptation of the built infrastructure, promotion of regional extracurricular physical activity, as well as lessons about nutrition, media use and sleep. It lasted one school year. |
| Outcomes | Primary outcomes: BMI and aerobic fitness. Secondary outcomes: total and central body fat, motor abilities, physical activity and sleep duration, nutritional behaviour and food intake, media use, quality of life and signs of hyperactivity, attention and spatial working memory ability. |
| Starting date | |
| Contact information | Iris Niederer: [email protected] |
| Notes | NCT00674544 |
| Trial name or title | Healthy Youths, Healthy Communities; A community based obesity prevention study in secondary school students. |
| Methods | A 3‐year study in secondary school children of a multi‐strategy, community intervention promoting healthy eating and physical activity compared to no specific interventions on changes in body size and composition. |
| Participants | Inclusion criteria: Inclusion for measurement: male and female students in Forms 3‐6 in selected schools in intervention and comparison areas. Minimum age: 12 years, maximum age: 19 years. Inclusion Criteria of schools and community: sample size and ethnic composition, convenience and relevance of location. Exclusion criteria: Age of student (between 13 years to 19 years) Age minimum: 13 Years |
| Interventions | Interventions are multiple strategies over 3 years within secondary schools and the community to build the community's capacity to promote healthy eating and physical activity. Examples include school food policies, improving school food service, within school and after school physical activity programs, training of teachers, students and community leaders as coordinators, curriculum on healthy eating and physical activities, social marketing, incorporating programs into local government strategic plans. |
| Outcomes | Primary: Percent body fat Secondary: BMI measured by BMI z‐score. Prevalence of overweight and obesity assessed by waist circumference. Quality of life measured using the modified AQol tool. |
| Starting date | 2005 |
| Contact information | Graham Roberts: [email protected] |
| Notes | ACTRN12608000345381 |
| Trial name or title | Ma'alahi Youth Project; The effects of a community based intervention promoting healthy eating and physical activity in secondary school students on changes in body size and composition. |
| Methods | A 3‐year study in secondary school children of a multi‐strategy, community driven intervention promoting healthy eating and physical activity compared to no specific interventions on changes in body size and composition. |
| Participants | Inclusion criteria: Inclusion for measurement: male and female students in Forms 1‐6 in selected schools in intervention and comparison areas. Inclusion Criteria for schools and communities: Sample size of students and convenience and relevance of location. Exclusion criteria: Age of student (between 12 years to 19 years) Age minimum: 11 Years |
| Interventions | Interventions are multiple strategies over 3 years within the communities and selected schools to build the community's capacity to promote healthy eating and physical activity. The promotional strategies are implemented by the Obesity Prevention In Community (OPIC) Intervention Officers and National Health Promotion Officers from the Ministry of Health. Promotional materials used are social marketing (e.g. Billboards, radio programmes, Radio and TV spots), community based sports competition, leaflet distribution on importance / composition of healthy breakfast, helping in the set up of vegetable gardens through seedling distribution and implementing the National Canteen Guidelines in school canteens. Aerobics sessions and competitions are also promoted both in schools and village communities. |
| Outcomes | Primary: Percent body fatSecondary: BMI measured by BMI z‐score.Prevalence of overweight and obesity assessed by waist circumference.Quality of life measured using the modified AQol tool. |
| Starting date | 2005 |
| Contact information | Graham Roberts: [email protected] |
| Notes | ACTRN12608000346370 |
| Trial name or title | The Loozit Study |
| Methods | RCT with two arms. One arm receives the Loozit group weight management programme and the other arm received the same Loozit group weight management programme plus additional therapeutic contact. |
| Participants | Aim is to recruit 168 overweight and obese 13‐16 year olds in Sydney, Australia. Recruitment via schools, media coverage, health professionals and several community organisations. |
| Interventions | The group weight management programme consists of two phases. Phase 1 involved seven weekly group session held separately for adolescents and their parents. Phase 2 involves a further seven group sessions held regularly, for adolescents only, until two years follow‐up. Additional therapeutic contact is provided to one of the study groups approximately once per fortnight during phase 2 only. |
| Outcomes | Assessed at 2, 12, and 24 months. BMI z‐score, waist z‐score, metabolic profile indicators, physical activity, sedentary behaviour, eating patterns and psychosocial well being |
| Starting date | Recruitment began: May 2006. 24 month follow‐up to be completed by July 2011. |
| Contact information | Vanessa Shrewsbury: [email protected] |
| Notes |
| Trial name or title | It's Your Move! A community‐based obesity prevention study in secondary school children |
| Methods | A 3‐year study in secondary school children of a multi‐strategy, community intervention promoting healthy eating and physical activity compared to no specific interventions on changes in body size and composition |
| Participants | Inclusion criteria: Students in Years 7‐11 in selected schools in intervention and comparison areas. Exclusion criteria: Nil Age minimum: 12 Years |
| Interventions | Interventions are multiple strategies over 3 years within secondary schools and the community to build the community's capacity to promote healthy eating and physical activity. Examples include school food policies, improving school food service, within school and after school physical activity programs, training for coordinators and student ambassadors, curriculum on healthy eating and healthy bodies, activities around avoiding fad diets and creating body size acceptance, social marketing, incorporating programs into local government strategic plans. |
| Outcomes | Primary: percent body fat Secondary: BMI, BMI z‐score, prevalence of overweight and obesity, waist circumference, behavioural indicators of healthy eating and physical activity, quality of life, and knowledge indicators. |
| Starting date | 2005 |
| Contact information | Boyd Swinburn: [email protected] |
| Notes | ACTRN12607000257460 |
| Trial name or title | Romp & Chomp: A community‐based intervention programme to promote healthy eating and physical activity in under 5s in the City of Greater Geelong |
| Methods | A study in pre‐school children of multiple strategies to increase the community's capacity to promote healthy eating and physical activity compared to no specific interventions on the prevalence of overweight and obesity |
| Participants | Inclusion criteria: Inclusion for anthropometry: All children attending Maternal and Child Health (MCH) Key Age and Stages visits for 2 and 3.5 years Inclusion for behaviours: Parents attending MCH 2 and 3.5 year Age and Stage visits within the data collection time period. Inclusions for Settings audits: Kindergartens, long daycare, family daycare settings in the intervention and comparison areas. Exclusion criteria: Exclusion for anthropometry: participants with missing data and outlying data indicating data entry errors. Exclusions for audits: nil Age minimum: 2 Years |
| Interventions | Intervention: Multiple strategies over 3 years (2005‐2008) to increase community capacity to increase healthy eating and physical activity in pre‐school children. Examples of strategies include food policies in child care settings, active play programs, social marketing, promotion of water, training of early childhood professionals, and parent education. |
| Outcomes | Primary: Change in the prevalence of overweight and obesity calculated from measured height and weight from routinely collected anthropometry in 2 and 3.5 year olds. |
| Starting date | 2005 |
| Contact information | Boyd Swinburn: [email protected] |
| Notes | ACTRN12607000374460 |
| Trial name or title | Be active, eat right |
| Methods | Cluster RCT to assess a prevention protocol developed within Youth Health Care in 2005 |
| Participants | 5‐year‐old children included by 44 Youth Health Care teams randomised within 9 Municipal Health Services in The Netherlands. |
| Interventions | When a child in the intervention group is detected with overweight according to BMI cut‐offs, the prevention protocol is applied. According to the protocol, parents of overweight children are invited for up to three counselling session during which they receive personal advice about a healthy lifestyle, and are assisted with behavioural change. |
| Outcomes | Primary outcomes are BMI and waist circumference of the children. Parents complete questionnaires to assess secondary outcome measures: levels of overweight inducing/reducing behaviours, parenting styles/practices/attitudes, health‐related quality of life of children, possible adverse effects. Data collected at baseline, 12 and 24 months follow‐up. Process and cost‐effectiveness evaluation will also be conducted. |
| Starting date | |
| Contact information | Lydian Veldhuis: [email protected] |
| Notes | ISRCTN04965410 |
| Trial name or title | Fun 'n' healthy in Moreland |
| Methods | |
| Participants | Primary School Children in 24 Schools in Moreland, an inner city suburb of Melbourne, Australia |
| Interventions | Intervention is a facilitated approach to supporting school to implement an evidence based approach with interventions based on priorities within the school, ensuring focus on diet, physical activity and child health and well being. |
| Outcomes | BMI, child health and well being, |
| Starting date | 2004‐2010 |
| Contact information | http://www.mchs.org.au/ |
| Notes | Victorian Government Departments of Sport and Recreation and Human Services ACTRN12607000385448 |
| Trial name or title | Early intervention of multiple home visits to prevent childhood obesity in a disadvantaged population: a home‐based randomised controlled trial (Healthy Beginnings Trial) |
| Methods | |
| Participants | First time mothers who are 24 to 34 weeks pregnant. |
| Interventions | Comprises of eight home visits from a specially trained community nurse over two years and pro‐active telephone support between the visits. |
| Outcomes | a) duration of breastfeeding measured at 6‐12 months b) introduction of solids measured at 4 and 6 months c) nutrition, physical activity and television viewing measured at 24 months, and d) overweight/obesity status at age 2 and 5 years |
| Starting date | TBC |
| Contact information | Li Ming Wen: [email protected] |
| Notes |
| Trial name or title | Louisiana (LA) Health |
| Methods | Three treatment arms will be compared in a cluster RCT design. A fourth treatment arm will serve as a nonrandomised control condition. |
| Participants | 23 school systems in Louisiana, USA were invited to participate and students were recruited from participating schools. |
| Interventions | Primary Prevention: based on Social Learning Theory with an emphasis on modification of environmental cues, enhancement of social support and promotion of self‐efficacy for health behaviour change. Secondary Prevention: relies in intentional efforts to change behaviour as opposed to latering the environment to prompt behaviour change. Designed to increase healthy eating habits, increase physical activity and decrease sedentary behaviour. |
| Outcomes | Primary outcomes are BMI z‐scores and percentile. Secondary outcomes: successful weight gain prevention, body fat, food selections and food intake, physical activity, questionnaires to assess dietary social support, physical activity social support, mood, eating attitudes. |
| Starting date | |
| Contact information | Donald Williamson: [email protected] |
| Notes |
BMI: body mas index
BMIz: standatdised body mss index
FMS: Fundamental Movement Skills
RCT: randomised contorlled trial
Data and analyses
| Outcome or subgroup title | No. of studies | No. of participants | Statistical method | Effect size |
| 1 Standardised mean change in Body Mass Index (BMI/zBMI) from baseline to postintervention Show forest plot | 37 | 27946 | Std. Mean Difference (IV, Random, 95% CI) | ‐0.15 [‐0.21, ‐0.09] |
| Analysis 1.1  Comparison 1 Childhood obesity interventions versus control by age groups 0‐5, 6‐12 and 13‐18 years, Outcome 1 Standardised mean change in Body Mass Index (BMI/zBMI) from baseline to postintervention. | ||||
| 1.1 0‐5 years | 7 | 1815 | Std. Mean Difference (IV, Random, 95% CI) | ‐0.26 [‐0.53, 0.00] |
| 1.2 6‐12 years | 24 | 18983 | Std. Mean Difference (IV, Random, 95% CI) | ‐0.15 [‐0.23, ‐0.08] |
| 1.3 13‐18 years | 6 | 7148 | Std. Mean Difference (IV, Random, 95% CI) | ‐0.09 [‐0.20, 0.03] |
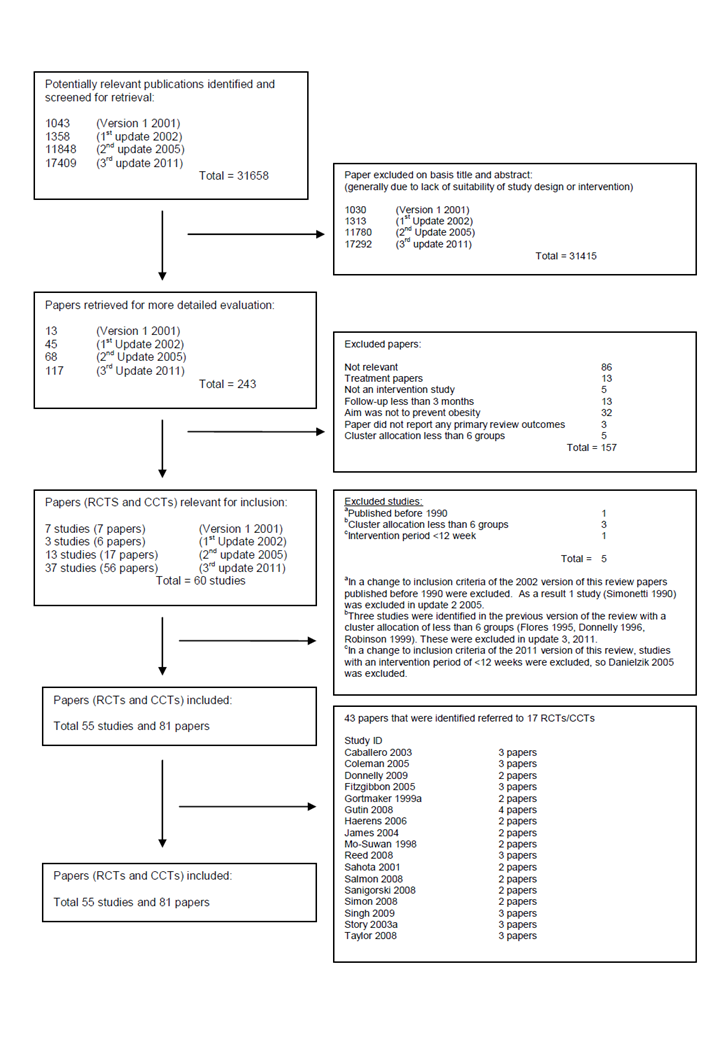
Quorom statement flow diagram ‐ Interventions for preventing obesity in children
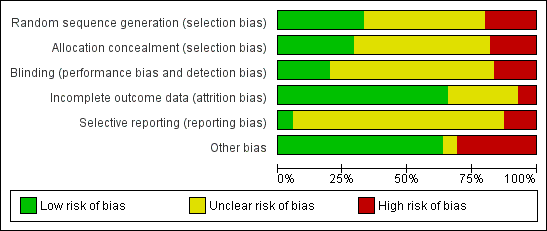
Risk of bias graph: review authors' judgements about each risk of bias item presented as percentages across all included studies.
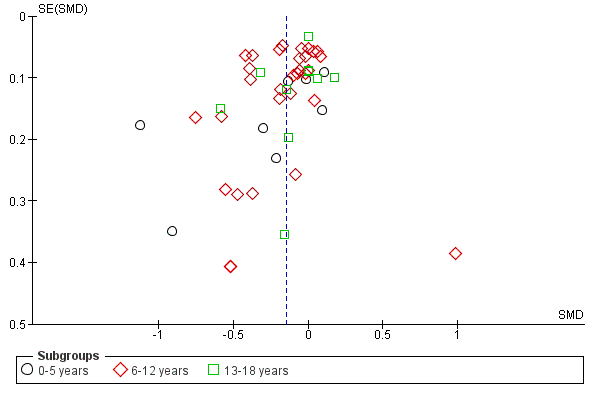
Funnel plot of comparison: 1 Childhood obesity interventions versus control by age groups 0‐5, 6‐12 and 13‐18 years, outcome: 1.1 Standardised mean change in Body Mass Index (BMI/zBMI) from baseline to post‐intervention.
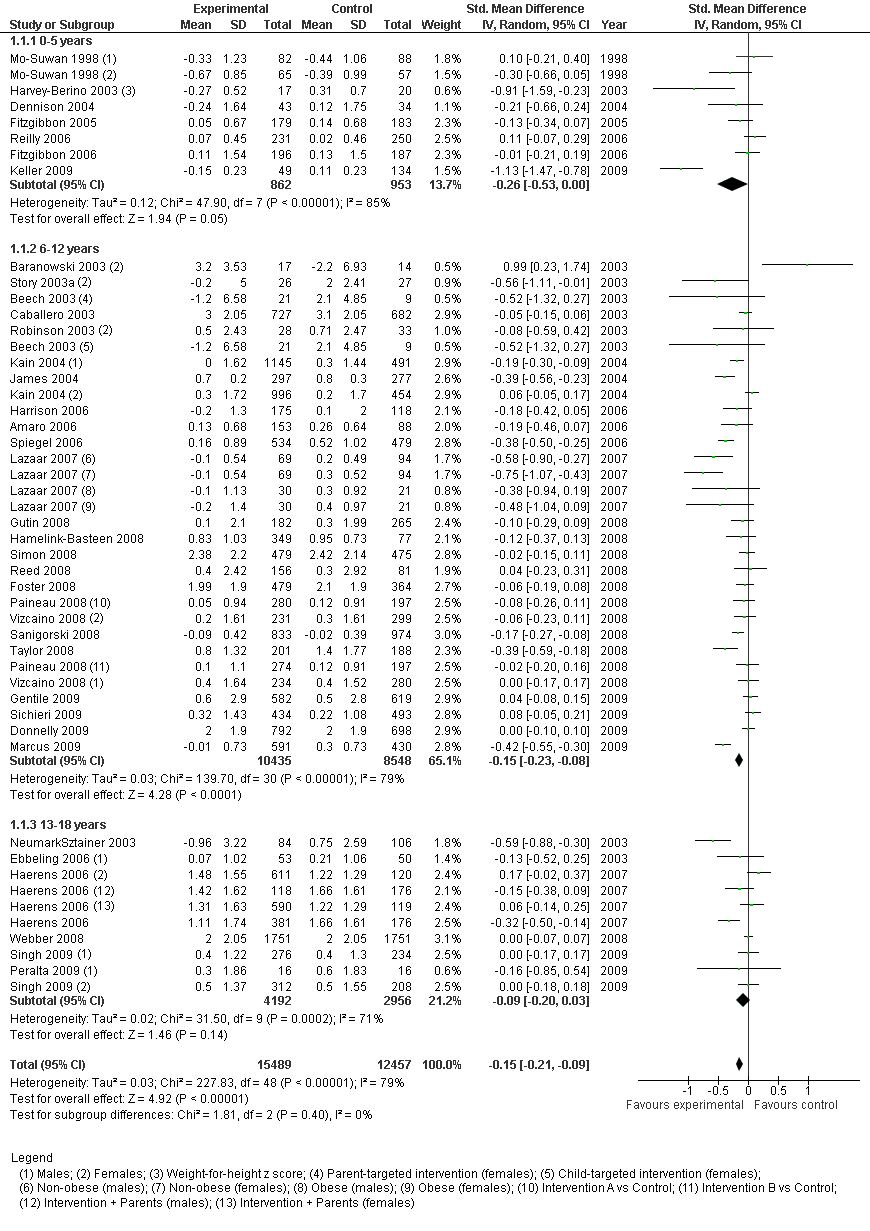
Forest plot of comparison: 1 Childhood obesity interventions versus control by age groups 0‐5, 6‐12 and 13‐18 years, outcome: 1.1 Standardised mean change in Body Mass Index (BMI/zBMI) from baseline to post intervention.
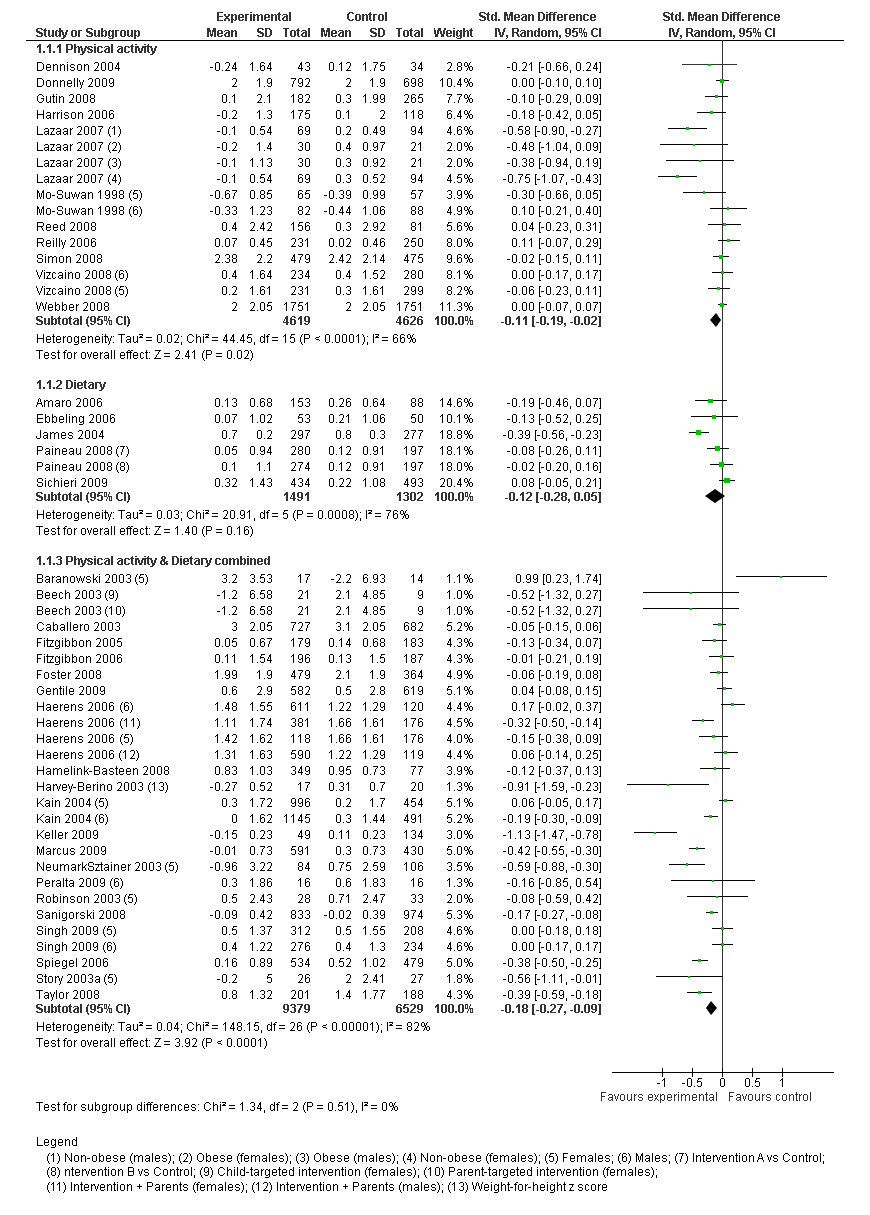
Forest plot of the standardised mean change in body mass index (BMI/zBMI) from baseline to post intervention for childhood obesity interventions versus control grouped by intervention type (physical activity, dietary, combined physical activity/dietary)
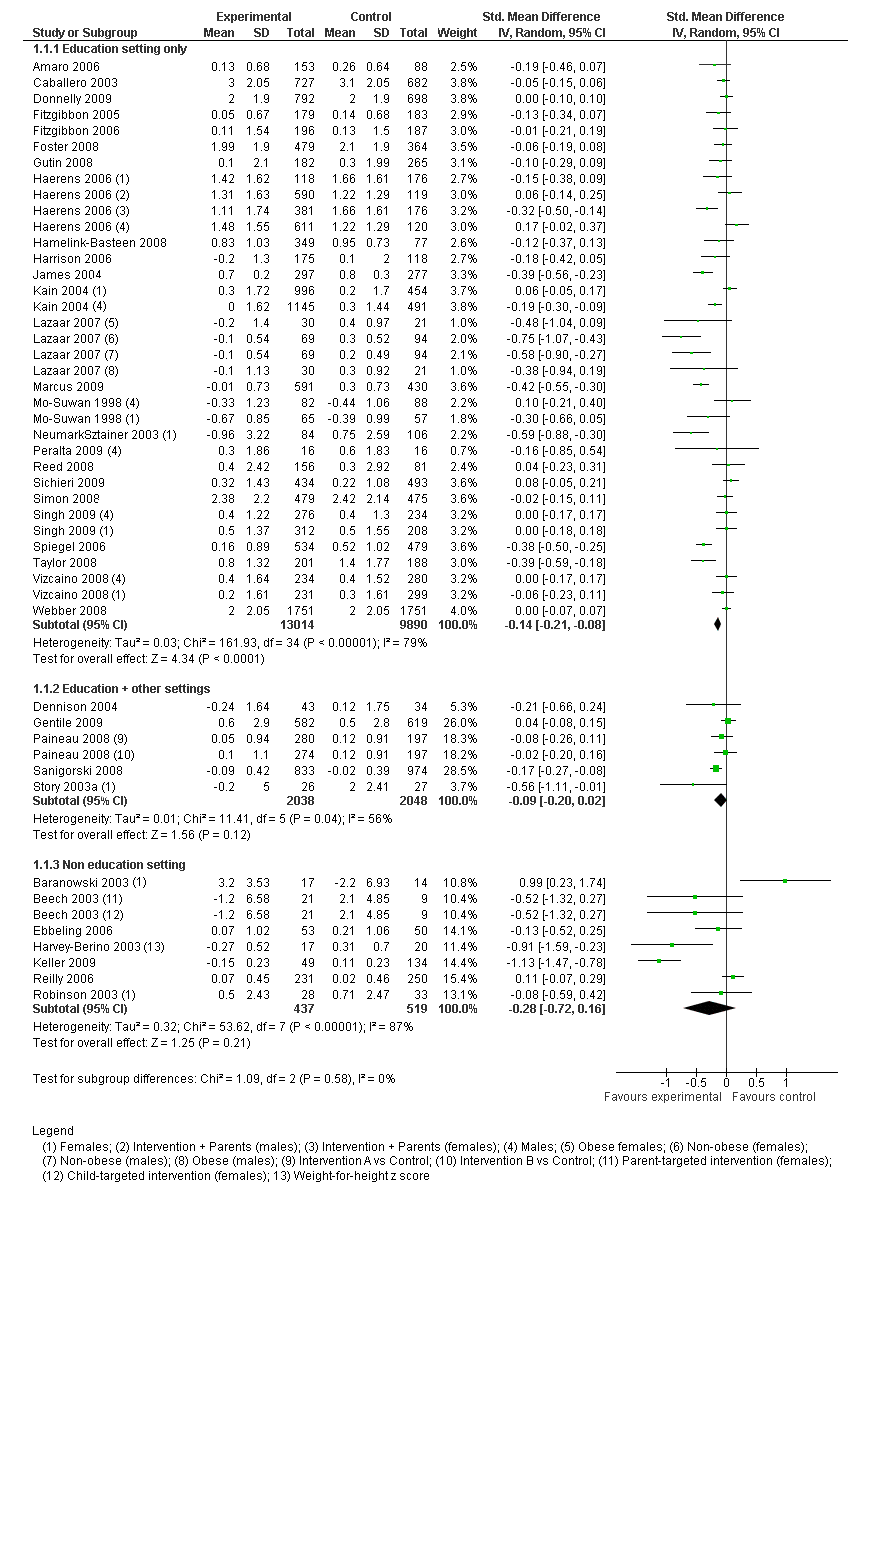
Forest plot of the standardised mean change in body mass index (BMI/zBMI) from baseline to post intervention for childhood obesity interventions versus control grouped by setting
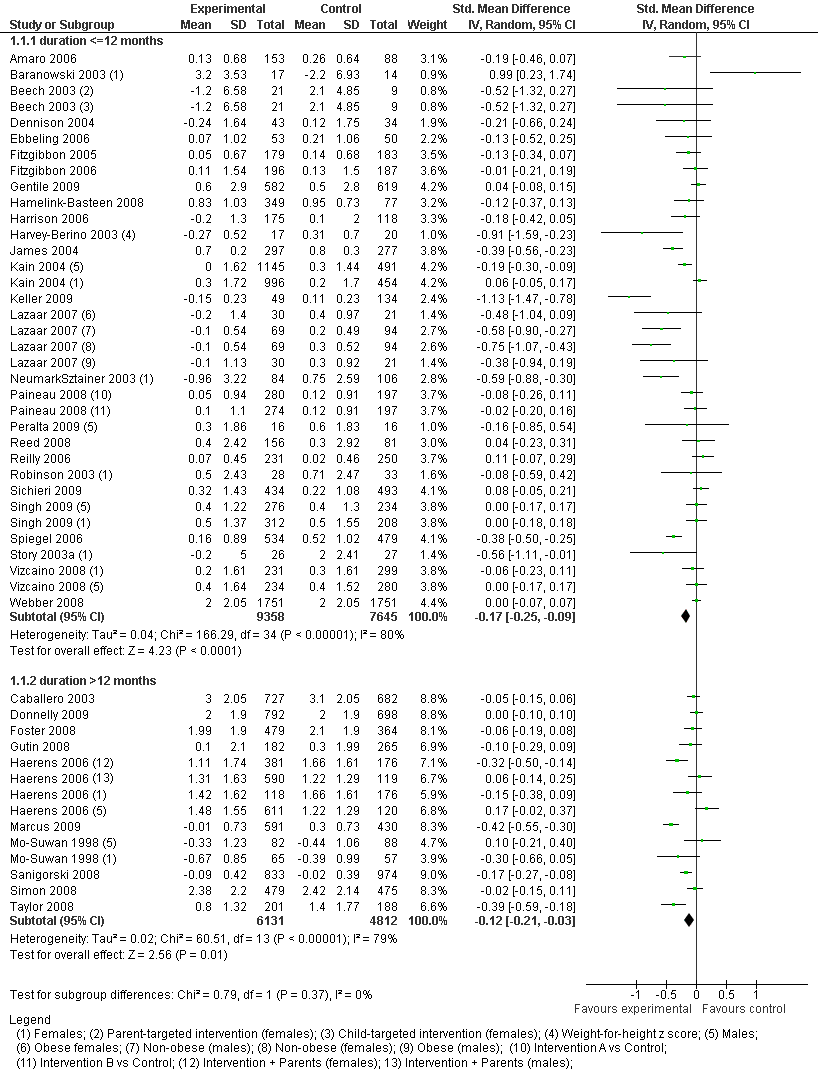
Forest plot of the standardised mean change in body mass index (BMI/zBMI) from baseline to post intervention for childhood obesity interventions versus control grouped by duration of intervention (short term and long term)
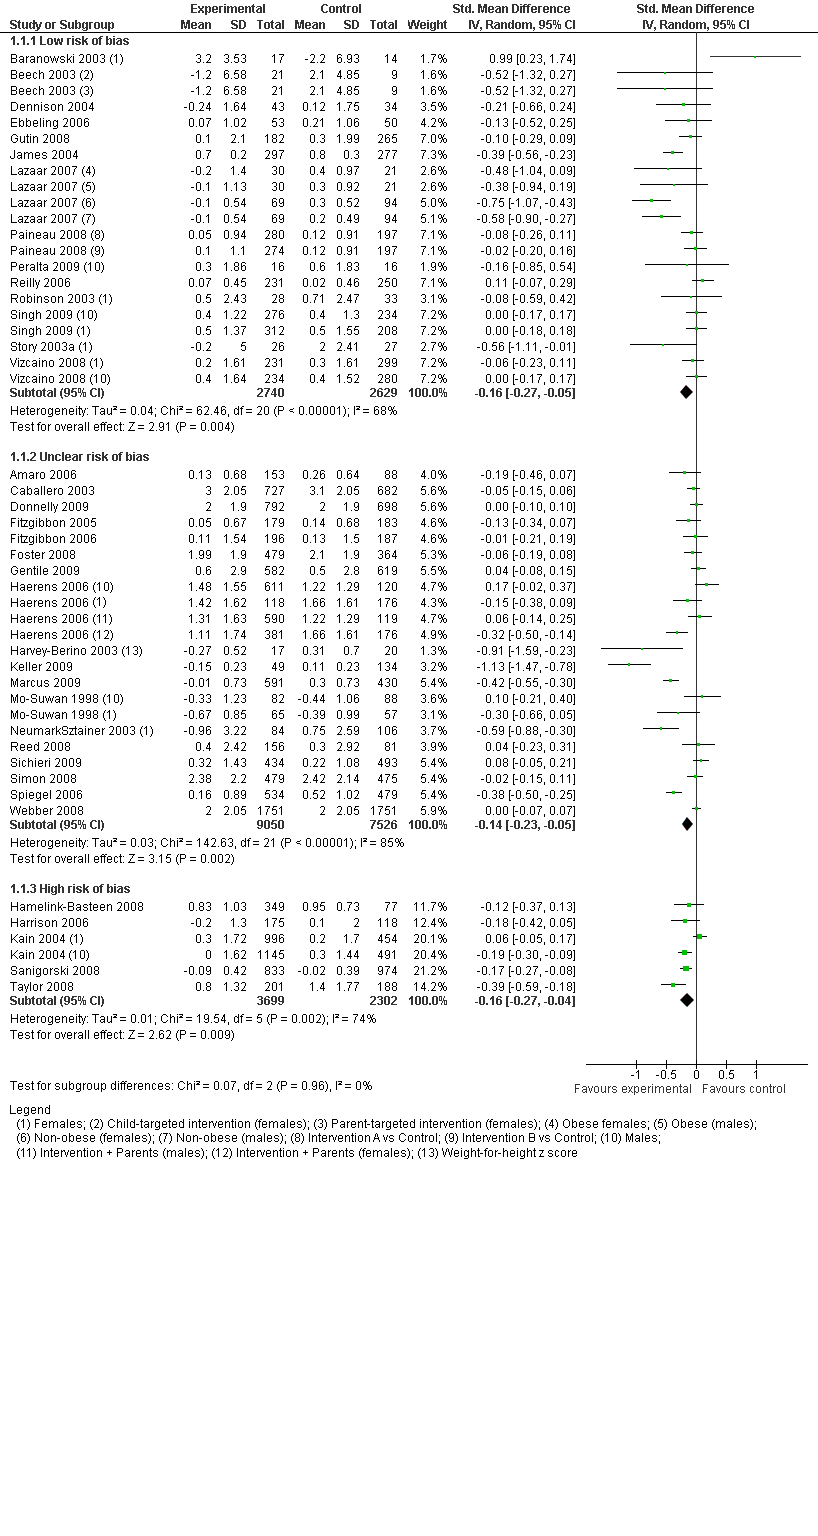
Forest plot of the standardised mean change in body mass index (BMI/zBMI) from baseline to post intervention for childhood obesity interventions versus control grouped by risk of bias based on randomisation (high risk=non‐randomised; unclear risk=method of randomisation or sequence generation unclear; low risk=randomisation occurred appropriately)
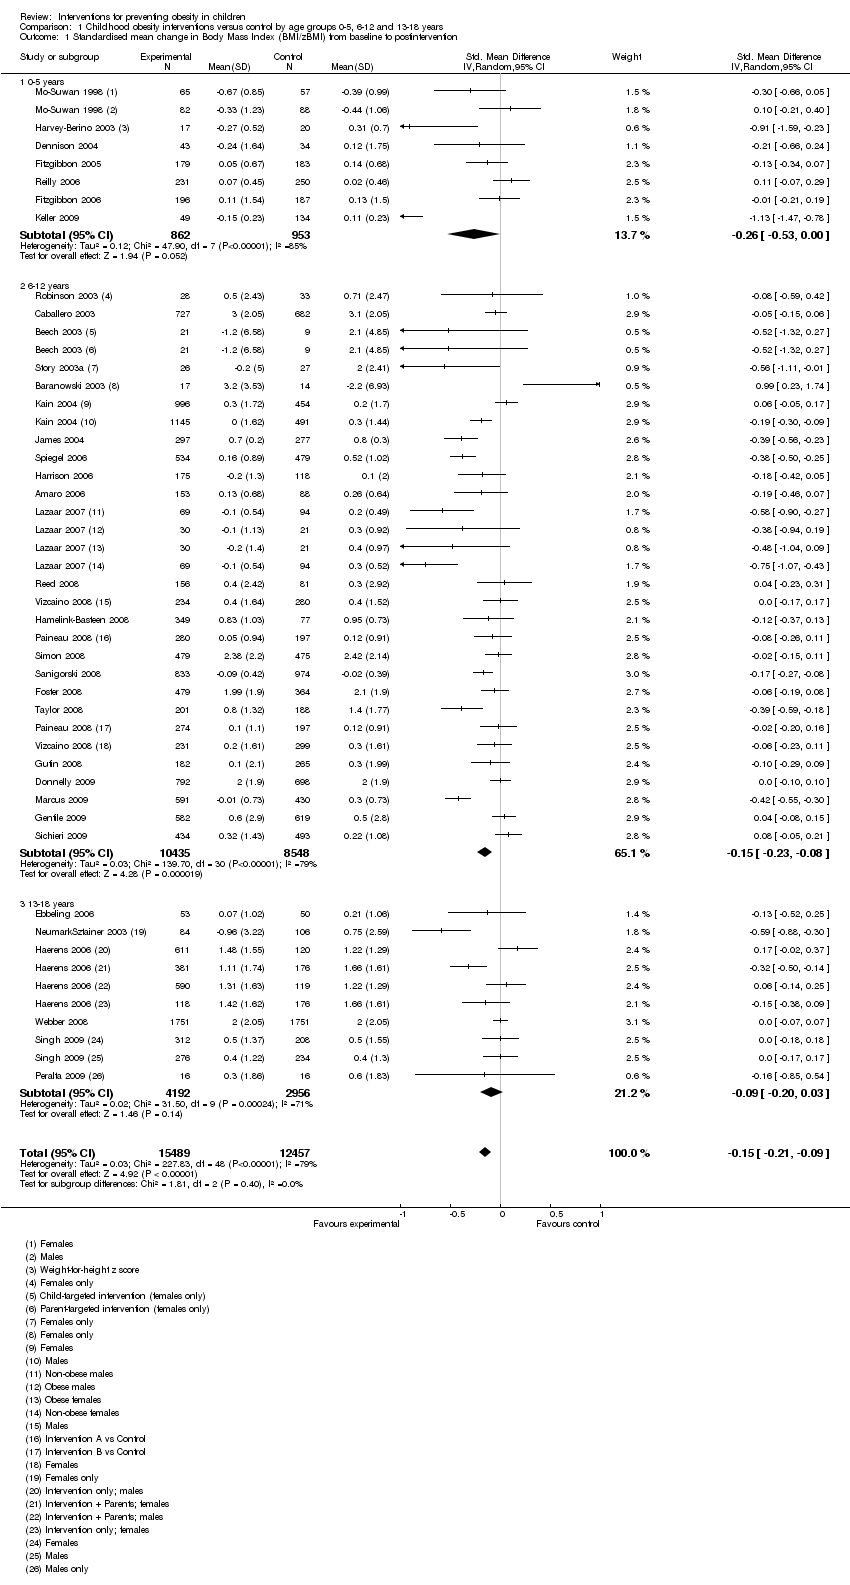
Comparison 1 Childhood obesity interventions versus control by age groups 0‐5, 6‐12 and 13‐18 years, Outcome 1 Standardised mean change in Body Mass Index (BMI/zBMI) from baseline to postintervention.
| Study | Type | Country | Guiding theoretical frameworks | Setting | Child age (at Baseline) | Intervention period | ||||||||
| Care | Education | Health Service | Community | Home | 0‐5 years | 6‐12 years | 13‐18 years | 12 weeks‐1 year | >1 year‐2 years | >2 years | ||||
| PA | USA | NR‐behaviour change | X | X | X | X | ||||||||
| Diet & PA combined | USA | SCT | X | X | X | |||||||||
| Diet & PA combined | USA | SCT | X | X | X | |||||||||
| Diet & PA combined | USA | NR‐behaviour change | X | X | X | |||||||||
| Diet & PA combined | France | NR‐behaviour change theory | X | X | X | X | ||||||||
| Diet & PA combined | Germany | NR‐behaviour change | X | X | X | X | ||||||||
| PA | Thailand | NR‐environmental change | X | X | X | |||||||||
| PA | Scotland | NR‐environmental change & behavioural | X | X | X | |||||||||
| Diet | Italy | NR | X | X | X | |||||||||
| Diet & PA combined | USA | SCT and family systems theory | X (summer camp) | X | X | X | ||||||||
| Diet & PA combined | USA | SCT and family systems theory | X | X | X | |||||||||
| Diet & PA combined | USA | Social learning theory & principles of American Indian culture and practice | X | X | X | |||||||||
| Diet & PA combined | USA | NR | X | X | X | |||||||||
| PA | USA | NR‐environmental model | X | X | X | |||||||||
| Diet | USA | NR | X | X | X | |||||||||
| Diet | Brazil | Learning through play | X | X | X | |||||||||
| Diet & PA combined | USA | Settings based, CDC guidelines to promote lifelong HE and PA | X | X | X | |||||||||
| Diet & PA combined | USA | Socio‐ecological theory | X | X | X | X | X | |||||||
| Diet & PA combined | USA | SCT | X | X | X | |||||||||
| PA | USA | Environmental change | X | X | X | |||||||||
| Diet & PA combined | Netherlands | NR | X | X | X | |||||||||
| PA | Ireland | SCT | X | X | X | |||||||||
| Diet | UK | NR | X | X | X | |||||||||
| Diet & PA combined | Chile | NR | X | X | X | |||||||||
| Diet & PA combined | UK | SCT & behavioural choice | X | X | X | |||||||||
| PA | France | NR | X | X | X | |||||||||
| PA | Mexico | NR | X | X | X | |||||||||
| Diet & PA combined | Sweden | NR | X | X | X | |||||||||
| Diet & PA combined | Germany | NR | X | X | X | X | ||||||||
| Diet | France | NR | X | X | X | X | ||||||||
| PA | Mexico | Behavioural | X | X | X | |||||||||
| PA | Canada | socio‐ecological model | X | X | X | |||||||||
| PA | USA | The Health Promotion Model and the Transtheoretical Model | X | X | X | X | ||||||||
| Diet & PA combined | USA | Social cognitive theory | X | X | X | |||||||||
| Diet & PA combined | USA | NR | X | X | X | |||||||||
| Diet & PA combined | UK | Multicomponent health promotion programme, based on the Health Promoting Schools concept | X | X | X | |||||||||
| PA | USA | Behaviour change and self‐management | X | X | X | |||||||||
| PA | Australia | SCT and behavioural choice theory | X | X | X | |||||||||
| Diet & PA combined | Australia | Socio‐ecological model | X | X | X | X | ||||||||
| Diet | Brazil | NR | X | X | X | |||||||||
| PA | France | Behaviour change and socio‐ecological model | X | X | X | |||||||||
| Diet & PA combined | USA | Theory of reasoned action, constructivism | X | X | X | |||||||||
| Diet & PA combined | USA | NR | X | X | X | |||||||||
| Diet & PA combined | USA | SCT, youth development, and resiliency | X | X | X | X | ||||||||
| Diet & PA combined | New Zealand | NR | X | X | X | |||||||||
| PA | Spain | NR | X | X | X | |||||||||
| Diet & PA combined | England | Social learning theory | X | X | X | X | ||||||||
| Diet | USA | NR | X | X | X | |||||||||
| Diet & PA combined | Belgium | Theory of planned behaviours & transtheoretical model | X | X | X | |||||||||
| Diet & PA combined | USA | SCT | X | X | X | |||||||||
| PA | USA | Socio‐ecological model & SCT | X | X | X | |||||||||
| Diet & PA combined | USA | Behavioural determinants model, SCT & transtheoretical model | X | X | X | |||||||||
| Diet & PA combined | Australia | SCT | X | X | X | |||||||||
| Diet and PA combined | Netherlands | Intervention mapping protocol, behaviour change & environmental | X | X | X | |||||||||
| PA | USA | Socio‐ecological framework | X | X | X | |||||||||
| TOTALS | 2 | 43 | 2 | 6 | 14 | 8 | 39 | 8 | 40 | 7 | 8 | |||
| Study ID | Primary Outcomes | Secondary Outcomes |
| 1. Fatness assessed by repeat measures of height and weight (and calculated BMI) at baseline and after 1 year (end of intervention): | 1. Computer games playing: | |
| MEASURES: BMI OUTCOMES: Immediately post‐intervention, changes in BMI and BMI z score were not significantly different between intervention and control children. Intervention children had significantly smaller increases in BMI compared with control children at 1‐year follow‐up (0.06 vs 0.59 kg/m2; difference ‐0.53 kg/m2 (95%CI: ‐0.91 to ‐0.14), P = 0.01), and at 2‐year follow‐up (0.54 vs 1.08 kg/m2; difference ‐0.54 kg/m2 (95% CI: ‐0.98 to ‐0.10), P = 0.02), with adjustment for baseline age and BMI. | MEASURES: dietary intake OUTCOMES: Reported intake of total fat and dietary fibre was similar between children in the control and intervention groups at all assessment points. Saturated fat intake was significantly lower in intervention children at Year 1 (P = 0.002) but not post‐intervention or at Year‐2 follow‐up. MEASURES: Physical activity OUTCOMES: No significant differences between groups in reported frequency and intensity of exercise. MEASURES: Television viewing OUTCOMES: No significant differences between groups in TV viewing at any assessment point. | |
| MEASURES: BMI OUTCOMES: Post‐intervention changes in BMI and BMI z score were not significantly different between intervention and control children | MEASURES: dietary intake OUTCOMES: Reported intake of total and saturated fat and dietary fibre was similar between children in the control and intervention groups at Year 2 follow‐up. MEASURES: Physical activity OUTCOMES: No significant differences between groups in reported frequency and intensity of exercise. MEASURES: Television viewing OUTCOMES: No significant differences between groups in TV viewing at any assessment point. | |
| 1. Maternal fatness assessed by repeat measures of height and weight (and calculated BMI) at baseline and end of pilot: | 1. Diet 3‐day food records: | |
| MEASURES: Weight, height OUTCOMES: Prevalence of overweight (BMI ≥ 90th percentile) 1 At end of study, 12.6% in EPIPOI‐1 group was overweight, 11.3% in EPIPOI‐2 group, and 17.8% in control (EPIPOI‐1 vs control P = 0.02; EPIPOI‐2 vs control P =0.003) 2 There was no difference between groups if the schools were not in underprivileged areas, however there was a significant intervention effect in school s in underprivileged areas At end of study, 12.2% in EPIPOI‐1 group was overweight, 17.0% in EPIPOI‐2 group, and 36.8% in control (EPIPOI‐1 vs control P <0.01; EPIPOI‐2 vs control P = 0.001) BMI z‐score 1 At end of study and among schools not in underprivileged areas, median change in BMI z‐score in EPIPOI‐1 group was +0.39, +0.22 in EPIPOI‐2 group, +0.41 in control (EPIPOI‐2 vs control P = 0.01) 3 At end of study and among schools in underprivileged areas, median change in BMI z‐score in EPIPOI‐1 group was +0.35, +0.50 in EPIPOI‐2 group, and +1.35 in control (EPIPOI‐1 vs control P < 0.001; EPIPOI‐2 vs control P < 0.001) | ||
| MEASURES: Height, Weight OUTCOMES: This study population stabilized their BMI SDS (P < 0.025). The children randomised in the intervention group who were not interested to participate, and the children of the control group increased their BMI SDS within the observation period of one year (P < 0.001, P = 0.002). MEASURES: Diet OUTCOMES: According to nutrition diaries a decrease energy intake of the participants of the intervention group was detected. The percentage of protein intake was particularly remarkable, amounting to 363% fulfilment of demand at the beginning of the study and 274% at the end. | ||
| 1. Fatness assessed by weight, height (BMI, WHCU weight (kg)/height cubed), and triceps skinfold thickness at baseline, twice during intervention and at 29.6 weeks (end of intervention). | None reported | |
| MEASURES: BMI OUTCOMES: No significant differences between intervention and control groups. | MEASURES: physical activity and sedentary behaviour by accelerometry OUTCOxMES: No significant differences between intervention and control groups. MEASURES: fundamental movement skills OUTCOMES: Children in the intervention group had significantly higher performance in movement skills tests than control children at 6 month follow‐up (i.e. immediately post‐intervention) after adjustment for sex and baseline performance. | |
| BMI: body mass index | ||
| Study ID | Primary Outcomes | Secondary Outcomes |
| MEASURES: Height, weight OUTCOMES: No significant difference in zBMI between treated group and control group at post‐assessment controlling for baseline values. Adjusted means were 0.345 (95% CI 0.299 to 0.390) for the intervention group and 0.405 (95% CI 0.345 to 0.465) for the control group. MEASURES: Nutrition knowledge OUTCOMES: Intervention group had significant increase in nutrition knowledge (P < 0.05) compared to control. Adjusted means were 11.24 (95%CI 10.68 to 11.80) for the intervention group and 9.24 (95% CI 8.50 to 9.98) for the control group. MEASURES: Dietary Intake OUTCOMES: Intervention group had significant increase in weekly vegetable intake (P < 0.01) compared with control. Adjusted mean number of servings per week was 3.7 (95% CI 3.5 to 4.1) for the intervention group and 2.8 (95% CI 2.4 to 3.3) for the control group. | MEASURES: Physical activity OUTCOMES: No significant difference between groups post‐intervention | |
| 1. Fatness assessed by repeat measures of height and weight (and calculated BMI) at baseline and end of pilot: | 1. Participation in summer camp | |
| 1. Fatness assessed by repeat measures of height and weight (and calculated BMI) at baseline and end of pilot: | 1. Psychological variables: | |
| 1. Fatness assessed by repeat measures of height and weight (and calculated BMI), at baseline and after 3 years (end of intervention): | 1. Lunch Programme: | |
| MEASURE: Risk of overweight and overweight OUTCOME: The rate of increase in the percentage of students at risk of overweight or overweight from 3rd to 5th grades was 13% in control girls compared with 2% in intervention girls and 9% in control boys compared with 1% in intervention boys. MEASURE: Anthropometry OUTCOME: No effect of intervention on height, weight, waist‐to‐hip ratio or BMI. All children had increases in these measures from year to year. MEASURE: Aerobic fitness OUTCOME: Results for passing Fitnessgram standards were similar between intervention and control schools for the 3rd grade. In the 4th grade, control schools had higher rates than intervention schools, while in the 5th grade, intervention schools had higher rates than control schools. | MEASURE: PE outcomes OUTCOME: For part of the 3rd and 4th grades, intervention schools had higher MVPA than control schools. By the end of the 4th grade, control schools had reached similar values to intervention schools, with a similar pattern for the 5th grade. Intervention schools has higher vigorous physical activity (VPA) than control schools in the fall of 4th grade and for both 5th grade semesters. MEASURE: Cafeteria outcomes OUTCOME: At the beginning and end of the 4th grade, intervention schools had a lower percentage of fat than control schools. This difference disappeared by the 5th grade. Intervention schools met programme goals for fat content in school lunches during the 2nd year of the programme, while control schools did not at any time. No schools reached programme sodium recommendations. | |
| MEASURES: BMI OUTCOMES: No significant differences for change in BMI or BMI percentile (baseline to 3 year) for intervention vs control (not influenced by gender). Schools (n = 9) with ≥ 75min of PAAC/wk showed significantly less increase in BMI at 3 years compared to schools (n = 5) with < 75min (1.8 ± 1.8 vs 2.4 ± 2.0; P = 0.02) | MEASURES: Daily PA (accelerometer) OUTCOMES: Over a 4‐day average (consecutive), children in PAAC schools had greater levels of PA (13%>) compared to children in control schools (P = 0.007). Children in PAAC schools had greater levels of PA during the school day (12%>; 0.01) and on weekends (17%>; 0.001) compared with children in control schools. Children in PAAC schools exhibited 27% higher levels of moderate to vigorous intensity PA (?4 METS) compared with children in control schools (P = 0.001). MEASURES: Academic achievement measured using Weschler Individual Achievement Test 2nd edition. OUTCOMES: significant improvement in academic achievement from baseline to 3 years were observed in the PAAC compared with the control schools for the composite, reading, math and spelling scores (all P < 0.01) | |
| 1. Fatness assessed by percentage of overweight (established by comparing the BMI of the subject with the relevant 50th BMI percentile based on the gender and age of the subject) at baseline and at one year (end of intervention). | ||
| MEASURES: Nutritional status defined on the basis of BMI for age and sex. OUTCOMES: No significant changes from baseline in the prevalence of overweight/obesity (BMI?85th percentile) were observed in either group (both p=1.0) with no difference between groups. The percentage of overweight/obese children increased from 21.8 to 23.6% in the intervention group and from 33.7 to 35.0% in the no‐intervention group (P > 0.05). | MEASURES: Frequency of eating foods (either 0‐1 day or 2‐3 days) prohibited by School Canteens Act by self‐report for two 3‐day dietary recalls OUTCOMES: The percentage of children who ate foods prohibited by the Act on 2‐3 days decreased in both intervention and control groups (not significant) MEASURES: Distribution of children eating certain foods on the two 3‐day dietary recalls OUTCOMES: In the control group, the percentage eating mass‐produced snacks increased (P = 0.008), while in the intervention group, this decreased (p=0.016). In both groups, there was a significant reduction in the intake of artificial juice (P < 0.001) and chocolate (I: P < 0.001; C: P = 0.031). There was an increase in the percentage of children drinking soda in both intervention and control groups (P = 0.002 and P = 0.016). For the percentage of children eating yoghurt, there was an increase in the intervention group (P = 0.016) and a decrease in the control group (P = 0.016). There was a decrease in the percentage of children drinking natural juice in the control group (P < 0.001) and a numerical increase in the intervention group (P = 0.063). There was an increase in the percentage of children eating fruit in both groups, but this was only significant in the control group (P = 0.016 vs P = 0.25). | |
| MEASURES: Incidence of overweight and obesity OUTCOMES: Fewer children in the intervention schools (7.5% [unadjusted mean]) than in the control schools (14.9% [unadjusted mean]) became overweight after 2 years (adjusted odds ratio: 0.67 [0.47 to 0.96]; P = 0.03 [adjusted for gender, race/ethnicity and age]). No differences between control and intervention groups in the incidence of obesity at 2 years (P = 0.99). The predicted odds of incidence of either overweight or obesity were 15% lower for the intervention group (odds ratio: 0.85 [0.74 to 0.99]; P <0.05) | MEASURES: Prevalence and remission of overweight and obesity OUTCOMES: After 2 years, the predicted odds of overweight prevalence were 35% lower for in the intervention group (odds ratio: 0.65 [0.54 to 0.79]; P < 0.0001 [adjusted for gender, race/ethnicity, age]). Effect was slightly greater in black students who, if receiving the intervention, were 41% less likely to be overweight than those in control schools after 2 years (after controlling for gender, age and baseline prevalence). No differences between intervention and control groups in the prevalence of obesity after 2 years (P = 0.48). No difference between intervention and control groups for combined prevalence of overweight and obesity (P = 0.07). No differences between groups with respect to the remission of overweight or obese after 2 years. MEASURES: Dietary intake and physical activity sedentary behaviours, potential adverse effects OUTCOMES: Reported decreases in both intervention and control schools in self‐reported consumption of energy, fat, and fruits and vegetables over 2 years with no differences between groups. Decreases in self‐reported amounts of physical activity in both intervention and control groups with no differences between groups. MEASURES: Sedentary behaviours OUTCOMES: Inactivity was 4% lower after 2 years in the intervention group compared with the control group after adjusting for gender, age, race/ethnicity and baseline inactivity (odds ratio: 0.96 [0.94 to 0.99]; P < 0.01). Weekday television watching was 5% lower in the intervention group than in the control group (odds ratio: 0.95 [0.93 to 0.97]; P < 0.0001) after 2 years. MEASURES: Potential adverse effects OUTCOMES: The intervention showed no evidence of an adverse impact with respect to a worsening body image or changes in incidence, prevalence and remission of underweight. | |
| MEASURES: Height and Weight OUTCOMES: No significant difference in BMI between groups post‐intervention or at 6 months follow‐up MEASURES: Screen time OUTCOMES: Child report (hours/week): No significant difference between groups post‐intervention or at 6 months follow‐up Parent report (hours/week) Significantly lower in intervention group post‐intervention (I: 22.8(0.7), C: 24.6(0.3), P <0.05) and at 6 months follow‐up (I: 23.7(0.5), C: 25.7(0.5), P <0.05) ) compared with control group MEASURES: Fruit and vegetable consumption OUTCOMES: Child report (servings/week): Significantly lower in intervention group post‐intervention (I: 4.4(0.2), C: 4.2(0.1), P < 0.05) and at 6 months follow‐up (I: 4.1(0.2), C: 4.0(0.1), P < 0.05) compared with control group Parent report (servings/week) Significantly lower in intervention group post‐intervention (I: 24.9(0.7), C: 22.6(0.4), P < 0.05) and at 6 months follow‐up (I: 22.5(0.7), C: 21.3(0.3), P < 0.05) ) compared with control group MEASURES: Physical activity (steps/day) OUTCOMES: No significant difference on pedometer measures of physical activity | ||
| 1. Fatness assessed by repeat measures of height, weight, (and calculated BMI), and triceps skinfold thickness, at baseline and after 18 months (end of intervention) : Reestimated regressions that excluded observations with missing data and got similar results with both approaches. | 1. Television viewing time: | |
| (see Notes in Included Studies table) | MEASURES: Percent body fat (%BF) OUTCOMES: 1 year: %BF decreased in intervention participants with no change in control participants (adjusted change: ‐0.76 [‐1.42, ‐0.09]; P = 0.027). No significant differences between groups for ITT analysis. Significant relationship between level of programme attendance and change in %BF in intervention group, with greater decreases in %BF observed with higher programme attendance (P = 0.0004). 3 year: Significant group by time interaction (P < 0.05). Intervention group reduced their body fat during school months and this returned to levels similar to those of the control group after the summer months (school vacation). | MEASURES: Bone Mineral Density (BMD) OUTCOMES: 1 year: Compared with control, intervention participants showed significantly greater gains in BMD (adjusted change: 0.008 [0.001, 0.015]; P = 0.023). In intervention group greater increases in BMD were observed with higher programme attendance (P = 0.029). 3 year: Significant group by time interaction in favour of intervention participants (P < 0.01). MEASURES: Fat mass OUTCOMES: 1 year: No significant differences between groups post‐intervention. In intervention group greater decreases in fat mass were observed with higher programme attendance (P = 0.0004). 3 year: No significant differences between groups post‐intervention (data not reported). MEASURES: Fat‐free soft tissue (FFST) OUTCOMES: 1 year: No significant differences between groups post‐intervention. 3 year: Significant group by time interaction in favour of intervention participants (P < 0.01). MEASURES: cardiovascular fitness (CVF) OUTCOMES: 1 year: Compared with control, intervention participants showed significantly greater gains in CVF (adjusted change: ‐4.4 [‐8.2 to ‐0.6]; P = 0.025). In intervention group greater increases in CVF were observed with higher programme attendance (P = 0.029). 3 year: Significant group by time interactions in favour of intervention participants (P < 0.01). The intervention group improved in fitness during school months and this returned to levels similar to those of the control group after the summer months. MEASURES: BMI OUTCOMES: 1 year: No significant differences between groups post‐intervention. 3 year: Significant group by time interaction, with the increase in BMI being greater in the intervention group than in the control group (P < 0.05). MEASURES: waist circumference OUTCOMES: 1 year: No significant differences between groups post‐intervention. MEASURES: CV risk factors OUTCOMES: 1 year: No significant differences between groups post‐intervention. |
| MEASURES: Height, weight OUTCOMES: BMI increase did not differ between groups post‐intervention MEASURES: Obesity OUTCOMES: Prevalence of obesity did not differ between groups post‐intervention | MEASURES: Nutrition knowledge OUTCOMES: Higher level of knowledge about importance of vegetables and fruit and a healthy diet MEASURES: Lifestyle and behaviours OUTCOMES: Intervention group walked more frequently to school, watched less television, drank less soft drinks and ate less sweets than control group. | |
| MEASURES: Height, weight OUTCOMES: No significant difference between groups post‐intervention MEASURES: Physical activity OUTCOMES: MVPA in 30 min blocks was significantly higher (by 0.84 blocks; 95%CI 0.11, 1.57) in the intervention group post‐intervention (P = 0.03) MEASURES: Screen time OUTCOMES: No significant difference between groups post‐intervention MEASURES: Physical activity self‐efficacy OUTCOMES: Significantly higher self efficacy (by 0.86 units; 95%CI: 0.16, 1.56) post‐intervention (P = 0.03) MEASURES: Aerobic fitness (20m shuttle test) OUTCOMES: No significant difference between groups post‐intervention | ||
| MEASURE: BMI at 1 year (end of intervention) and 3 years post‐baseline (or 2‐year follow‐up) MEASURE: Proportion of children overweight or obese at 1 year (end of intervention) and 3 years post‐baseline (or 2‐year follow‐up), based on proportion above 91st centile | MEASURE: Carbonated drink consumption at 1 year (end of intervention): | |
| Fatness assessed by repeat measures of height and weight (and calculated BMI) at baseline and after 1 year (end of intervention): | 1. Dietary assessment: food frequency questionnaire of 16 key items: | |
| MEASURES: Time spent doing screen‐based activities OUTCOMES: No statistically significant differences between intervention and control groups. | MEASURES: BMI OUTCOMES: No statistically significant differences between intervention and control groups. MEASURES: Obesity (BMI > 95th percentile) OUTCOMES: No statistically significant differences between intervention and control groups. However, subgroup analysis by gender showed that the odds of being overweight post‐intervention were higher in females (1.52; 95%CI: 0.37 to 6.25) than males (0.28; 95% CI: 0.06 to 1.33) MEASURES: Walks/cycles to and from school OUTCOMES: No statistically significant differences between intervention and control groups. | |
| MEASURES: Obesity status OUTCOMES: A larger proportion of obese children (BMI > 97th percentile) became overweight (90th <BMI <97th percentile) in the intervention group compared with control (16.3%, P < 0.05 versus 9.3%, P < 0.05). The proportion of non obese children becoming obese or overweight was greater in controls than in the intervention group (14.8%, P < 0.05 versus 2.6%, P= ns) MEASURES OUTCOMES | MEASURES: BMI OUTCOMES: Average BMI remained unchanged over time in both groups overall. In girls, there was a significant group*time interaction (P < 0.01) and a significant effect of PA intervention between intervention and control in obese (‐1.4% vs 0.9%; P < 0.05) and non obese (‐0.2% vs 2.1%; P < 0.001) girls. MEASURES: BMI z‐score OUTCOMES: In boys, BMI z‐score declined significantly over time only in the intervention group and was significantly different compared with controls (P < 0.001). In boys, there was also a significant difference between intervention and control groups in both obese (‐2.8% vs 1.5%; P < 0.05) and non obese boys (‐2.4% vs 2.6%; P < 0.01). In girls, BMI z‐score declined significantly in all groups except for obese controls. The decrease was higher in the intervention groups compared with control groups for both obese (‐6.8% vs ‐2.4%; P < 0.001) and non obese (‐3.1% vs ‐1.8%; P < 0.01) girls. Changes were greater in obese compared with non obese girls (P < 0.001). MEASURES: Waist circumference OUTCOMES: In girls, waist circumference was affected over time, decreasing in the intervention group and increasing in the control group (‐3.3% vs 2.8%; P < 0.001). In boys, waist circumference was not significantly affected over time. MEASURES: Skinfold thickness OUTCOMES: In girls, the sum of skinfolds was significantly decreased over time in the intervention groups in both obese (‐4.4%, P < 0.05) and non obese (‐3.2%, P < 0.001) girls, with a significant difference between obese and non obese girls (P < 0.05) and no significant changes in controls. In boys, the sum of skinfolds was not significantly altered over time. MEASURES: Fat‐free mass OUTCOMES: In girls, fat‐free mass increased over time, with greater increases in intervention children compared with controls for both obese (5.2% vs 2.4%, P < 0.001) and non obese (4.0% vs 0.6%, P < 0.05) girls. In boys, fat‐free mass improved over time with higher changes in the intervention groups (obese = 6.4%, P < 0.001 and non obese = 3.4%, P < 0.001) compared with control groups (obese = 1.3%, P = ns and non obese = 0.7%, P = ns), and a higher increases in obese boys compared with non obese boys (P < 0.01) | |
| MEASURES: Anthropometric measurements: height, weight, BMI, waist circumference, triceps skinfold OUTCOMES: Differences between groups post‐intervention were not tested MEASURES: Glucose, triglycerides, cholesterol, HDL‐C, LDL‐C, HOMA‐IR OUTCOMES: Intervention group decreased insulin (P < 0.001) and HOMA index (4.36 vs. 2.39, P <0.001) from baseline to follow‐up, but no difference in control group. No other differences were reported. Differences between groups post‐intervention were not tested
MEASURES: Physical activity (steps/day, by pedometer) OUTCOMES: Intervention group increased their median daily steps from baseline to follow‐up (15,329 to 19,910). Differences between groups post‐intervention were not tested | MEASURES: Food intake OUTCOMES: Not reported | |
| MEASURES: Height and weight OUTCOMES: Prevalence of overweight/obesity decreased by 3.2% (from 20.3 to 17.1) in intervention schools compared with an increase of 2.8% (from 16.1 to 18.9) in control schools (P < 0.05). No difference between intervention and control groups in change in zBMI (BMIsds) post‐intervention A larger proportion of the children who were initially overweight reached normal weight in the intervention group (14%) compared with the control group (7.5%), P < 0.017 | MEASURES: Physical activity measured by accelerometry OUTCOMES: No significant differences between groups post‐intervention MEASUREs: Eating habits at home measured by parental report. OUTCOMES: Post‐intervention eating habits at home were healthier among intervention families. Significant differences between children in intervention and control schools were found for high‐fat dairy products (P < 0.001), sweetened cereals (P<0.02) and sweet products (P < 0.002). MEASURES: Eating disorders measured by self‐report. OUTCOMES: No significant differences between groups post‐intervention | |
| 1. Fatness assessed by repeat measures of height and weight. | 1. Nutrition knowledge | |
| MEASURES: Nutritional intake OUTCOMES: Compared with controls, participants in the intervention groups achieved their nutritional targets for fat intake and for sugar and complex carbohydrate intake, leading to a decrease in energy intake (children, P<0.001; parents, P = 0.02). MEASURES: height and weight OUTCOMES: No significant differences were found between groups in BMI or zBMI, with a trend toward negative changes in zBMI in all 3 groups. BMI differed in parents (group A, +0.13, 95% CI, ?0.01, 0.27; group B, ?0.02, 95% CI, ?0.14, 0.11; control group,+ 0.24, 95% CI, 0.13, 0.34; P =.001), with a significant difference between group B and the control group (P = 0.01) | MEASURES: Physical activity OUTCOMES: In children, changes in physical activity throughout the study did not differ between groups, either for daily screen viewing or for activities in clubs MEASURES: Food‐related quality of life OUTCOMES: In parents, food‐related quality of life did not change differently between groups throughout the study | |
| 1. Fatness assessed by repeat measures of height and weight (and calculated BMI) at baseline and end of pilot: | None reported. | |
| MEASURES: Cardiovascular fitness (measured by 20‐m shuttle run test) OUTCOMES: The intervention group demonstrated a significantly greater increase (20%) in fitness (20‐m shuttle run) compared with the control group (P <0.05). MEASURES: Blood pressure (systolic and diastolic) OUTCOMES: Systolic blood pressure in the intervention group decreased significantly compared with an increase in the control group (5.7% smaller increase; P < 0.05). There was no difference for change in diastolic blood pressure. | MEASURES: Total cholesterol, HDL, LDL, Apo B, C‐reactive protein and fibrinogen OUTCOMES: Although all serum variables in the intervention group decreased more than these same variables for the control group changes failed to reach significance MEASURES: Weight, height OUTCOMES: BMI not different between groups post‐intervention | |
| MEASURES: Physical activity variables (frequency, intensity, duration, and readiness) OUTCOMES: No significant differences between groups MEASURES: Physical activity determinants (interpersonal influences, physical activity enjoyment, self efficacy, and perceived benefits and barriers of physical activity) OUTCOMES: The intervention group had significantly greater social support across time (P = 0.019). No other significant differences between groups. No other significant differences between groups | ||
| 1. Fatness assessed by repeat measures of height and weight (and calculated BMI) at baseline and end of pilot: | 1. TV usage: TV, videotape and video games: | |
| MEASURES: Steps per day OUTCOMES: Steps per day increased in all members of intervention families but not in any members of the control families. Intervention target girls/boys, mums and dads, all took significantly more steps per day on average than their control counterparts (P < 0.05). Increases in steps/day over baseline in intervention groups approached the primary goal of the intervention (an additional 2000 steps/day) MEASURES: cereal consumption OUTCOMES: Intervention families consumed approximately 1 serving of cereal/day, double the amount consumed by control families (P < 0.05) MEASURES: Food Intake OUTCOMES: No significant changes in self‐reported total energy intake or in intake of any macronutrient in either group. MEASURES: Body weight/adiposity OUTCOMES: Significant between‐group differences (P < 0.05) were found pre‐ to post‐study in the difference in the mean change of all body weight/adiposity measures of primary importance for overweight target children (%BMI‐for‐age, % body fat) and their parents (weight, BMI and % body fat). All trends were in favour of the intervention group. When analysed by gender, significant between‐group differences were found in the difference in the mean change of both the child‐ and adult‐specific body weight/adiposity measures between intervention and control for target girls and mums, but not for target boys and dads. | ||
| 1. Fatness assessed by repeat measures of height and weight (and calculated BMI) at baseline and after 1 year (end of intervention) OUTCOME: No differences between groups overall (weighted mean difference between intervention and control of 0 (95% CI: ‐0.1 to 0.1) overall, or when analysed by weight status for overweight (WMD: ‐0.07, 95% CI ‐0.22 to 0.08) or obese (WMD: ‐0.05; 95% CI: ‐0.22 to 0.11) children separately. 2. Dietary intake: OUTCOME: Vegetable consumption by 24 hour recall was higher in children in the intervention group than the control group (weighted mean difference 0.3 portions/day, 95% CI 0.2 to 0.4). Fruit consumption was lower in obese children in the intervention group ( ‐ 1.0, ‐ 1.8 to ‐ 0.2) than those in the control group. The three‐day diary showed higher consumption of high sugar foods (0.8, 0.1 to 1.6)) among overweight children in the intervention group than the control 3. Physical activity: OUTCOME: Sedentary behaviour was higher in overweight children in the intervention group (0.3, 0.0 to 0.7). 4. Psychological measures: OUTCOME: small increase in global self‐worth for obese children in the intervention schools. | 1. Nutrition knowledge:OUTCOME: Focus groups indicated higher levels of self‐reported behaviour change, understanding and knowledge. | |
| 1. Fatness assessed by weight, height, BMI, calf and triceps skinfold at baseline and 6, 12, 18 months. | None reported | |
| MEASURES: BMI OUTCOMES: Significant reduction in BMI post‐intervention in the BM/FMS group compared with control (average ‐1.88 BMI units less than control; P < 0.01). This was maintained at 6 and 12 month follow‐up. MEASURES: Weight status OUTCOMES: On average, those in the BM/FMS group were over 60% less likely to be overweight or obese compared with control (P < 0.05). This was maintained at 6 and 12 month follow‐up. | MEASURES: Physical activity (accelerometer) OUTCOMES: Compared with controls, FMS group children recorded higher levels and greater enjoyment of PA; and BM children MEASURES: Self‐reported screen behaviours OUTCOMES: Children in the BM group reported 229 min/week more in TV viewing on overage over time compared with control (P < 0.05). These effects were maintained with inclusion of 6 and 12 month follow‐up data. MEASURES: Self‐reported enjoyment of physical activity (five‐point Likert scale) OUTCOMES: Children in the FMS group reported higher average enjoyment scores over time compared with those in the control group (P < 0.05). MEASURES: Mastery of fundamental movement skills OUTCOMES: No significant intervention effects on FMS z‐scores between baseline and any of the post‐intervention time points. In girls, there was a significant effect, with those in the BM (P < 0.05) and FMS (P < 0.01) groups recording higher average FMS z‐scores compared with those in the control group. MEASURES: Body Image (five‐point Likert scale) OUTCOMES: No effects on children’s happiness with their body shape and body weight, or eating to gain weight or lose weight in the last month. When stratified by gender, boys in the FMS group (P = 0.003) and BM/FMS group (P = 0.014) recorded significantly higher satisfaction with their body shape between baseline and all post‐intervention time points compared with control. | |
| MEASURES: Body weight OUTCOMES: Children in intervention population gained less weight than in the comparison population (‐0.92kg [‐1.74 to ‐0.11], P = 0.03). MEASURES: Waist circumference OUTCOMES: Children in intervention population showed lower increases in waist circumference than in the comparison population (‐3.14cm [‐5.07 to ‐1.22], P = 0.01). MEASURES: BMI‐z score OUTCOMES: Children in intervention population showed lower increases in BMI‐z score than in the comparison population (‐0.11 [‐0.21 to ‐0.01], P = 0.04). MEASURES: Relationship between baseline indicators of children’s household SES and changes in children’s anthropometry. OUTCOMES: In the comparison population, lower SES was associated with a greater weight gain (statistically significant relationship in 19 of 20 analyses). In the intervention population, no statistically significant relationships were observed. | MEASURES: BMI OUTCOMES: No significant difference between intervention and comparison populations (P = 0.20). MEASURES: waist/height ratio OUTCOMES: Children in intervention population showed lower increases in waist/height ratio than in the comparison population (‐0.02 [‐0.03, ‐0.004], P = 0.01). MEASURES: Prevalence and incidence of ow/ob OUTCOMES: Prevalence of overweight/obesity increased in both groups, and the incidence of overweight/obesity was not significantly different between groups. | |
| MEASURES: change in BMI OUTCOMES: BMI and weight increased in both groups with no statistically significant differences between groups. Among students overweight at baseline, the intervention group showed greater BMI reduction and this difference was statistically significant among girls (P = 0.009). MEASURES: carbonated SSB and juice intake OUTCOMES: Mean intake of sodas per class was reduced in both groups, with reduction being about four times greater in the intervention compared with the control group (‐69ml vs ‐13ml). Carbonated beverage intake was significantly reduced in the intervention group compared with the control group (p=0.03), but fruit juice consumption was slightly increased in the intervention group (P = 0.08). | MEASURES: overweight and obesity OUTCOMES: For both groups, obesity changed from about 4 to 4.5% with no statistically significant difference between groups. | |
| MEASURES: BMI OUTCOMES: intervention students showed a lower increase in BMI (P = 0.01) over time than control students. The differences across groups of the adjusted (by baseline weight status) BMI changes were ‐0.33 (‐0.55 to ‐0.12) at 3 years and ‐0.36 (‐0.60 to ‐0.11) at 4 years. Cumulative incidence of overweight was lower in the intervention group than in the control group (4.2% vs 9.8% at 4 years; P < 0.01). Sensitvity analyses conducted using intention to treat population to compare this with analysis using data from only those participants who completed the study and similar results were observed. | MEASURES: Self‐reported leisure physical activity OUTCOMES: At 4 years, 79% of intervention students practised at least one supervised physical activity outside school PE classes, compared with 47% of control students (P < 0.001). Supervised leisure physical activity increased in intervention students, whereas it slightly decreased in controls, with a difference across groups of the 4‐year within‐group changes of 66min (95%CI: 34 to 98) per week (P < 0.0001). MEASURES: TV/video viewing time OUTCOMES: Intervention students had a greater reduction over time of TV/video viewing than controls (P < 0.01), with a difference in the 4‐year changes of ‐16min (95%CI: ‐29, ‐2) per day. MEASURES: Active commuting to/from school OUTCOMES: Slight increase in active commuting observed across both groups. MEASURES: Self‐efficacy and intention towards physical activity OUTCOMES: Intervention associated with an increase of self‐efficacy during the first 2 years (P < 0.0001 and 0.01 at 1 and 2 years respectively) and a sustained improvement of intention toward physical activity (P < 0.05). MEASURES: Cardiovascular risk factors OUTCOMES: Compared with controls, intervention participants had a higher increase of high‐density lipoprotein‐cholesterol concentration at 4 years and a slight decrease in blood pressure at 2 years. Other biological cardiovascular risk factors were similar between groups over time. | |
| MEASURES: Height, weight OUTCOMES: There were significant shifts in BMI in the intervention group, with a 2% reduction in overweight (BMI > 85% for age and sex) in the intervention group. There was a significant correlation at the 0.01 level between the intervention and a reduced BMI and BMI‐for‐age data showed that 39.4% of the comparison group and 36.4% of the intervention group were either overweight or at risk for overweight when measured at the baseline interval. Significant shifts in BMI were noted in the intervention group, with a 2% reduction in overweight (BMI _ 85% for age and sex) youth in the intervention group. Student’s t test and Pearson correlations were used to evaluate the significance of the BMI shift. Both analyses showed a significant correlation at the 0.01 level between the intervention and a reduced BMI. Student’s t test mean for the comparison group was 0.5210 (N _ 479; SD _ 1.01610, SE _ 0.04643) and for the intervention group was 0.1606 (N _ 534, SD _ 0.89446, SE _ 0.03871). The Pearson correlation for change in BMI baseline to post‐data measure with treatment (r _ _0.186; N _ 1013) was significant at the 0.01 level (two‐tailed). BMI‐for‐age data showed that 39.4% of the comparison group and 36.4% of the intervention group were either overweight or at risk for overweight when measured at the baseline interval. There was no significant shift in the comparison group, but there was a notable reduction in the intervention group in overweight and at risk for overweight classification, which was most significant at the at risk for overweight (BMI‐for‐age between 85% to 95%) level. There was a 16.2% attrition rate in the comparison group (N _ 479 matched measures between baseline to post‐data) and a 13.7% attrition rate in the intervention group (N _ 534 matched). There was no significant shift in the comparison group, but there was a reduction in the intervention group in overweight and at risk for overweight classification, which was most significant at the ‘at risk for overweight’ (BMI‐for‐age between 85% to 95%) level. MEASURES: Fruits and Vegetable Consumption OUTCOMES: Post‐intervention, there was an increase in fruit and vegetable consumption in both groups from baseline levels, with a higher increase in the intervention group.
MEASURES: Physical activity levels OUTCOMES: Physical activity levels in the intervention group increased in both school and home settings. Post‐intervention, intervention students reported an average of 102.5 min/wk of physical activity during the school day (up from 59min/wk at baseline) and a mean level of 37.42 min/d outside of the school day (up from 22.34 min/d at baseline). Physical activity levels increased slightly in the comparison group in reported levels of light exercise | ||
| 1. Fatness assessed by weight and height at baseline and at 12 weeks (end of the intervention): | 1. Dietary Intake: | |
| 1. Fatness assessed by repeat measures of height and weight (and calculated BMI) at baseline and end of pilot: | Psychological variables: | |
| MEASURES: Weight, Height OUTCOMES: Follow‐Up: Mean BMI z score (and 95% CI) remained significantly lower in intervention children in the whole group (n = 554, ‐0.17; ‐0.25 to ‐0.08) and in the group who underwent at least 1 (n = 389;‐0.19;‐0.24 to ‐0.13) or 2 (n = 256;‐0.21;‐0.29 to ‐0.14) full years of intervention. MEASURES: Prevalence Overweight and obesity OUTCOMES: Follow‐up: Intervention children were less likely to be overweight, but only in those who were present for the full intervention (n = 256; Relative Risk: 0.81; 95% CI: 0.69, 0.94). 9 (10%) intervention and 10 (14%) control children became overweight during the 2 yr after the cessation of the intervention project. 12 (30%) intervention and 14 (25%) control children who were overweight at baseline were not overweight at follow‐up. 13 (10%) intervention and 18 (17%) control children became overweight. 20 (30%) intervention and 20 (24%) control children became normal weight | MEASURES: Physical activity OUTCOMES: Post‐intervention average accelerometry counts at 1 year were 28% (95% CI: 11 to 47%) higher in intervention compared with control children after adjusting for age, sex, baseline values and school. Intervention children spent less time in sedentary activity (ratio 0.91, P = 0.007) and more time in moderate (1.07, P = 0.001) and moderate/vigorous (1.10, P = 0.01) activity. MEASURES: Waist circumference, blood pressure, pulse rate OUTCOME: No intervention effect was observed
| |
| MEASURE: BMI OUTCOMES: No significant differences between intervention and control groups MEASURES: Triceps skin‐fold thickness (TST) OUTCOMES: Significant reduction in TST in intervention children compared with controls for both boys (‐1.14mm; 95%CI: ‐1.71, ‐0.57; p<0.001) and girls (‐1.55mm; 95%CI: ‐2.38, ‐0.73; p<0.001). MEASURES: Percentage body fat OUTCOMES: Significant reduction in % body fat in girls (‐0.58%; 95%CI: ‐1.04, ‐0.11; p=0.02). No significant differences between intervention and control for boys. | MEASURES: Blood pressure, total cholesterol, triglycerides, apo A and apo B OUTCOMES: Compared with controls, intervention children had lower apo B levels and higher apo A‐1 levels. Intervention was not associated with any significant changes in total cholesterol, triglycerides or blood pressure, with the exception of diastolic blood pressure, which rose in intervention versus control boys. | |
| 1. Fatness assessed by repeat measures of height and weight. | 1. Nutrition knowledge: |
| Study ID | Primary Outcomes | Secondary Outcomes |
| MEASURE: BMI OUTCOME: Change in BMI was not significantly different between groups (mean ± SE: 0.07 ± 0.14 kg/m2 for intervention group and 0.21 ± 0.15 kg/m2 for control group). This varied according to baseline BMI, with the intervention effect significant in those subjects with baseline BMI > 30 kg/m2 and a significant difference between BMI change in intervention and control subjects among those in the upper baseline‐BMI tertile (‐0.63 ± ‐0.23 kg/m2 vs +0.12 ± 0.26 kg/m2). | MEASURE: Energy intake from SSB (kJ) OUTCOME: Energy intake from SSB decreased in intervention subjects (‐1201 ± 836 kJ) and this was significantly different from control (‐185 ± 945 kJ) (P < 0.0001) MEASURE: Noncaloric beverage intake (mL) OUTCOME: Significant increase in intervention subjects compared with control (p=0.002) MEASURE: Physical activity (MET) OUTCOME: No difference between intervention and control MEASURE: Television viewing (hours) OUTCOME: No difference between intervention and control MEASURE: Total media time (hours) OUTCOME: No difference between intervention and control | |
| MEASURES: BMI OUTCOMES: Prevalence of overweight was not different between groups (baseline:18.5 ± 38.8 and post‐intervention: 18.6 ± 38.9). MALES: No significant positive intervention effects on BMI were found. FEMALES: After 1 year of intervention, there was a trend for a significant lower increase in BMI in the intervention group with parental support when compared with the control group (F = 3.04, P < 0.08). After 2 years of intervention, there was a significant lower increase in BMI (F = 12.52, P < 0.05) and BMI z‐score (F = 8.61, P < 0.05) in the intervention with parental support group compared with the control group. There was also a significantly lower increase in BMI z‐score (F = 2.68, P = 0.05) in the intervention with parental support group compared with in the intervention‐alone group. | MEASURES: Physical activity OUTCOMES: MALES: school‐related physical activity increased significantly more in the intervention groups compared with the control group (P < 0.05). Using accelerometry, there were significantly lower decreases in physical activity of light intensity in the intervention groups (‐6 min/day) compared with the control group (‐39 min/day, P < 0.001). Where time spent in MVPA remained stable in the intervention group, it significantly decreased (‐18 min/day) in the control group (P < 0.05).
FEMALES: Time spent in physical activity of light intensity decreased significantly less in the intervention groups (‐2 min/day) compared with the control group (‐20 min/day, P < 0.05). MEASURES: fat intake, fruit, water and soft drinks OUTCOMES: MALES: No differences between groups FEMALES: Decreases in fat intake and percent energy from fat were significantly higher in the intervention groups (‐20 g/day) when compared with the control group (‐10g/day, P < 0.05). In either males or females there were no positive intervention effects on fruit, water and soft drink consumption Parental involvement did not increase intervention effects | |
| The primary outcomes were the feasibility i.e. sustainability and satisfaction of the intervention as assessed by a various satisfaction, behaviour change, personal change and socio‐environmental support variables. All did not achieve significance except: | 1. BMI 2. Diet and physical activity related behaviours OUTCOME: No differences between intervention and control. | |
| MEASURES: % of girls who reported participating in vigorous physical activity during an average of 1 or more 30‐minute blocks per day during the 3‐day reporting period. OUTCOMES: At follow‐up, the prevalence of vigorous physical activity was greater in the LEAP intervention schools than in control schools (45% vs 36% P = 0.05) after adjusting for baseline differences. When missing data at follow‐up were imputed by applying a regression method, this prevalence difference increased in statistical significance (P < 0.05). | MEASURES: % overweight or at‐risk for overweight OUTCOMES: No significant differences between intervention and control schools at follow‐up. | |
| MEASURES: Physical activity Boys in the intervention group increased their number of active days per week (P = 0.01) compared with control adolescents. MEASURES: Sedentary behaviours based on a composite self‐report measure including time spent watching television, playing computer/video games, sitting talking on the telephone, and sitting listening to music OUTCOMES: Significant (P < 0.001) between‐group difference for the change in sedentary behaviours (intervention ‐21% versus control +4.8% in girls and intervention ‐24% versus control +2.4% in boys). MEASURES: % of energy from fat and servings per day of fruits and vegetables OUTCOMES: More girls in the intervention group met the guideline for maximum % of daily calories from saturated fat at 12 months. Both groups increased their daily fruit and vegetable intake with no differences between groups. | MEASURES: BMI OUTCOMES: No differences at 12 months between groups for BMI z scores. | |
| MEASURES: Height and weight
OUTCOMES: No significant differences between groups post‐intervention
| MEASURES: Waist circumference
OUTCOMES: No significant differences between groups post‐intervention
MEASURES: Percentage body fat assessed using Tanita body fat analyser
OUTCOMES: No significant differences between groups post‐intervention MEASAURES: Cardiorespiratory fitness (by 20‐metre Multistage Fitness Test) OUTCOMES: No significant differences between groups post‐intervention MEASURES: Physical activity measured using Actigraph accelerometers OUTCOMES: Only significant difference was for intervention boys to have significantly less weekend vigorous physical activity (min/day) than comparison boys ( ?5.3; 95% CI: ?10.4, ?0.2; P = 0.045)
MEASURES: Time spent using small screen recreation measured using the Adolescent Sedentary Activities Questionnaire OUTCOMES: No significant differences between groups post‐intervention MEASURES: Sweetened beverage and fruit consumption measured using a validated Food Frequency Questionnaire OUTCOMES: No significant differences between groups post‐intervention | |
| MEASURE: BMI OUTCOME: No significant differences between intervention and control groups MEASURE: Hip and waist circumference OUTCOME: After 8 months, there were significant differences in hip circumference for intervention compared with control (mean difference in of 0.53 cm; 95% CI 0.07 to 0.98) in females. In males, the intervention resulted in a significant difference in waist circumference (mean difference, ‐0.57 cm; 95% CI, ‐1.10 to ‐0.05). At the 20 month follow‐up assessment, waist circumference in boys was significantly lower in the control group. In girls at 20 months, there was no significant difference between intervention and control. MEASURE: Skinfold thickness OUTCOME: Significant difference in sum of skinfolds for intervention females compared to control females were observed at 8 months (mean difference ‐2.31cm; 95% CI ‐4.34 to ‐0.28). In boys, there was a significant intervention effect on triceps (‐0.7mm; 95%CI: ‐1.2 to ‐0.1mm), biceps (‐0.4mm; 95%ci: ‐0.8 to ‐0.1mm) and subscapular (‐0.5mm; 95%CI: ‐1.0 to ‐0.1mm) skinfold thickness at 20 months. In girls, there was a significant intervention effect on biceps skinfold thickness (‐0.7mm; 95%CI: ‐1.3 to ‐0.04mm) and the sum of skinfold thickness at 20 months (‐2.0mm; 95%CI: ‐3.9 to ‐0.1mm) | MEASURE: Aerobic Fitness OUTCOME: No reported difference between intervention and control at 8 months. MEASURE: Consumption of sugar‐containing beverages OUTCOME: While consumption of sugar‐containing beverages was significantly lower among students of the intervention schools at both 8‐ and 12‐month follow‐ups, there were no significant differences at 20 months. MEASURE: Consumption of high‐energy snacks OUTCOME: No significant intervention effects. MEASURE: Screen viewing behaviour OUTCOME: Numerical differences in screen‐viewing behaviour consistently favoured students from intervention schools at all follow‐up measurements, with statistically significant differences in favour of boys of the intervention group at 20 months (‐25 min/d; 95%CI: ‐50 to ‐0.3 min/d). MEASURES: Active commuting to school OUTCOMES: No significant intervention effects. | |
| MEASURES: Physical activity OUTCOMES: At 2 years, there was no difference in adjusted MET‐weighted minutes of MVPA between 8th‐grade girls in intervention compared with control schools. At 3 years, 8th‐grade girls in intervention schools had 10.9 more MET‐weighted minutes of MVPA than those in control schools (P = 0.03). The decrease in MET‐weighted minutes of MVPA in intervention schools from 6th grade to 8th grade was 6% compared with 15% in control schools. These differences in physical activity were seen more during weekdays than weekends. There were differences in the number of MET‐weighted minutes of MVPA among the three largest racial/ethnic groups. After adjusting for 6th‐grade activity differences, both MET‐weighted minutes and unweighted minutes of MVPA were higher for white girls than for African‐American and Hispanic girls at both 2 years and 3 years. | MEASURES: Body composition OUTCOMES: Changes in triceps skinfold thickness and percent body fat were similar between intervention and control groups |
| Outcome or subgroup title | No. of studies | No. of participants | Statistical method | Effect size |
| 1 Standardised mean change in Body Mass Index (BMI/zBMI) from baseline to postintervention Show forest plot | 37 | 27946 | Std. Mean Difference (IV, Random, 95% CI) | ‐0.15 [‐0.21, ‐0.09] |
| 1.1 0‐5 years | 7 | 1815 | Std. Mean Difference (IV, Random, 95% CI) | ‐0.26 [‐0.53, 0.00] |
| 1.2 6‐12 years | 24 | 18983 | Std. Mean Difference (IV, Random, 95% CI) | ‐0.15 [‐0.23, ‐0.08] |
| 1.3 13‐18 years | 6 | 7148 | Std. Mean Difference (IV, Random, 95% CI) | ‐0.09 [‐0.20, 0.03] |