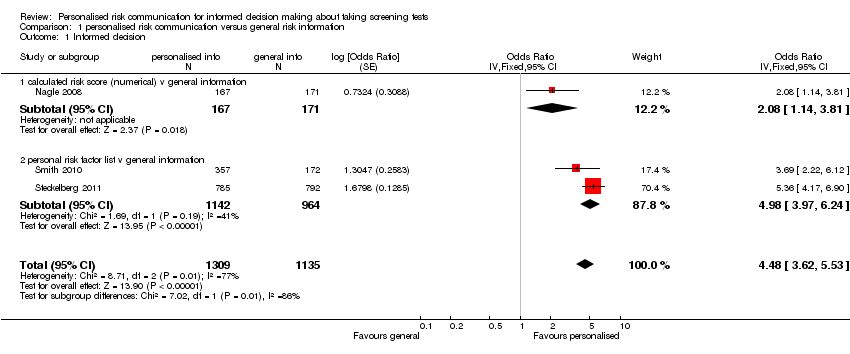
| 1 Informed decision Show forest plot | 3 | 2444 | Odds Ratio (Fixed, 95% CI) | 4.48 [3.62, 5.53] |
|
| 1.1 calculated risk score (numerical) v general information | 1 | 338 | Odds Ratio (Fixed, 95% CI) | 2.08 [1.14, 3.81] |
| 1.2 personal risk factor list v general information | 2 | 2106 | Odds Ratio (Fixed, 95% CI) | 4.98 [3.97, 6.24] |
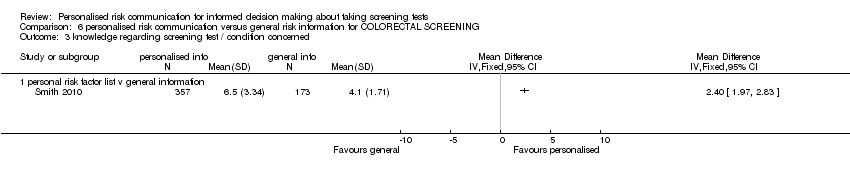
| 2 knowledge regarding screening test / condition concerned Show forest plot | 4 | | Std. Mean Difference (Fixed, 95% CI) | Subtotals only |
|
| 2.1 calculated risk score (numerical) v general information | 1 | 588 | Std. Mean Difference (Fixed, 95% CI) | 0.40 [0.23, 0.56] |
| 2.2 calculated risk score (categorised) v general information | 1 | 260 | Std. Mean Difference (Fixed, 95% CI) | 0.57 [0.32, 0.82] |
| 2.3 personal risk factor list v general information | 2 | 838 | Std. Mean Difference (Fixed, 95% CI) | 0.89 [0.75, 1.04] |
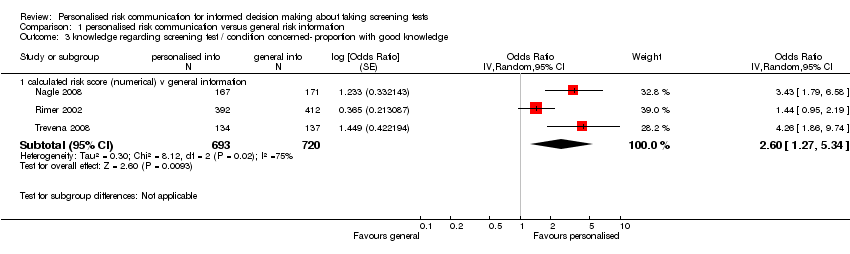
| 3 knowledge regarding screening test / condition concerned‐ proportion with good knowledge Show forest plot | 3 | | Odds Ratio (Random, 95% CI) | Subtotals only |
|
| 3.1 calculated risk score (numerical) v general information | 3 | 1413 | Odds Ratio (Random, 95% CI) | 2.60 [1.27, 5.34] |
| 4 knowledge regarding screening test / condition concerned‐ proportion with good knowledge Show forest plot | 2 | 2107 | Odds Ratio (Fixed, 95% CI) | 7.13 [5.79, 8.79] |
|
| 4.1 personal risk factor list v general information | 2 | 2107 | Odds Ratio (Fixed, 95% CI) | 7.13 [5.79, 8.79] |
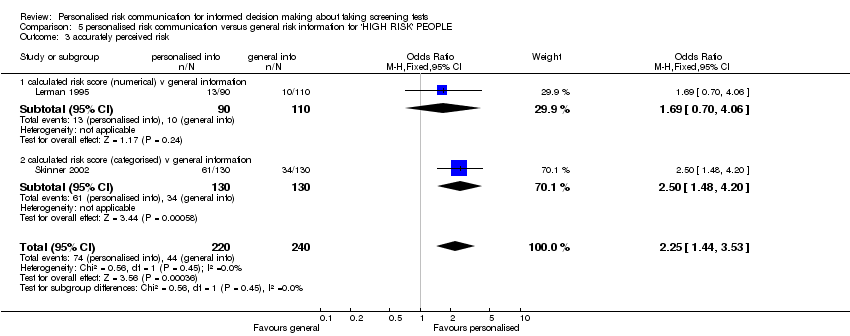
| 5 accurately perceived risk Show forest plot | 3 | 1264 | Odds Ratio (M‐H, Random, 95% CI) | 1.65 [0.96, 2.81] |
|
| 5.1 calculated risk score (numerical) v general information | 2 | 1004 | Odds Ratio (M‐H, Random, 95% CI) | 1.22 [0.91, 1.64] |
| 5.2 calculated risk score (categorised) v general information | 1 | 260 | Odds Ratio (M‐H, Random, 95% CI) | 2.50 [1.48, 4.20] |
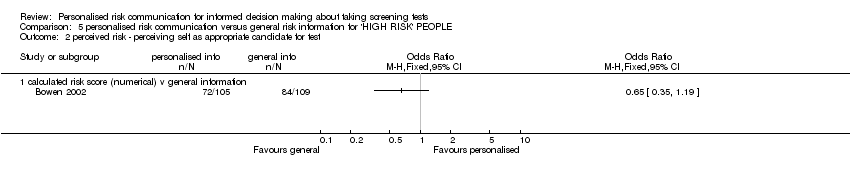
| 6 perceived risk ‐ perceiving self as appropriate candidate for test Show forest plot | 1 | | Odds Ratio (M‐H, Fixed, 95% CI) | Totals not selected |
|
| 6.1 calculated risk score (numerical) v general information | 1 | | Odds Ratio (M‐H, Fixed, 95% CI) | 0.0 [0.0, 0.0] |
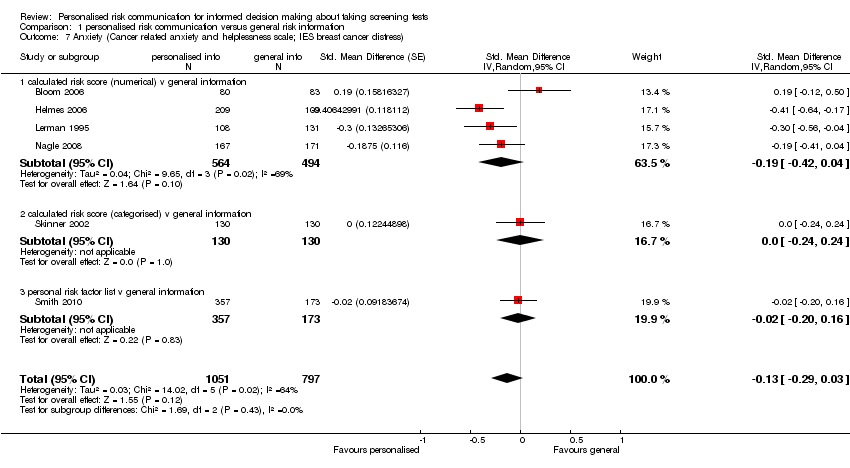
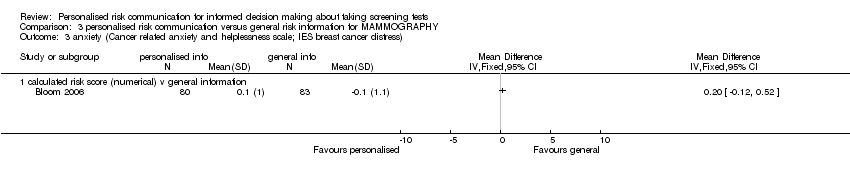
| 7 Anxiety (Cancer related anxiety and helplessness scale; IES breast cancer distress) Show forest plot | 6 | 1848 | Std. Mean Difference (Random, 95% CI) | ‐0.13 [‐0.29, 0.03] |
|
| 7.1 calculated risk score (numerical) v general information | 4 | 1058 | Std. Mean Difference (Random, 95% CI) | ‐0.19 [‐0.42, 0.04] |
| 7.2 calculated risk score (categorised) v general information | 1 | 260 | Std. Mean Difference (Random, 95% CI) | 0.0 [‐0.24, 0.24] |
| 7.3 personal risk factor list v general information | 1 | 530 | Std. Mean Difference (Random, 95% CI) | ‐0.02 [‐0.20, 0.16] |
| 8 decision conflict (proportion with lower scores) Show forest plot | 1 | | Odds Ratio (M‐H, Fixed, 95% CI) | Totals not selected |
|
| 8.1 personal risk factor list v general information | 1 | | Odds Ratio (M‐H, Fixed, 95% CI) | 0.0 [0.0, 0.0] |
| 9 decision conflict Show forest plot | 1 | | Mean Difference (Fixed, 95% CI) | Totals not selected |
|
| 9.1 calculated risk score (numerical) v general information | 1 | | Mean Difference (Fixed, 95% CI) | 0.0 [0.0, 0.0] |
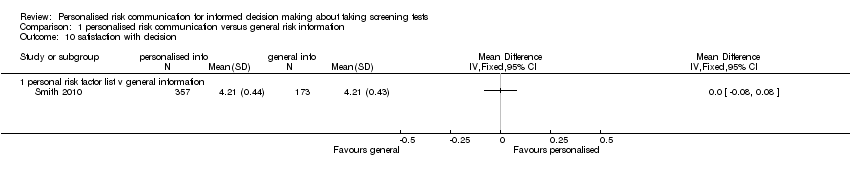
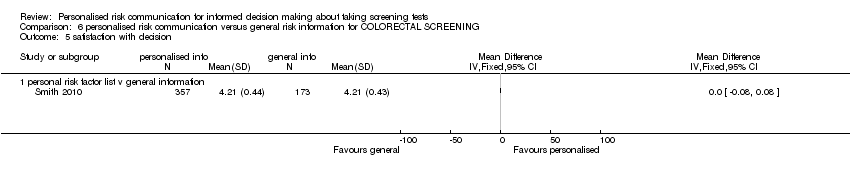
| 10 satisfaction with decision Show forest plot | 1 | | Mean Difference (IV, Fixed, 95% CI) | Totals not selected |
|
| 10.1 personal risk factor list v general information | 1 | | Mean Difference (IV, Fixed, 95% CI) | 0.0 [0.0, 0.0] |
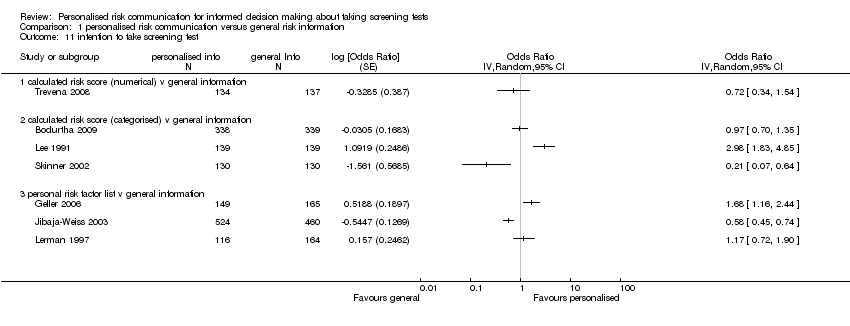
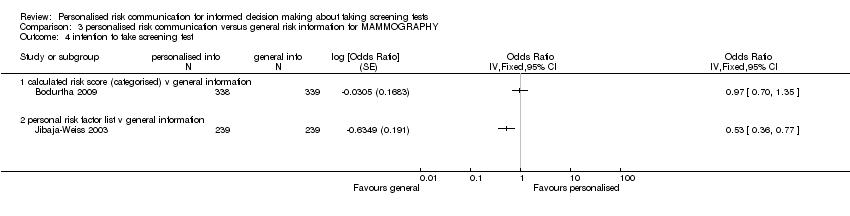
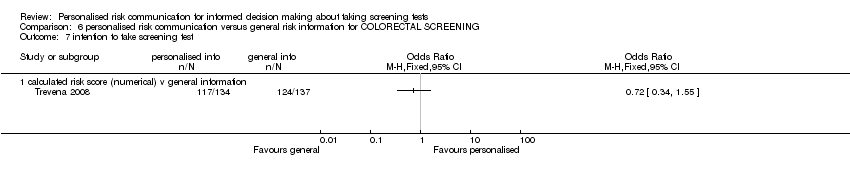
| 11 intention to take screening test Show forest plot | 7 | | Odds Ratio (Random, 95% CI) | Totals not selected |
|
| 11.1 calculated risk score (numerical) v general information | 1 | | Odds Ratio (Random, 95% CI) | 0.0 [0.0, 0.0] |
| 11.2 calculated risk score (categorised) v general information | 3 | | Odds Ratio (Random, 95% CI) | 0.0 [0.0, 0.0] |
| 11.3 personal risk factor list v general information | 3 | | Odds Ratio (Random, 95% CI) | 0.0 [0.0, 0.0] |
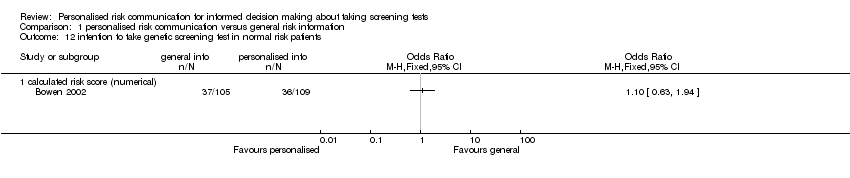
| 12 intention to take genetic screening test in normal risk patients Show forest plot | 1 | | Odds Ratio (M‐H, Fixed, 95% CI) | Totals not selected |
|
| 12.1 calculated risk score (numerical) | 1 | | Odds Ratio (M‐H, Fixed, 95% CI) | 0.0 [0.0, 0.0] |
| 13 intention to take genetic screening test in normal risk patients Show forest plot | 2 | | Mean Difference (Random, 95% CI) | ‐0.77 [‐1.42, ‐0.13] |
|
| 13.1 calculated risk score (numerical) | 1 | | Mean Difference (Random, 95% CI) | ‐0.52 [‐0.61, ‐0.43] |
| 13.2 calculated risk score (categorised) | 1 | | Mean Difference (Random, 95% CI) | ‐1.2 [‐1.88, ‐0.52] |
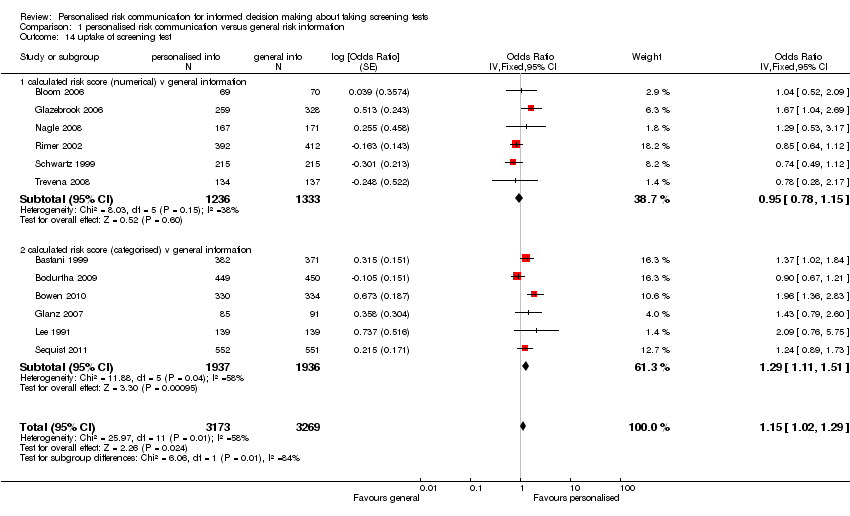
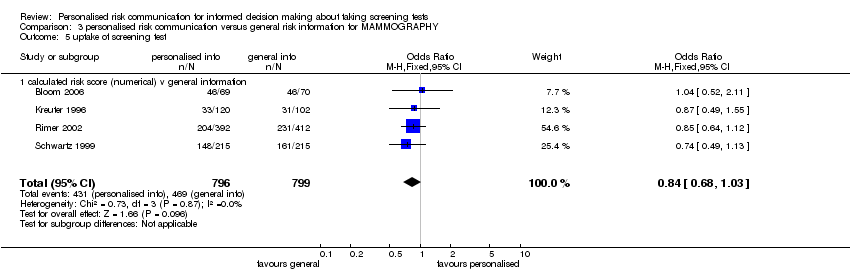
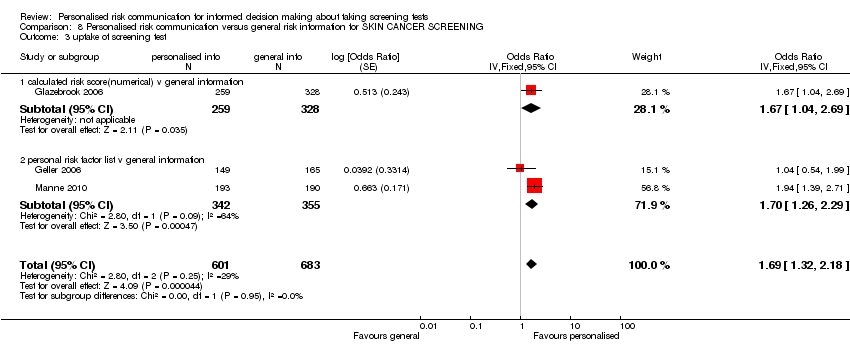
| 14 uptake of screening test Show forest plot | 12 | 6442 | Odds Ratio (Fixed, 95% CI) | 1.15 [1.02, 1.29] |
|
| 14.1 calculated risk score (numerical) v general information | 6 | 2569 | Odds Ratio (Fixed, 95% CI) | 0.95 [0.78, 1.15] |
| 14.2 calculated risk score (categorised) v general information | 6 | 3873 | Odds Ratio (Fixed, 95% CI) | 1.29 [1.11, 1.51] |
| 15 uptake of screening test Show forest plot | 20 | | Odds Ratio (Random, 95% CI) | Totals not selected |
|
| 15.1 personal risk factor list v general information | 20 | | Odds Ratio (Random, 95% CI) | 0.0 [0.0, 0.0] |
| 16 appropriate use of cholesterol test Show forest plot | 1 | | Odds Ratio (M‐H, Fixed, 95% CI) | Totals not selected |
|
| 16.1 calculated risk score (numerical) v general information | 1 | | Odds Ratio (M‐H, Fixed, 95% CI) | 0.0 [0.0, 0.0] |
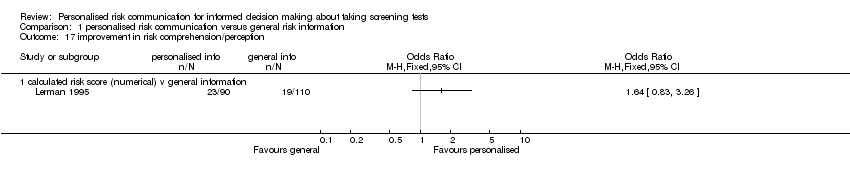
| 17 improvement in risk comprehension/perception Show forest plot | 1 | | Odds Ratio (M‐H, Fixed, 95% CI) | Totals not selected |
|
| 17.1 calculated risk score (numerical) v general information | 1 | | Odds Ratio (M‐H, Fixed, 95% CI) | 0.0 [0.0, 0.0] |
| 18 stages of change Show forest plot | | | Other data | No numeric data |
|
| 18.1 personal risk factor list v general information | | | Other data | No numeric data |
| 19 making a recommended behaviour change Show forest plot | 1 | | Odds Ratio (M‐H, Fixed, 95% CI) | Totals not selected |
|
| 19.1 personal risk factor list v general information | 1 | | Odds Ratio (M‐H, Fixed, 95% CI) | 0.0 [0.0, 0.0] |
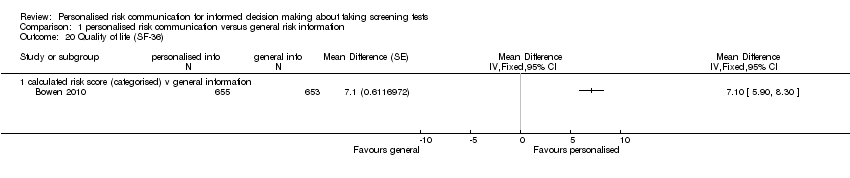
| 20 Quality of life (SF‐36) Show forest plot | 1 | | Mean Difference (Fixed, 95% CI) | Totals not selected |
|
| 20.1 calculated risk score (categorised) v general information | 1 | | Mean Difference (Fixed, 95% CI) | 0.0 [0.0, 0.0] |