Scolaris Content Display Scolaris Content Display

Funnel plot showing symmetry of risk difference (RD) against the standard error (SE) in individual studies
Figuras y tablas -
Figure 1

Funnel plot showing symmetry of risk difference (RD) against the standard error (SE) in individual studies

Risk of bias graph: review authors' judgements about each risk of bias item presented as percentages across all included studies
Figuras y tablas -
Figure 2

Risk of bias graph: review authors' judgements about each risk of bias item presented as percentages across all included studies

Risk of bias summary: review authors' judgements about each risk of bias item for each included study
Figuras y tablas -
Figure 3

Risk of bias summary: review authors' judgements about each risk of bias item for each included study

Comparison 1 Third generation cephalosporins versus conventional therapy, Outcome 1 Death.
Figuras y tablas -
Analysis 1.1

Comparison 1 Third generation cephalosporins versus conventional therapy, Outcome 1 Death.

Comparison 1 Third generation cephalosporins versus conventional therapy, Outcome 2 Deafness.
Figuras y tablas -
Analysis 1.2

Comparison 1 Third generation cephalosporins versus conventional therapy, Outcome 2 Deafness.

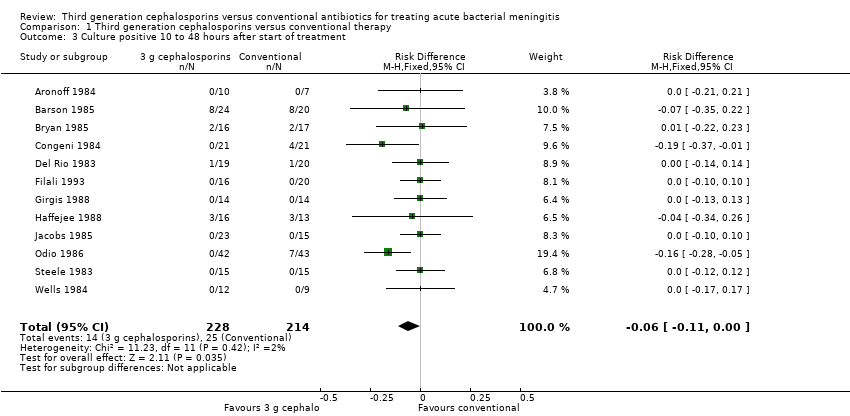
Comparison 1 Third generation cephalosporins versus conventional therapy, Outcome 3 Culture positive 10 to 48 hours after start of treatment.
Figuras y tablas -
Analysis 1.3

Comparison 1 Third generation cephalosporins versus conventional therapy, Outcome 3 Culture positive 10 to 48 hours after start of treatment.

Comparison 1 Third generation cephalosporins versus conventional therapy, Outcome 4 Diarrhoea.
Figuras y tablas -
Analysis 1.4

Comparison 1 Third generation cephalosporins versus conventional therapy, Outcome 4 Diarrhoea.

Comparison 1 Third generation cephalosporins versus conventional therapy, Outcome 5 Neutropenia.
Figuras y tablas -
Analysis 1.5

Comparison 1 Third generation cephalosporins versus conventional therapy, Outcome 5 Neutropenia.

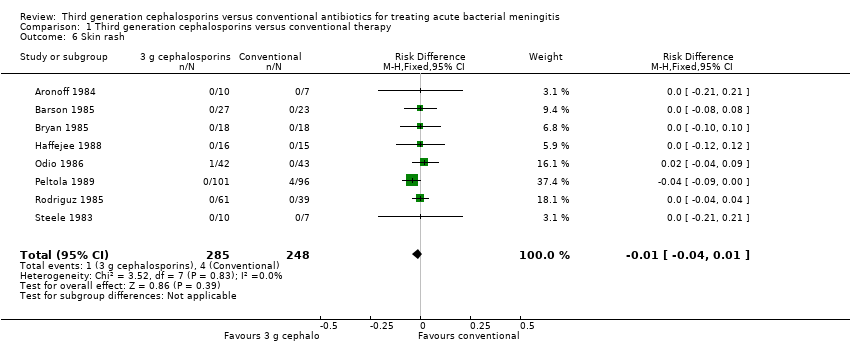
Comparison 1 Third generation cephalosporins versus conventional therapy, Outcome 6 Skin rash.
Figuras y tablas -
Analysis 1.6

Comparison 1 Third generation cephalosporins versus conventional therapy, Outcome 6 Skin rash.

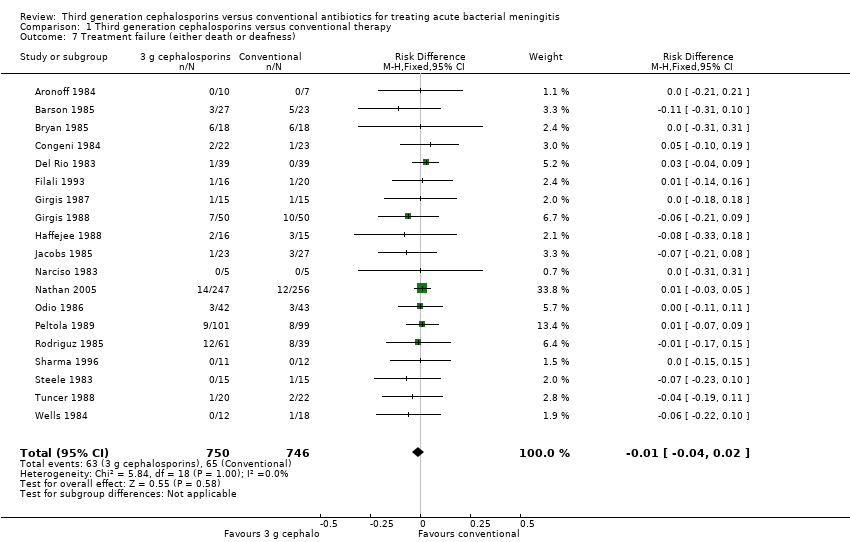
Comparison 1 Third generation cephalosporins versus conventional therapy, Outcome 7 Treatment failure (either death or deafness).
Figuras y tablas -
Analysis 1.7

Comparison 1 Third generation cephalosporins versus conventional therapy, Outcome 7 Treatment failure (either death or deafness).

Comparison 2 Cephalosporins versus conventional therapy for H. influenzae meningitis, Outcome 1 Death.
Figuras y tablas -
Analysis 2.1

Comparison 2 Cephalosporins versus conventional therapy for H. influenzae meningitis, Outcome 1 Death.

Comparison 3 Third generation cephalosporins versus conventional antibiotics for S. pneumoniae meningitis, Outcome 1 Death.
Figuras y tablas -
Analysis 3.1

Comparison 3 Third generation cephalosporins versus conventional antibiotics for S. pneumoniae meningitis, Outcome 1 Death.

Comparison 4 Third generation cephalosporins versus conventional therapy for meningococcal meningitis, Outcome 1 Death.
Figuras y tablas -
Analysis 4.1

Comparison 4 Third generation cephalosporins versus conventional therapy for meningococcal meningitis, Outcome 1 Death.

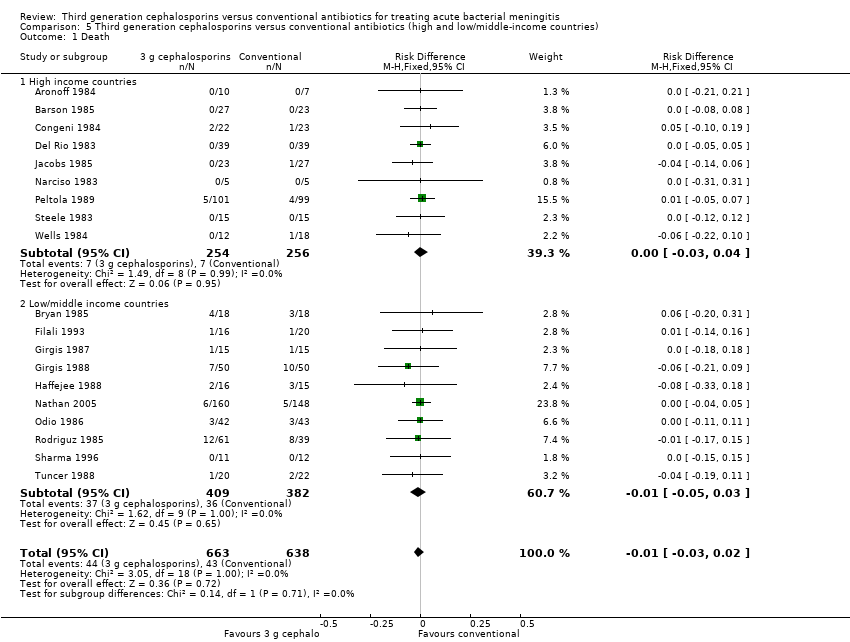
Comparison 5 Third generation cephalosporins versus conventional antibiotics (high and low/middle‐income countries), Outcome 1 Death.
Figuras y tablas -
Analysis 5.1

Comparison 5 Third generation cephalosporins versus conventional antibiotics (high and low/middle‐income countries), Outcome 1 Death.

Comparison 5 Third generation cephalosporins versus conventional antibiotics (high and low/middle‐income countries), Outcome 2 Deafness.
Figuras y tablas -
Analysis 5.2

Comparison 5 Third generation cephalosporins versus conventional antibiotics (high and low/middle‐income countries), Outcome 2 Deafness.

Comparison 5 Third generation cephalosporins versus conventional antibiotics (high and low/middle‐income countries), Outcome 3 Treatment failure.
Figuras y tablas -
Analysis 5.3

Comparison 5 Third generation cephalosporins versus conventional antibiotics (high and low/middle‐income countries), Outcome 3 Treatment failure.

Summary of findings for the main comparison. Third generation cephalosporins versus conventional therapy for acute bacterial meningitis

Third generation cephalosporins versus conventional therapy for acute bacterial meningitis

Patient or population: patients treated for acute bacterial meningitis
Settings: acute bacterial meningitis
Intervention: third generation cephalosporins versus conventional therapy

Outcomes

Illustrative comparative risks* (95% CI)

Relative effect
(95% CI)

No of participants
(studies)

Quality of the evidence
(GRADE)

Comments

Assumed risk

Corresponding risk

Control

Third generation cephalosporins versus conventional therapy

Death

Study population

See comment

1496
(19)

Risks were calculated from pooled risk differences

67 per 1000

65 per 1000
(37 to 87)

Medium risk population

47 per 1000

46 per 1000
(26 to 61)

Deafness

Study population

See comment

501
(10)

Risks were calculated from pooled risk differences

118 per 1000

83 per 1000
(28 to 127)

Medium risk population

72 per 1000

50 per 1000
(17 to 78)

Culture positivity 10 to 48 hours start of treatment

Study population

See comment

442
(12)

Risks were calculated from pooled risk differences

117 per 1000

58 per 1000
(7 to 117)

Medium risk population

25 per 1000

12 per 1000
(1 to 25)

Diarrhoea

Study population

See comment

750
(12)

Risks were calculated from pooled risk differences

125 per 1000

202 per 1000
(155 to 255)

Medium risk population

77 per 1000

125 per 1000
(95 to 157)

Neutropenia

Study population

See comment

472
(10)

Risks were calculated from pooled risk differences

54 per 1000

29 per 1000
(‐16 to 74)

Medium risk population

13 per 1000

7 per 1000
(‐4 to 18)

Skin rash

Study population

See comment

533
(8)

Risks were calculated from pooled risk differences

16 per 1000

4 per 1000
(‐24 to 26)

Medium risk population

0 per 1000

0 per 1000
(0 to 0)

Treatment failure (either death or deafness)

Study population

See comment

1496
(19)

Risks were calculated from pooled risk differences

87 per 1000

79 per 1000
(47 to 107)

Medium risk population

67 per 1000

61 per 1000
(36 to 82)

*The basis for the assumed risk (e.g. the median control group risk across studies) is provided in footnotes. The corresponding risk (and its 95% confidence interval) is based on the assumed risk in the comparison group and the relative effect of the intervention (and its 95% CI)
CI: confidence interval; RR: risk ratio

GRADE Working Group grades of evidence
High quality: further research is very unlikely to change our confidence in the estimate of effect
Moderate quality: further research is likely to have an important impact on our confidence in the estimate of effect and may change the estimate
Low quality: further research is very likely to have an important impact on our confidence in the estimate of effect and is likely to change the estimate
Very low quality: we are very uncertain about the estimate

Figuras y tablas -
Summary of findings for the main comparison. Third generation cephalosporins versus conventional therapy for acute bacterial meningitis
Summary of findings 2. Cephalosporins versus conventional therapy for H. influenzae meningitis

Cephalosporins versus conventional therapy for H. influenzae meningitis

Patient or population: patients treated for H. influenzae meningitis
Settings: acute bacterial meningitis
Intervention: cephalosporins versus conventional therapy for H. influenzae meningitis

Outcomes

Illustrative comparative risks* (95% CI)

Relative effect
(95% CI)

No of participants
(studies)

Quality of the evidence
(GRADE)

Comments

Assumed risk

Corresponding risk

Control

Cephalosporins versus conventional therapy for H. influenzae meningitis

Death

Study population

See comment

318
(10)

Risks were calculated from pooled risk differences

62 per 1000

69 per 1000
(12 to 122)

Medium risk population

26 per 1000

29 per 1000
(5 to 51)

*The basis for the assumed risk (e.g. the median control group risk across studies) is provided in footnotes. The corresponding risk (and its 95% confidence interval) is based on the assumed risk in the comparison group and the relative effect of the intervention (and its 95% CI)
CI: confidence interval; RR: risk ratio

GRADE Working Group grades of evidence
High quality: further research is very unlikely to change our confidence in the estimate of effect
Moderate quality: further research is likely to have an important impact on our confidence in the estimate of effect and may change the estimate
Low quality: further research is very likely to have an important impact on our confidence in the estimate of effect and is likely to change the estimate
Very low quality: we are very uncertain about the estimate

Figuras y tablas -
Summary of findings 2. Cephalosporins versus conventional therapy for H. influenzae meningitis
Summary of findings 3. Third generation cephalosporins versus conventional antibiotics for S. pneumoniae meningitis

Third generation cephalosporins versus conventional antibiotics for S. pneumoniae meningitis

Patient or population: patients treated for S. pneumoniae meningitis
Settings: acute bacterial meningitis
Intervention: third generation cephalosporins versus conventional antibiotics for S. pneumoniae meningitis

Outcomes

Illustrative comparative risks* (95% CI)

Relative effect
(95% CI)

No of participants
(studies)

Quality of the evidence
(GRADE)

Comments

Assumed risk

Corresponding risk

Control

Third generation cephalosporins versus conventional antibiotics for S. pneumoniae meningitis

Death

Study population

See comment

129
(11)

Risks were calculated from pooled risk differences

255 per 1000

232 per 1000
(74 to 395)

Medium risk population

250 per 1000

228 per 1000
(72 to 387)

*The basis for the assumed risk (e.g. the median control group risk across studies) is provided in footnotes. The corresponding risk (and its 95% confidence interval) is based on the assumed risk in the comparison group and the relative effect of the intervention (and its 95% CI)
CI: confidence interval; RR: risk ratio

GRADE Working Group grades of evidence
High quality: further research is very unlikely to change our confidence in the estimate of effect
Moderate quality: further research is likely to have an important impact on our confidence in the estimate of effect and may change the estimate
Low quality: further research is very likely to have an important impact on our confidence in the estimate of effect and is likely to change the estimate
Very low quality: we are very uncertain about the estimate

Figuras y tablas -
Summary of findings 3. Third generation cephalosporins versus conventional antibiotics for S. pneumoniae meningitis
Summary of findings 4. Third generation cephalosporins versus conventional therapy for meningococcal meningitis

Third generation cephalosporins versus conventional therapy for meningococcal meningitis

Patient or population: patients treated for meningococcal meningitis
Settings: acute bacterial meningitis
Intervention: third generation cephalosporins versus conventional therapy for meningococcal meningitis

Outcomes

Illustrative comparative risks* (95% CI)

Relative effect
(95% CI)

No of participants
(studies)

Quality of the evidence
(GRADE)

Comments

Assumed risk

Corresponding risk

Control

Third generation cephalosporins versus conventional therapy for meningococcal meningitis

Death

Study population

See comment

477
(13)

Risks were calculated from pooled risk differences

39 per 1000

35 per 1000
(‐11 to 80)

Medium risk population

0 per 1000

0 per 1000
(0 to 0)

*The basis for the assumed risk (e.g. the median control group risk across studies) is provided in footnotes. The corresponding risk (and its 95% confidence interval) is based on the assumed risk in the comparison group and the relative effect of the intervention (and its 95% CI)
CI: confidence interval; RR: risk ratio

GRADE Working Group grades of evidence
High quality: further research is very unlikely to change our confidence in the estimate of effect
Moderate quality: further research is likely to have an important impact on our confidence in the estimate of effect and may change the estimate
Low quality: further research is very likely to have an important impact on our confidence in the estimate of effect and is likely to change the estimate
Very low quality: we are very uncertain about the estimate

Figuras y tablas -
Summary of findings 4. Third generation cephalosporins versus conventional therapy for meningococcal meningitis
Summary of findings 5. Third generation cephalosporins versus conventional antibiotics (high and low/middle‐income countries) for acute bacterial meningitis

Third generation cephalosporins versus conventional antibiotics (high and low/middle‐income countries) for acute bacterial meningitis

Patient or population: patients treated for acute bacterial meningitis
Settings: acute bacterial meningitis
Intervention: third generation cephalosporins versus conventional antibiotics (high and low/middle‐income countries)

Outcomes

Illustrative comparative risks* (95% CI)

Relative effect
(95% CI)

No of participants
(studies)

Quality of the evidence
(GRADE)

Comments

Assumed risk

Corresponding risk

Control

Third generation cephalosporins versus conventional antibiotics (high and low/middle‐income countries)

Death

Study population

See comment

1301
(19)

Risks were calculated from pooled risk differences

67 per 1000

62 per 1000
(37 to 87)

Medium risk population

44 per 1000

40 per 1000
(24 to 57)

Death: high‐income countries

Study population

See comment

510
(9)

Risks were calculated from pooled risk differences

27 per 1000

28 per 1000
(‐3 to 66)

Medium risk population

0 per 1000

0 per 1000
(0 to 0)

Death: Low/middle‐income countries

Study population

See comment

791
(10)

Risks were calculated from pooled risk differences

94 per 1000

85 per 1000
(44 to 124)

Medium risk population

80 per 1000

72 per 1000
(38 to 106)

Deafness

Study population

See comment

501
(10)

Risks were calculated from pooled risk differences

114 per 1000

76 per 1000
(24 to 124)

Medium risk population

54 per 1000

36 per 1000
(11 to 59)

Deafness: high‐income countries

Study population

See comment

380
(6)

Risks were calculated from pooled risk differences

138 per 1000

90 per 1000
(28 to 148)

Medium risk population

72 per 1000

47 per 1000
(14 to 77)

Deafness: low‐income countries

Study population

See comment

121
(4)

Risks were calculated from pooled risk differences

45 per 1000

39 per 1000
(‐44 to 124)

Medium risk population

0 per 1000

0 per 1000
(0 to 0)

*The basis for the assumed risk (e.g. the median control group risk across studies) is provided in footnotes. The corresponding risk (and its 95% confidence interval) is based on the assumed risk in the comparison group and the relative effect of the intervention (and its 95% CI)
CI: confidence interval; RR: risk ratio

GRADE Working Group grades of evidence
High quality: further research is very unlikely to change our confidence in the estimate of effect
Moderate quality: further research is likely to have an important impact on our confidence in the estimate of effect and may change the estimate
Low quality: further research is very likely to have an important impact on our confidence in the estimate of effect and is likely to change the estimate
Very low quality: we are very uncertain about the estimate

Figuras y tablas -
Summary of findings 5. Third generation cephalosporins versus conventional antibiotics (high and low/middle‐income countries) for acute bacterial meningitis
Table 1. Income‐based classification of countries where studies were conducted

High‐income

Upper middle‐income

Lower middle‐income

Low‐income

Arnoff 1984

Haffejee 1988

Bryan 1985

Nathan 2005

Barson 1985

Odio 1986

Filali 1993

Sharma 1996

Congeni 1984

Tuncer 1988

Girgis 1987

Del Rio 1983

Rodriguz 1985

Jacobs 1985

Girgis 1988

Narciso 1983

Peltola 1989

Steele 1983

Wells 1984

Figuras y tablas -
Table 1. Income‐based classification of countries where studies were conducted
Comparison 1. Third generation cephalosporins versus conventional therapy

Outcome or subgroup title

No. of studies

No. of participants

Statistical method

Effect size

1 Death Show forest plot

19

1496

Risk Difference (M‐H, Fixed, 95% CI)

‐0.00 [‐0.03, 0.02]

2 Deafness Show forest plot

10

501

Risk Difference (M‐H, Fixed, 95% CI)

‐0.04 [‐0.09, 0.01]

3 Culture positive 10 to 48 hours after start of treatment Show forest plot

12

442

Risk Difference (M‐H, Fixed, 95% CI)

‐0.06 [‐0.11, ‐0.00]

4 Diarrhoea Show forest plot

12

750

Risk Difference (M‐H, Fixed, 95% CI)

0.08 [0.03, 0.13]

5 Neutropenia Show forest plot

10

472

Risk Difference (M‐H, Fixed, 95% CI)

‐0.02 [‐0.07, 0.02]

6 Skin rash Show forest plot

8

533

Risk Difference (M‐H, Fixed, 95% CI)

‐0.01 [‐0.04, 0.01]

7 Treatment failure (either death or deafness) Show forest plot

19

1496

Risk Difference (M‐H, Fixed, 95% CI)

‐0.01 [‐0.04, 0.02]

Figuras y tablas -
Comparison 1. Third generation cephalosporins versus conventional therapy
Comparison 2. Cephalosporins versus conventional therapy for H. influenzae meningitis

Outcome or subgroup title

No. of studies

No. of participants

Statistical method

Effect size

1 Death Show forest plot

10

318

Risk Difference (M‐H, Fixed, 95% CI)

0.01 [‐0.05, 0.06]

Figuras y tablas -
Comparison 2. Cephalosporins versus conventional therapy for H. influenzae meningitis
Comparison 3. Third generation cephalosporins versus conventional antibiotics for S. pneumoniae meningitis

Outcome or subgroup title

No. of studies

No. of participants

Statistical method

Effect size

1 Death Show forest plot

11

129

Risk Difference (M‐H, Fixed, 95% CI)

‐0.02 [‐0.18, 0.14]

Figuras y tablas -
Comparison 3. Third generation cephalosporins versus conventional antibiotics for S. pneumoniae meningitis
Comparison 4. Third generation cephalosporins versus conventional therapy for meningococcal meningitis

Outcome or subgroup title

No. of studies

No. of participants

Statistical method

Effect size

1 Death Show forest plot

13

477

Risk Difference (M‐H, Fixed, 95% CI)

‐0.00 [‐0.05, 0.04]

Figuras y tablas -
Comparison 4. Third generation cephalosporins versus conventional therapy for meningococcal meningitis
Comparison 5. Third generation cephalosporins versus conventional antibiotics (high and low/middle‐income countries)

Outcome or subgroup title

No. of studies

No. of participants

Statistical method

Effect size

1 Death Show forest plot

19

1301

Risk Difference (M‐H, Fixed, 95% CI)

‐0.01 [‐0.03, 0.02]

1.1 High income countries

9

510

Risk Difference (M‐H, Fixed, 95% CI)

0.00 [‐0.03, 0.04]

1.2 Low/middle income countries

10

791

Risk Difference (M‐H, Fixed, 95% CI)

‐0.01 [‐0.05, 0.03]

2 Deafness Show forest plot

10

501

Risk Difference (M‐H, Fixed, 95% CI)

‐0.04 [‐0.09, 0.01]

2.1 Developed countries

6

380

Risk Difference (M‐H, Fixed, 95% CI)

‐0.05 [‐0.11, 0.01]

2.2 Developing countries

4

121

Risk Difference (M‐H, Fixed, 95% CI)

‐0.01 [‐0.09, 0.08]

3 Treatment failure Show forest plot

19

1301

Risk Difference (M‐H, Fixed, 95% CI)

‐0.01 [‐0.04, 0.02]

3.1 Developed countries

9

510

Risk Difference (M‐H, Fixed, 95% CI)

‐0.01 [‐0.06, 0.03]

3.2 Developing countries

10

791

Risk Difference (M‐H, Fixed, 95% CI)

‐0.01 [‐0.05, 0.03]

Figuras y tablas -
Comparison 5. Third generation cephalosporins versus conventional antibiotics (high and low/middle‐income countries)