| 1 Respiratory support Show forest plot | 3 | | Mean Difference (IV, Fixed, 95% CI) | Subtotals only |
|
| 1.1 Days of ventilation | 3 | 75 | Mean Difference (IV, Fixed, 95% CI) | ‐8.30 [‐15.82, ‐0.77] |
| 1.2 Days on CPAP | 1 | 21 | Mean Difference (IV, Fixed, 95% CI) | ‐17.1 [‐29.54, ‐4.66] |
| 1.3 Days in oxygen | 2 | 54 | Mean Difference (IV, Fixed, 95% CI) | ‐39.37 [‐64.62, ‐14.12] |
| 1.4 Age at oxygen withdrawal (post conceptional age in weeks) | 1 | 21 | Mean Difference (IV, Fixed, 95% CI) | ‐5.90 [‐8.37, ‐3.43] |
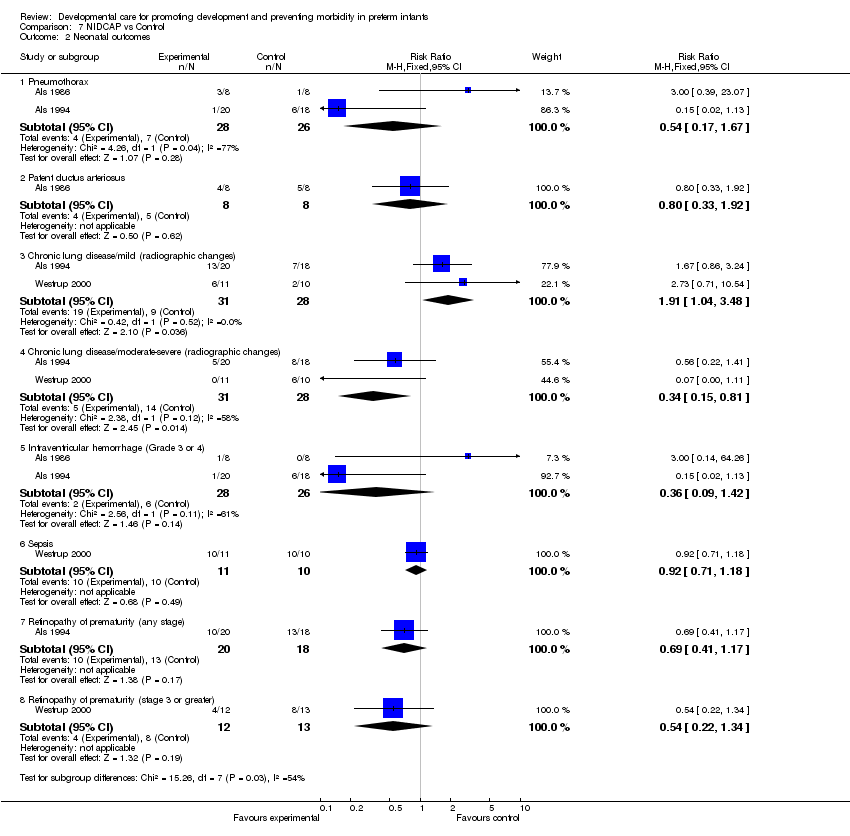
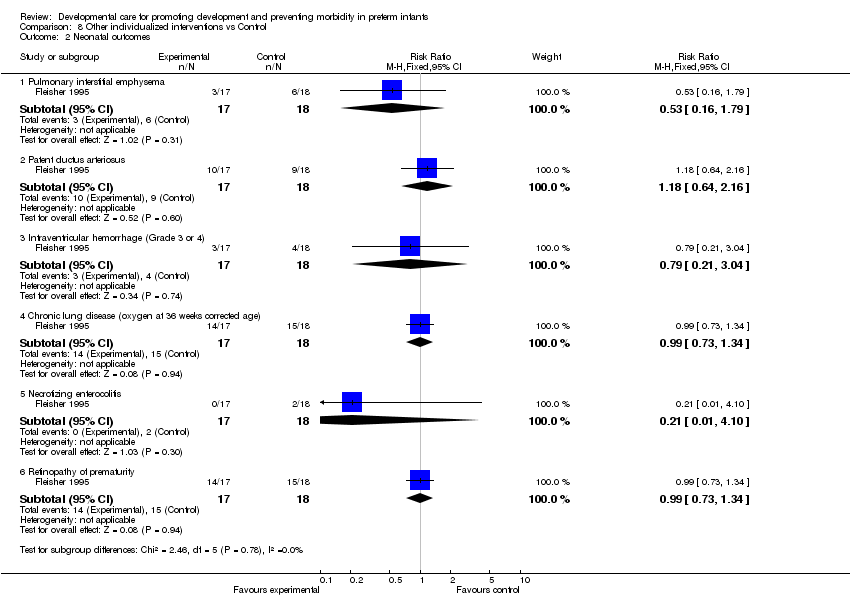
| 2 Neonatal outcomes Show forest plot | 3 | | Risk Ratio (M‐H, Fixed, 95% CI) | Subtotals only |
|
| 2.1 Pneumothorax | 2 | 54 | Risk Ratio (M‐H, Fixed, 95% CI) | 0.54 [0.17, 1.67] |
| 2.2 Patent ductus arteriosus | 1 | 16 | Risk Ratio (M‐H, Fixed, 95% CI) | 0.8 [0.33, 1.92] |
| 2.3 Chronic lung disease/mild (radiographic changes) | 2 | 59 | Risk Ratio (M‐H, Fixed, 95% CI) | 1.91 [1.04, 3.48] |
| 2.4 Chronic lung disease/moderate‐severe (radiographic changes) | 2 | 59 | Risk Ratio (M‐H, Fixed, 95% CI) | 0.34 [0.15, 0.81] |
| 2.5 Intraventricular hemorrhage (Grade 3 or 4) | 2 | 54 | Risk Ratio (M‐H, Fixed, 95% CI) | 0.36 [0.09, 1.42] |
| 2.6 Sepsis | 1 | 21 | Risk Ratio (M‐H, Fixed, 95% CI) | 0.92 [0.71, 1.18] |
| 2.7 Retinopathy of prematurity (any stage) | 1 | 38 | Risk Ratio (M‐H, Fixed, 95% CI) | 0.69 [0.41, 1.17] |
| 2.8 Retinopathy of prematurity (stage 3 or greater) | 1 | 25 | Risk Ratio (M‐H, Fixed, 95% CI) | 0.54 [0.22, 1.34] |
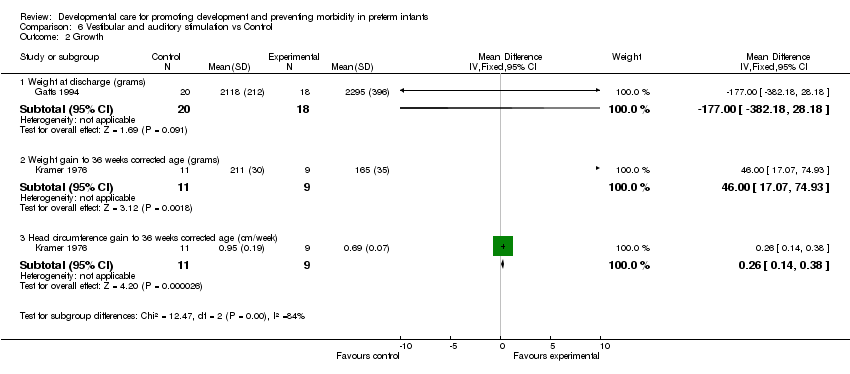
| 3 Feeding and growth Show forest plot | 2 | | Mean Difference (IV, Fixed, 95% CI) | Subtotals only |
|
| 3.1 Days of tube feeding | 2 | 54 | Mean Difference (IV, Fixed, 95% CI) | ‐32.01 [‐48.37, ‐15.65] |
| 3.2 Weight gain (grams/day) | 1 | 38 | Mean Difference (IV, Fixed, 95% CI) | 4.0 [‐0.13, 8.13] |
| 3.3 Weight gain (grams/week, birth to discharge) | 1 | 16 | Mean Difference (IV, Fixed, 95% CI) | 15.0 [‐4.93, 34.93] |
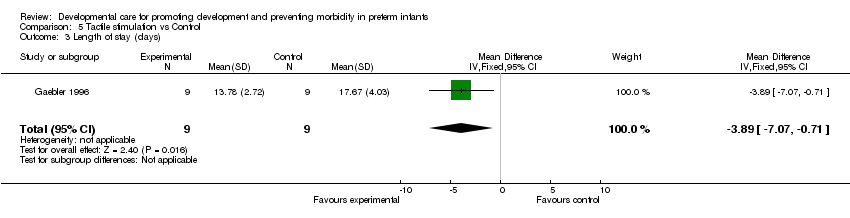
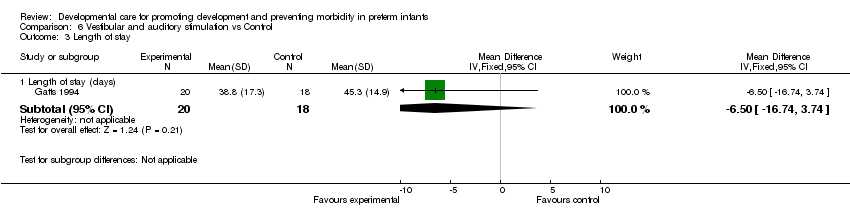
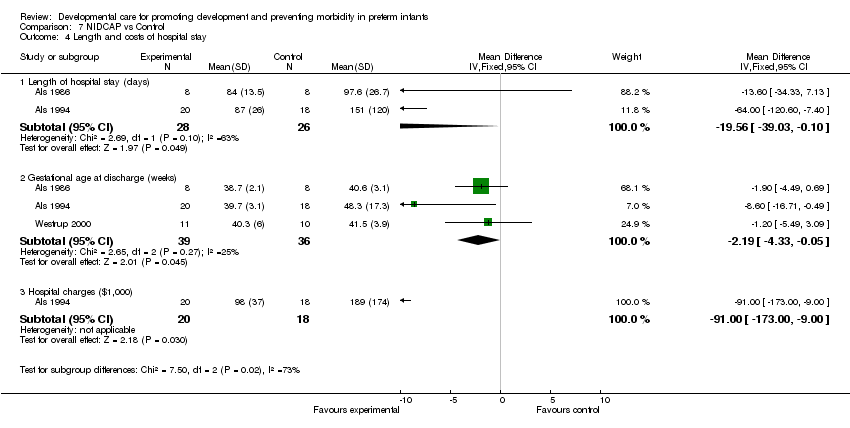
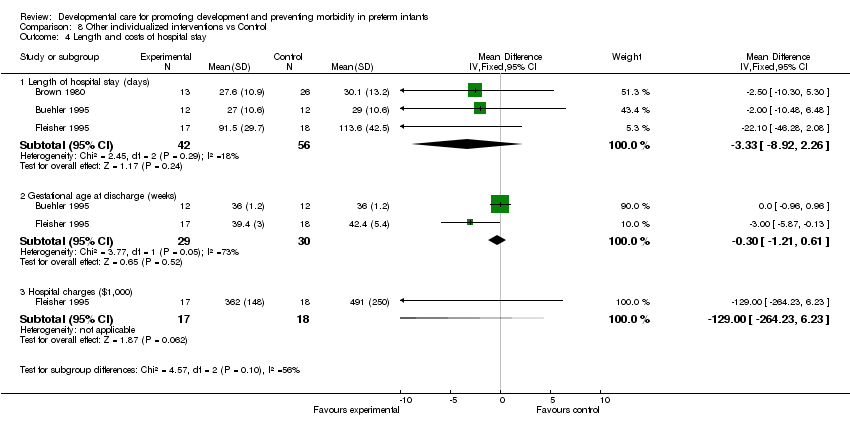
| 4 Length and costs of hospital stay Show forest plot | 3 | | Mean Difference (IV, Fixed, 95% CI) | Subtotals only |
|
| 4.1 Length of hospital stay (days) | 2 | 54 | Mean Difference (IV, Fixed, 95% CI) | ‐19.56 [‐39.03, ‐0.10] |
| 4.2 Gestational age at discharge (weeks) | 3 | 75 | Mean Difference (IV, Fixed, 95% CI) | ‐2.19 [‐4.33, ‐0.05] |
| 4.3 Hospital charges ($1,000) | 1 | 38 | Mean Difference (IV, Fixed, 95% CI) | ‐91.0 [‐173.00, ‐7.00] |
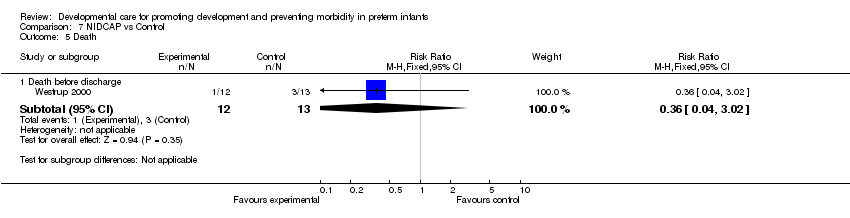
| 5 Death Show forest plot | 1 | | Risk Ratio (M‐H, Fixed, 95% CI) | Subtotals only |
|
| 5.1 Death before discharge | 1 | 25 | Risk Ratio (M‐H, Fixed, 95% CI) | 0.36 [0.04, 3.02] |
| 6 Neurodevelopment Show forest plot | 2 | | Mean Difference (IV, Fixed, 95% CI) | Subtotals only |
|
| 6.1 Bayley MDI (9 months corrected age) | 1 | 36 | Mean Difference (IV, Fixed, 95% CI) | 23.90 [10.19, 37.61] |
| 6.2 Bayley PDI (9 months corrected age) | 1 | 36 | Mean Difference (IV, Fixed, 95% CI) | 22.40 [9.90, 34.90] |
| 6.3 Bayley MDI (12 months corrected age) | 1 | 22 | Mean Difference (IV, Fixed, 95% CI) | 6.90 [‐7.22, 21.02] |
| 6.4 Bayley PDI (12 months corrected age) | 1 | 22 | Mean Difference (IV, Fixed, 95% CI) | ‐4.80 [‐20.39, 10.79] |