Surgery for complete (full‐thickness) rectal prolapse in adults
Referencias
References to studies included in this review
References to studies excluded from this review
References to ongoing studies
Additional references
References to other published versions of this review
Characteristics of studies
Characteristics of included studies [ordered by study ID]
| Methods | Allocation: no details Intention‐to‐treat: no details Exclusion criteria: no details | |
| Participants | Sample size: 21 (13 open, 8 laparoscopic) | |
| Interventions | Laparoscopic stapled mesh (Marlex) rectopexy versus open suture mesh (Mersilene in 6 cases and Marlex in 7) rectopexy. Mesh fixed to anterolateral surfaces of rectum. Lateral ligaments preserved in both groups. | |
| Outcomes | Primary outcome measures
Secondary outcome measures
| |
| Notes | — | |
| Risk of bias | ||
| Bias | Authors' judgement | Support for judgement |
| Random sequence generation (selection bias) | Unclear risk | No information |
| Allocation concealment (selection bias) | Unclear risk | No information |
| Blinding of participants and personnel (performance bias) | Unclear risk | No information |
| Blinding of outcome assessment (detection bias) | Unclear risk | No information |
| Incomplete outcome data (attrition bias) | Low risk | No missing outcome data |
| Selective reporting (reporting bias) | Unclear risk | No information |
| Methods | Allocation: computer generated randomisation Setting: single centre, Italy Exclusion criteria: rectal prolapse < 5 cm, faecal incontinence score < 10, absolute contraindications to surgery, mental disorders, colonoscopy showed inflammatory disease, polyp or cancer (18 patients excluded) | |
| Participants | Sample size: 40 (20 in each group) Sex: 37 females, 3 males | |
| Interventions | Perineal rectosigmoidectomy with Ultracision and stapled anastomosis versus diathermy and handsewn anastomosis | |
| Outcomes | Primary outcome measures
Secondary outcome measures
| |
| Notes | — | |
| Risk of bias | ||
| Bias | Authors' judgement | Support for judgement |
| Random sequence generation (selection bias) | Low risk | Computer generated randomisation |
| Allocation concealment (selection bias) | Low risk | Sealed envelopes |
| Blinding of participants and personnel (performance bias) | Low risk | Surgeons were not blinded. Lack of blinding unlikely to affect outcomes. The assignment of the treatment was made by a nurse on the ward before the operation. Another nurse in the operating room measured the duration of the operation, the length of fresh resected tissue and the blood loss. |
| Blinding of outcome assessment (detection bias) | Low risk | Independent nurse measured intraoperative parameters and some objective measurements post‐op |
| Incomplete outcome data (attrition bias) | Low risk | No missing outcome data |
| Selective reporting (reporting bias) | Unclear risk | Insufficient information |
| Methods | Allocation: random number tables Withdrawals: no details Intention‐to‐treat: no details Inclusion criteria: no details Exclusion criteria: no details | |
| Participants | Sample size: 20 (10 per group) | |
| Interventions | Perineal rectosigmoidectomy and pelvic floor repair versus abdominal resection rectopexy with pelvic floor repair | |
| Outcomes | Primary outcome measures
Secondary outcome measures
| |
| Notes | — | |
| Risk of bias | ||
| Bias | Authors' judgement | Support for judgement |
| Random sequence generation (selection bias) | Low risk | Random numbers table |
| Allocation concealment (selection bias) | Unclear risk | No information |
| Blinding of participants and personnel (performance bias) | Unclear risk | No information |
| Blinding of outcome assessment (detection bias) | Low risk | Independent assessor not from surgical team |
| Incomplete outcome data (attrition bias) | Low risk | No missing data |
| Selective reporting (reporting bias) | Unclear risk | Insufficient data |
| Methods | Allocation: no details Withdrawals: no details Intention‐to‐treat: no details Inclusion criteria: no details Exclusion criteria: no details | |
| Participants | Sample size: 37 (17 polypropylene mesh, 20 polyglycolic mesh) | |
| Interventions | Open polyglycolic acid mesh suture rectopexy versus open polypropylene mesh suture rectopexy. Mesh fixed to anterolateral surfaces of rectum. Lateral ligaments preserved in both groups. | |
| Outcomes | Primary outcome measures
Secondary outcome measures
| |
| Notes | — | |
| Risk of bias | ||
| Bias | Authors' judgement | Support for judgement |
| Random sequence generation (selection bias) | Unclear risk | No information |
| Allocation concealment (selection bias) | Unclear risk | No information |
| Blinding of participants and personnel (performance bias) | Unclear risk | No information |
| Blinding of outcome assessment (detection bias) | Unclear risk | No information |
| Incomplete outcome data (attrition bias) | Unclear risk | No information |
| Selective reporting (reporting bias) | Unclear risk | No information |
| Methods | Allocation: central allocation Blinding: participants were blind to intervention Follow‐up period: 5 years Setting: multicentre, Austria, Brazil, Canada, Czech Republic, Eygpt, Greece, Hungary, India, Iran, Italy, Korea, Lithuania, New Zealand, Poland, Serbia, Spain, Switzerland, Turkey, USA Withdrawals: one (allocated to rectopexy group), lost to follow‐up (8 in rectopexy group and 18 in no rectopexy group) Intention‐to‐treat: yes Inclusion criteria: > 18 years medically fit with full‐thickness rectal prolapse Exclusion criteria: failure to sign informed consent, unfit for general anaesthesia, prior surgery for rectal prolapse, concomitant pelvic floor descent | |
| Participants | Sample size: 252 (136 in rectopexy group, 116 in no rectopexy group) Median age: 56.5 years (range 17‐93 years) | |
| Interventions | Rectopexy versus rectal mobilisation only (no rectopexy). Operation was performed either with open or laparoscopic approach, and sigmoid resection (not randomised) was performed in participants with constipation. | |
| Outcomes | Primary outcome measures
Secondary outcome measures
| |
| Notes | — | |
| Risk of bias | ||
| Bias | Authors' judgement | Support for judgement |
| Random sequence generation (selection bias) | Low risk | Central allocation |
| Allocation concealment (selection bias) | Low risk | Central allocation |
| Blinding of participants and personnel (performance bias) | Low risk | Participants were blinded to intervention |
| Blinding of outcome assessment (detection bias) | Unclear risk | No information |
| Incomplete outcome data (attrition bias) | High risk | 26/252 lost to follow‐up in the trial, 8/136 (6%) lost to follow‐up in rectopexy group, 18/116 (16%) lost to follow‐up in non rectopexy group, imbalance of lost to follow‐up between two groups |
| Selective reporting (reporting bias) | Low risk | Protocol was available with pre‐specified outcome |
| Methods | Allocation: sealed envelopes Follow‐up period: 6 months Withdrawals: no details Intention‐to‐treat: no details Inclusion criteria: no details Exclusion criteria: no details | |
| Participants | Sample size: 30 (15 per group) | |
| Interventions | Open resection (sigmoid) and suture rectopexy versus open (polyglycolic acid) mesh rectopexy | |
| Outcomes | Primary outcome measures
Secondary outcome measures
| |
| Notes | — | |
| Risk of bias | ||
| Bias | Authors' judgement | Support for judgement |
| Random sequence generation (selection bias) | Unclear risk | No information |
| Allocation concealment (selection bias) | Low risk | Sealed envelopes |
| Blinding of participants and personnel (performance bias) | Unclear risk | No information |
| Blinding of outcome assessment (detection bias) | Low risk | Many were objective measurements |
| Incomplete outcome data (attrition bias) | Unclear risk | No information |
| Selective reporting (reporting bias) | Unclear risk | No information |
| Methods | Allocation: no details Withdrawals: one patient in rectopexy group had thrombosis of retinal vein and was excluded (before operation) Intention‐to‐treat: no details Inclusion criteria: no details Exclusion criteria: no details | |
| Participants | Sample size: 18 | |
| Interventions | Open sigmoid resection and suture rectopexy versus open abdominal suture rectopexy | |
| Outcomes | Primary outcome measures
Secondary outcome measures
| |
| Notes | — | |
| Risk of bias | ||
| Bias | Authors' judgement | Support for judgement |
| Random sequence generation (selection bias) | Unclear risk | No information |
| Allocation concealment (selection bias) | Unclear risk | No information |
| Blinding of participants and personnel (performance bias) | Unclear risk | No information |
| Blinding of outcome assessment (detection bias) | Low risk | Many were objective measurements |
| Incomplete outcome data (attrition bias) | Unclear risk | No information |
| Selective reporting (reporting bias) | Unclear risk | No information |
| Methods | Allocation: drawing lots Inclusion criteria: no details Exclusion criteria: no details | |
| Participants | Sample size: 18 (10 ligaments divided, 8 ligaments preserved) | |
| Interventions | Posterior mesh rectopexy (Well's procedure) with division versus preservation of the lateral ligaments | |
| Outcomes | Primary outcome measures
Secondary outcome measures
| |
| Notes | — | |
| Risk of bias | ||
| Bias | Authors' judgement | Support for judgement |
| Random sequence generation (selection bias) | Low risk | Drawing lots |
| Allocation concealment (selection bias) | Unclear risk | No information |
| Blinding of participants and personnel (performance bias) | Unclear risk | No information |
| Blinding of outcome assessment (detection bias) | Unclear risk | No information |
| Incomplete outcome data (attrition bias) | Unclear risk | No information |
| Selective reporting (reporting bias) | Unclear risk | No information |
| Methods | Allocation: random number tables Intention‐to‐treat: no details Inclusion criteria: no details Exclusion criteria: no details | |
| Participants | Sample size: 63 | |
| Interventions | Open abdominal Ivalon sponge rectopexy versus open abdominal suture rectopexy. Mesh fixed to anterolateral surfaces of rectum. Lateral ligaments divided. | |
| Outcomes | Primary outcome measures
Secondary outcome measures
| |
| Notes | — | |
| Risk of bias | ||
| Bias | Authors' judgement | Support for judgement |
| Random sequence generation (selection bias) | Low risk | Random numbers table |
| Allocation concealment (selection bias) | Unclear risk | No information |
| Blinding of participants and personnel (performance bias) | Unclear risk | No information |
| Blinding of outcome assessment (detection bias) | Unclear risk | No information |
| Incomplete outcome data (attrition bias) | Unclear risk | 12/63 died unrelated to surgery during follow‐up period |
| Selective reporting (reporting bias) | Unclear risk | No information |
| Methods | Allocation: no details Withdrawals: no details Intention‐to‐treat: no details Inclusion criteria: no details Exclusion criteria: no details | |
| Participants | Sample size: 20 | |
| Interventions | Anteroposterior Marlex rectopexy with either division or preservation of the lateral ligaments | |
| Outcomes | Primary outcome measures
Secondary outcome measures
| |
| Notes | Abstract. Limited information available. Numerical raw data were not reported Postoperative symptoms (e.g. constipation) were reported to be significantly better in the group without division of the lateral ligaments. Continence improved significantly in both groups. | |
| Risk of bias | ||
| Bias | Authors' judgement | Support for judgement |
| Random sequence generation (selection bias) | Unclear risk | No information |
| Allocation concealment (selection bias) | Unclear risk | No information |
| Blinding of participants and personnel (performance bias) | Unclear risk | No information |
| Blinding of outcome assessment (detection bias) | Unclear risk | No information |
| Incomplete outcome data (attrition bias) | Unclear risk | No information |
| Selective reporting (reporting bias) | Unclear risk | No information |
| Methods | Allocation: central allocation Blinding: no details Follow‐up period: 3 years Setting: multicentre, India, Finland, Serbia, Spain, UK Withdrawals: 15 patients did not have surgery, including 1 who died and 1 who withdrew from the trial. No details on 8 patients with regards to surgery or follow‐up Intention‐to‐treat: yes Inclusion criteria: adult participants with first presentation of full‐thickness prolapse Exclusion criteria: no details | |
| Participants | Sample size: 293 Mean age: 73 years in perineal randomised group; 58 years in abdominal randomised group Sex: 251 females, 42 males | |
| Interventions | Abdominal compared with perineal surgery; Delorme's operation compared with Altemeier's operation; suture rectopexy compared with resection rectopexy | |
| Outcomes | Primary outcome measures
Secondary outcome measures
| |
| Notes | A pragmatic, factorial (2 x 2) design trial; participants could be randomised to abdominal or perineal surgery. For abdominal surgery, participants could be randomised between suture rectopexy and resection rectopexy. The abdominal procedure was performed through an open or laparoscopic approach, depending on surgeon's preference. For perineal surgery, participants could be randomised to a Delorme's or an Altemeier's procedure. It was the surgeon's choice to participate in either one or both of the randomisations. A video was provided to assist training in all the operations. The original protocol was powered to recruit 950 participants to detect a 5% difference in recurrence between abdominal and perineal approaches. Due to slow uptake of participants, the target was revised to detect a difference in quality of life or level of incontinence (Vaizey score) by recruiting 300 participants. | |
| Risk of bias | ||
| Bias | Authors' judgement | Support for judgement |
| Random sequence generation (selection bias) | Low risk | Computer generated randomisation |
| Allocation concealment (selection bias) | Low risk | Central allocation |
| Blinding of participants and personnel (performance bias) | Unclear risk | No information |
| Blinding of outcome assessment (detection bias) | Unclear risk | No information |
| Incomplete outcome data (attrition bias) | Unclear risk | 8/293 lost to follow‐up |
| Selective reporting (reporting bias) | Low risk | Protocol was available with pre‐specified outcomes |
| Methods | Allocation: no details Setting: single centre, Australia Exclusion criteria: people for whom concomitant gynaecological procedures were planned, people who had undergone previous rectopexy, people with a large irreducible prolapse | |
| Participants | Sample size: 39 (20 laparoscopic, 19 open). Initially 40 patients were randomised and one patient randomised to the open group refused any surgery and was excluded from the analysis. Subsequently the trial committee met and this patient underwent laparoscopic rectopexy and included the data in the open group (intention‐to‐treat analysis) | |
| Interventions | Laparoscopic versus open abdominal rectopexy. Mesh secured to the sacral promontory with a single spiked chromium staple and to the lateral rectum using hernia staples. | |
| Outcomes | Primary outcome measures
Secondary outcome measures
| |
| Notes | — | |
| Risk of bias | ||
| Bias | Authors' judgement | Support for judgement |
| Random sequence generation (selection bias) | Unclear risk | No information |
| Allocation concealment (selection bias) | Unclear risk | No information |
| Blinding of participants and personnel (performance bias) | Low risk | Lack of blinding unlikely to influence outcomes. Surgeons and patients were not blinded but assessors were. |
| Blinding of outcome assessment (detection bias) | Low risk | Blinded assessors |
| Incomplete outcome data (attrition bias) | Unclear risk | No information |
| Selective reporting (reporting bias) | Unclear risk | Insufficient information |
| Methods | Allocation: no details Withdrawals: no details Intention‐to‐treat: no details Inclusion criteria: no details Exclusion criteria: no details | |
| Participants | Sample size: 26 (14 divided ligaments, 12 preserved ligaments) | |
| Interventions | Open mesh rectopexy with division of lateral ligaments versus open polypropylene mesh rectopexy with preservation of lateral ligaments. | |
| Outcomes | Primary outcome measures
Secondary outcome measures
| |
| Notes | — | |
| Risk of bias | ||
| Bias | Authors' judgement | Support for judgement |
| Random sequence generation (selection bias) | Unclear risk | No information |
| Allocation concealment (selection bias) | Unclear risk | No information |
| Blinding of participants and personnel (performance bias) | Low risk | Outcomes unlikely to be influenced by lack of blinding of the surgeons, as assessors were blinded. |
| Blinding of outcome assessment (detection bias) | Low risk | Outcomes assessors were blinded |
| Incomplete outcome data (attrition bias) | Unclear risk | 2/26 declined further tests post‐op |
| Selective reporting (reporting bias) | Unclear risk | No information |
| Methods | Allocation: random number tables Withdrawals: 12 patients lost to follow‐up; no details Intention‐to‐treat: no details Inclusion criteria: no details Exclusion criteria: no details | |
| Participants | Sample size: 47 (30 polyglycolic acid mesh, 17 polyglactin) | |
| Interventions | Open abdominal mesh (polyglycolic acid) rectopexy versus open abdominal mesh rectopexy (polyglactin). Lateral ligaments preserved in both groups. Mesh fashioned as an anterior sling. | |
| Outcomes | Primary outcome measures
Secondary outcome measures
| |
| Notes | — | |
| Risk of bias | ||
| Bias | Authors' judgement | Support for judgement |
| Random sequence generation (selection bias) | Low risk | Random numbers table |
| Allocation concealment (selection bias) | Unclear risk | No information |
| Blinding of participants and personnel (performance bias) | Low risk | Outcomes unlikely influenced by lack of blinding |
| Blinding of outcome assessment (detection bias) | Unclear risk | No information |
| Incomplete outcome data (attrition bias) | Unclear risk | 12/47 lost to follow‐up |
| Selective reporting (reporting bias) | Unclear risk | No information |
| Methods | Allocation: closed envelope Blinding: outcome assessment was blinded Follow‐up period: one year Setting: single centre, Egypt Withdrawals: all patients randomised received treatments, two lost to follow‐up in Delorme's group and one lost to follow‐up in Delorme's with postanal repair/levatorplasty Intention‐to‐treat: yes Inclusioncriteria: full‐thickness rectal prolapse Exclusion criteria: pregnant, previous anal surgery, pudendal nerve neuropathy, anal fistula, sepsis, age > 80 years, vascular disease, scleroderma, malnutrition and coagulopathy | |
| Participants | Sample size: 82 Mean age: 40 years (range 16‐64 years) Sex: 51 females, 31 males | |
| Interventions | Delorme's procedure versus Delorme's with postanal repair/levatorplasty | |
| Outcomes | Primary outcome measures
Secondary outcome measures
| |
| Notes | Constipation was assessed using Wexner score, and incontinence was graded using Pescatori classification. | |
| Risk of bias | ||
| Bias | Authors' judgement | Support for judgement |
| Random sequence generation (selection bias) | Unclear risk | No details |
| Allocation concealment (selection bias) | Low risk | Closed envelopes |
| Blinding of participants and personnel (performance bias) | Low risk | No details about blinding of participants in article but mentioned in the study protocol |
| Blinding of outcome assessment (detection bias) | Low risk | Outcome assessment was blinded |
| Incomplete outcome data (attrition bias) | Low risk | Lost to follow‐up: 3/82 (n = 1 Delorme's/levatorplasty, n = 2 Delorme's) |
| Selective reporting (reporting bias) | Unclear risk | Study protocol first published in July 2012, after the study completed recruiting participants. There was no patient's satisfaction score mentioned in the study protocol. |
EQ‐5D: EuroQol survey that measures quality of life in five dimensions.
Characteristics of excluded studies [ordered by study ID]
| Study | Reason for exclusion |
| Treatment for rectal mucosal prolapse (not full‐thickness) | |
| Not an RCT | |
| Not an RCT |
RCT: randomised controlled trial.
Characteristics of ongoing studies [ordered by study ID]
| Trial name or title | Randomised controlled trial of laparoscopic resection rectopexy compared with fixation rectopexy for rectal prolapse |
| Methods | No information available |
| Participants | People with full‐thickness rectal prolapse Target sample size: 132 |
| Interventions | Laparoscopic resection rectopexy versus fixation rectopexy |
| Outcomes | Constipation, incontinence, quality of life, postoperative pain, time to return of bowel function, postoperative morbidity, length of hospital stay, recurrence |
| Starting date | January 2006 |
| Contact information | Professor Michael Solomon, Surgical Outcomes Research Centre, P.O. Box M157 Missenden Road, Camperdown, NSW 2050, Australia |
| Notes | — |
| Trial name or title | DeloRes |
| Methods | No information available |
| Participants | People with full‐thickness rectal prolapse. 130 participants will be recruited |
| Interventions | Delorme's procedure versus laparoscopic resection rectopexy |
| Outcomes | Recurrence, operating time, mortality and morbidity, hospital stay, quality of life, constipation, incontinence |
| Starting date | 13 October 2010 |
| Contact information | Mr Florian Herrie, University Medical Centre Mannheim, Theodor‐Kutzer‐Ufer 1‐3, 68167 Mannheim, Germany |
| Notes | — |
| Trial name or title | Robotic‐assisted versus laparoscopic ventral rectopexy in the treatment of rectal prolapse or intussusception |
| Methods | No information available |
| Participants | People with full‐thickness rectal prolapse or enterocoele with intussusception 30 participants were recruited |
| Interventions | Robotic‐assisted ventral rectopexy versus laparoscopic ventral rectopexy |
| Outcomes | Perioperative parameters, complications, short‐term results, functional outcomes, quality of life, anatomic changes (measured by MR defecography) |
| Starting date | February 2012 |
| Contact information | Professor Jyrki Makela, University Hospital of Oulu, Department of Surgery, Division of Gastroenterology, P.O. Box 5000, Oulu, 90140, Finland |
| Notes | Trial finished in August 2014 and awaiting for results |
| Trial name or title | Laparoscopic posterior rectopexy without mesh versus laparoscopic anterior mesh rectopexy for rectal prolapse |
| Methods | No information available |
| Participants | People with full‐thickness rectal prolapse. 64 participants will be recruited. |
| Interventions | Laparoscopic anterior mesh rectopexy versus laparoscopic posterior rectopexy |
| Outcomes | Severity of obstructive defecation, constipation score, obstructed defecation syndrome score, physiology testing of anorectum. |
| Starting date | June 2006 |
| Contact information | Professor Soren Laurberg, Aarhus University Hospital, Department of Surgery, Denmark |
| Notes | — |
| Trial name or title | Anterior mesh rectopexy in the treatment of rectal prolapse |
| Methods | No information available |
| Participants | People with full‐thickness rectal prolapse 30 female participants were recruited |
| Interventions | Standard mesh rectopexy versus ventral mesh rectopexy |
| Outcomes | Constipation, incontinence, recurrence, postoperative complications |
| Starting date | June 2005 |
| Contact information | Dr Valerio Celentano, address (no information available) |
| Notes | — |
MR: magnetic resonance
Data and analyses
| Outcome or subgroup title | No. of studies | No. of participants | Statistical method | Effect size |
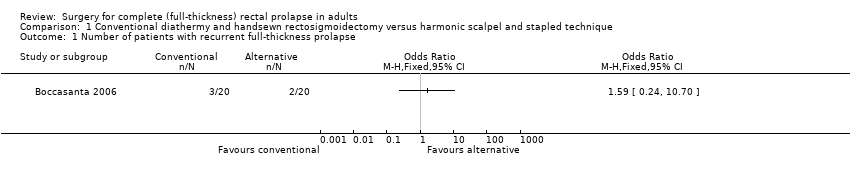
| 1 Number of patients with recurrent full‐thickness prolapse Show forest plot | 1 | Odds Ratio (M‐H, Fixed, 95% CI) | Totals not selected | |
| Analysis 1.1  Comparison 1 Conventional diathermy and handsewn rectosigmoidectomy versus harmonic scalpel and stapled technique, Outcome 1 Number of patients with recurrent full‐thickness prolapse. | ||||
| 2 Incontinence score Show forest plot | 1 | Mean Difference (IV, Fixed, 95% CI) | Totals not selected | |
| Analysis 1.2 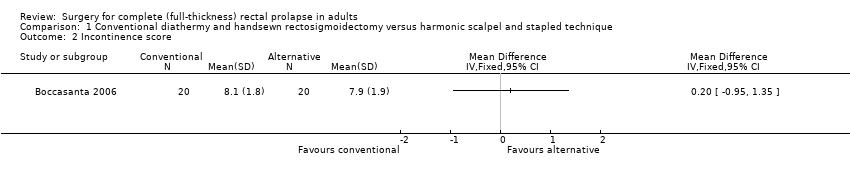 Comparison 1 Conventional diathermy and handsewn rectosigmoidectomy versus harmonic scalpel and stapled technique, Outcome 2 Incontinence score. | ||||
| 3 Hospital stay Show forest plot | 1 | Mean Difference (IV, Fixed, 95% CI) | Totals not selected | |
| Analysis 1.3  Comparison 1 Conventional diathermy and handsewn rectosigmoidectomy versus harmonic scalpel and stapled technique, Outcome 3 Hospital stay. | ||||
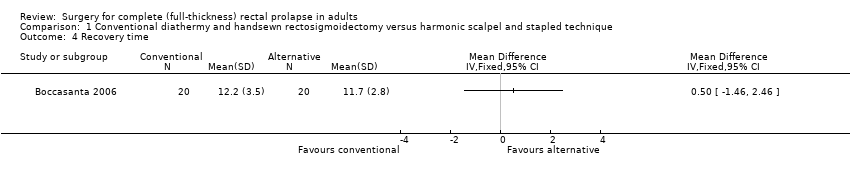
| 4 Recovery time Show forest plot | 1 | Mean Difference (IV, Fixed, 95% CI) | Totals not selected | |
| Analysis 1.4  Comparison 1 Conventional diathermy and handsewn rectosigmoidectomy versus harmonic scalpel and stapled technique, Outcome 4 Recovery time. | ||||
| 5 Number of patients with defecatory problems Show forest plot | 1 | Odds Ratio (M‐H, Fixed, 95% CI) | Totals not selected | |
| Analysis 1.5  Comparison 1 Conventional diathermy and handsewn rectosigmoidectomy versus harmonic scalpel and stapled technique, Outcome 5 Number of patients with defecatory problems. | ||||
| 6 Resting anal pressure (mmHg) Show forest plot | 1 | Mean Difference (IV, Fixed, 95% CI) | Totals not selected | |
| Analysis 1.6  Comparison 1 Conventional diathermy and handsewn rectosigmoidectomy versus harmonic scalpel and stapled technique, Outcome 6 Resting anal pressure (mmHg). | ||||
| 7 Squeeze pressure (mmHg) Show forest plot | 1 | Mean Difference (IV, Fixed, 95% CI) | Totals not selected | |
| Analysis 1.7 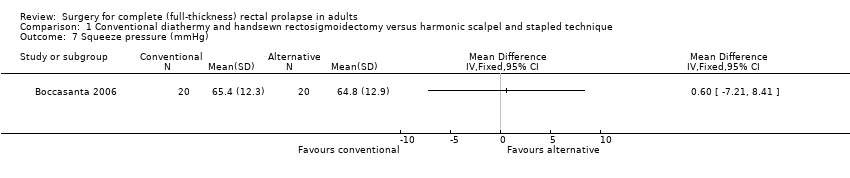 Comparison 1 Conventional diathermy and handsewn rectosigmoidectomy versus harmonic scalpel and stapled technique, Outcome 7 Squeeze pressure (mmHg). | ||||
| 8 Threshold volume (ml) Show forest plot | 1 | Mean Difference (IV, Fixed, 95% CI) | Totals not selected | |
| Analysis 1.8 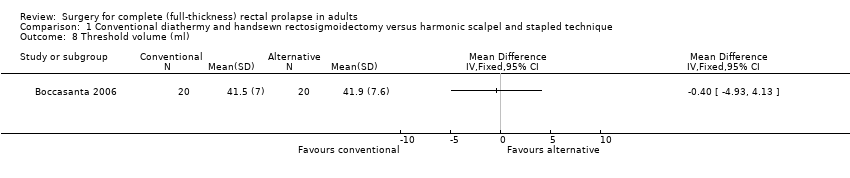 Comparison 1 Conventional diathermy and handsewn rectosigmoidectomy versus harmonic scalpel and stapled technique, Outcome 8 Threshold volume (ml). | ||||
| Outcome or subgroup title | No. of studies | No. of participants | Statistical method | Effect size |
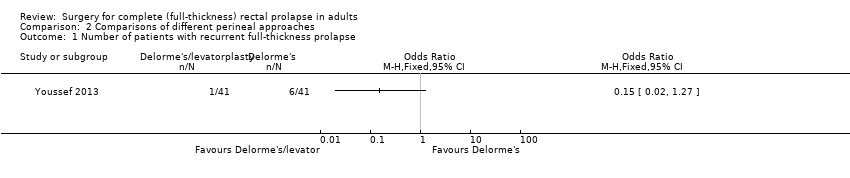
| 1 Number of patients with recurrent full‐thickness prolapse Show forest plot | 1 | Odds Ratio (M‐H, Fixed, 95% CI) | Totals not selected | |
| Analysis 2.1  Comparison 2 Comparisons of different perineal approaches, Outcome 1 Number of patients with recurrent full‐thickness prolapse. | ||||
| 2 Number of patients with residual faecal incontinence Show forest plot | 1 | Odds Ratio (M‐H, Fixed, 95% CI) | Totals not selected | |
| Analysis 2.2 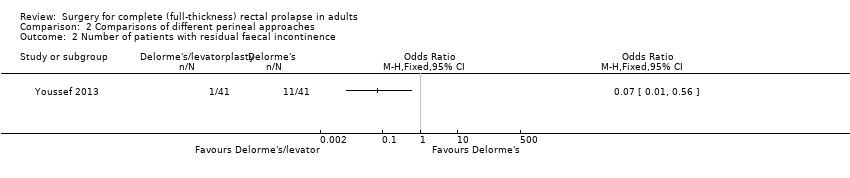 Comparison 2 Comparisons of different perineal approaches, Outcome 2 Number of patients with residual faecal incontinence. | ||||
| 3 Number of patients with constipation after surgery Show forest plot | 1 | Odds Ratio (M‐H, Fixed, 95% CI) | Totals not selected | |
| Analysis 2.3  Comparison 2 Comparisons of different perineal approaches, Outcome 3 Number of patients with constipation after surgery. | ||||
| 4 Operating time (min) Show forest plot | 1 | Mean Difference (IV, Fixed, 95% CI) | Totals not selected | |
| Analysis 2.4  Comparison 2 Comparisons of different perineal approaches, Outcome 4 Operating time (min). | ||||
| 5 Number of patients with postoperative complications Show forest plot | 1 | Odds Ratio (M‐H, Fixed, 95% CI) | Totals not selected | |
| Analysis 2.5  Comparison 2 Comparisons of different perineal approaches, Outcome 5 Number of patients with postoperative complications. | ||||
| 6 Length of hospital stay (days) Show forest plot | 1 | Mean Difference (IV, Fixed, 95% CI) | Totals not selected | |
| Analysis 2.6 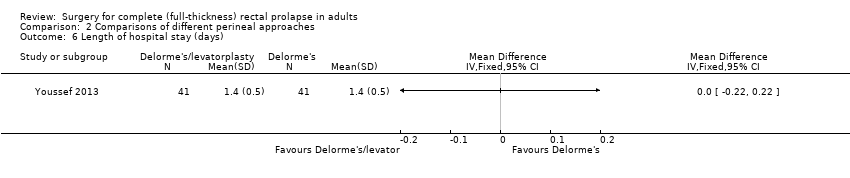 Comparison 2 Comparisons of different perineal approaches, Outcome 6 Length of hospital stay (days). | ||||
| 7 Postoperative maximum resting pressure Show forest plot | 1 | Mean Difference (IV, Fixed, 95% CI) | Totals not selected | |
| Analysis 2.7  Comparison 2 Comparisons of different perineal approaches, Outcome 7 Postoperative maximum resting pressure. | ||||
| 8 Postoperative maximum squeeze pressure Show forest plot | 1 | Mean Difference (IV, Fixed, 95% CI) | Totals not selected | |
| Analysis 2.8 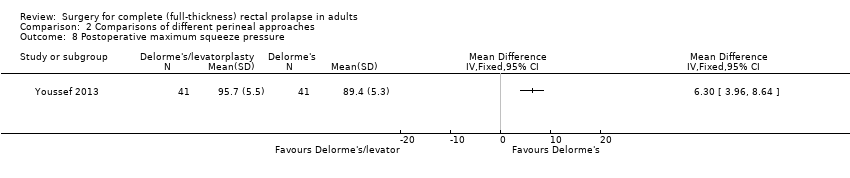 Comparison 2 Comparisons of different perineal approaches, Outcome 8 Postoperative maximum squeeze pressure. | ||||
| 9 Postoperative rectal sensation Show forest plot | 1 | Mean Difference (IV, Fixed, 95% CI) | Totals not selected | |
| Analysis 2.9 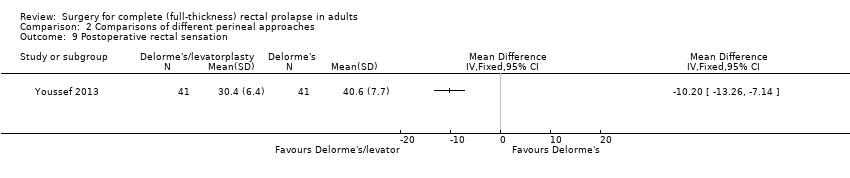 Comparison 2 Comparisons of different perineal approaches, Outcome 9 Postoperative rectal sensation. | ||||
| 10 Patient's postoperative satisfaction score Show forest plot | 1 | Mean Difference (IV, Fixed, 95% CI) | Totals not selected | |
| Analysis 2.10  Comparison 2 Comparisons of different perineal approaches, Outcome 10 Patient's postoperative satisfaction score. | ||||
| 11 Number of patients with recurrent full‐thickness prolapse Show forest plot | 1 | Odds Ratio (M‐H, Fixed, 95% CI) | Totals not selected | |
| Analysis 2.11 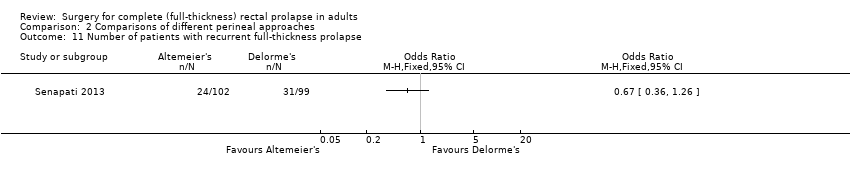 Comparison 2 Comparisons of different perineal approaches, Outcome 11 Number of patients with recurrent full‐thickness prolapse. | ||||
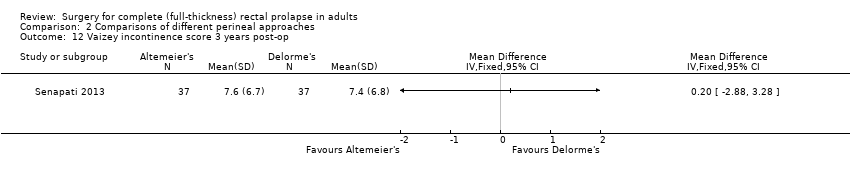
| 12 Vaizey incontinence score 3 years post‐op Show forest plot | 1 | Mean Difference (IV, Fixed, 95% CI) | Totals not selected | |
| Analysis 2.12  Comparison 2 Comparisons of different perineal approaches, Outcome 12 Vaizey incontinence score 3 years post‐op. | ||||
| 13 Bowel function (bowel thermometer) 3 years post‐op Show forest plot | 1 | Mean Difference (IV, Fixed, 95% CI) | Totals not selected | |
| Analysis 2.13 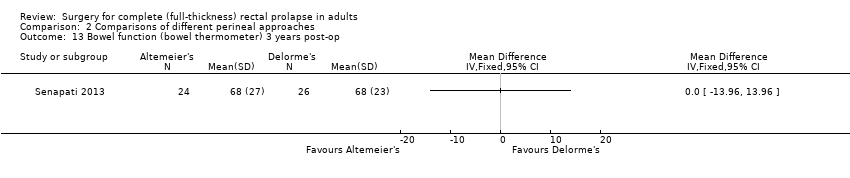 Comparison 2 Comparisons of different perineal approaches, Outcome 13 Bowel function (bowel thermometer) 3 years post‐op. | ||||
| 14 Quality of life score (EQ‐5D) at 3 years Show forest plot | 1 | Mean Difference (IV, Fixed, 95% CI) | Totals not selected | |
| Analysis 2.14 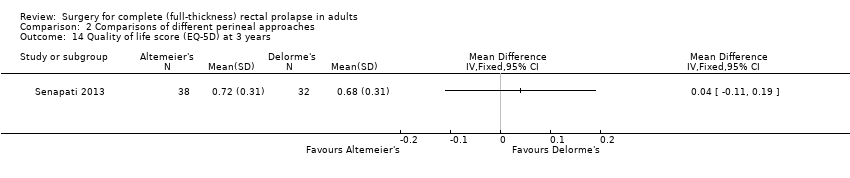 Comparison 2 Comparisons of different perineal approaches, Outcome 14 Quality of life score (EQ‐5D) at 3 years. | ||||
| Outcome or subgroup title | No. of studies | No. of participants | Statistical method | Effect size |
| 1 Number of patients with recurrent full‐thickness prolapse Show forest plot | 1 | Odds Ratio (M‐H, Fixed, 95% CI) | Totals not selected | |
| Analysis 3.1 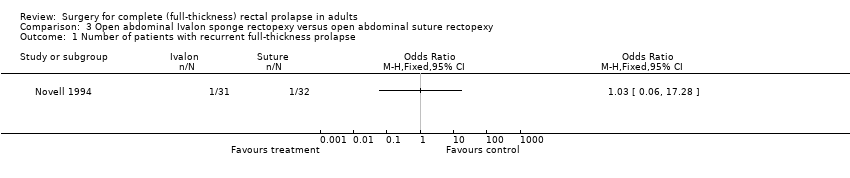 Comparison 3 Open abdominal Ivalon sponge rectopexy versus open abdominal suture rectopexy, Outcome 1 Number of patients with recurrent full‐thickness prolapse. | ||||
| 2 Number of patients with postoperative faecal incontinence Show forest plot | 1 | Odds Ratio (M‐H, Fixed, 95% CI) | Totals not selected | |
| Analysis 3.2  Comparison 3 Open abdominal Ivalon sponge rectopexy versus open abdominal suture rectopexy, Outcome 2 Number of patients with postoperative faecal incontinence. | ||||
| 3 Number of patients with constipation after surgery Show forest plot | 1 | Odds Ratio (M‐H, Fixed, 95% CI) | Totals not selected | |
| Analysis 3.3  Comparison 3 Open abdominal Ivalon sponge rectopexy versus open abdominal suture rectopexy, Outcome 3 Number of patients with constipation after surgery. | ||||
| 4 Number of patients with postoperative complications Show forest plot | 1 | Odds Ratio (M‐H, Fixed, 95% CI) | Totals not selected | |
| Analysis 3.4  Comparison 3 Open abdominal Ivalon sponge rectopexy versus open abdominal suture rectopexy, Outcome 4 Number of patients with postoperative complications. | ||||
| Outcome or subgroup title | No. of studies | No. of participants | Statistical method | Effect size |
| 1 Number of patients with recurrent full‐thickness prolapse Show forest plot | 2 | Odds Ratio (M‐H, Fixed, 95% CI) | Totals not selected | |
| Analysis 4.1  Comparison 4 Open abdominal polyglycolic acid mesh versus open polyglactin or polypropylene mesh rectopexy, Outcome 1 Number of patients with recurrent full‐thickness prolapse. | ||||
| 1.1 Polyglycolic versus polypropylene | 1 | Odds Ratio (M‐H, Fixed, 95% CI) | 0.0 [0.0, 0.0] | |
| 1.2 Polyglycolic versus polyglactin | 1 | Odds Ratio (M‐H, Fixed, 95% CI) | 0.0 [0.0, 0.0] | |
| 2 Number of patients with residual mucosal prolapse Show forest plot | 2 | Odds Ratio (M‐H, Fixed, 95% CI) | Totals not selected | |
| Analysis 4.2 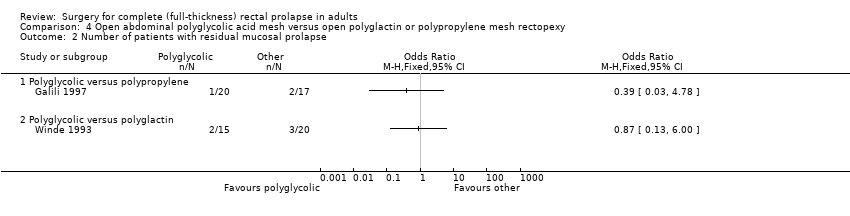 Comparison 4 Open abdominal polyglycolic acid mesh versus open polyglactin or polypropylene mesh rectopexy, Outcome 2 Number of patients with residual mucosal prolapse. | ||||
| 2.1 Polyglycolic versus polypropylene | 1 | Odds Ratio (M‐H, Fixed, 95% CI) | 0.0 [0.0, 0.0] | |
| 2.2 Polyglycolic versus polyglactin | 1 | Odds Ratio (M‐H, Fixed, 95% CI) | 0.0 [0.0, 0.0] | |
| 3 Number of patients with residual faecal incontinence Show forest plot | 1 | Odds Ratio (M‐H, Fixed, 95% CI) | Totals not selected | |
| Analysis 4.3  Comparison 4 Open abdominal polyglycolic acid mesh versus open polyglactin or polypropylene mesh rectopexy, Outcome 3 Number of patients with residual faecal incontinence. | ||||
| 3.1 Polyglycolic versus polypropylene | 0 | Odds Ratio (M‐H, Fixed, 95% CI) | 0.0 [0.0, 0.0] | |
| 3.2 Polyglycolic versus polyglactin | 1 | Odds Ratio (M‐H, Fixed, 95% CI) | 0.0 [0.0, 0.0] | |
| 4 Incontinence score Show forest plot | 1 | Mean Difference (IV, Fixed, 95% CI) | Totals not selected | |
| Analysis 4.4 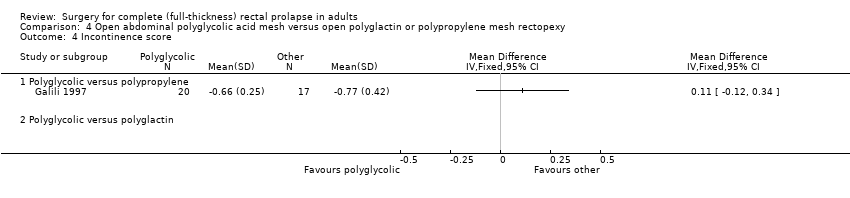 Comparison 4 Open abdominal polyglycolic acid mesh versus open polyglactin or polypropylene mesh rectopexy, Outcome 4 Incontinence score. | ||||
| 4.1 Polyglycolic versus polypropylene | 1 | Mean Difference (IV, Fixed, 95% CI) | 0.0 [0.0, 0.0] | |
| 4.2 Polyglycolic versus polyglactin | 0 | Mean Difference (IV, Fixed, 95% CI) | 0.0 [0.0, 0.0] | |
| 5 Number of patients with constipation after surgery Show forest plot | 2 | Odds Ratio (M‐H, Fixed, 95% CI) | Totals not selected | |
| Analysis 4.5  Comparison 4 Open abdominal polyglycolic acid mesh versus open polyglactin or polypropylene mesh rectopexy, Outcome 5 Number of patients with constipation after surgery. | ||||
| 5.1 Polyglycolic versus polypropylene | 1 | Odds Ratio (M‐H, Fixed, 95% CI) | 0.0 [0.0, 0.0] | |
| 5.2 Polyglycolic versus polyglactin | 1 | Odds Ratio (M‐H, Fixed, 95% CI) | 0.0 [0.0, 0.0] | |
| 6 Number of patients with postoperative complications Show forest plot | 2 | Odds Ratio (M‐H, Fixed, 95% CI) | Totals not selected | |
| Analysis 4.6  Comparison 4 Open abdominal polyglycolic acid mesh versus open polyglactin or polypropylene mesh rectopexy, Outcome 6 Number of patients with postoperative complications. | ||||
| 6.1 Polyglycolic versus polypropylene | 1 | Odds Ratio (M‐H, Fixed, 95% CI) | 0.0 [0.0, 0.0] | |
| 6.2 Polyglycolic versus polyglactin | 1 | Odds Ratio (M‐H, Fixed, 95% CI) | 0.0 [0.0, 0.0] | |
| Outcome or subgroup title | No. of studies | No. of participants | Statistical method | Effect size |
| 1 Number of patients with recurrent full‐thickness rectal prolapse Show forest plot | 2 | Odds Ratio (M‐H, Fixed, 95% CI) | Totals not selected | |
| Analysis 5.1  Comparison 5 Preservation versus division of the lateral ligaments during open mesh rectopexy, Outcome 1 Number of patients with recurrent full‐thickness rectal prolapse. | ||||
| 2 Number of patients with residual mucosal prolapse only Show forest plot | 1 | Odds Ratio (M‐H, Fixed, 95% CI) | Totals not selected | |
| Analysis 5.2  Comparison 5 Preservation versus division of the lateral ligaments during open mesh rectopexy, Outcome 2 Number of patients with residual mucosal prolapse only. | ||||
| 3 Number of patients with constipation Show forest plot | 2 | 44 | Odds Ratio (M‐H, Fixed, 95% CI) | 0.32 [0.08, 1.23] |
| Analysis 5.3  Comparison 5 Preservation versus division of the lateral ligaments during open mesh rectopexy, Outcome 3 Number of patients with constipation. | ||||
| 4 Constipation score Show forest plot | 1 | Mean Difference (IV, Fixed, 95% CI) | Totals not selected | |
| Analysis 5.4  Comparison 5 Preservation versus division of the lateral ligaments during open mesh rectopexy, Outcome 4 Constipation score. | ||||
| 5 Number of patients with postoperative complications Show forest plot | 1 | Odds Ratio (M‐H, Fixed, 95% CI) | Totals not selected | |
| Analysis 5.5  Comparison 5 Preservation versus division of the lateral ligaments during open mesh rectopexy, Outcome 5 Number of patients with postoperative complications. | ||||
| 6 Defecation frequency (per day) Show forest plot | 1 | Mean Difference (IV, Fixed, 95% CI) | Totals not selected | |
| Analysis 5.6 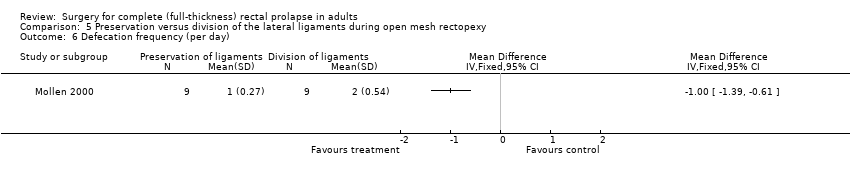 Comparison 5 Preservation versus division of the lateral ligaments during open mesh rectopexy, Outcome 6 Defecation frequency (per day). | ||||
| 7 Resting anal pressure (mmHg) Show forest plot | 1 | Mean Difference (IV, Fixed, 95% CI) | Totals not selected | |
| Analysis 5.7  Comparison 5 Preservation versus division of the lateral ligaments during open mesh rectopexy, Outcome 7 Resting anal pressure (mmHg). | ||||
| 8 Anal squeeze pressures (mmHg) Show forest plot | 1 | Mean Difference (IV, Fixed, 95% CI) | Totals not selected | |
| Analysis 5.8  Comparison 5 Preservation versus division of the lateral ligaments during open mesh rectopexy, Outcome 8 Anal squeeze pressures (mmHg). | ||||
| 9 Compliance (ml/mmHg) Show forest plot | 1 | Mean Difference (IV, Fixed, 95% CI) | Totals not selected | |
| Analysis 5.9  Comparison 5 Preservation versus division of the lateral ligaments during open mesh rectopexy, Outcome 9 Compliance (ml/mmHg). | ||||
| Outcome or subgroup title | No. of studies | No. of participants | Statistical method | Effect size |
| 1 Number of patients with recurrent full‐thickness prolapse Show forest plot | 1 | Odds Ratio (M‐H, Fixed, 95% CI) | Totals not selected | |
| Analysis 6.1  Comparison 6 Laparoscopic versus open procedure, Outcome 1 Number of patients with recurrent full‐thickness prolapse. | ||||
| 2 Number of patients with residual mucosal prolapse only Show forest plot | 1 | Odds Ratio (M‐H, Fixed, 95% CI) | Totals not selected | |
| Analysis 6.2 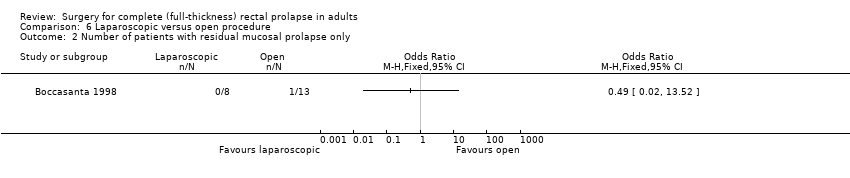 Comparison 6 Laparoscopic versus open procedure, Outcome 2 Number of patients with residual mucosal prolapse only. | ||||
| 3 Incontinence score Show forest plot | 1 | Mean Difference (IV, Fixed, 95% CI) | Totals not selected | |
| Analysis 6.3 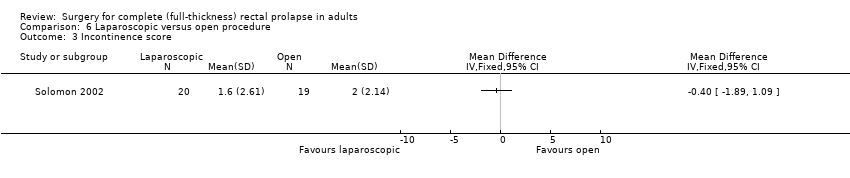 Comparison 6 Laparoscopic versus open procedure, Outcome 3 Incontinence score. | ||||
| 4 Number of patients with constipation after surgery Show forest plot | 1 | Odds Ratio (M‐H, Fixed, 95% CI) | Totals not selected | |
| Analysis 6.4  Comparison 6 Laparoscopic versus open procedure, Outcome 4 Number of patients with constipation after surgery. | ||||
| 5 Operating time (min) Show forest plot | 2 | 60 | Mean Difference (IV, Fixed, 95% CI) | 67.25 [51.61, 82.88] |
| Analysis 6.5  Comparison 6 Laparoscopic versus open procedure, Outcome 5 Operating time (min). | ||||
| 6 Number of patients with postoperative complications Show forest plot | 1 | Odds Ratio (M‐H, Fixed, 95% CI) | Totals not selected | |
| Analysis 6.6  Comparison 6 Laparoscopic versus open procedure, Outcome 6 Number of patients with postoperative complications. | ||||
| 7 Length of hospital stay (days) Show forest plot | 2 | 60 | Mean Difference (IV, Fixed, 95% CI) | ‐2.35 [‐3.33, ‐1.37] |
| Analysis 6.7  Comparison 6 Laparoscopic versus open procedure, Outcome 7 Length of hospital stay (days). | ||||
| 8 Maximum resting anal pressure (cmH2O) Show forest plot | 1 | Mean Difference (IV, Fixed, 95% CI) | Totals not selected | |
| Analysis 6.8  Comparison 6 Laparoscopic versus open procedure, Outcome 8 Maximum resting anal pressure (cmH2O). | ||||
| 9 Maximum squeeze pressure Show forest plot | 1 | Mean Difference (IV, Fixed, 95% CI) | Totals not selected | |
| Analysis 6.9  Comparison 6 Laparoscopic versus open procedure, Outcome 9 Maximum squeeze pressure. | ||||
| 10 Maximum rectal volume (ml) Show forest plot | 1 | Mean Difference (IV, Fixed, 95% CI) | Totals not selected | |
| Analysis 6.10  Comparison 6 Laparoscopic versus open procedure, Outcome 10 Maximum rectal volume (ml). | ||||
| 11 Rectal capacity (ml) Show forest plot | 1 | Mean Difference (IV, Fixed, 95% CI) | Totals not selected | |
| Analysis 6.11  Comparison 6 Laparoscopic versus open procedure, Outcome 11 Rectal capacity (ml). | ||||
| 12 Total cost (USD) Show forest plot | 2 | 60 | Std. Mean Difference (IV, Fixed, 95% CI) | ‐0.84 [‐1.41, ‐0.28] |
| Analysis 6.12  Comparison 6 Laparoscopic versus open procedure, Outcome 12 Total cost (USD). | ||||
| Outcome or subgroup title | No. of studies | No. of participants | Statistical method | Effect size |
| 1 Number of patients with recurrent full‐thickness prolapse Show forest plot | 2 | 43 | Odds Ratio (M‐H, Fixed, 95% CI) | 0.64 [0.12, 3.55] |
| Analysis 7.1  Comparison 7 Abdominal versus perineal approach, Outcome 1 Number of patients with recurrent full‐thickness prolapse. | ||||
| 2 Number of patients with recurrent full‐thickness prolapse Show forest plot | 1 | Odds Ratio (M‐H, Random, 95% CI) | Totals not selected | |
| Analysis 7.2  Comparison 7 Abdominal versus perineal approach, Outcome 2 Number of patients with recurrent full‐thickness prolapse. | ||||
| 3 Number of patients with residual mucosal prolapse only Show forest plot | 1 | Odds Ratio (M‐H, Fixed, 95% CI) | Totals not selected | |
| Analysis 7.3  Comparison 7 Abdominal versus perineal approach, Outcome 3 Number of patients with residual mucosal prolapse only. | ||||
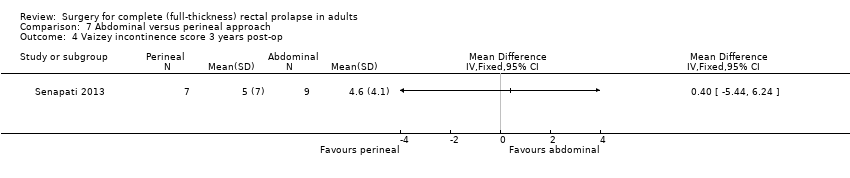
| 4 Vaizey incontinence score 3 years post‐op Show forest plot | 1 | Mean Difference (IV, Fixed, 95% CI) | Totals not selected | |
| Analysis 7.4  Comparison 7 Abdominal versus perineal approach, Outcome 4 Vaizey incontinence score 3 years post‐op. | ||||
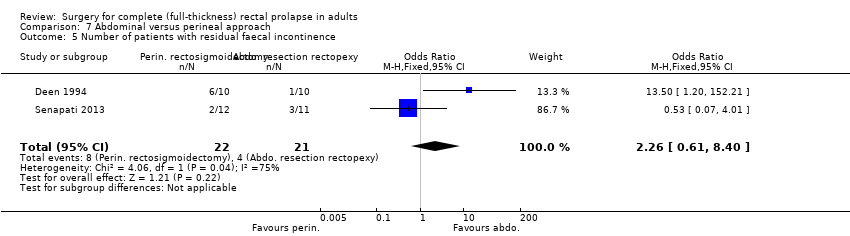
| 5 Number of patients with residual faecal incontinence Show forest plot | 2 | 43 | Odds Ratio (M‐H, Fixed, 95% CI) | 2.26 [0.61, 8.40] |
| Analysis 7.5  Comparison 7 Abdominal versus perineal approach, Outcome 5 Number of patients with residual faecal incontinence. | ||||
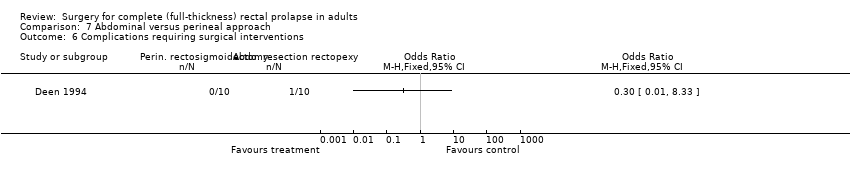
| 6 Complications requiring surgical interventions Show forest plot | 1 | Odds Ratio (M‐H, Fixed, 95% CI) | Totals not selected | |
| Analysis 7.6  Comparison 7 Abdominal versus perineal approach, Outcome 6 Complications requiring surgical interventions. | ||||
| 7 Number of patients with postoperative complications Show forest plot | 2 | 64 | Odds Ratio (M‐H, Fixed, 95% CI) | 0.46 [0.15, 1.37] |
| Analysis 7.7  Comparison 7 Abdominal versus perineal approach, Outcome 7 Number of patients with postoperative complications. | ||||
| 8 Bowel function (bowel thermometer) 3 years post‐op Show forest plot | 1 | Mean Difference (IV, Fixed, 95% CI) | Totals not selected | |
| Analysis 7.8  Comparison 7 Abdominal versus perineal approach, Outcome 8 Bowel function (bowel thermometer) 3 years post‐op. | ||||
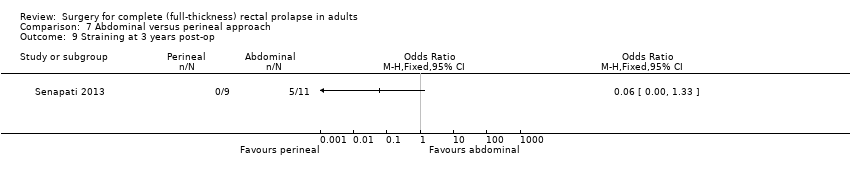
| 9 Straining at 3 years post‐op Show forest plot | 1 | Odds Ratio (M‐H, Fixed, 95% CI) | Totals not selected | |
| Analysis 7.9  Comparison 7 Abdominal versus perineal approach, Outcome 9 Straining at 3 years post‐op. | ||||
| 10 Maximum resting pressure (cmH2O) Show forest plot | 1 | Mean Difference (IV, Fixed, 95% CI) | Totals not selected | |
| Analysis 7.10 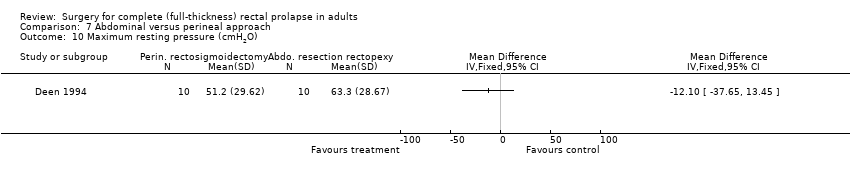 Comparison 7 Abdominal versus perineal approach, Outcome 10 Maximum resting pressure (cmH2O). | ||||
| 11 Maximum squeeze pressure (cmH2O) Show forest plot | 1 | Mean Difference (IV, Fixed, 95% CI) | Totals not selected | |
| Analysis 7.11 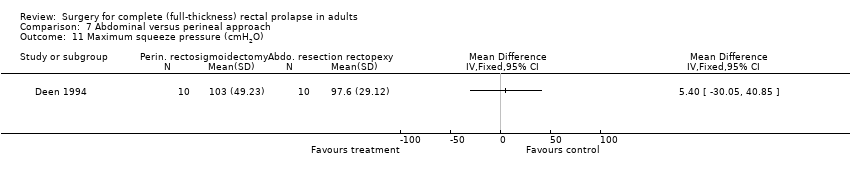 Comparison 7 Abdominal versus perineal approach, Outcome 11 Maximum squeeze pressure (cmH2O). | ||||
| 12 Rectal compliance (ml/cmH2O) Show forest plot | 1 | Mean Difference (IV, Fixed, 95% CI) | Totals not selected | |
| Analysis 7.12  Comparison 7 Abdominal versus perineal approach, Outcome 12 Rectal compliance (ml/cmH2O). | ||||
| 13 Quality of life score (EQ‐5D) at 3 years Show forest plot | 1 | Mean Difference (IV, Fixed, 95% CI) | Totals not selected | |
| Analysis 7.13 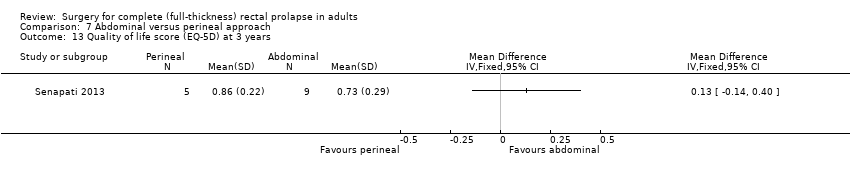 Comparison 7 Abdominal versus perineal approach, Outcome 13 Quality of life score (EQ‐5D) at 3 years. | ||||
| Outcome or subgroup title | No. of studies | No. of participants | Statistical method | Effect size |
| 1 Number of patients with recurrent full‐thickness prolapse Show forest plot | 3 | 115 | Odds Ratio (M‐H, Fixed, 95% CI) | 0.41 [0.11, 1.50] |
| Analysis 8.1  Comparison 8 Resection versus no resection rectopexy, Outcome 1 Number of patients with recurrent full‐thickness prolapse. | ||||
| 2 Number of patients with residual faecal incontinence Show forest plot | 3 | 115 | Odds Ratio (M‐H, Fixed, 95% CI) | 0.93 [0.43, 2.03] |
| Analysis 8.2 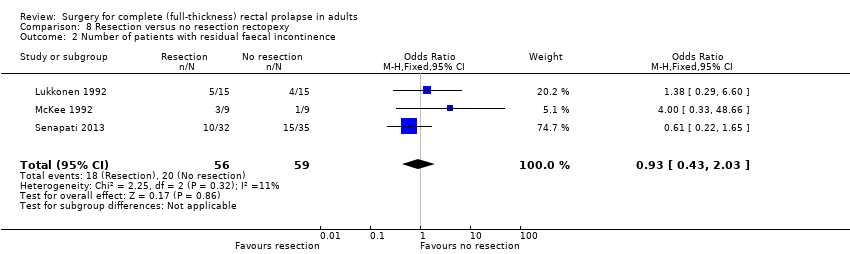 Comparison 8 Resection versus no resection rectopexy, Outcome 2 Number of patients with residual faecal incontinence. | ||||
| 3 Vaizey incontinence score 3 years post‐op Show forest plot | 1 | Mean Difference (IV, Fixed, 95% CI) | Totals not selected | |
| Analysis 8.3  Comparison 8 Resection versus no resection rectopexy, Outcome 3 Vaizey incontinence score 3 years post‐op. | ||||
| 4 Number of patients with constipation due to surgery Show forest plot | 3 | 84 | Odds Ratio (M‐H, Fixed, 95% CI) | 0.14 [0.04, 0.44] |
| Analysis 8.4 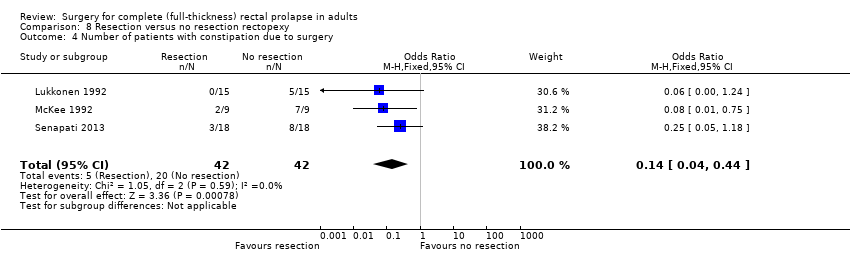 Comparison 8 Resection versus no resection rectopexy, Outcome 4 Number of patients with constipation due to surgery. | ||||
| 5 Number of patients with postoperative complications Show forest plot | 2 | 97 | Odds Ratio (M‐H, Fixed, 95% CI) | 1.89 [0.76, 4.73] |
| Analysis 8.5  Comparison 8 Resection versus no resection rectopexy, Outcome 5 Number of patients with postoperative complications. | ||||
| 6 Bowel function (bowel thermometer) 3 years post‐op Show forest plot | 1 | Mean Difference (IV, Fixed, 95% CI) | Totals not selected | |
| Analysis 8.6 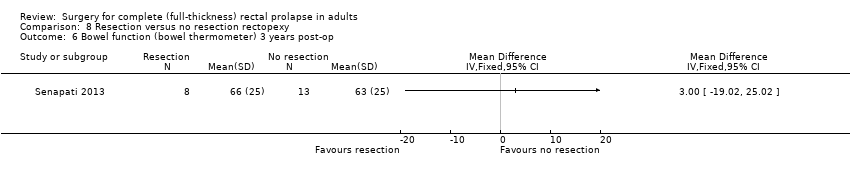 Comparison 8 Resection versus no resection rectopexy, Outcome 6 Bowel function (bowel thermometer) 3 years post‐op. | ||||
| 7 Maximum resting anal pressure (mmHg) Show forest plot | 1 | Mean Difference (IV, Fixed, 95% CI) | Totals not selected | |
| Analysis 8.7 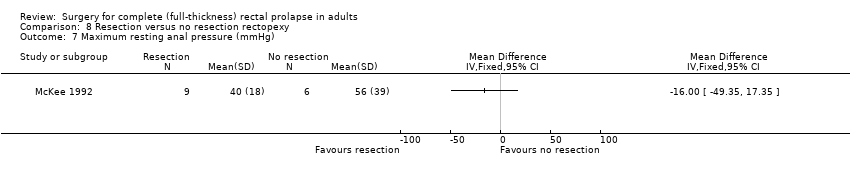 Comparison 8 Resection versus no resection rectopexy, Outcome 7 Maximum resting anal pressure (mmHg). | ||||
| 8 Maximum rectal volumes (ml) Show forest plot | 1 | Mean Difference (IV, Fixed, 95% CI) | Totals not selected | |
| Analysis 8.8 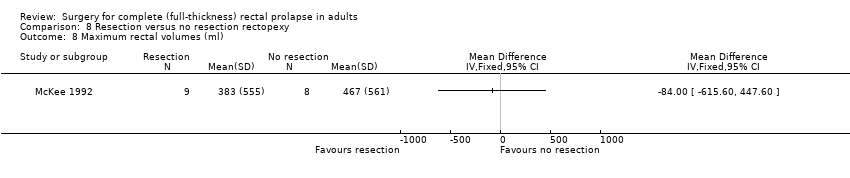 Comparison 8 Resection versus no resection rectopexy, Outcome 8 Maximum rectal volumes (ml). | ||||
| 9 Volume to first sensation (ml) Show forest plot | 1 | Mean Difference (IV, Fixed, 95% CI) | Totals not selected | |
| Analysis 8.9  Comparison 8 Resection versus no resection rectopexy, Outcome 9 Volume to first sensation (ml). | ||||
| 10 Anorectal angle (postoperative) Show forest plot | 1 | Mean Difference (IV, Fixed, 95% CI) | Totals not selected | |
| Analysis 8.10  Comparison 8 Resection versus no resection rectopexy, Outcome 10 Anorectal angle (postoperative). | ||||
| 11 Rectal compliance (mmHg/ml) Show forest plot | 1 | Mean Difference (IV, Fixed, 95% CI) | Totals not selected | |
| Analysis 8.11  Comparison 8 Resection versus no resection rectopexy, Outcome 11 Rectal compliance (mmHg/ml). | ||||
| 12 Postoperative transit time (days) Show forest plot | 1 | Mean Difference (IV, Fixed, 95% CI) | Totals not selected | |
| Analysis 8.12  Comparison 8 Resection versus no resection rectopexy, Outcome 12 Postoperative transit time (days). | ||||
| 13 Quality of life score (EQ‐5D) at 3 years Show forest plot | 1 | Mean Difference (IV, Fixed, 95% CI) | Totals not selected | |
| Analysis 8.13 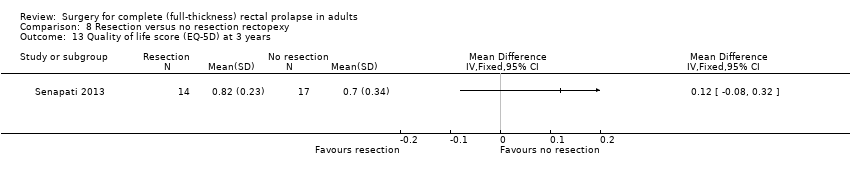 Comparison 8 Resection versus no resection rectopexy, Outcome 13 Quality of life score (EQ‐5D) at 3 years. | ||||
| Outcome or subgroup title | No. of studies | No. of participants | Statistical method | Effect size |
| 1 Number of patients with recurrent full‐thickness prolapse Show forest plot | 1 | Odds Ratio (M‐H, Fixed, 95% CI) | Totals not selected | |
| Analysis 9.1 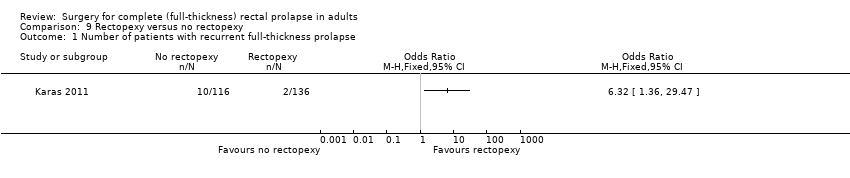 Comparison 9 Rectopexy versus no rectopexy, Outcome 1 Number of patients with recurrent full‐thickness prolapse. | ||||
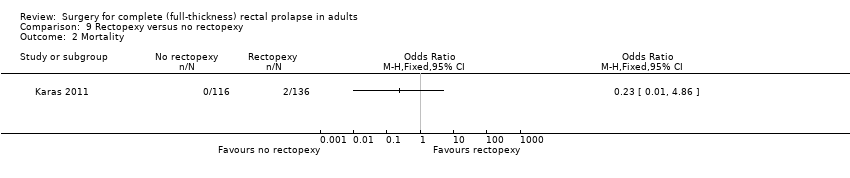
| 2 Mortality Show forest plot | 1 | Odds Ratio (M‐H, Fixed, 95% CI) | Totals not selected | |
| Analysis 9.2  Comparison 9 Rectopexy versus no rectopexy, Outcome 2 Mortality. | ||||
| 3 Number of patients with complications Show forest plot | 1 | Odds Ratio (M‐H, Fixed, 95% CI) | Totals not selected | |
| Analysis 9.3 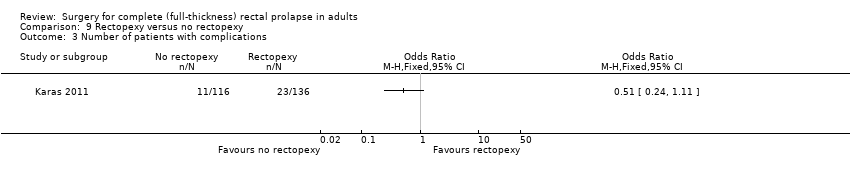 Comparison 9 Rectopexy versus no rectopexy, Outcome 3 Number of patients with complications. | ||||

PRISMA study flow diagram.

Risk of bias graph: review authors' judgements about each risk of bias item presented as percentages across all included studies.
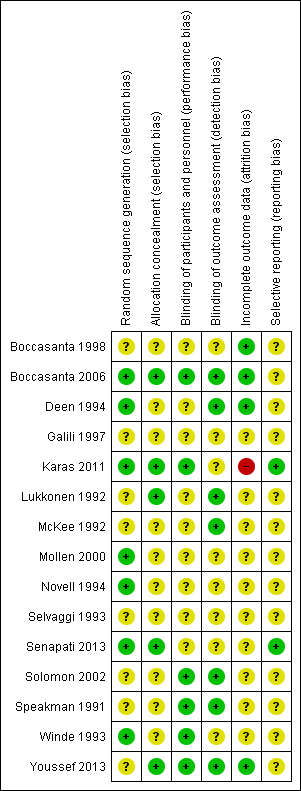
Risk of bias summary: review authors' judgements about each risk of bias item for each included study.
Comparison 1 Conventional diathermy and handsewn rectosigmoidectomy versus harmonic scalpel and stapled technique, Outcome 1 Number of patients with recurrent full‐thickness prolapse.

Comparison 1 Conventional diathermy and handsewn rectosigmoidectomy versus harmonic scalpel and stapled technique, Outcome 2 Incontinence score.

Comparison 1 Conventional diathermy and handsewn rectosigmoidectomy versus harmonic scalpel and stapled technique, Outcome 3 Hospital stay.
Comparison 1 Conventional diathermy and handsewn rectosigmoidectomy versus harmonic scalpel and stapled technique, Outcome 4 Recovery time.

Comparison 1 Conventional diathermy and handsewn rectosigmoidectomy versus harmonic scalpel and stapled technique, Outcome 5 Number of patients with defecatory problems.

Comparison 1 Conventional diathermy and handsewn rectosigmoidectomy versus harmonic scalpel and stapled technique, Outcome 6 Resting anal pressure (mmHg).

Comparison 1 Conventional diathermy and handsewn rectosigmoidectomy versus harmonic scalpel and stapled technique, Outcome 7 Squeeze pressure (mmHg).

Comparison 1 Conventional diathermy and handsewn rectosigmoidectomy versus harmonic scalpel and stapled technique, Outcome 8 Threshold volume (ml).
Comparison 2 Comparisons of different perineal approaches, Outcome 1 Number of patients with recurrent full‐thickness prolapse.

Comparison 2 Comparisons of different perineal approaches, Outcome 2 Number of patients with residual faecal incontinence.

Comparison 2 Comparisons of different perineal approaches, Outcome 3 Number of patients with constipation after surgery.

Comparison 2 Comparisons of different perineal approaches, Outcome 4 Operating time (min).

Comparison 2 Comparisons of different perineal approaches, Outcome 5 Number of patients with postoperative complications.

Comparison 2 Comparisons of different perineal approaches, Outcome 6 Length of hospital stay (days).

Comparison 2 Comparisons of different perineal approaches, Outcome 7 Postoperative maximum resting pressure.

Comparison 2 Comparisons of different perineal approaches, Outcome 8 Postoperative maximum squeeze pressure.

Comparison 2 Comparisons of different perineal approaches, Outcome 9 Postoperative rectal sensation.

Comparison 2 Comparisons of different perineal approaches, Outcome 10 Patient's postoperative satisfaction score.

Comparison 2 Comparisons of different perineal approaches, Outcome 11 Number of patients with recurrent full‐thickness prolapse.
Comparison 2 Comparisons of different perineal approaches, Outcome 12 Vaizey incontinence score 3 years post‐op.

Comparison 2 Comparisons of different perineal approaches, Outcome 13 Bowel function (bowel thermometer) 3 years post‐op.

Comparison 2 Comparisons of different perineal approaches, Outcome 14 Quality of life score (EQ‐5D) at 3 years.

Comparison 3 Open abdominal Ivalon sponge rectopexy versus open abdominal suture rectopexy, Outcome 1 Number of patients with recurrent full‐thickness prolapse.

Comparison 3 Open abdominal Ivalon sponge rectopexy versus open abdominal suture rectopexy, Outcome 2 Number of patients with postoperative faecal incontinence.

Comparison 3 Open abdominal Ivalon sponge rectopexy versus open abdominal suture rectopexy, Outcome 3 Number of patients with constipation after surgery.
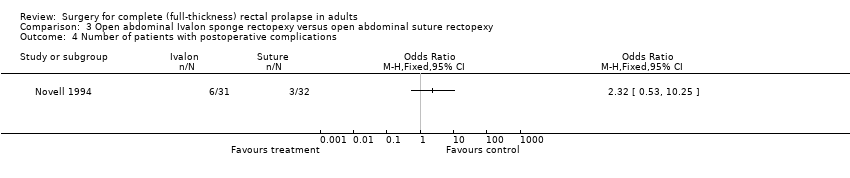
Comparison 3 Open abdominal Ivalon sponge rectopexy versus open abdominal suture rectopexy, Outcome 4 Number of patients with postoperative complications.
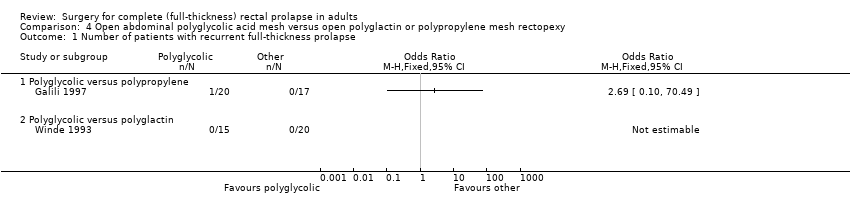
Comparison 4 Open abdominal polyglycolic acid mesh versus open polyglactin or polypropylene mesh rectopexy, Outcome 1 Number of patients with recurrent full‐thickness prolapse.

Comparison 4 Open abdominal polyglycolic acid mesh versus open polyglactin or polypropylene mesh rectopexy, Outcome 2 Number of patients with residual mucosal prolapse.

Comparison 4 Open abdominal polyglycolic acid mesh versus open polyglactin or polypropylene mesh rectopexy, Outcome 3 Number of patients with residual faecal incontinence.

Comparison 4 Open abdominal polyglycolic acid mesh versus open polyglactin or polypropylene mesh rectopexy, Outcome 4 Incontinence score.
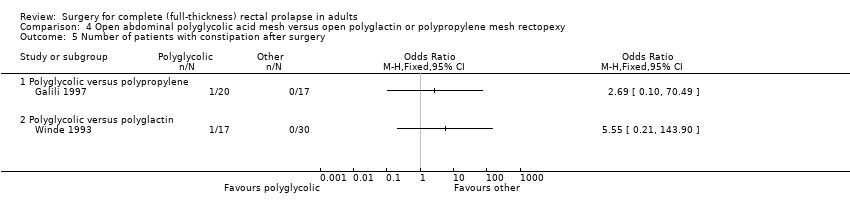
Comparison 4 Open abdominal polyglycolic acid mesh versus open polyglactin or polypropylene mesh rectopexy, Outcome 5 Number of patients with constipation after surgery.

Comparison 4 Open abdominal polyglycolic acid mesh versus open polyglactin or polypropylene mesh rectopexy, Outcome 6 Number of patients with postoperative complications.
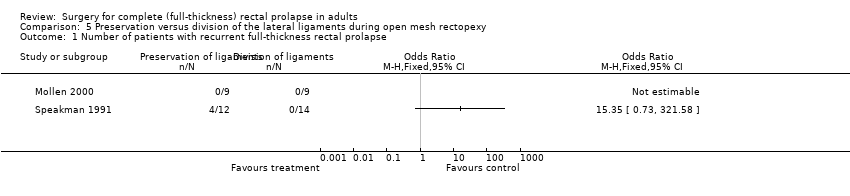
Comparison 5 Preservation versus division of the lateral ligaments during open mesh rectopexy, Outcome 1 Number of patients with recurrent full‐thickness rectal prolapse.

Comparison 5 Preservation versus division of the lateral ligaments during open mesh rectopexy, Outcome 2 Number of patients with residual mucosal prolapse only.

Comparison 5 Preservation versus division of the lateral ligaments during open mesh rectopexy, Outcome 3 Number of patients with constipation.

Comparison 5 Preservation versus division of the lateral ligaments during open mesh rectopexy, Outcome 4 Constipation score.
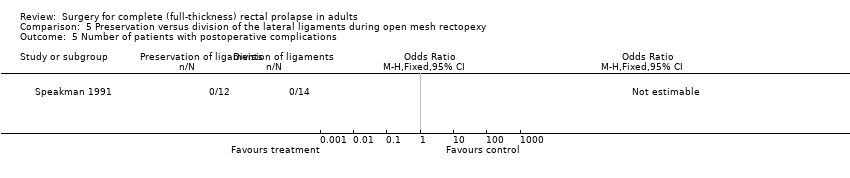
Comparison 5 Preservation versus division of the lateral ligaments during open mesh rectopexy, Outcome 5 Number of patients with postoperative complications.

Comparison 5 Preservation versus division of the lateral ligaments during open mesh rectopexy, Outcome 6 Defecation frequency (per day).
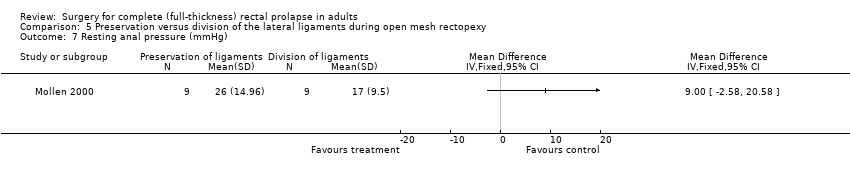
Comparison 5 Preservation versus division of the lateral ligaments during open mesh rectopexy, Outcome 7 Resting anal pressure (mmHg).
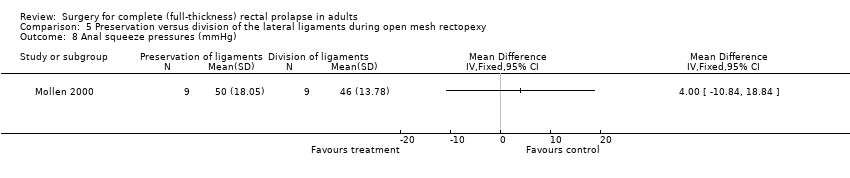
Comparison 5 Preservation versus division of the lateral ligaments during open mesh rectopexy, Outcome 8 Anal squeeze pressures (mmHg).

Comparison 5 Preservation versus division of the lateral ligaments during open mesh rectopexy, Outcome 9 Compliance (ml/mmHg).

Comparison 6 Laparoscopic versus open procedure, Outcome 1 Number of patients with recurrent full‐thickness prolapse.

Comparison 6 Laparoscopic versus open procedure, Outcome 2 Number of patients with residual mucosal prolapse only.

Comparison 6 Laparoscopic versus open procedure, Outcome 3 Incontinence score.
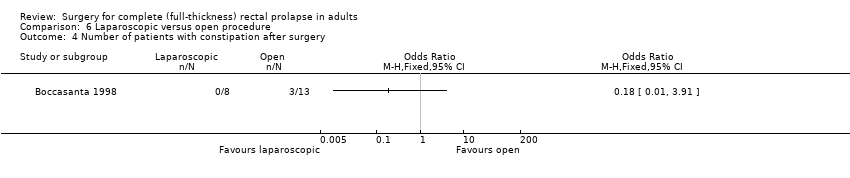
Comparison 6 Laparoscopic versus open procedure, Outcome 4 Number of patients with constipation after surgery.
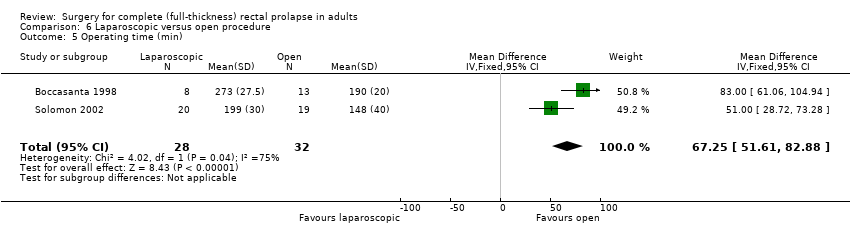
Comparison 6 Laparoscopic versus open procedure, Outcome 5 Operating time (min).

Comparison 6 Laparoscopic versus open procedure, Outcome 6 Number of patients with postoperative complications.

Comparison 6 Laparoscopic versus open procedure, Outcome 7 Length of hospital stay (days).

Comparison 6 Laparoscopic versus open procedure, Outcome 8 Maximum resting anal pressure (cmH2O).

Comparison 6 Laparoscopic versus open procedure, Outcome 9 Maximum squeeze pressure.
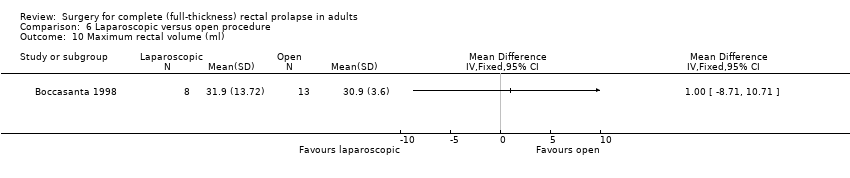
Comparison 6 Laparoscopic versus open procedure, Outcome 10 Maximum rectal volume (ml).
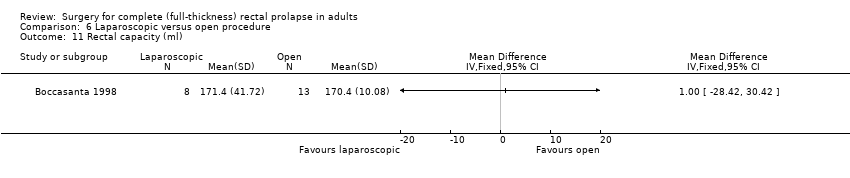
Comparison 6 Laparoscopic versus open procedure, Outcome 11 Rectal capacity (ml).

Comparison 6 Laparoscopic versus open procedure, Outcome 12 Total cost (USD).
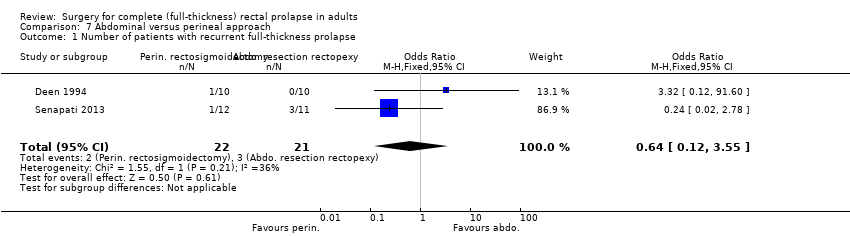
Comparison 7 Abdominal versus perineal approach, Outcome 1 Number of patients with recurrent full‐thickness prolapse.

Comparison 7 Abdominal versus perineal approach, Outcome 2 Number of patients with recurrent full‐thickness prolapse.

Comparison 7 Abdominal versus perineal approach, Outcome 3 Number of patients with residual mucosal prolapse only.
Comparison 7 Abdominal versus perineal approach, Outcome 4 Vaizey incontinence score 3 years post‐op.
Comparison 7 Abdominal versus perineal approach, Outcome 5 Number of patients with residual faecal incontinence.
Comparison 7 Abdominal versus perineal approach, Outcome 6 Complications requiring surgical interventions.

Comparison 7 Abdominal versus perineal approach, Outcome 7 Number of patients with postoperative complications.

Comparison 7 Abdominal versus perineal approach, Outcome 8 Bowel function (bowel thermometer) 3 years post‐op.
Comparison 7 Abdominal versus perineal approach, Outcome 9 Straining at 3 years post‐op.

Comparison 7 Abdominal versus perineal approach, Outcome 10 Maximum resting pressure (cmH2O).

Comparison 7 Abdominal versus perineal approach, Outcome 11 Maximum squeeze pressure (cmH2O).
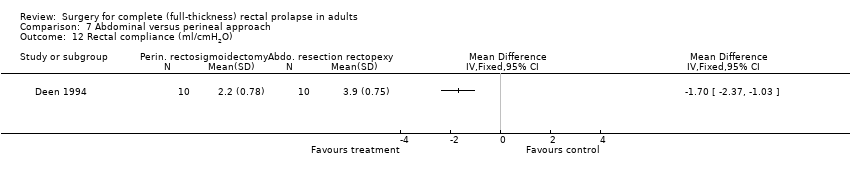
Comparison 7 Abdominal versus perineal approach, Outcome 12 Rectal compliance (ml/cmH2O).

Comparison 7 Abdominal versus perineal approach, Outcome 13 Quality of life score (EQ‐5D) at 3 years.

Comparison 8 Resection versus no resection rectopexy, Outcome 1 Number of patients with recurrent full‐thickness prolapse.

Comparison 8 Resection versus no resection rectopexy, Outcome 2 Number of patients with residual faecal incontinence.

Comparison 8 Resection versus no resection rectopexy, Outcome 3 Vaizey incontinence score 3 years post‐op.

Comparison 8 Resection versus no resection rectopexy, Outcome 4 Number of patients with constipation due to surgery.
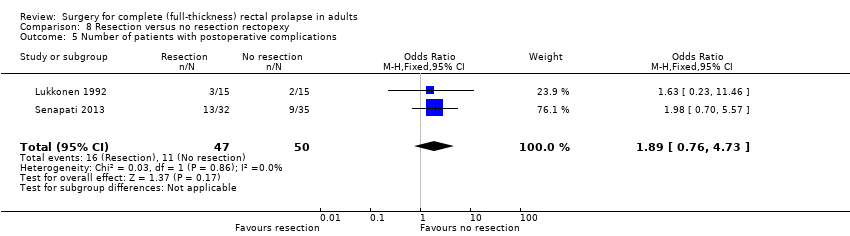
Comparison 8 Resection versus no resection rectopexy, Outcome 5 Number of patients with postoperative complications.

Comparison 8 Resection versus no resection rectopexy, Outcome 6 Bowel function (bowel thermometer) 3 years post‐op.

Comparison 8 Resection versus no resection rectopexy, Outcome 7 Maximum resting anal pressure (mmHg).

Comparison 8 Resection versus no resection rectopexy, Outcome 8 Maximum rectal volumes (ml).

Comparison 8 Resection versus no resection rectopexy, Outcome 9 Volume to first sensation (ml).

Comparison 8 Resection versus no resection rectopexy, Outcome 10 Anorectal angle (postoperative).
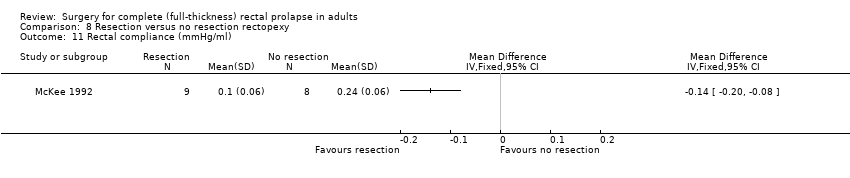
Comparison 8 Resection versus no resection rectopexy, Outcome 11 Rectal compliance (mmHg/ml).
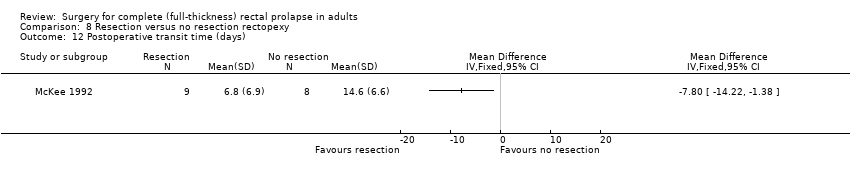
Comparison 8 Resection versus no resection rectopexy, Outcome 12 Postoperative transit time (days).

Comparison 8 Resection versus no resection rectopexy, Outcome 13 Quality of life score (EQ‐5D) at 3 years.

Comparison 9 Rectopexy versus no rectopexy, Outcome 1 Number of patients with recurrent full‐thickness prolapse.
Comparison 9 Rectopexy versus no rectopexy, Outcome 2 Mortality.

Comparison 9 Rectopexy versus no rectopexy, Outcome 3 Number of patients with complications.
| Perineal compared with abdominal approach for full‐thickness rectal prolapse in adults | ||||||
| Patients: Adults with full‐thickness rectal prolapse Setting: Surgical centres in India, Finland, Serbia, Spain, UK Interventions: perineal versus abdominal surgery | ||||||
| Outcomes | Anticipated absolute effects (95% CI) | Relative effect | No. of participants | Quality of the evidence | Comments | |
| Assumed risk (with abdominal approach) | Corresponding risk (with perineal approach) | |||||
| Number of patients with recurrent full‐thickness prolapse | Moderate risk (study population) | OR 0.7 (0.17 to 2.88) | 44 (1 RCT) | ⊕⊕⊕ | A pragmatic trial, participants could be randomised between abdominal or perineal surgery. The abdominal procedure was performed through an open or laparoscopic approach depending on surgeon's preference. For perineal surgery, participants could be randomised to a Delorme's or an Altemeier's procedure. It was the surgeon's choice to participate in either or both of the randomisations. | |
| 263 per 1000 | 200 per 1000 | |||||
| Vaizey incontinence score 3 years post‐op | The mean Vaizey incontinence score 3 years post‐op in the control group was 4.6 | The mean Vaizey incontinence score 3 years post‐op in the intervention group was 5 higher (5.44 lower to 6.24 higher) | — | 16 (1 RCT) | ⊕⊕⊕ | The Vaizey scores ranged from 0 (perfect continence) to 24 (totally incontinent) |
| Number of patients with postoperative complications | Moderate risk (study population) | OR 0.65 (0.19 to 2.23) | 44 (1 RCT) | ⊕⊕⊕ | — | |
| 421 per 1000 | 321 per 1000 (121 to 619) | |||||
| Bowel function (bowel thermometer) 3 years post‐op | The mean bowel function (bowel thermometer) 3 years post‐op in the control group was 52 | The mean bowel function (bowel thermometer) 3 years post‐op in the intervention group was 50 higher (31.69 lower to 27.69 higher) | — | 9 (1 RCT) | ⊕⊕⊕ | Bowel function rated by participants, 0 (worst) to 100 (best) |
| Quality of life score (EQ‐5D) at 3 years | The mean quality of life score (EQ‐5D) at 3 years in the control group was 0.73 | the mean quality of life score (EQ‐5D) at 3 years in the intervention group was 0.86 higher (0.14 lower to 0.4 higher) | — | 14 (1 RCT) | ⊕⊕⊕ | EQ‐5D quality of life scores range from − 0.59 (worst) − 1.0 (perfect health) |
| Straining at 3 years post‐op | Moderate risk (study population) | OR 0.06 (0 to 1.33) | 20 (1 RCT) | ⊕⊕⊕ | — | |
| 455 per 1000 | 48 per 1000 (0 to 526) | |||||
| CI: Confidence interval; OR: Odds Ratio; RCT: randomised controlled trial. | ||||||
| GRADE Working Group grades of evidence | ||||||
| aDowngraded one level for imprecision; single trial with small sample size and wide confidence interval | ||||||
| Outcome or subgroup title | No. of studies | No. of participants | Statistical method | Effect size |
| 1 Number of patients with recurrent full‐thickness prolapse Show forest plot | 1 | Odds Ratio (M‐H, Fixed, 95% CI) | Totals not selected | |
| 2 Incontinence score Show forest plot | 1 | Mean Difference (IV, Fixed, 95% CI) | Totals not selected | |
| 3 Hospital stay Show forest plot | 1 | Mean Difference (IV, Fixed, 95% CI) | Totals not selected | |
| 4 Recovery time Show forest plot | 1 | Mean Difference (IV, Fixed, 95% CI) | Totals not selected | |
| 5 Number of patients with defecatory problems Show forest plot | 1 | Odds Ratio (M‐H, Fixed, 95% CI) | Totals not selected | |
| 6 Resting anal pressure (mmHg) Show forest plot | 1 | Mean Difference (IV, Fixed, 95% CI) | Totals not selected | |
| 7 Squeeze pressure (mmHg) Show forest plot | 1 | Mean Difference (IV, Fixed, 95% CI) | Totals not selected | |
| 8 Threshold volume (ml) Show forest plot | 1 | Mean Difference (IV, Fixed, 95% CI) | Totals not selected | |
| Outcome or subgroup title | No. of studies | No. of participants | Statistical method | Effect size |
| 1 Number of patients with recurrent full‐thickness prolapse Show forest plot | 1 | Odds Ratio (M‐H, Fixed, 95% CI) | Totals not selected | |
| 2 Number of patients with residual faecal incontinence Show forest plot | 1 | Odds Ratio (M‐H, Fixed, 95% CI) | Totals not selected | |
| 3 Number of patients with constipation after surgery Show forest plot | 1 | Odds Ratio (M‐H, Fixed, 95% CI) | Totals not selected | |
| 4 Operating time (min) Show forest plot | 1 | Mean Difference (IV, Fixed, 95% CI) | Totals not selected | |
| 5 Number of patients with postoperative complications Show forest plot | 1 | Odds Ratio (M‐H, Fixed, 95% CI) | Totals not selected | |
| 6 Length of hospital stay (days) Show forest plot | 1 | Mean Difference (IV, Fixed, 95% CI) | Totals not selected | |
| 7 Postoperative maximum resting pressure Show forest plot | 1 | Mean Difference (IV, Fixed, 95% CI) | Totals not selected | |
| 8 Postoperative maximum squeeze pressure Show forest plot | 1 | Mean Difference (IV, Fixed, 95% CI) | Totals not selected | |
| 9 Postoperative rectal sensation Show forest plot | 1 | Mean Difference (IV, Fixed, 95% CI) | Totals not selected | |
| 10 Patient's postoperative satisfaction score Show forest plot | 1 | Mean Difference (IV, Fixed, 95% CI) | Totals not selected | |
| 11 Number of patients with recurrent full‐thickness prolapse Show forest plot | 1 | Odds Ratio (M‐H, Fixed, 95% CI) | Totals not selected | |
| 12 Vaizey incontinence score 3 years post‐op Show forest plot | 1 | Mean Difference (IV, Fixed, 95% CI) | Totals not selected | |
| 13 Bowel function (bowel thermometer) 3 years post‐op Show forest plot | 1 | Mean Difference (IV, Fixed, 95% CI) | Totals not selected | |
| 14 Quality of life score (EQ‐5D) at 3 years Show forest plot | 1 | Mean Difference (IV, Fixed, 95% CI) | Totals not selected | |
| Outcome or subgroup title | No. of studies | No. of participants | Statistical method | Effect size |
| 1 Number of patients with recurrent full‐thickness prolapse Show forest plot | 1 | Odds Ratio (M‐H, Fixed, 95% CI) | Totals not selected | |
| 2 Number of patients with postoperative faecal incontinence Show forest plot | 1 | Odds Ratio (M‐H, Fixed, 95% CI) | Totals not selected | |
| 3 Number of patients with constipation after surgery Show forest plot | 1 | Odds Ratio (M‐H, Fixed, 95% CI) | Totals not selected | |
| 4 Number of patients with postoperative complications Show forest plot | 1 | Odds Ratio (M‐H, Fixed, 95% CI) | Totals not selected | |
| Outcome or subgroup title | No. of studies | No. of participants | Statistical method | Effect size |
| 1 Number of patients with recurrent full‐thickness prolapse Show forest plot | 2 | Odds Ratio (M‐H, Fixed, 95% CI) | Totals not selected | |
| 1.1 Polyglycolic versus polypropylene | 1 | Odds Ratio (M‐H, Fixed, 95% CI) | 0.0 [0.0, 0.0] | |
| 1.2 Polyglycolic versus polyglactin | 1 | Odds Ratio (M‐H, Fixed, 95% CI) | 0.0 [0.0, 0.0] | |
| 2 Number of patients with residual mucosal prolapse Show forest plot | 2 | Odds Ratio (M‐H, Fixed, 95% CI) | Totals not selected | |
| 2.1 Polyglycolic versus polypropylene | 1 | Odds Ratio (M‐H, Fixed, 95% CI) | 0.0 [0.0, 0.0] | |
| 2.2 Polyglycolic versus polyglactin | 1 | Odds Ratio (M‐H, Fixed, 95% CI) | 0.0 [0.0, 0.0] | |
| 3 Number of patients with residual faecal incontinence Show forest plot | 1 | Odds Ratio (M‐H, Fixed, 95% CI) | Totals not selected | |
| 3.1 Polyglycolic versus polypropylene | 0 | Odds Ratio (M‐H, Fixed, 95% CI) | 0.0 [0.0, 0.0] | |
| 3.2 Polyglycolic versus polyglactin | 1 | Odds Ratio (M‐H, Fixed, 95% CI) | 0.0 [0.0, 0.0] | |
| 4 Incontinence score Show forest plot | 1 | Mean Difference (IV, Fixed, 95% CI) | Totals not selected | |
| 4.1 Polyglycolic versus polypropylene | 1 | Mean Difference (IV, Fixed, 95% CI) | 0.0 [0.0, 0.0] | |
| 4.2 Polyglycolic versus polyglactin | 0 | Mean Difference (IV, Fixed, 95% CI) | 0.0 [0.0, 0.0] | |
| 5 Number of patients with constipation after surgery Show forest plot | 2 | Odds Ratio (M‐H, Fixed, 95% CI) | Totals not selected | |
| 5.1 Polyglycolic versus polypropylene | 1 | Odds Ratio (M‐H, Fixed, 95% CI) | 0.0 [0.0, 0.0] | |
| 5.2 Polyglycolic versus polyglactin | 1 | Odds Ratio (M‐H, Fixed, 95% CI) | 0.0 [0.0, 0.0] | |
| 6 Number of patients with postoperative complications Show forest plot | 2 | Odds Ratio (M‐H, Fixed, 95% CI) | Totals not selected | |
| 6.1 Polyglycolic versus polypropylene | 1 | Odds Ratio (M‐H, Fixed, 95% CI) | 0.0 [0.0, 0.0] | |
| 6.2 Polyglycolic versus polyglactin | 1 | Odds Ratio (M‐H, Fixed, 95% CI) | 0.0 [0.0, 0.0] | |
| Outcome or subgroup title | No. of studies | No. of participants | Statistical method | Effect size |
| 1 Number of patients with recurrent full‐thickness rectal prolapse Show forest plot | 2 | Odds Ratio (M‐H, Fixed, 95% CI) | Totals not selected | |
| 2 Number of patients with residual mucosal prolapse only Show forest plot | 1 | Odds Ratio (M‐H, Fixed, 95% CI) | Totals not selected | |
| 3 Number of patients with constipation Show forest plot | 2 | 44 | Odds Ratio (M‐H, Fixed, 95% CI) | 0.32 [0.08, 1.23] |
| 4 Constipation score Show forest plot | 1 | Mean Difference (IV, Fixed, 95% CI) | Totals not selected | |
| 5 Number of patients with postoperative complications Show forest plot | 1 | Odds Ratio (M‐H, Fixed, 95% CI) | Totals not selected | |
| 6 Defecation frequency (per day) Show forest plot | 1 | Mean Difference (IV, Fixed, 95% CI) | Totals not selected | |
| 7 Resting anal pressure (mmHg) Show forest plot | 1 | Mean Difference (IV, Fixed, 95% CI) | Totals not selected | |
| 8 Anal squeeze pressures (mmHg) Show forest plot | 1 | Mean Difference (IV, Fixed, 95% CI) | Totals not selected | |
| 9 Compliance (ml/mmHg) Show forest plot | 1 | Mean Difference (IV, Fixed, 95% CI) | Totals not selected | |
| Outcome or subgroup title | No. of studies | No. of participants | Statistical method | Effect size |
| 1 Number of patients with recurrent full‐thickness prolapse Show forest plot | 1 | Odds Ratio (M‐H, Fixed, 95% CI) | Totals not selected | |
| 2 Number of patients with residual mucosal prolapse only Show forest plot | 1 | Odds Ratio (M‐H, Fixed, 95% CI) | Totals not selected | |
| 3 Incontinence score Show forest plot | 1 | Mean Difference (IV, Fixed, 95% CI) | Totals not selected | |
| 4 Number of patients with constipation after surgery Show forest plot | 1 | Odds Ratio (M‐H, Fixed, 95% CI) | Totals not selected | |
| 5 Operating time (min) Show forest plot | 2 | 60 | Mean Difference (IV, Fixed, 95% CI) | 67.25 [51.61, 82.88] |
| 6 Number of patients with postoperative complications Show forest plot | 1 | Odds Ratio (M‐H, Fixed, 95% CI) | Totals not selected | |
| 7 Length of hospital stay (days) Show forest plot | 2 | 60 | Mean Difference (IV, Fixed, 95% CI) | ‐2.35 [‐3.33, ‐1.37] |
| 8 Maximum resting anal pressure (cmH2O) Show forest plot | 1 | Mean Difference (IV, Fixed, 95% CI) | Totals not selected | |
| 9 Maximum squeeze pressure Show forest plot | 1 | Mean Difference (IV, Fixed, 95% CI) | Totals not selected | |
| 10 Maximum rectal volume (ml) Show forest plot | 1 | Mean Difference (IV, Fixed, 95% CI) | Totals not selected | |
| 11 Rectal capacity (ml) Show forest plot | 1 | Mean Difference (IV, Fixed, 95% CI) | Totals not selected | |
| 12 Total cost (USD) Show forest plot | 2 | 60 | Std. Mean Difference (IV, Fixed, 95% CI) | ‐0.84 [‐1.41, ‐0.28] |
| Outcome or subgroup title | No. of studies | No. of participants | Statistical method | Effect size |
| 1 Number of patients with recurrent full‐thickness prolapse Show forest plot | 2 | 43 | Odds Ratio (M‐H, Fixed, 95% CI) | 0.64 [0.12, 3.55] |
| 2 Number of patients with recurrent full‐thickness prolapse Show forest plot | 1 | Odds Ratio (M‐H, Random, 95% CI) | Totals not selected | |
| 3 Number of patients with residual mucosal prolapse only Show forest plot | 1 | Odds Ratio (M‐H, Fixed, 95% CI) | Totals not selected | |
| 4 Vaizey incontinence score 3 years post‐op Show forest plot | 1 | Mean Difference (IV, Fixed, 95% CI) | Totals not selected | |
| 5 Number of patients with residual faecal incontinence Show forest plot | 2 | 43 | Odds Ratio (M‐H, Fixed, 95% CI) | 2.26 [0.61, 8.40] |
| 6 Complications requiring surgical interventions Show forest plot | 1 | Odds Ratio (M‐H, Fixed, 95% CI) | Totals not selected | |
| 7 Number of patients with postoperative complications Show forest plot | 2 | 64 | Odds Ratio (M‐H, Fixed, 95% CI) | 0.46 [0.15, 1.37] |
| 8 Bowel function (bowel thermometer) 3 years post‐op Show forest plot | 1 | Mean Difference (IV, Fixed, 95% CI) | Totals not selected | |
| 9 Straining at 3 years post‐op Show forest plot | 1 | Odds Ratio (M‐H, Fixed, 95% CI) | Totals not selected | |
| 10 Maximum resting pressure (cmH2O) Show forest plot | 1 | Mean Difference (IV, Fixed, 95% CI) | Totals not selected | |
| 11 Maximum squeeze pressure (cmH2O) Show forest plot | 1 | Mean Difference (IV, Fixed, 95% CI) | Totals not selected | |
| 12 Rectal compliance (ml/cmH2O) Show forest plot | 1 | Mean Difference (IV, Fixed, 95% CI) | Totals not selected | |
| 13 Quality of life score (EQ‐5D) at 3 years Show forest plot | 1 | Mean Difference (IV, Fixed, 95% CI) | Totals not selected | |
| Outcome or subgroup title | No. of studies | No. of participants | Statistical method | Effect size |
| 1 Number of patients with recurrent full‐thickness prolapse Show forest plot | 3 | 115 | Odds Ratio (M‐H, Fixed, 95% CI) | 0.41 [0.11, 1.50] |
| 2 Number of patients with residual faecal incontinence Show forest plot | 3 | 115 | Odds Ratio (M‐H, Fixed, 95% CI) | 0.93 [0.43, 2.03] |
| 3 Vaizey incontinence score 3 years post‐op Show forest plot | 1 | Mean Difference (IV, Fixed, 95% CI) | Totals not selected | |
| 4 Number of patients with constipation due to surgery Show forest plot | 3 | 84 | Odds Ratio (M‐H, Fixed, 95% CI) | 0.14 [0.04, 0.44] |
| 5 Number of patients with postoperative complications Show forest plot | 2 | 97 | Odds Ratio (M‐H, Fixed, 95% CI) | 1.89 [0.76, 4.73] |
| 6 Bowel function (bowel thermometer) 3 years post‐op Show forest plot | 1 | Mean Difference (IV, Fixed, 95% CI) | Totals not selected | |
| 7 Maximum resting anal pressure (mmHg) Show forest plot | 1 | Mean Difference (IV, Fixed, 95% CI) | Totals not selected | |
| 8 Maximum rectal volumes (ml) Show forest plot | 1 | Mean Difference (IV, Fixed, 95% CI) | Totals not selected | |
| 9 Volume to first sensation (ml) Show forest plot | 1 | Mean Difference (IV, Fixed, 95% CI) | Totals not selected | |
| 10 Anorectal angle (postoperative) Show forest plot | 1 | Mean Difference (IV, Fixed, 95% CI) | Totals not selected | |
| 11 Rectal compliance (mmHg/ml) Show forest plot | 1 | Mean Difference (IV, Fixed, 95% CI) | Totals not selected | |
| 12 Postoperative transit time (days) Show forest plot | 1 | Mean Difference (IV, Fixed, 95% CI) | Totals not selected | |
| 13 Quality of life score (EQ‐5D) at 3 years Show forest plot | 1 | Mean Difference (IV, Fixed, 95% CI) | Totals not selected | |
| Outcome or subgroup title | No. of studies | No. of participants | Statistical method | Effect size |
| 1 Number of patients with recurrent full‐thickness prolapse Show forest plot | 1 | Odds Ratio (M‐H, Fixed, 95% CI) | Totals not selected | |
| 2 Mortality Show forest plot | 1 | Odds Ratio (M‐H, Fixed, 95% CI) | Totals not selected | |
| 3 Number of patients with complications Show forest plot | 1 | Odds Ratio (M‐H, Fixed, 95% CI) | Totals not selected | |