Cirugía para el prolapso rectal completo (de espesor total) en adultos
Información
- DOI:
- https://doi.org/10.1002/14651858.CD001758.pub3Copiar DOI

- Base de datos:
-
- Cochrane Database of Systematic Reviews
- Versión publicada:
-
- 24 noviembre 2015see what's new
- Tipo:
-
- Intervention
- Etapa:
-
- Review
- Grupo Editorial Cochrane:
-
Grupo Cochrane de Incontinencia
- Copyright:
-
- Copyright © 2015 The Cochrane Collaboration. Published by John Wiley & Sons, Ltd.
Cifras del artículo
Altmetric:
Citado por:
Autores
Contributions of authors
Samson Tou was involved in the search and grading of the literature as well as rewriting the review.
Steven Brown was involved in the search of the literature as well as editing the updated review.
Rick Nelson was involved in initiating and overseeing the project.
Sources of support
Internal sources
-
No sources of support supplied
External sources
-
The National Institute for Health Research (NIHR), UK.
This project was supported by the National Institute for Health Research, via Cochrane Infrastructure, Cochrane Programme Grant or Cochrane Incentive funding to the Incontinence Group. The views and opinions expressed therein are those of the authors and do not necessarily reflect those of the Systematic Reviews Programme, NIHR, NHS or the Department of Health.
Declarations of interest
Samson Tou: none known.
Steven Brown: none known.
Rick Nelson: none known.
Acknowledgements
This is an update of the Cochrane review originally written by Miriam Brazzelli, Paul Bachoo and Adrian Grant.
We would like to thank Lee Middleton and Asha Senapati for providing further information from the PROSPER trial; Muhammad Imran Omar, Sheila Wallace and Cathryn Glazener for their help and input in the preparation of the update; Christine Norton, Peter Herbison, Graham Williams and the other, anonymous reviewers, who offered critical appraisals; and Meggan Harris, for copy‐editing this review.
Version history
| Published | Title | Stage | Authors | Version |
| 2015 Nov 24 | Surgery for complete (full‐thickness) rectal prolapse in adults | Review | Samson Tou, Steven R Brown, Richard L Nelson | |
| 2008 Oct 08 | Surgery for complete rectal prolapse in adults | Review | Samson Tou, Steven R Brown, Ali Irqam Malik, Richard L Nelson | |
| 1999 Oct 25 | Surgery for complete rectal prolapse in adults | Review | Miriam Brazzelli, Paul Bachoo, Adrian Grant | |
Differences between protocol and review
The review has been significantly updated twice, but the original protocol remains unchanged. We have adopted GRADE for assessing the quality of evidence and have included the summary of findings table.
Keywords
MeSH
Medical Subject Headings (MeSH) Keywords
Medical Subject Headings Check Words
Adult; Humans;
PICO

PRISMA study flow diagram.

Risk of bias graph: review authors' judgements about each risk of bias item presented as percentages across all included studies.
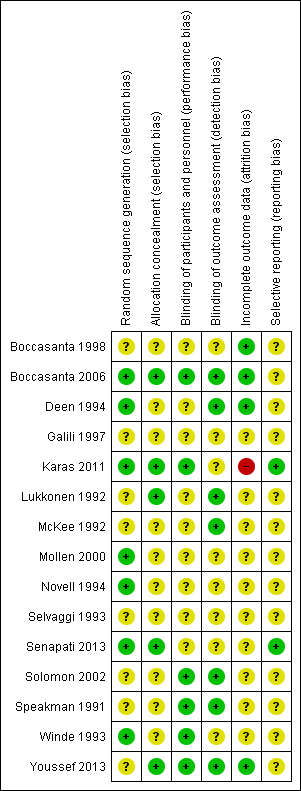
Risk of bias summary: review authors' judgements about each risk of bias item for each included study.
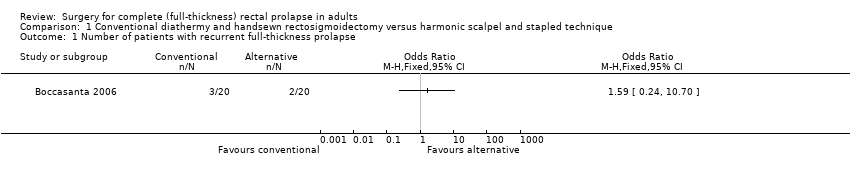
Comparison 1 Conventional diathermy and handsewn rectosigmoidectomy versus harmonic scalpel and stapled technique, Outcome 1 Number of patients with recurrent full‐thickness prolapse.

Comparison 1 Conventional diathermy and handsewn rectosigmoidectomy versus harmonic scalpel and stapled technique, Outcome 2 Incontinence score.

Comparison 1 Conventional diathermy and handsewn rectosigmoidectomy versus harmonic scalpel and stapled technique, Outcome 3 Hospital stay.
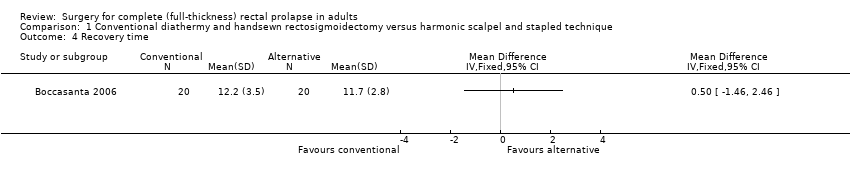
Comparison 1 Conventional diathermy and handsewn rectosigmoidectomy versus harmonic scalpel and stapled technique, Outcome 4 Recovery time.

Comparison 1 Conventional diathermy and handsewn rectosigmoidectomy versus harmonic scalpel and stapled technique, Outcome 5 Number of patients with defecatory problems.

Comparison 1 Conventional diathermy and handsewn rectosigmoidectomy versus harmonic scalpel and stapled technique, Outcome 6 Resting anal pressure (mmHg).

Comparison 1 Conventional diathermy and handsewn rectosigmoidectomy versus harmonic scalpel and stapled technique, Outcome 7 Squeeze pressure (mmHg).

Comparison 1 Conventional diathermy and handsewn rectosigmoidectomy versus harmonic scalpel and stapled technique, Outcome 8 Threshold volume (ml).
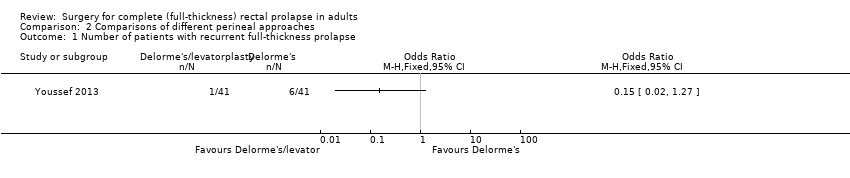
Comparison 2 Comparisons of different perineal approaches, Outcome 1 Number of patients with recurrent full‐thickness prolapse.

Comparison 2 Comparisons of different perineal approaches, Outcome 2 Number of patients with residual faecal incontinence.
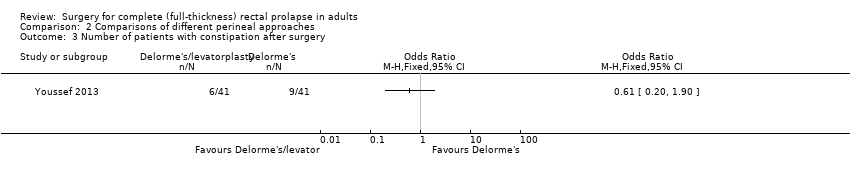
Comparison 2 Comparisons of different perineal approaches, Outcome 3 Number of patients with constipation after surgery.

Comparison 2 Comparisons of different perineal approaches, Outcome 4 Operating time (min).

Comparison 2 Comparisons of different perineal approaches, Outcome 5 Number of patients with postoperative complications.
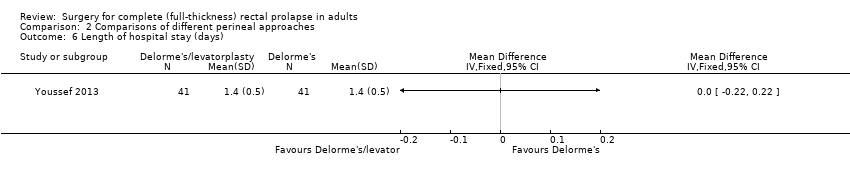
Comparison 2 Comparisons of different perineal approaches, Outcome 6 Length of hospital stay (days).

Comparison 2 Comparisons of different perineal approaches, Outcome 7 Postoperative maximum resting pressure.

Comparison 2 Comparisons of different perineal approaches, Outcome 8 Postoperative maximum squeeze pressure.
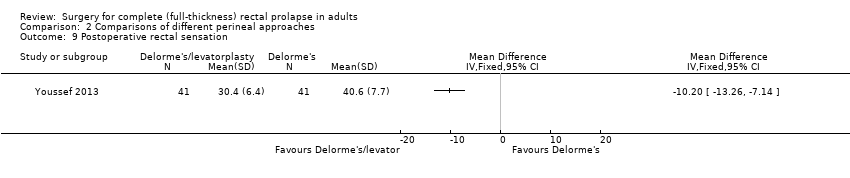
Comparison 2 Comparisons of different perineal approaches, Outcome 9 Postoperative rectal sensation.

Comparison 2 Comparisons of different perineal approaches, Outcome 10 Patient's postoperative satisfaction score.

Comparison 2 Comparisons of different perineal approaches, Outcome 11 Number of patients with recurrent full‐thickness prolapse.
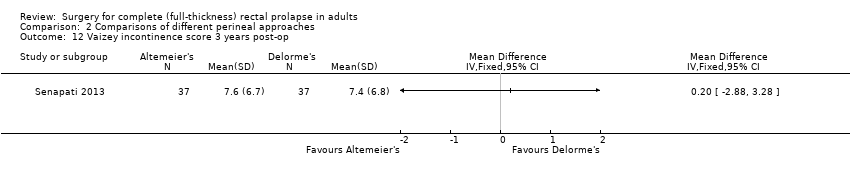
Comparison 2 Comparisons of different perineal approaches, Outcome 12 Vaizey incontinence score 3 years post‐op.

Comparison 2 Comparisons of different perineal approaches, Outcome 13 Bowel function (bowel thermometer) 3 years post‐op.

Comparison 2 Comparisons of different perineal approaches, Outcome 14 Quality of life score (EQ‐5D) at 3 years.

Comparison 3 Open abdominal Ivalon sponge rectopexy versus open abdominal suture rectopexy, Outcome 1 Number of patients with recurrent full‐thickness prolapse.

Comparison 3 Open abdominal Ivalon sponge rectopexy versus open abdominal suture rectopexy, Outcome 2 Number of patients with postoperative faecal incontinence.

Comparison 3 Open abdominal Ivalon sponge rectopexy versus open abdominal suture rectopexy, Outcome 3 Number of patients with constipation after surgery.
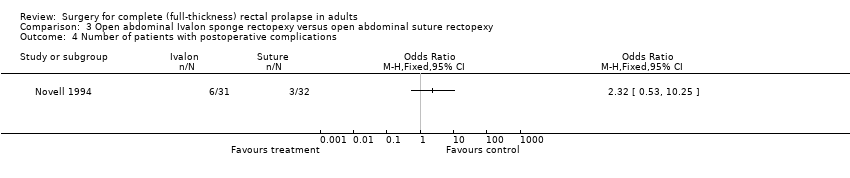
Comparison 3 Open abdominal Ivalon sponge rectopexy versus open abdominal suture rectopexy, Outcome 4 Number of patients with postoperative complications.
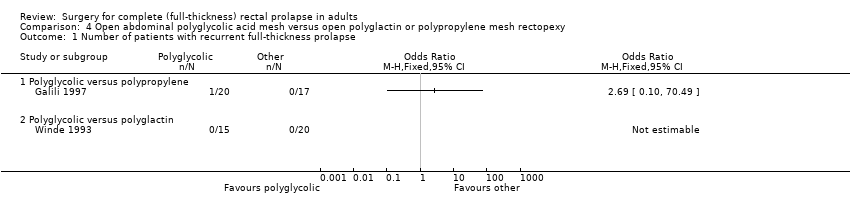
Comparison 4 Open abdominal polyglycolic acid mesh versus open polyglactin or polypropylene mesh rectopexy, Outcome 1 Number of patients with recurrent full‐thickness prolapse.

Comparison 4 Open abdominal polyglycolic acid mesh versus open polyglactin or polypropylene mesh rectopexy, Outcome 2 Number of patients with residual mucosal prolapse.

Comparison 4 Open abdominal polyglycolic acid mesh versus open polyglactin or polypropylene mesh rectopexy, Outcome 3 Number of patients with residual faecal incontinence.
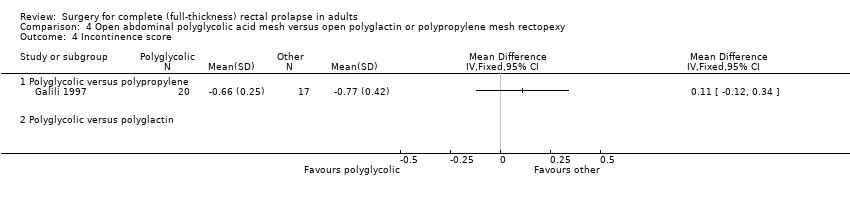
Comparison 4 Open abdominal polyglycolic acid mesh versus open polyglactin or polypropylene mesh rectopexy, Outcome 4 Incontinence score.
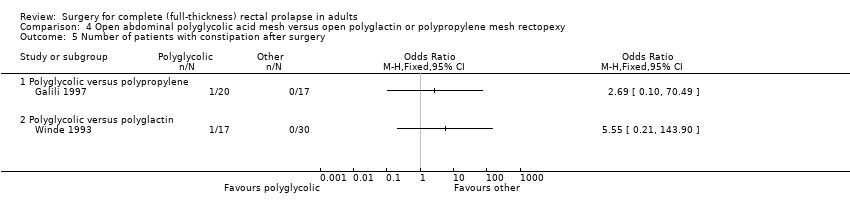
Comparison 4 Open abdominal polyglycolic acid mesh versus open polyglactin or polypropylene mesh rectopexy, Outcome 5 Number of patients with constipation after surgery.

Comparison 4 Open abdominal polyglycolic acid mesh versus open polyglactin or polypropylene mesh rectopexy, Outcome 6 Number of patients with postoperative complications.
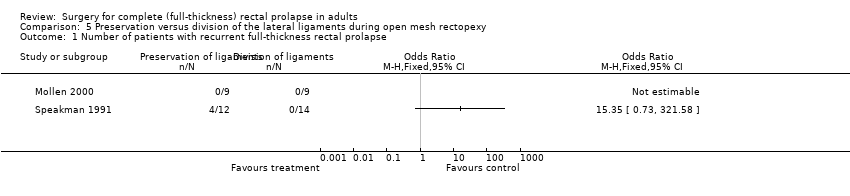
Comparison 5 Preservation versus division of the lateral ligaments during open mesh rectopexy, Outcome 1 Number of patients with recurrent full‐thickness rectal prolapse.

Comparison 5 Preservation versus division of the lateral ligaments during open mesh rectopexy, Outcome 2 Number of patients with residual mucosal prolapse only.

Comparison 5 Preservation versus division of the lateral ligaments during open mesh rectopexy, Outcome 3 Number of patients with constipation.

Comparison 5 Preservation versus division of the lateral ligaments during open mesh rectopexy, Outcome 4 Constipation score.
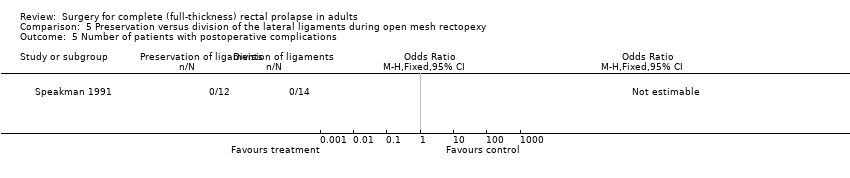
Comparison 5 Preservation versus division of the lateral ligaments during open mesh rectopexy, Outcome 5 Number of patients with postoperative complications.
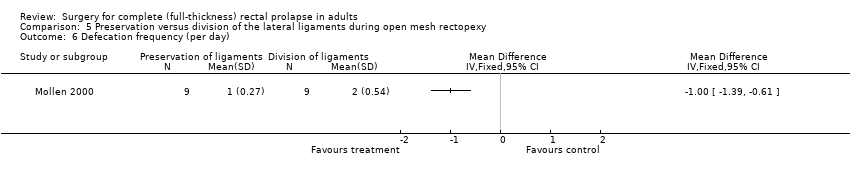
Comparison 5 Preservation versus division of the lateral ligaments during open mesh rectopexy, Outcome 6 Defecation frequency (per day).
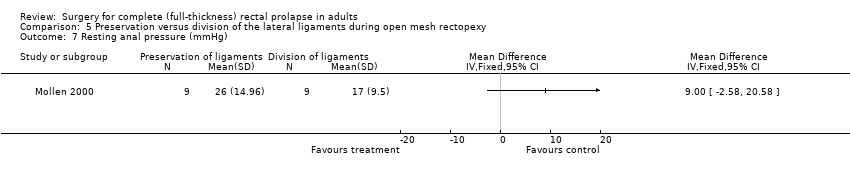
Comparison 5 Preservation versus division of the lateral ligaments during open mesh rectopexy, Outcome 7 Resting anal pressure (mmHg).
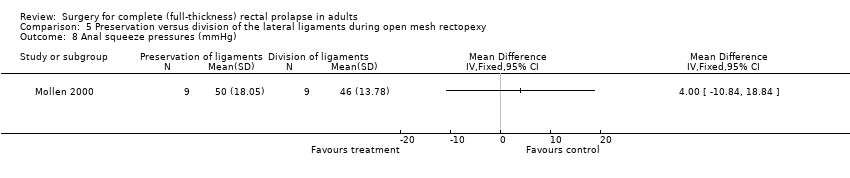
Comparison 5 Preservation versus division of the lateral ligaments during open mesh rectopexy, Outcome 8 Anal squeeze pressures (mmHg).

Comparison 5 Preservation versus division of the lateral ligaments during open mesh rectopexy, Outcome 9 Compliance (ml/mmHg).

Comparison 6 Laparoscopic versus open procedure, Outcome 1 Number of patients with recurrent full‐thickness prolapse.

Comparison 6 Laparoscopic versus open procedure, Outcome 2 Number of patients with residual mucosal prolapse only.

Comparison 6 Laparoscopic versus open procedure, Outcome 3 Incontinence score.
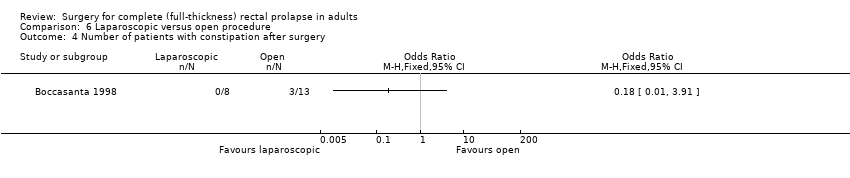
Comparison 6 Laparoscopic versus open procedure, Outcome 4 Number of patients with constipation after surgery.
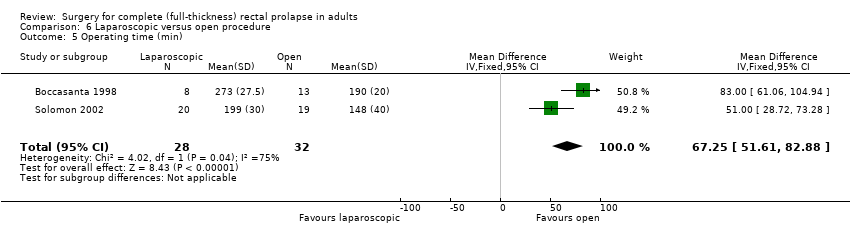
Comparison 6 Laparoscopic versus open procedure, Outcome 5 Operating time (min).

Comparison 6 Laparoscopic versus open procedure, Outcome 6 Number of patients with postoperative complications.

Comparison 6 Laparoscopic versus open procedure, Outcome 7 Length of hospital stay (days).

Comparison 6 Laparoscopic versus open procedure, Outcome 8 Maximum resting anal pressure (cmH2O).

Comparison 6 Laparoscopic versus open procedure, Outcome 9 Maximum squeeze pressure.
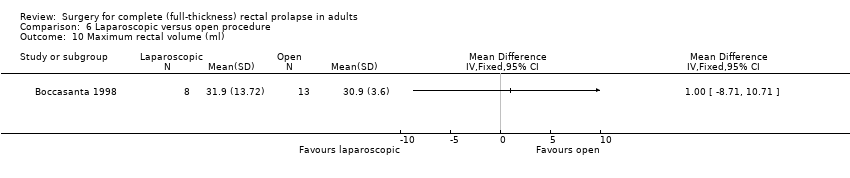
Comparison 6 Laparoscopic versus open procedure, Outcome 10 Maximum rectal volume (ml).
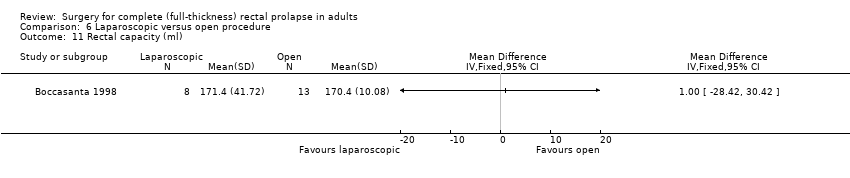
Comparison 6 Laparoscopic versus open procedure, Outcome 11 Rectal capacity (ml).

Comparison 6 Laparoscopic versus open procedure, Outcome 12 Total cost (USD).
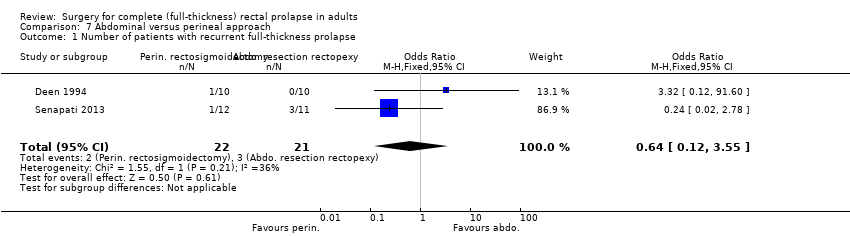
Comparison 7 Abdominal versus perineal approach, Outcome 1 Number of patients with recurrent full‐thickness prolapse.

Comparison 7 Abdominal versus perineal approach, Outcome 2 Number of patients with recurrent full‐thickness prolapse.

Comparison 7 Abdominal versus perineal approach, Outcome 3 Number of patients with residual mucosal prolapse only.
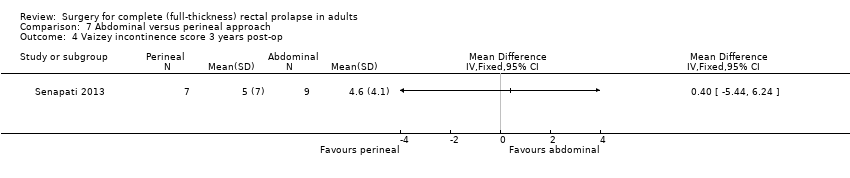
Comparison 7 Abdominal versus perineal approach, Outcome 4 Vaizey incontinence score 3 years post‐op.
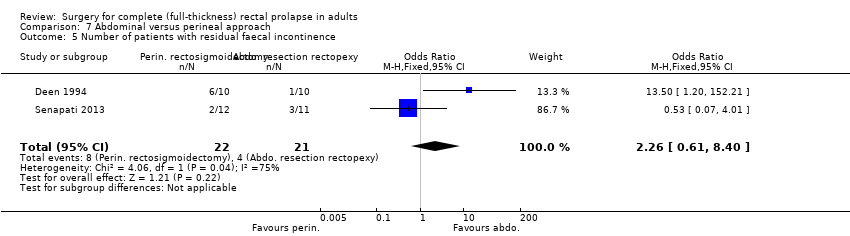
Comparison 7 Abdominal versus perineal approach, Outcome 5 Number of patients with residual faecal incontinence.
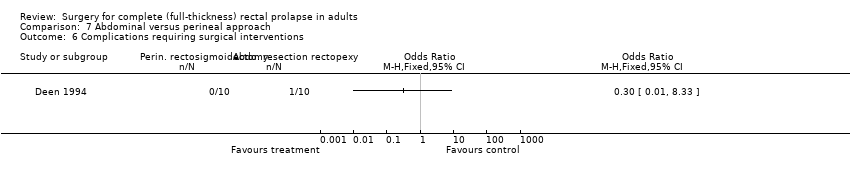
Comparison 7 Abdominal versus perineal approach, Outcome 6 Complications requiring surgical interventions.

Comparison 7 Abdominal versus perineal approach, Outcome 7 Number of patients with postoperative complications.

Comparison 7 Abdominal versus perineal approach, Outcome 8 Bowel function (bowel thermometer) 3 years post‐op.
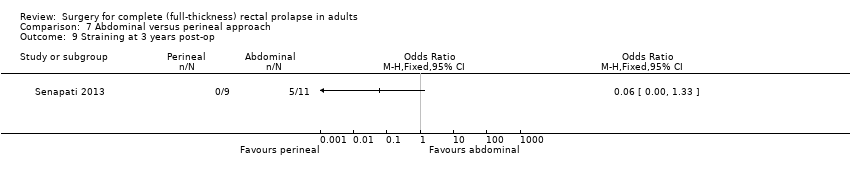
Comparison 7 Abdominal versus perineal approach, Outcome 9 Straining at 3 years post‐op.

Comparison 7 Abdominal versus perineal approach, Outcome 10 Maximum resting pressure (cmH2O).

Comparison 7 Abdominal versus perineal approach, Outcome 11 Maximum squeeze pressure (cmH2O).
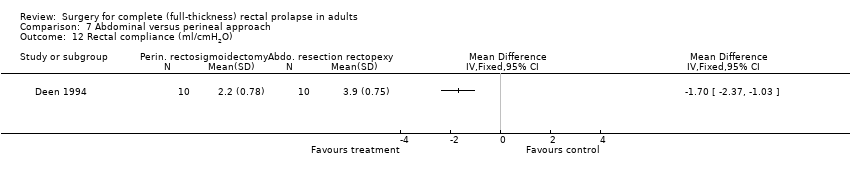
Comparison 7 Abdominal versus perineal approach, Outcome 12 Rectal compliance (ml/cmH2O).

Comparison 7 Abdominal versus perineal approach, Outcome 13 Quality of life score (EQ‐5D) at 3 years.

Comparison 8 Resection versus no resection rectopexy, Outcome 1 Number of patients with recurrent full‐thickness prolapse.

Comparison 8 Resection versus no resection rectopexy, Outcome 2 Number of patients with residual faecal incontinence.

Comparison 8 Resection versus no resection rectopexy, Outcome 3 Vaizey incontinence score 3 years post‐op.

Comparison 8 Resection versus no resection rectopexy, Outcome 4 Number of patients with constipation due to surgery.
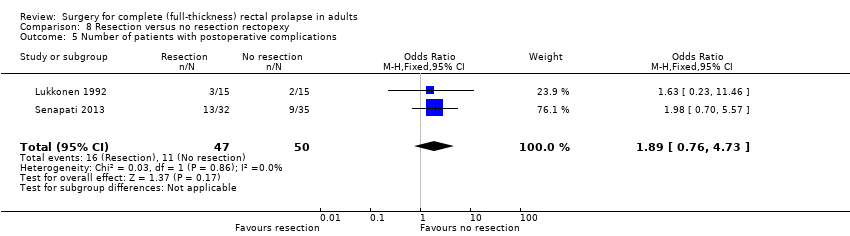
Comparison 8 Resection versus no resection rectopexy, Outcome 5 Number of patients with postoperative complications.

Comparison 8 Resection versus no resection rectopexy, Outcome 6 Bowel function (bowel thermometer) 3 years post‐op.

Comparison 8 Resection versus no resection rectopexy, Outcome 7 Maximum resting anal pressure (mmHg).

Comparison 8 Resection versus no resection rectopexy, Outcome 8 Maximum rectal volumes (ml).

Comparison 8 Resection versus no resection rectopexy, Outcome 9 Volume to first sensation (ml).

Comparison 8 Resection versus no resection rectopexy, Outcome 10 Anorectal angle (postoperative).
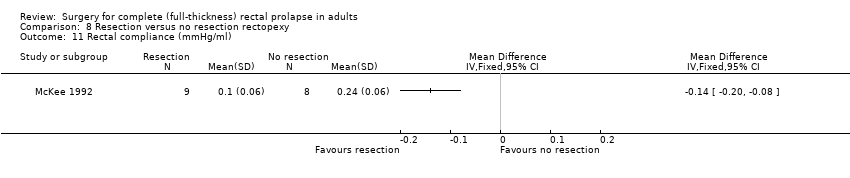
Comparison 8 Resection versus no resection rectopexy, Outcome 11 Rectal compliance (mmHg/ml).
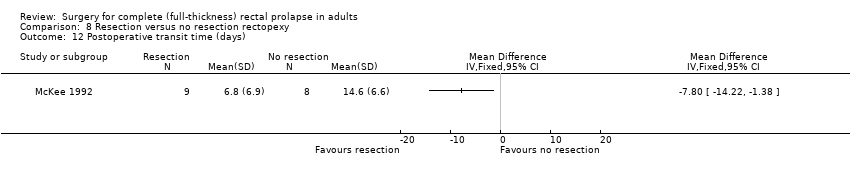
Comparison 8 Resection versus no resection rectopexy, Outcome 12 Postoperative transit time (days).

Comparison 8 Resection versus no resection rectopexy, Outcome 13 Quality of life score (EQ‐5D) at 3 years.

Comparison 9 Rectopexy versus no rectopexy, Outcome 1 Number of patients with recurrent full‐thickness prolapse.
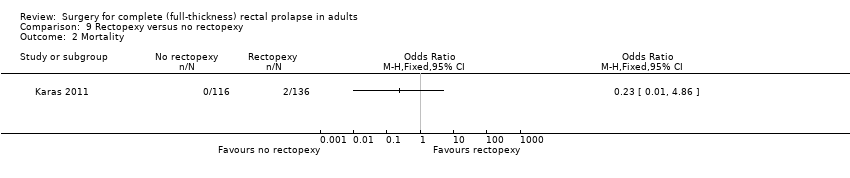
Comparison 9 Rectopexy versus no rectopexy, Outcome 2 Mortality.
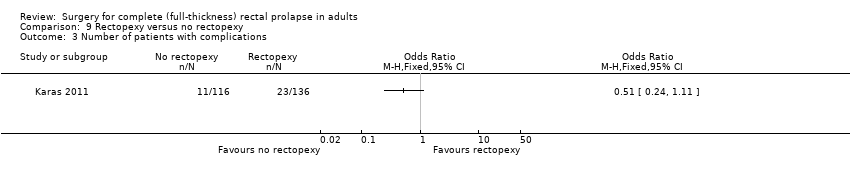
Comparison 9 Rectopexy versus no rectopexy, Outcome 3 Number of patients with complications.
| Perineal compared with abdominal approach for full‐thickness rectal prolapse in adults | ||||||
| Patients: Adults with full‐thickness rectal prolapse Setting: Surgical centres in India, Finland, Serbia, Spain, UK Interventions: perineal versus abdominal surgery | ||||||
| Outcomes | Anticipated absolute effects (95% CI) | Relative effect | No. of participants | Quality of the evidence | Comments | |
| Assumed risk (with abdominal approach) | Corresponding risk (with perineal approach) | |||||
| Number of patients with recurrent full‐thickness prolapse | Moderate risk (study population) | OR 0.7 (0.17 to 2.88) | 44 (1 RCT) | ⊕⊕⊕ | A pragmatic trial, participants could be randomised between abdominal or perineal surgery. The abdominal procedure was performed through an open or laparoscopic approach depending on surgeon's preference. For perineal surgery, participants could be randomised to a Delorme's or an Altemeier's procedure. It was the surgeon's choice to participate in either or both of the randomisations. | |
| 263 per 1000 | 200 per 1000 | |||||
| Vaizey incontinence score 3 years post‐op | The mean Vaizey incontinence score 3 years post‐op in the control group was 4.6 | The mean Vaizey incontinence score 3 years post‐op in the intervention group was 5 higher (5.44 lower to 6.24 higher) | — | 16 (1 RCT) | ⊕⊕⊕ | The Vaizey scores ranged from 0 (perfect continence) to 24 (totally incontinent) |
| Number of patients with postoperative complications | Moderate risk (study population) | OR 0.65 (0.19 to 2.23) | 44 (1 RCT) | ⊕⊕⊕ | — | |
| 421 per 1000 | 321 per 1000 (121 to 619) | |||||
| Bowel function (bowel thermometer) 3 years post‐op | The mean bowel function (bowel thermometer) 3 years post‐op in the control group was 52 | The mean bowel function (bowel thermometer) 3 years post‐op in the intervention group was 50 higher (31.69 lower to 27.69 higher) | — | 9 (1 RCT) | ⊕⊕⊕ | Bowel function rated by participants, 0 (worst) to 100 (best) |
| Quality of life score (EQ‐5D) at 3 years | The mean quality of life score (EQ‐5D) at 3 years in the control group was 0.73 | the mean quality of life score (EQ‐5D) at 3 years in the intervention group was 0.86 higher (0.14 lower to 0.4 higher) | — | 14 (1 RCT) | ⊕⊕⊕ | EQ‐5D quality of life scores range from − 0.59 (worst) − 1.0 (perfect health) |
| Straining at 3 years post‐op | Moderate risk (study population) | OR 0.06 (0 to 1.33) | 20 (1 RCT) | ⊕⊕⊕ | — | |
| 455 per 1000 | 48 per 1000 (0 to 526) | |||||
| CI: Confidence interval; OR: Odds Ratio; RCT: randomised controlled trial. | ||||||
| GRADE Working Group grades of evidence | ||||||
| aDowngraded one level for imprecision; single trial with small sample size and wide confidence interval | ||||||
| Outcome or subgroup title | No. of studies | No. of participants | Statistical method | Effect size |
| 1 Number of patients with recurrent full‐thickness prolapse Show forest plot | 1 | Odds Ratio (M‐H, Fixed, 95% CI) | Totals not selected | |
| 2 Incontinence score Show forest plot | 1 | Mean Difference (IV, Fixed, 95% CI) | Totals not selected | |
| 3 Hospital stay Show forest plot | 1 | Mean Difference (IV, Fixed, 95% CI) | Totals not selected | |
| 4 Recovery time Show forest plot | 1 | Mean Difference (IV, Fixed, 95% CI) | Totals not selected | |
| 5 Number of patients with defecatory problems Show forest plot | 1 | Odds Ratio (M‐H, Fixed, 95% CI) | Totals not selected | |
| 6 Resting anal pressure (mmHg) Show forest plot | 1 | Mean Difference (IV, Fixed, 95% CI) | Totals not selected | |
| 7 Squeeze pressure (mmHg) Show forest plot | 1 | Mean Difference (IV, Fixed, 95% CI) | Totals not selected | |
| 8 Threshold volume (ml) Show forest plot | 1 | Mean Difference (IV, Fixed, 95% CI) | Totals not selected | |
| Outcome or subgroup title | No. of studies | No. of participants | Statistical method | Effect size |
| 1 Number of patients with recurrent full‐thickness prolapse Show forest plot | 1 | Odds Ratio (M‐H, Fixed, 95% CI) | Totals not selected | |
| 2 Number of patients with residual faecal incontinence Show forest plot | 1 | Odds Ratio (M‐H, Fixed, 95% CI) | Totals not selected | |
| 3 Number of patients with constipation after surgery Show forest plot | 1 | Odds Ratio (M‐H, Fixed, 95% CI) | Totals not selected | |
| 4 Operating time (min) Show forest plot | 1 | Mean Difference (IV, Fixed, 95% CI) | Totals not selected | |
| 5 Number of patients with postoperative complications Show forest plot | 1 | Odds Ratio (M‐H, Fixed, 95% CI) | Totals not selected | |
| 6 Length of hospital stay (days) Show forest plot | 1 | Mean Difference (IV, Fixed, 95% CI) | Totals not selected | |
| 7 Postoperative maximum resting pressure Show forest plot | 1 | Mean Difference (IV, Fixed, 95% CI) | Totals not selected | |
| 8 Postoperative maximum squeeze pressure Show forest plot | 1 | Mean Difference (IV, Fixed, 95% CI) | Totals not selected | |
| 9 Postoperative rectal sensation Show forest plot | 1 | Mean Difference (IV, Fixed, 95% CI) | Totals not selected | |
| 10 Patient's postoperative satisfaction score Show forest plot | 1 | Mean Difference (IV, Fixed, 95% CI) | Totals not selected | |
| 11 Number of patients with recurrent full‐thickness prolapse Show forest plot | 1 | Odds Ratio (M‐H, Fixed, 95% CI) | Totals not selected | |
| 12 Vaizey incontinence score 3 years post‐op Show forest plot | 1 | Mean Difference (IV, Fixed, 95% CI) | Totals not selected | |
| 13 Bowel function (bowel thermometer) 3 years post‐op Show forest plot | 1 | Mean Difference (IV, Fixed, 95% CI) | Totals not selected | |
| 14 Quality of life score (EQ‐5D) at 3 years Show forest plot | 1 | Mean Difference (IV, Fixed, 95% CI) | Totals not selected | |
| Outcome or subgroup title | No. of studies | No. of participants | Statistical method | Effect size |
| 1 Number of patients with recurrent full‐thickness prolapse Show forest plot | 1 | Odds Ratio (M‐H, Fixed, 95% CI) | Totals not selected | |
| 2 Number of patients with postoperative faecal incontinence Show forest plot | 1 | Odds Ratio (M‐H, Fixed, 95% CI) | Totals not selected | |
| 3 Number of patients with constipation after surgery Show forest plot | 1 | Odds Ratio (M‐H, Fixed, 95% CI) | Totals not selected | |
| 4 Number of patients with postoperative complications Show forest plot | 1 | Odds Ratio (M‐H, Fixed, 95% CI) | Totals not selected | |
| Outcome or subgroup title | No. of studies | No. of participants | Statistical method | Effect size |
| 1 Number of patients with recurrent full‐thickness prolapse Show forest plot | 2 | Odds Ratio (M‐H, Fixed, 95% CI) | Totals not selected | |
| 1.1 Polyglycolic versus polypropylene | 1 | Odds Ratio (M‐H, Fixed, 95% CI) | 0.0 [0.0, 0.0] | |
| 1.2 Polyglycolic versus polyglactin | 1 | Odds Ratio (M‐H, Fixed, 95% CI) | 0.0 [0.0, 0.0] | |
| 2 Number of patients with residual mucosal prolapse Show forest plot | 2 | Odds Ratio (M‐H, Fixed, 95% CI) | Totals not selected | |
| 2.1 Polyglycolic versus polypropylene | 1 | Odds Ratio (M‐H, Fixed, 95% CI) | 0.0 [0.0, 0.0] | |
| 2.2 Polyglycolic versus polyglactin | 1 | Odds Ratio (M‐H, Fixed, 95% CI) | 0.0 [0.0, 0.0] | |
| 3 Number of patients with residual faecal incontinence Show forest plot | 1 | Odds Ratio (M‐H, Fixed, 95% CI) | Totals not selected | |
| 3.1 Polyglycolic versus polypropylene | 0 | Odds Ratio (M‐H, Fixed, 95% CI) | 0.0 [0.0, 0.0] | |
| 3.2 Polyglycolic versus polyglactin | 1 | Odds Ratio (M‐H, Fixed, 95% CI) | 0.0 [0.0, 0.0] | |
| 4 Incontinence score Show forest plot | 1 | Mean Difference (IV, Fixed, 95% CI) | Totals not selected | |
| 4.1 Polyglycolic versus polypropylene | 1 | Mean Difference (IV, Fixed, 95% CI) | 0.0 [0.0, 0.0] | |
| 4.2 Polyglycolic versus polyglactin | 0 | Mean Difference (IV, Fixed, 95% CI) | 0.0 [0.0, 0.0] | |
| 5 Number of patients with constipation after surgery Show forest plot | 2 | Odds Ratio (M‐H, Fixed, 95% CI) | Totals not selected | |
| 5.1 Polyglycolic versus polypropylene | 1 | Odds Ratio (M‐H, Fixed, 95% CI) | 0.0 [0.0, 0.0] | |
| 5.2 Polyglycolic versus polyglactin | 1 | Odds Ratio (M‐H, Fixed, 95% CI) | 0.0 [0.0, 0.0] | |
| 6 Number of patients with postoperative complications Show forest plot | 2 | Odds Ratio (M‐H, Fixed, 95% CI) | Totals not selected | |
| 6.1 Polyglycolic versus polypropylene | 1 | Odds Ratio (M‐H, Fixed, 95% CI) | 0.0 [0.0, 0.0] | |
| 6.2 Polyglycolic versus polyglactin | 1 | Odds Ratio (M‐H, Fixed, 95% CI) | 0.0 [0.0, 0.0] | |
| Outcome or subgroup title | No. of studies | No. of participants | Statistical method | Effect size |
| 1 Number of patients with recurrent full‐thickness rectal prolapse Show forest plot | 2 | Odds Ratio (M‐H, Fixed, 95% CI) | Totals not selected | |
| 2 Number of patients with residual mucosal prolapse only Show forest plot | 1 | Odds Ratio (M‐H, Fixed, 95% CI) | Totals not selected | |
| 3 Number of patients with constipation Show forest plot | 2 | 44 | Odds Ratio (M‐H, Fixed, 95% CI) | 0.32 [0.08, 1.23] |
| 4 Constipation score Show forest plot | 1 | Mean Difference (IV, Fixed, 95% CI) | Totals not selected | |
| 5 Number of patients with postoperative complications Show forest plot | 1 | Odds Ratio (M‐H, Fixed, 95% CI) | Totals not selected | |
| 6 Defecation frequency (per day) Show forest plot | 1 | Mean Difference (IV, Fixed, 95% CI) | Totals not selected | |
| 7 Resting anal pressure (mmHg) Show forest plot | 1 | Mean Difference (IV, Fixed, 95% CI) | Totals not selected | |
| 8 Anal squeeze pressures (mmHg) Show forest plot | 1 | Mean Difference (IV, Fixed, 95% CI) | Totals not selected | |
| 9 Compliance (ml/mmHg) Show forest plot | 1 | Mean Difference (IV, Fixed, 95% CI) | Totals not selected | |
| Outcome or subgroup title | No. of studies | No. of participants | Statistical method | Effect size |
| 1 Number of patients with recurrent full‐thickness prolapse Show forest plot | 1 | Odds Ratio (M‐H, Fixed, 95% CI) | Totals not selected | |
| 2 Number of patients with residual mucosal prolapse only Show forest plot | 1 | Odds Ratio (M‐H, Fixed, 95% CI) | Totals not selected | |
| 3 Incontinence score Show forest plot | 1 | Mean Difference (IV, Fixed, 95% CI) | Totals not selected | |
| 4 Number of patients with constipation after surgery Show forest plot | 1 | Odds Ratio (M‐H, Fixed, 95% CI) | Totals not selected | |
| 5 Operating time (min) Show forest plot | 2 | 60 | Mean Difference (IV, Fixed, 95% CI) | 67.25 [51.61, 82.88] |
| 6 Number of patients with postoperative complications Show forest plot | 1 | Odds Ratio (M‐H, Fixed, 95% CI) | Totals not selected | |
| 7 Length of hospital stay (days) Show forest plot | 2 | 60 | Mean Difference (IV, Fixed, 95% CI) | ‐2.35 [‐3.33, ‐1.37] |
| 8 Maximum resting anal pressure (cmH2O) Show forest plot | 1 | Mean Difference (IV, Fixed, 95% CI) | Totals not selected | |
| 9 Maximum squeeze pressure Show forest plot | 1 | Mean Difference (IV, Fixed, 95% CI) | Totals not selected | |
| 10 Maximum rectal volume (ml) Show forest plot | 1 | Mean Difference (IV, Fixed, 95% CI) | Totals not selected | |
| 11 Rectal capacity (ml) Show forest plot | 1 | Mean Difference (IV, Fixed, 95% CI) | Totals not selected | |
| 12 Total cost (USD) Show forest plot | 2 | 60 | Std. Mean Difference (IV, Fixed, 95% CI) | ‐0.84 [‐1.41, ‐0.28] |
| Outcome or subgroup title | No. of studies | No. of participants | Statistical method | Effect size |
| 1 Number of patients with recurrent full‐thickness prolapse Show forest plot | 2 | 43 | Odds Ratio (M‐H, Fixed, 95% CI) | 0.64 [0.12, 3.55] |
| 2 Number of patients with recurrent full‐thickness prolapse Show forest plot | 1 | Odds Ratio (M‐H, Random, 95% CI) | Totals not selected | |
| 3 Number of patients with residual mucosal prolapse only Show forest plot | 1 | Odds Ratio (M‐H, Fixed, 95% CI) | Totals not selected | |
| 4 Vaizey incontinence score 3 years post‐op Show forest plot | 1 | Mean Difference (IV, Fixed, 95% CI) | Totals not selected | |
| 5 Number of patients with residual faecal incontinence Show forest plot | 2 | 43 | Odds Ratio (M‐H, Fixed, 95% CI) | 2.26 [0.61, 8.40] |
| 6 Complications requiring surgical interventions Show forest plot | 1 | Odds Ratio (M‐H, Fixed, 95% CI) | Totals not selected | |
| 7 Number of patients with postoperative complications Show forest plot | 2 | 64 | Odds Ratio (M‐H, Fixed, 95% CI) | 0.46 [0.15, 1.37] |
| 8 Bowel function (bowel thermometer) 3 years post‐op Show forest plot | 1 | Mean Difference (IV, Fixed, 95% CI) | Totals not selected | |
| 9 Straining at 3 years post‐op Show forest plot | 1 | Odds Ratio (M‐H, Fixed, 95% CI) | Totals not selected | |
| 10 Maximum resting pressure (cmH2O) Show forest plot | 1 | Mean Difference (IV, Fixed, 95% CI) | Totals not selected | |
| 11 Maximum squeeze pressure (cmH2O) Show forest plot | 1 | Mean Difference (IV, Fixed, 95% CI) | Totals not selected | |
| 12 Rectal compliance (ml/cmH2O) Show forest plot | 1 | Mean Difference (IV, Fixed, 95% CI) | Totals not selected | |
| 13 Quality of life score (EQ‐5D) at 3 years Show forest plot | 1 | Mean Difference (IV, Fixed, 95% CI) | Totals not selected | |
| Outcome or subgroup title | No. of studies | No. of participants | Statistical method | Effect size |
| 1 Number of patients with recurrent full‐thickness prolapse Show forest plot | 3 | 115 | Odds Ratio (M‐H, Fixed, 95% CI) | 0.41 [0.11, 1.50] |
| 2 Number of patients with residual faecal incontinence Show forest plot | 3 | 115 | Odds Ratio (M‐H, Fixed, 95% CI) | 0.93 [0.43, 2.03] |
| 3 Vaizey incontinence score 3 years post‐op Show forest plot | 1 | Mean Difference (IV, Fixed, 95% CI) | Totals not selected | |
| 4 Number of patients with constipation due to surgery Show forest plot | 3 | 84 | Odds Ratio (M‐H, Fixed, 95% CI) | 0.14 [0.04, 0.44] |
| 5 Number of patients with postoperative complications Show forest plot | 2 | 97 | Odds Ratio (M‐H, Fixed, 95% CI) | 1.89 [0.76, 4.73] |
| 6 Bowel function (bowel thermometer) 3 years post‐op Show forest plot | 1 | Mean Difference (IV, Fixed, 95% CI) | Totals not selected | |
| 7 Maximum resting anal pressure (mmHg) Show forest plot | 1 | Mean Difference (IV, Fixed, 95% CI) | Totals not selected | |
| 8 Maximum rectal volumes (ml) Show forest plot | 1 | Mean Difference (IV, Fixed, 95% CI) | Totals not selected | |
| 9 Volume to first sensation (ml) Show forest plot | 1 | Mean Difference (IV, Fixed, 95% CI) | Totals not selected | |
| 10 Anorectal angle (postoperative) Show forest plot | 1 | Mean Difference (IV, Fixed, 95% CI) | Totals not selected | |
| 11 Rectal compliance (mmHg/ml) Show forest plot | 1 | Mean Difference (IV, Fixed, 95% CI) | Totals not selected | |
| 12 Postoperative transit time (days) Show forest plot | 1 | Mean Difference (IV, Fixed, 95% CI) | Totals not selected | |
| 13 Quality of life score (EQ‐5D) at 3 years Show forest plot | 1 | Mean Difference (IV, Fixed, 95% CI) | Totals not selected | |
| Outcome or subgroup title | No. of studies | No. of participants | Statistical method | Effect size |
| 1 Number of patients with recurrent full‐thickness prolapse Show forest plot | 1 | Odds Ratio (M‐H, Fixed, 95% CI) | Totals not selected | |
| 2 Mortality Show forest plot | 1 | Odds Ratio (M‐H, Fixed, 95% CI) | Totals not selected | |
| 3 Number of patients with complications Show forest plot | 1 | Odds Ratio (M‐H, Fixed, 95% CI) | Totals not selected | |