| 1 Number of patients with recurrent full‐thickness prolapse Show forest plot | 2 | | Odds Ratio (M‐H, Fixed, 95% CI) | Totals not selected |
|
| 1.1 Polyglycolic versus polypropylene | 1 | | Odds Ratio (M‐H, Fixed, 95% CI) | 0.0 [0.0, 0.0] |
| 1.2 Polyglycolic versus polyglactin | 1 | | Odds Ratio (M‐H, Fixed, 95% CI) | 0.0 [0.0, 0.0] |
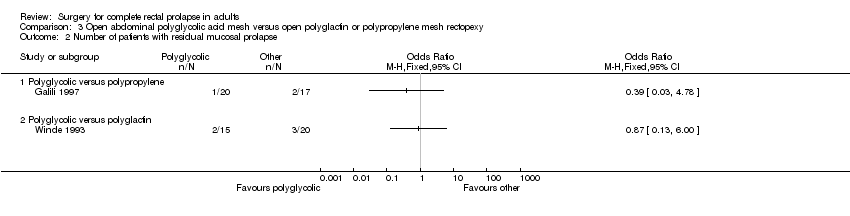
| 2 Number of patients with residual mucosal prolapse Show forest plot | 2 | | Odds Ratio (M‐H, Fixed, 95% CI) | Totals not selected |
|
| 2.1 Polyglycolic versus polypropylene | 1 | | Odds Ratio (M‐H, Fixed, 95% CI) | 0.0 [0.0, 0.0] |
| 2.2 Polyglycolic versus polyglactin | 1 | | Odds Ratio (M‐H, Fixed, 95% CI) | 0.0 [0.0, 0.0] |
| 3 Number of patients with residual faecal incontinence Show forest plot | 1 | | Odds Ratio (M‐H, Fixed, 95% CI) | Totals not selected |
|
| 3.1 Polyglycolic versus polypropylene | 0 | | Odds Ratio (M‐H, Fixed, 95% CI) | 0.0 [0.0, 0.0] |
| 3.2 Polyglycolic versus polyglactin | 1 | | Odds Ratio (M‐H, Fixed, 95% CI) | 0.0 [0.0, 0.0] |
| 4 Number of patients with post‐operative complications Show forest plot | 2 | | Odds Ratio (M‐H, Fixed, 95% CI) | Totals not selected |
|
| 4.1 Polyglycolic versus polypropylene | 1 | | Odds Ratio (M‐H, Fixed, 95% CI) | 0.0 [0.0, 0.0] |
| 4.2 Polyglycolic versus polyglactin | 1 | | Odds Ratio (M‐H, Fixed, 95% CI) | 0.0 [0.0, 0.0] |
| 5 Number of patients with constipation after surgery Show forest plot | 2 | | Odds Ratio (M‐H, Fixed, 95% CI) | Totals not selected |
|
| 5.1 Polyglycolic versus polypropylene | 1 | | Odds Ratio (M‐H, Fixed, 95% CI) | 0.0 [0.0, 0.0] |
| 5.2 Polyglycolic versus polyglactin | 1 | | Odds Ratio (M‐H, Fixed, 95% CI) | 0.0 [0.0, 0.0] |
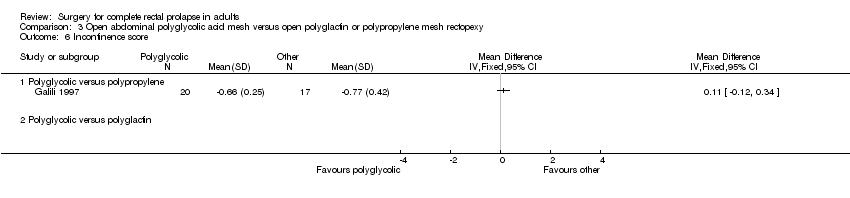
| 6 Incontinence score Show forest plot | 1 | | Mean Difference (IV, Fixed, 95% CI) | Totals not selected |
|
| 6.1 Polyglycolic versus polypropylene | 1 | | Mean Difference (IV, Fixed, 95% CI) | 0.0 [0.0, 0.0] |
| 6.2 Polyglycolic versus polyglactin | 0 | | Mean Difference (IV, Fixed, 95% CI) | 0.0 [0.0, 0.0] |