Superficies de apoyo para la prevención de úlceras por presión
Appendices
Appendix 1. Ovid MEDLINE Search Strategy
1 exp Beds/
2 mattress$.mp.
3 cushion$.mp.
4 (foam or transfoam).mp.
5 overlay$.mp.
6 (pad or pads).ti,ab.
7 gel.ti,ab.
8 pressure relie$.mp.
9 pressure reduc$.mp.
10 pressure alleviat$.mp.
11 (low pressure adj2 device$).mp.
12 (low pressure adj2 support).mp.
13 (constant adj2 pressure).mp.
14 static air.mp.
15 (alternat$ adj pressure).mp.
16 air suspension$.mp.
17 air bag$.mp.
18 water suspension$.mp.
19 (elevation adj2 device$).mp.
20 (clinifloat or maxifloat or vaperm or therarest or sheepskin or hammock or foot waffle or silicore or pegasus or cairwave).mp.
21 ((turn$ or tilt$) adj (bed$ or frame$)).mp.
22 (kinetic adj (therapy or table$)).mp.
23 net bed$.mp.
24 (positioning or repositioning).mp.
25 or/1‐24
26 exp Pressure Ulcer/
27 (pressure adj (ulcer$ or sore$)).mp.
28 (decubitus adj (ulcer$ or sore$)).mp.
29 (bed adj (ulcer$ or sore$)).mp.
30 or/26‐29
31 25 and 30
Appendix 2. Ovid EMBASE Search Strategy
1 exp Bed/
2 mattress$.mp.
3 cushion$.mp.
4 (foam or transfoam).mp.
5 overlay$.mp.
6 (pad or pads).ti,ab.
7 gel.ti,ab.
8 pressure relie$.mp.
9 pressure reduc$.mp.
10 pressure alleviat$.mp.
11 (low pressure adj2 device$).mp.
12 (low pressure adj2 support).mp.
13 (constant adj2 pressure).mp.
14 static air.mp.
15 (alternat$ adj pressure).mp.
16 air suspension$.mp.
17 air bag$.mp.
18 water suspension$.mp.
19 (elevation adj2 device$).mp.
20 (clinifloat or maxifloat or vaperm or therarest or sheepskin or hammock or foot waffle or silicore or pegasus or cairwave).mp.
21 ((turn$ or tilt$) adj (bed$ or frame$)).mp.
22 (kinetic adj (therapy or table$)).mp.
23 net bed$.mp.
24 (positioning or repositioning).mp.
25 or/1‐24
26 exp Decubitus/
27 (pressure adj (ulcer$ or sore$)).mp.
28 (decubitus adj (ulcer$ or sore$)).mp.
29 (bed adj (ulcer$ or sore$)).mp.
30 or/26‐29
31 25 and 30
Appendix 3. EBSCO CINAHL Search Strategy
S29 S23 and S28
S28 S24 or S25 or S26 or S27
S27 TI decubitus or AB decubitus
S26 TI ( bed sore* or bedsore* ) or AB ( bed sore* or bedsore* )
S25 TI ( pressure ulcer* or pressure sore* ) or AB ( pressure ulcer* or pressure sore* )
S24 (MH "Pressure Ulcer")
S23 S1 or S2 or S3 or S4 or S5 or S6 or S7 or S8 or S9 or S10 or S11 or S12 or S13 or S14 or S15 or S16 or S17 or S18 or S19 or S20 or S21 or S22
S22 TI ( positioning or repositioning ) or AB ( positioning or repositioning )
S21 TI net bed* or AB net bed*
S20 TI ( kinetic therapy or kinetic table* ) or AB ( kinetic therapy or kinetic table* )
S19 TI ( turn* bed* or tilt* bed* ) or AB ( turn* frame* or tilt* frame* )
S18 TI ( clinifloat or maxifloat or vaperm or therarest or sheepskin or hammock or foot waffle or silicore or pegasus or cairwave ) or AB ( clinifloat or maxifloat or vaperm or therarest or sheepskin or hammock or foot waffle or silicore or pegasus or cairwave )
S17 TI elevation N2 device* or AB elevation N2 device*
S16 TI water suspension or AB water suspension
S15 TI air bag* or AB air bag*
S14 TI air suspension or AB air suspension
S13 TI alternat* pressure or AB alternat* pressure
S12 TI static air or AB static air
S11 TI constant N2 pressure or AB constant N2 pressure
S10 TI low pressure N2 support or AB low pressure N2 support
S9 TI low pressure N2 device* or AB low pressure N2 device*
S8 TI pressure alleviat* or AB pressure alleviat*
S7 TI pressure reduc* or AB pressure reduc*
S6 TI pressure relie* or AB pressure relie*
S5 TI ( overlay* or pad or pads or gel ) or AB ( overlay* or pad or pads or gel )
S4 TI ( foam or transfoam ) or AB ( foam or transfoam )
S3 TI ( mattress* or cushion* ) or AB ( mattress* or cushion* )
S2 (MH "Pillows and Cushions")
S1 (MH "Beds and Mattresses+")
Appendix 4. Criteria for judgments for the sources of bias
1. Was the allocation sequence randomly generated?
Yes, low risk of bias
The investigators describe a random component in the sequence generation process such as: referring to a random number table; using a computer random number generator; coin tossing; shuffling cards or envelopes; throwing dice; drawing of lots.
No, high risk of bias
The investigators describe a non‐random component in the sequence generation process. Usually, the description would involve some systematic, non‐random approach, for example: sequence generated by odd or even date of birth; sequence generated by some rule based on date (or day) of admission; sequence generated by some rule based on hospital or clinic record number.
Unclear
Insufficient information about the sequence generation process to permit judgement of either Yes or No (as above) to be made.
2. Was the treatment allocation adequately concealed?
Yes, low risk of bias
Participants and investigators enrolling participants could not foresee assignment either because one of the following, or an equivalent method, was used to conceal allocation: central allocation (including telephone, web‐based and pharmacy‐controlled randomisation); sequentially‐numbered drug containers of identical appearance; sequentially‐numbered, opaque, sealed envelopes.
No, high risk of bias
Participants or investigators enrolling participants could possibly foresee assignments and thus introduce selection bias, i.e. when allocation used: an open random allocation schedule (e.g. a list of random numbers); assignment envelopes without appropriate safeguards (e.g. if envelopes were unsealed or nonopaque or not sequentially numbered); alternation or rotation; date of birth; case record number; any other explicitly unconcealed procedure.
Unclear
Insufficient information to permit judgement of either Yes or No to be made. This is usually the case if the method of concealment is not described, or is not described in sufficient detail to allow a definite judgement, for example if the use of assignment envelopes is described, but it remains unclear whether envelopes were sequentially numbered, opaque and sealed.
3. Blinding was knowledge of the allocated interventions adequately prevented during the trial?
Yes, low risk of bias
Any one of the following:
-
No blinding, but the review authors judge that the outcome and the outcome measurement are not likely to be influenced by lack of blinding.
-
Blinding of participants and key trial personnel ensured, and unlikely that the blinding could have been broken.
-
Either participants or some key trial personnel were not blinded, but outcome assessment was blinded and the non‐blinding of others unlikely to introduce bias.
No, high risk of bias
Any one of the following:
-
No blinding or incomplete blinding, and the outcome or outcome measurement is likely to be influenced by lack of blinding.
-
Blinding of key trial participants and personnel attempted, but likely that the blinding could have been broken.
-
Either participants or some key trial personnel were not blinded, and the non‐blinding of others likely to introduce bias.
Unclear
Any one of the following:
-
Insufficient information to permit judgement of Yes or No to be made.
-
The trial did not address this outcome.
4. Were incomplete outcome data adequately addressed?
Yes, low risk of bias
Any one of the following:
-
No missing outcome data.
-
Reasons for missing outcome data unlikely to be related to true outcome (for survival data, censoring unlikely to be introducing bias).
-
Missing outcome data balanced in numbers across intervention groups, with similar reasons for missing data across groups.
-
For dichotomous outcome data, the proportion of missing outcomes compared with observed event risk not enough to have a clinically relevant impact on the intervention effect estimate.
-
For continuous outcome data, plausible effect size (difference in means or standardised difference in means) among missing outcomes not enough to have a clinically relevant impact on observed effect size.
-
Missing data have been imputed using appropriate methods.
No, high risk of bias
Any one of the following:
-
Reason for missing outcome data likely to be related to true outcome, with either imbalance in numbers or reasons for missing data across intervention groups.
-
For dichotomous outcome data, the proportion of missing outcomes compared with observed event risk enough to induce clinically relevant bias in intervention effect estimate.
-
For continuous outcome data, plausible effect size (difference in means or standardised difference in means) among missing outcomes enough to induce clinically relevant bias in observed effect size.
-
As‐treated analysis done with substantial departure of the intervention received from that assigned at randomisation.
-
Potentially inappropriate application of simple imputation.
Unclear
Any one of the following:
-
Insufficient reporting of attrition/exclusions to permit judgement of Yes or No (e.g. number randomised not stated, no reasons for missing data provided).
-
The trial did not address this outcome.
5. Are reports of the trial free of suggestion of selective outcome reporting?
Yes, low risk of bias
Any of the following:
-
The trial protocol is available and all of the pre‐specified (primary and secondary) outcomes that are of interest in the review have been reported in the pre‐specified way.
-
The trial protocol is not available but it is clear that the published reports include all expected outcomes, including those that were pre‐specified (convincing text of this nature may be uncommon).
No, high risk of bias
Any one of the following:
-
Not all of the trial's pre‐specified primary outcomes reported.
-
One or more primary outcomes is reported using measurements, analysis methods or subsets of the data (e.g. subscales) that were not pre‐specified.
-
One or more reported primary outcomes were not pre‐specified (unless clear justification for their reporting is provided, such as an unexpected adverse effect).
-
One or more outcomes of interest in the review are reported incompletely so that they cannot be entered in a meta‐analysis.
-
The trial report fails to include results for a key outcome that would be expected to have been reported for such a trial.
Unclear
Insufficient information to permit judgement of Yes or No to be made. It is likely that the majority of trials will fall into this category.
6. Other sources of potential bias:
Yes, low risk of bias
The trial appears to be free of other sources of bias.
No, high risk of bias
There is at least one important risk of bias. For example, the trial:
-
Had a potential source of bias related to the specific trial design used; or
-
Stopped early due to some data‐dependent process (including a formal‐stopping rule); or
-
Had extreme baseline imbalance; or
-
Has been claimed to have been fraudulent; or
-
Had some other problem.
Unclear
There may be a risk of bias, but there is either:
-
Insufficient information to assess whether an important risk of bias exists; or
-
Insufficient rationale or evidence that an identified problem will introduce bias

Risk of bias summary: review authors' judgements about each risk of bias item for each included study.

Risk of bias graph: review authors' judgements about each risk of bias item presented as percentages across all included trials.

Comparison 1 Constant low‐pressure supports (CLP) vs standard foam mattresses (SFM), Outcome 1 Pressure ulcer incidence.

Comparison 2 Alternative foam mattress vs standard foam mattress, Outcome 1 Pressure ulcer incidence.

Comparison 2 Alternative foam mattress vs standard foam mattress, Outcome 2 Pressure ulcer incidence UK studies only.

Comparison 3 Comparisons between alternative foam supports, Outcome 1 Pressure ulcer incidence.

Comparison 4 Comparisons between CLP supports, Outcome 1 Pressure ulcer incidence.

Comparison 4 Comparisons between CLP supports, Outcome 2 Pressure ulcer incidence.

Comparison 5 Alternating‐pressure vs standard foam mattress, Outcome 1 Pressure ulcer incidence.

Comparison 6 Alternating‐pressure (AP) vs constant low‐pressure, Outcome 1 Pressure ulcer incidence.

Comparison 7 AP and CLP in ICU/post ICU (factorial design), Outcome 1 Pressure ulcer incidence.

Comparison 8 Comparisons between alternating‐pressure devices, Outcome 1 Pressure ulcer incidence.

Comparison 9 Low Air Loss vs standard bed, Outcome 1 Pressure ulcer incidence.

Comparison 9 Low Air Loss vs standard bed, Outcome 2 Pressure incidence pooled.

Comparison 9 Low Air Loss vs standard bed, Outcome 3 Incidence of patients developing multiple ulcers.
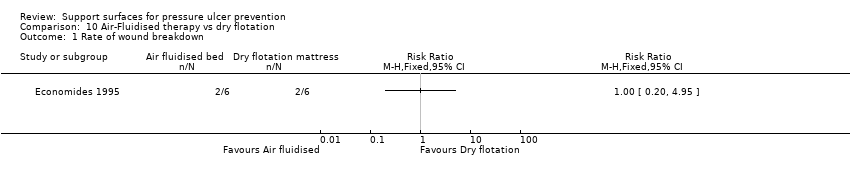
Comparison 10 Air‐Fluidised therapy vs dry flotation, Outcome 1 Rate of wound breakdown.

Comparison 11 Kinetic treatment table vs standard care, Outcome 1 Pressure ulcer incidence.

Comparison 12 Operating table overlay vs no overlay, Outcome 1 Pressure ulcer incidence.

Comparison 13 Micropulse System for surgical patients, Outcome 1 Pressure ulcer incidence.

Comparison 14 Seat cushions, Outcome 1 Pressure ulcer incidence.
| Trial | Clear inclusion | Sample size | A priori | Grade 1 ulcer | Intervention well |
| Yes | 482 (3) | Yes | Yes | No | |
| Yes | 217 (2) | No | Yes | Yes | |
| Yes | 98 (2) | No | Yes | No | |
| Yes | 113/119 (2) | No | No | Yes | |
| Yes | 70/69 (2) | No | No | Yes | |
| Yes | 170 (2) | No | No | Yes | |
| Yes | 123 (2) | No | No | Yes | |
| No | 99 (9) | No | Not applicable | Yes | |
| Yes | 187 (2) | No | Yes | No | |
| Yes | 288 (2) | No | Yes | Yes | |
| Yes | 163 (2) | No | Yes | Yes | |
| Yes | 100 (2) | No | Yes | Yes | |
| Yes | 32 (2) | No | No | Yes | |
| Demarre 2011 | Yes | 298/312 (2) | No | No | Yes |
| Yes | 120/119 (2) | No | No | Yes | |
| Yes | 12 (2) | No | Yes | Yes | |
| No | 30 (2) | No | No | Yes | |
| Yes | 66 (2) | No | Yes | Yes | |
| Yes | 175 (2) | Yes | No | Yes | |
| Yes | 43 (2) | No | Unclear | Yes | |
| Yes | 65 (2) | No | No | Yes | |
| Yes | 32 (2) | No | Unclear | Yes | |
| Yes | 338 (2) | Yes | No | Yes | |
| Yes | 75 (2) | No | No | Yes | |
| Yes | 100 (2) | No | Yes | No | |
| Yes | 170 (2) | No | Yes | Yes | |
| Yes | 101 (2) | Yes | Yes | Yes | |
| Yes | 75 (2) | No | No | Yes | |
| Yes | 44 (2) | Yes | Yes | Yes | |
| Yes | 100 (2) | Yes | Yes | No | |
| Yes | 539 (2) | No | No | Yes | |
| Yes | 84 (2) | No | No | No | |
| Yes | 100 (2) | Yes | Yes | Yes | |
| Yes | 312 (4) | Yes | Yes | Yes | |
| Yes | 74 (2) | No | Yes | No | |
| Yes | 62 (2) | No | Yes | Yes | |
| Yes | 297 (2) | Yes | No | Yes | |
| Yes | 5434 (2) | Yes | No | Yes | |
| Yes | 446 (2) | Yes | Yes | Yes | |
| Yes | 1972 (2) | Yes | Yes | Yes | |
| Yes | 80 (2) | Yes | Yes | No | |
| Yes | 25 (2) | No | Yes | Yes | |
| Yes | 198 (2) | No | No | Yes | |
| Yes | 1166 (2) | Yes | No | Yes | |
| Yes | 103 (3) | Unclear | No | Yes | |
| Yes | 505 (5) | Yes | No | Yes | |
| Yes | 413 (2) | Yes | No | No | |
| Yes | 57 (3) | No | No | No | |
| Yes | 100 (3) | No | Yes | No | |
| Yes | 83 (2) | No | No | Yes | |
| Yes | 40 (2) | Yes | Yes | Yes | |
| Yes | 44 (2) | Yes | No | Yes | |
| Yes | 62 (2) | Yes | Unclear | Yes | |
| Yes | 52 (2) | Yes | Yes | Yes | |
| No | 41/42 (2) | No | Yes | No | |
| Yes | 447 (2) | Yes | Yes | Yes | |
| No | 55 (2) | Yes | Unclear | Yes | |
| Yes | 40 (2) | No | Yes | Yes | |
| No | 51 (2) | No | No | No |
| Outcome or subgroup title | No. of studies | No. of participants | Statistical method | Effect size |
| 1 Pressure ulcer incidence Show forest plot | 7 | 2407 | Risk Ratio (M‐H, Random, 95% CI) | 0.38 [0.24, 0.61] |
| 1.1 Cubed foam mattress | 1 | 36 | Risk Ratio (M‐H, Random, 95% CI) | 0.34 [0.14, 0.85] |
| 1.2 Bead‐filled mattress | 1 | 75 | Risk Ratio (M‐H, Random, 95% CI) | 0.32 [0.14, 0.76] |
| 1.3 Softform mattress | 1 | 170 | Risk Ratio (M‐H, Random, 95% CI) | 0.20 [0.09, 0.45] |
| 1.4 Water‐filled mattress | 1 | 316 | Risk Ratio (M‐H, Random, 95% CI) | 0.35 [0.15, 0.79] |
| 1.5 Alternative foam | 2 | 644 | Risk Ratio (M‐H, Random, 95% CI) | 0.36 [0.22, 0.59] |
| 1.6 Hi‐spec foam mattress/cushion | 1 | 1166 | Risk Ratio (M‐H, Random, 95% CI) | 0.78 [0.55, 1.11] |
| Outcome or subgroup title | No. of studies | No. of participants | Statistical method | Effect size |
| 1 Pressure ulcer incidence Show forest plot | 5 | 2016 | Risk Ratio (M‐H, Random, 95% CI) | 0.40 [0.21, 0.74] |
| 1.1 Various alternatives (pooled) | 5 | 2016 | Risk Ratio (M‐H, Random, 95% CI) | 0.40 [0.21, 0.74] |
| 2 Pressure ulcer incidence UK studies only Show forest plot | 4 | 1980 | Risk Ratio (M‐H, Random, 95% CI) | 0.41 [0.19, 0.87] |
| Outcome or subgroup title | No. of studies | No. of participants | Statistical method | Effect size |
| 1 Pressure ulcer incidence Show forest plot | 5 | Risk Ratio (M‐H, Fixed, 95% CI) | Totals not selected | |
| 1.1 Alternative foam vs standard foam | 1 | Risk Ratio (M‐H, Fixed, 95% CI) | 0.0 [0.0, 0.0] | |
| 1.2 Foam mattress vs foam overlay | 1 | Risk Ratio (M‐H, Fixed, 95% CI) | 0.0 [0.0, 0.0] | |
| 1.3 Solid foam vs convoluted foam | 1 | Risk Ratio (M‐H, Fixed, 95% CI) | 0.0 [0.0, 0.0] | |
| 1.4 Transfoam mattress vs Transfoamwave mattress | 1 | Risk Ratio (M‐H, Fixed, 95% CI) | 0.0 [0.0, 0.0] | |
| 1.5 Cold foam mattress vs cold foam mattress and static air overlay | 1 | Risk Ratio (M‐H, Fixed, 95% CI) | 0.0 [0.0, 0.0] | |
| Outcome or subgroup title | No. of studies | No. of participants | Statistical method | Effect size |
| 1 Pressure ulcer incidence Show forest plot | 11 | 2138 | Risk Ratio (M‐H, Fixed, 95% CI) | 0.45 [0.36, 0.56] |
| 1.1 Optima vs SFM | 1 | 40 | Risk Ratio (M‐H, Fixed, 95% CI) | 0.06 [0.00, 0.99] |
| 1.2 Sofflex vs ROHO | 1 | 84 | Risk Ratio (M‐H, Fixed, 95% CI) | 0.63 [0.16, 2.47] |
| 1.3 Gel mattress vs air‐filled overlay | 1 | 66 | Risk Ratio (M‐H, Fixed, 95% CI) | 0.8 [0.24, 2.72] |
| 1.4 Static air mattress vs water mattress | 1 | 37 | Risk Ratio (M‐H, Fixed, 95% CI) | 0.43 [0.04, 4.29] |
| 1.5 Foam overlay vs Silicore overlay | 1 | 68 | Risk Ratio (M‐H, Fixed, 95% CI) | 1.17 [0.64, 2.14] |
| 1.6 Sheepskin vs no sheepskin (Including all pressure ulcers regardless of Grade) | 3 | 1424 | Risk Ratio (M‐H, Fixed, 95% CI) | 0.48 [0.36, 0.64] |
| 1.7 Foam support surface vs no support | 1 | 70 | Risk Ratio (M‐H, Fixed, 95% CI) | 0.16 [0.05, 0.49] |
| 1.8 Heel‐lift suspension boot and various support surfaces vs support surfaces alone | 1 | 239 | Risk Ratio (M‐H, Fixed, 95% CI) | 0.26 [0.12, 0.53] |
| 1.9 Inflated static overlay vs microfluid static overlay or LAL dyname mattress | 1 | 110 | Risk Ratio (M‐H, Fixed, 95% CI) | 0.33 [0.07, 1.58] |
| 2 Pressure ulcer incidence Show forest plot | 3 | 1424 | Risk Ratio (M‐H, Random, 95% CI) | 0.59 [0.33, 1.05] |
| 2.1 Sheepskin vs no sheepskin (grade 2 + pressure ulcers only) | 3 | 1424 | Risk Ratio (M‐H, Random, 95% CI) | 0.59 [0.33, 1.05] |
| Outcome or subgroup title | No. of studies | No. of participants | Statistical method | Effect size |
| 1 Pressure ulcer incidence Show forest plot | 2 | 409 | Risk Ratio (M‐H, Fixed, 95% CI) | 0.31 [0.17, 0.58] |
| Outcome or subgroup title | No. of studies | No. of participants | Statistical method | Effect size |
| 1 Pressure ulcer incidence Show forest plot | 10 | 1606 | Risk Ratio (M‐H, Random, 95% CI) | 0.85 [0.64, 1.13] |
| 1.1 AP (various) vs CLP (various) | 1 | 230 | Risk Ratio (M‐H, Random, 95% CI) | 0.38 [0.22, 0.66] |
| 1.2 AP vs Silicore or foam overlay | 4 | 331 | Risk Ratio (M‐H, Random, 95% CI) | 0.91 [0.72, 1.16] |
| 1.3 AP vs water or static air mattress | 3 | 458 | Risk Ratio (M‐H, Random, 95% CI) | 1.31 [0.51, 3.35] |
| 1.4 AP vs continuous low pressure mattress | 1 | 140 | Risk Ratio (M‐H, Random, 95% CI) | 2.06 [0.19, 22.18] |
| 1.5 AP vs visco‐elastic foam mattress | 1 | 447 | Risk Ratio (M‐H, Random, 95% CI) | 0.98 [0.64, 1.52] |
| Outcome or subgroup title | No. of studies | No. of participants | Statistical method | Effect size |
| 1 Pressure ulcer incidence Show forest plot | 1 | Risk Ratio (M‐H, Fixed, 95% CI) | Totals not selected | |
| 1.1 Standard ICU/SFM post‐ICU vs Nimbus AP ICU/SFM post‐ICU | 1 | Risk Ratio (M‐H, Fixed, 95% CI) | 0.0 [0.0, 0.0] | |
| 1.2 Standard ICU/SFM post‐ICU vs standard ICU/Tempur CLP post‐ICU | 1 | Risk Ratio (M‐H, Fixed, 95% CI) | 0.0 [0.0, 0.0] | |
| 1.3 Nimbus AP ICU/SFM post‐ICU vs standard ICU/Tempur CLP post‐ICU | 1 | Risk Ratio (M‐H, Fixed, 95% CI) | 0.0 [0.0, 0.0] | |
| 1.4 Standard ICU/SFM post‐ICU vs Nimbus AP ICU/Tempur CLP post‐ICU | 1 | Risk Ratio (M‐H, Fixed, 95% CI) | 0.0 [0.0, 0.0] | |
| 1.5 Nimbus AP ICU/SFM post‐ICU vs Nimbus ICU/Tempur post‐ICU | 1 | Risk Ratio (M‐H, Fixed, 95% CI) | 0.0 [0.0, 0.0] | |
| 1.6 Standard ICU/Tempur post‐ICU vs Nimbus ICU/Tempur post‐ICU | 1 | Risk Ratio (M‐H, Fixed, 95% CI) | 0.0 [0.0, 0.0] | |
| Outcome or subgroup title | No. of studies | No. of participants | Statistical method | Effect size |
| 1 Pressure ulcer incidence Show forest plot | 6 | Risk Ratio (M‐H, Fixed, 95% CI) | Totals not selected | |
| 1.1 Airwave vs Large Cell Ripple | 1 | Risk Ratio (M‐H, Fixed, 95% CI) | 0.0 [0.0, 0.0] | |
| 1.2 Airwave vs Pegasus Carewave | 1 | Risk Ratio (M‐H, Fixed, 95% CI) | 0.0 [0.0, 0.0] | |
| 1.3 Trinova vs control | 1 | Risk Ratio (M‐H, Fixed, 95% CI) | 0.0 [0.0, 0.0] | |
| 1.4 AP overlay vs AP mattress | 1 | Risk Ratio (M‐H, Fixed, 95% CI) | 0.0 [0.0, 0.0] | |
| 1.5 TheraPulse vs Duo | 1 | Risk Ratio (M‐H, Fixed, 95% CI) | 0.0 [0.0, 0.0] | |
| 1.6 AP mattress (single stage inflation) vs AP mattress (multi stage inflation) | 1 | Risk Ratio (M‐H, Fixed, 95% CI) | 0.0 [0.0, 0.0] | |
| Outcome or subgroup title | No. of studies | No. of participants | Statistical method | Effect size |
| 1 Pressure ulcer incidence Show forest plot | 3 | Risk Ratio (M‐H, Fixed, 95% CI) | Totals not selected | |
| 2 Pressure incidence pooled Show forest plot | 2 | 221 | Risk Ratio (M‐H, Random, 95% CI) | 0.33 [0.16, 0.67] |
| 3 Incidence of patients developing multiple ulcers Show forest plot | 1 | Risk Ratio (M‐H, Fixed, 95% CI) | Totals not selected | |
| Outcome or subgroup title | No. of studies | No. of participants | Statistical method | Effect size |
| 1 Rate of wound breakdown Show forest plot | 1 | Risk Ratio (M‐H, Fixed, 95% CI) | Totals not selected | |
| Outcome or subgroup title | No. of studies | No. of participants | Statistical method | Effect size |
| 1 Pressure ulcer incidence Show forest plot | 2 | 151 | Risk Ratio (M‐H, Fixed, 95% CI) | 1.23 [0.57, 2.65] |
| Outcome or subgroup title | No. of studies | No. of participants | Statistical method | Effect size |
| 1 Pressure ulcer incidence Show forest plot | 2 | Risk Ratio (M‐H, Random, 95% CI) | Subtotals only | |
| 1.1 Viscoelastic polymer pad vs no overlay | 1 | 416 | Risk Ratio (M‐H, Random, 95% CI) | 0.53 [0.33, 0.85] |
| 1.2 Viscoelastic foam overlay vs no overlay | 1 | 175 | Risk Ratio (M‐H, Random, 95% CI) | 1.53 [0.69, 3.39] |
| Outcome or subgroup title | No. of studies | No. of participants | Statistical method | Effect size |
| 1 Pressure ulcer incidence Show forest plot | 2 | 368 | Risk Ratio (M‐H, Fixed, 95% CI) | 0.21 [0.06, 0.70] |
| Outcome or subgroup title | No. of studies | No. of participants | Statistical method | Effect size |
| 1 Pressure ulcer incidence Show forest plot | 5 | Risk Ratio (M‐H, Fixed, 95% CI) | Totals not selected | |
| 1.1 Slab foam v Bespoke contoured foam | 2 | Risk Ratio (M‐H, Fixed, 95% CI) | 0.0 [0.0, 0.0] | |
| 1.2 Jay Gel Cushion v Foam | 1 | Risk Ratio (M‐H, Fixed, 95% CI) | 0.0 [0.0, 0.0] | |
| 1.3 Pressure reducing cushion v Standard foam cushion | 1 | Risk Ratio (M‐H, Fixed, 95% CI) | 0.0 [0.0, 0.0] | |
| 1.4 Skin protection cushion with segmented foam cushion | 1 | Risk Ratio (M‐H, Fixed, 95% CI) | 0.0 [0.0, 0.0] | |