| Trial ID: pts / arm | Incl / excl criteria | Power calc. | Randomisation | Allocation
concealed | Baseline equivalence | Blinding | Outcomes | ITT Analysis |
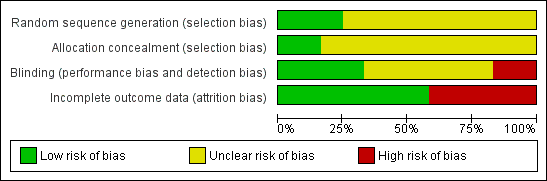
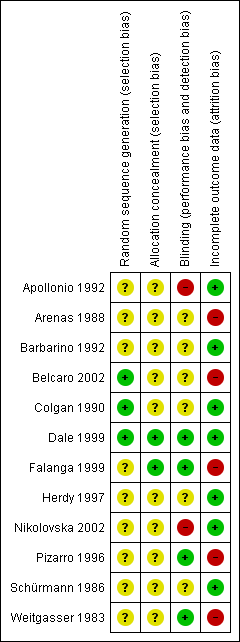
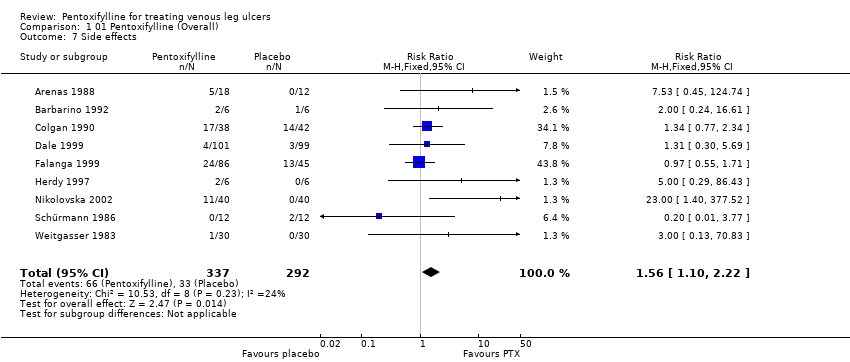
| Weitgasser 1983: 60 pts in two arms | Yes / No | Not reported | Method not reported | Unclear | Comparable for age and sex, but no other data reported | Double | Appropriate (healing response operationally defined as good, satisfactory, no change or worse | No ‐ one pt withdrew and was excluded from the analysis |
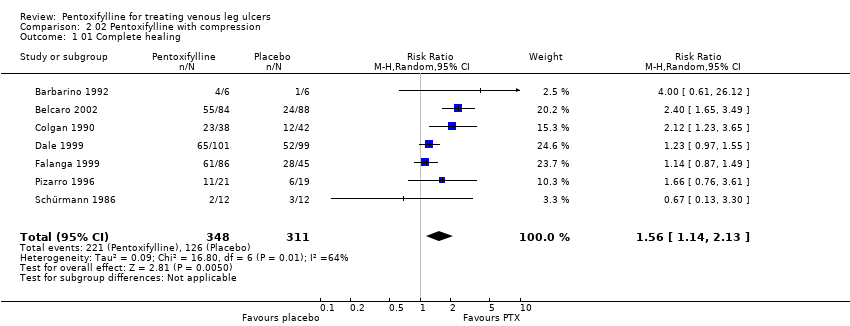
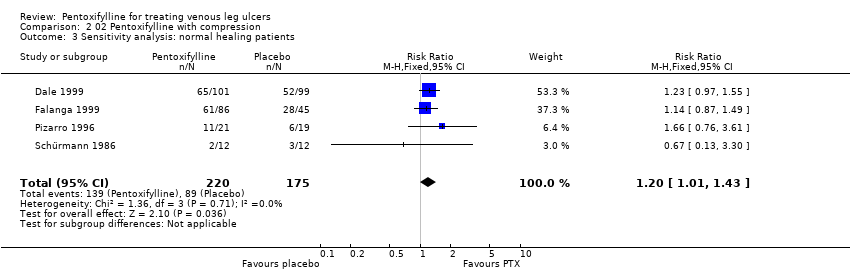
| Schürmann 1986: 24 pts in 2 arms | No / Yes | Not reported | Method not reported | Unclear | Mean ulcer size favoured control group. Other information reported | Single | Appropriate (ulcer size at baseline and trial completion reported | Not reported ‐ no withdrawals |
| Arenas 1988: 30 pts in 2 arms | No / Yes | Not reported | Method not reported | Unclear | Not reported | Double | Appropriate (healing response operationally defined as healing & significant improvement, improvement, no change or worse | No ‐ five pts withdrew and were excluded from the analysis |
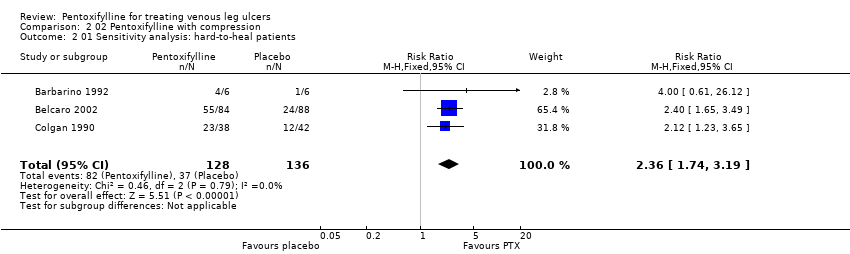
| Colgan 1990: 80 pts in 2 arms | Yes / No | Not reported | Randomisation by balanced blocks of eight in separate lists for each centre | Unclear | Yes | Double | Appropriate ‐ numbers of ulcers healed | Not reported but withdrawals included in results as treatment failures |
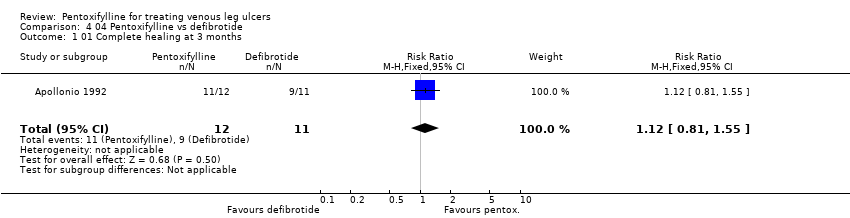
| Apollonio 1992 | Yes / Yes | Not reported | Method not reported | Unclear | Yes | Not reported | Appropriate ‐ numbers of ulcers healed | Not reported but no withdrawals |
| Barbarino 1992: 12 pts in 2 arms | Yes / Yes | Not reported | Method not reported | Unclear | Yes | Double | Appropriate ‐ ulcer size at baseline and trial conclusion reported | Not reported but no withdrawals |
| Pizarro 1996: 60 pts in 4 arms | Yes / No | Not reported | Method not reported | Unclear | Mean ulcer duration and ABI favoured control group | Double | Appropriate ‐ number of ulcers healed | No ‐ 11 pts excluded, but not reported from which groups |
| Herdy 1997: 12 pts in 2 arms | Yes / Yes | Not reported | Method not reported | Unclear | Mean ulcer size favoured control group and mean ulcer duration favoured PTX group | Not reported | Appropriate ‐ ulcer size at baseline and trial completion | Not reported, but no withdrawals |
| Dale 1999: 200 pts in 2 arms within a factorial trial | Yes / Yes | Yes | Sequential sealed envelopes | Adequate | Yes | Double | Appropriate ‐ numbers of ulcers healed | Yes |
| Falanga 1999: 131 pts in 3 arms | Yes / Yes | Yes | Method of randomisation not reported | Adequate:
randomisation by pharmaceutical company | Mean ulcer size favoured PTX 2400mg and placebo groups | Double | Appropriate ‐ numbers of ulcers healed (but numbers extrapolated from life analysis table) | No ‐ 2 pts excluded |
| Belcaro 2002: 172 pts in 2 arms | Yes / Yes | Not reported | Method not reported but followed same method as Colgan | Unclear | Yes | Double | Appropriate ‐ numbers of ulcers healed | No ‐ 12 pts excluded from the analysis |
| Nikolovska 2002: 80 pts in 2 arms | Yes / Yes | Yes | Method not reported | Unclear | Yes | Open label | Appropriate ‐ numbers of ulcers healed | Not reported but withdrawals included in analysis |