Atención médica en hospitales de día para personas mayores versus formas alternativas de atención
Resumen
Antecedentes
La proporción de la población mundial mayor de 60 años está aumentando. Por lo tanto, es necesario examinar diferentes métodos de prestación de servicios de salud para esta población. Los hospitales de día ofrecen servicios de salud multidisciplinarios a las personas mayores en un solo lugar.
Objetivos
Evaluar la eficacia de los hospitales de día para personas mayores en la prevención de la muerte, la discapacidad, la institucionalización y la mejora del estado de salud subjetivo.
Métodos de búsqueda
Se hicieron búsquedas en el Registro de Estudios del Grupo Cochrane para una Práctica y Organización Sanitaria Efectivas (Cochrane Effective Practice and Organisation of Care, EPOC), CENTRAL (2013, número 7), MEDLINE vía Ovidio (1950‐2013), EMBASE vía Ovidio (1947‐2013) y CINAHL vía EbscoHost (1980‐2013). También se realizaron búsquedas de referencias citadas, se buscaron las actas de conferencias y los registros de ensayos, se realizaron búsquedas manuales en revistas seleccionadas y se estableció contacto con los autores e investigadores pertinentes para solicitar datos adicionales.
Criterios de selección
Ensayos aleatorizados y cuasialeatorizados que comparan los hospitales de día con formas alternativas de atención para las personas mayores (media/mediana > 60 años de edad).
Obtención y análisis de los datos
Dos autores evaluaron de forma independiente la elegibilidad de los ensayos y el riesgo de sesgo y extrajeron los datos de los ensayos incluidos. Se utilizaron los procedimientos metodológicos estándar previstos por la Colaboración Cochrane. Los ensayos fueron subcategorizados como atención integral, atención domiciliaria o sin atención integral.
Resultados principales
Dieciséis ensayos (3689 participantes) compararon los hospitales de día con la atención integral (cinco ensayos), la atención domiciliaria (siete ensayos) o ninguna atención integral (cuatro ensayos). En general, hubo una calidad moderada de la evidencia de estos estudios para los siguientes resultados.
En cuanto al resultado de la muerte, no hubo pruebas sólidas a favor o en contra de los hospitales de día en comparación con otros tratamientos en general (odds ratio (OR) 1,05; IC del 95%: 0,85 a 1,28; P = 0.66), o a la atención integral (OR 1,26; IC del 95%: 0,87 a 1,82; P = 0,22), a la atención domiciliaria (OR 0,97; IC del 95%: 0,61 a 1,55; P = 0,89), o a la ausencia de atención integral (OR 0,88; IC del 95%: 0,63 a 1,22; P = 0,43).
Para el resultado de muerte o deterioro en las actividades de la vida diaria (ADL), no hubo evidencia contundente para la atención en hospital de día en comparación con otros tratamientos (OR 1,07; IC del 95%: 0,76 a 1,49; P = 0.70), o a la atención integral (OR 1,18; IC del 95%: 0,63 a 2,18; P = 0,61), a la atención domiciliaria (OR 1,41; IC del 95%: 0,82 a 2,42; P = 0,21) o a la ausencia de atención integral (OR 0,76; IC del 95%: 0,56 a 1,05; P = 0,09).
En cuanto al resultado de muerte o mal resultado (atención institucional, dependencia, deterioro de la función física), no hubo evidencia contundente para los hospitales de día en comparación con otros tratamientos (OR 0,92; IC del 95%: 0,74 a 1,15; P = 0,49), o en comparación con la atención integral (OR 1,05; IC del 95%: 0,79 a 1,40; P = 0,74) o la atención domiciliaria (OR 1,08; IC del 95%: 0,67 a 1,74; P = 0,75). Sin embargo, en comparación con la ausencia de atención integral, hubo una diferencia a favor de los hospitales de día (OR 0,72; IC del 95%: 0,53 a 0,99; P = 0,04).
Para el resultado de muerte o atención institucional, no hubo evidencia contundente para los hospitales de día en comparación con otros tratamientos en general (OR 0,85; IC del 95%: 0,63 a 1,14; P = 0,28), o con la atención integral (OR 1,00; IC del 95%: 0,69 a 1,44; P = 0,99), la atención domiciliaria (OR 1,05; IC del 95%: 0,57 a 1,92; P = 0,88) o la ausencia de atención integral (OR 0,63; IC del 95%: 0,40 a 1,00; P = 0,05).
Para el resultado de deterioro de la AVD, no hubo evidencia contundente de que la asistencia en el hospital de día tuviera un efecto diferente al de otros tratamientos en general (OR 1,11; IC del 95%: 0,68 a 1,80; P = 0,67) o en comparación con la atención integral (OR 1,21; 0,58 a 2,52; P = 0,61), o la atención domiciliaria (OR 1,59; IC del 95%: 0,87 a 2,90; P = 0,13). Sin embargo, los pacientes de los hospitales de día mostraron una reducción de las probabilidades de deterioro en comparación con los que no recibían atención integral (OR 0,61; IC del 95%: 0,38 a 0,97; P = 0,04) y diferencias significativas en los subgrupos (P = 0,04).
Para el resultado de requerir atención institucional, no hubo evidencia contundente para los hospitales de día en comparación con otros tratamientos (OR 0,84; IC del 95%: 0,58 a 1,21; p = 0,35), o con la atención integral (OR 0,91; IC del 95%: 0,70 a 1,19; p = 0,49), la atención domiciliaria (OR 1,49; IC del 95%: 0,53 a 4,25; p = 0,45), o la ausencia de atención integral (OR 0,58; IC del 95%: 0,28 a 1,20; p = 0,14).
Conclusiones de los autores
Hay evidencia de baja calidad que los hospitales de día parecen ser eficaces en comparación con la falta de atención integral para el resultado combinado de muerte o mal resultado, y para el deterioro en las AVD. No hay evidencia clara de otros resultados, ni de una ventaja sobre la prestación de otros tipos de atención médica.
PICO
Resumen en términos sencillos
Atención médica en hospitales de día para personas mayores frente a formas alternativas de atención
Los hospitales de día son una forma de proporcionar asistencia sanitaria a las personas mayores. Son instalaciones ambulatorias a las que los pacientes mayores acuden durante un día completo o casi completo y reciben atención médica multidisciplinar "bajo un mismo techo". En esta revisión se incluyeron 16 ensayos con 3689 participantes y se compararon los hospitales de día con otros servicios integrales (incluidos los servicios para pacientes hospitalizados y ambulatorios), la atención domiciliaria y ningún servicio integral. La asistencia a un hospital de día ofrece beneficios en comparación con la ausencia de tratamiento, entre los que se incluye la reducción del riesgo de necesitar más ayuda en las actividades de la vida diaria como lavarse o vestirse. Además, los pacientes tienen menos probabilidades de sufrir uno de los siguientes problemas: morir, ser institucionalizado o volverse más dependiente de los demás. No hay ningún beneficio aparente cuando se comparan los hospitales de día con otros servicios integrales o de atención domiciliaria. El valor económico de los hospitales de día en comparación con otros servicios de atención de la salud permanece incierto.
Authors' conclusions
Summary of findings
| Day hospitals compared to alternative or no care for rehabilitation | ||||||
| Patient or population: patients with rehabilitation needs | ||||||
| Outcomes | Illustrative comparative risks* (95% CI) | Relative effect | No of Participants | Quality of the evidence | Comments | |
| Assumed risk | Corresponding risk | |||||
| Alternative or no care | Day hospitals | |||||
| Death by the end of follow up | Study population | OR 1.05 | 3533 | ⊕⊕⊝⊝ | ||
| 127 per 1000 | 132 per 1000 | |||||
| Moderate | ||||||
| 66 per 1000 | 69 per 1000 | |||||
| Death or institutional care by the end of follow up | Study population | OR 0.85 | 3030 | ⊕⊕⊝⊝ | ||
| 303 per 1000 | 270 per 1000 | |||||
| Moderate | ||||||
| 221 per 1000 | 194 per 1000 | |||||
| Death or deterioration in activities of daily living (ADL) | Study population | OR 1.07 | 1268 | ⊕⊕⊝⊝ | ||
| 407 per 1000 | 423 per 1000 | |||||
| Moderate | ||||||
| 430 per 1000 | 447 per 1000 | |||||
| Death or poor outcome (institutional care, disability or deterioration) | Study population | OR 0.92 | 2831 | ⊕⊕⊝⊝ | ||
| 365 per 1000 | 346 per 1000 | |||||
| Moderate | ||||||
| 241 per 1000 | 226 per 1000 | |||||
| Deterioration in ADL in survivors | Study population | OR 1.11 | 905 | ⊕⊕⊝⊝ | ||
| 251 per 1000 | 271 per 1000 | |||||
| Moderate | ||||||
| 233 per 1000 | 252 per 1000 | |||||
| *The basis for the assumed risk (e.g. the median control group risk across studies) is provided in footnotes. The corresponding risk (and its 95% confidence interval) is based on the assumed risk in the comparison group and the relative effect of the intervention (and its 95% CI). | ||||||
| GRADE Working Group grades of evidence | ||||||
| 1 Limitations for at least one risk of bias criterion, or some limitations for multiple criteria, sufficient to lower confidence in the estimate of effect | ||||||
| Day hospitals compared to no comprehensive care for rehabilitation needs | ||||||
| Patient or population: patients with rehabilitation needs | ||||||
| Outcomes | Illustrative comparative risks* (95% CI) | Relative effect | No of Participants | Quality of the evidence | Comments | |
| Assumed risk | Corresponding risk | |||||
| No comprehensive care | Day hospitals | |||||
| Death by the end of follow up | Study population | OR 0.88 | 1345 | ⊕⊕⊝⊝ | ||
| 128 per 1000 | 114 per 1000 | |||||
| Moderate | ||||||
| 131 per 1000 | 117 per 1000 | |||||
| Death or institutional care by the end of follow up | Study population | OR 0.63 | 1177 | ⊕⊕⊝⊝ | ||
| 248 per 1000 | 172 per 1000 | |||||
| Moderate | ||||||
| 307 per 1000 | 218 per 1000 | |||||
| Death or deterioration in ADL | Study population | OR 0.76 | 651 | ⊕⊕⊝⊝ | ||
| 436 per 1000 | 370 per 1000 | |||||
| Moderate | ||||||
| 446 per 1000 | 380 per 1000 | |||||
| Death or poor outcome (institutional care, disability or deterioration) | Study population | OR 0.72 | 982 | ⊕⊕⊝⊝ | ||
| 347 per 1000 | 277 per 1000 | |||||
| Moderate | ||||||
| 400 per 1000 | 324 per 1000 | |||||
| Deterioration in ADL in survivors | Study population | OR 0.61 | 407 | ⊕⊕⊝⊝ | ||
| 277 per 1000 | 189 per 1000 | |||||
| Moderate | ||||||
| 227 per 1000 | 152 per 1000 | |||||
| *The basis for the assumed risk (e.g. the median control group risk across studies) is provided in footnotes. The corresponding risk (and its 95% confidence interval) is based on the assumed risk in the comparison group and the relative effect of the intervention (and its 95% CI). | ||||||
| GRADE Working Group grades of evidence | ||||||
| 1 Limitations for at least one risk of bias criterion or some limitations for multiple criteria, sufficient to lower confidence in the estimate of effect | ||||||
| Day hospitals compared to domiciliary care for rehabilitation | ||||||
| Patient or population: patients with rehabilitation needs | ||||||
| Outcomes | Illustrative comparative risks* (95% CI) | Relative effect | No of Participants | Quality of the evidence | Comments | |
| Assumed risk | Corresponding risk | |||||
| Domiciliary care | Day hospitals | |||||
| Death by the end of follow up | Study population | OR 0.97 | 901 | ⊕⊕⊝⊝ | ||
| 101 per 1000 | 98 per 1000 | |||||
| Moderate | ||||||
| 64 per 1000 | 62 per 1000 | |||||
| Death or institutional care by the end of follow up | Study population | OR 1.05 | 672 | ⊕⊕⊝⊝ | ||
| 187 per 1000 | 194 per 1000 | |||||
| Moderate | ||||||
| 69 per 1000 | 72 per 1000 | |||||
| Death or deterioration in ADL | Study population | OR 1.41 | 443 | ⊕⊕⊝⊝ | ||
| 392 per 1000 | 476 per 1000 | |||||
| Moderate | ||||||
| 334 per 1000 | 414 per 1000 | |||||
| Death or poor outcome (institutional care, disability or deterioration) | Study population | OR 1.08 | 581 | ⊕⊕⊝⊝ | ||
| 297 per 1000 | 313 per 1000 | |||||
| Moderate | ||||||
| 364 per 1000 | 382 per 1000 | |||||
| Deterioration in ADL in survivors | Study population | OR 1.59 | 349 | ⊕⊕⊝⊝ | ||
| 225 per 1000 | 315 per 1000 | |||||
| Moderate | ||||||
| 188 per 1000 | 269 per 1000 | |||||
| *The basis for the assumed risk (e.g. the median control group risk across studies) is provided in footnotes. The corresponding risk (and its 95% confidence interval) is based on the assumed risk in the comparison group and the relative effect of the intervention (and its 95% CI). | ||||||
| GRADE Working Group grades of evidence | ||||||
| 1 Limitations for at least one risk of bias criterion or some limitations for multiple criteria, sufficient to lower confidence in the estimate of effect | ||||||
| Day hospitals compared to comprehensive care for older people requiring rehabilitation | ||||||
| Patient or population: older people requiring rehabilitation | ||||||
| Outcomes | Illustrative comparative risks* (95% CI) | Relative effect | No of Participants | Quality of the evidence | Comments | |
| Assumed risk | Corresponding risk | |||||
| Comprehensive care | Day hospitals | |||||
| Death by the end of follow up | Study population | OR 1.26 | 1287 | ⊕⊕⊝⊝ | ||
| 144 per 1000 | 175 per 1000 | |||||
| Moderate | ||||||
| 69 per 1000 | 85 per 1000 | |||||
| Death or institutional care by the end of follow up | Study population | OR 1 | 1181 | ⊕⊕⊝⊝ | ||
| 426 per 1000 | 426 per 1000 | |||||
| Moderate | ||||||
| 231 per 1000 | 231 per 1000 | |||||
| Death or deterioration in ADL | Study population | OR 1.18 | 174 | ⊕⊕⊝⊝ | ||
| 349 per 1000 | 387 per 1000 | |||||
| Moderate | ||||||
| 349 per 1000 | 387 per 1000 | |||||
| Death or poor outcome (institutional care, disability or deterioration) | Study population | OR 1.05 | 1268 | ⊕⊕⊝⊝ | ||
| 410 per 1000 | 422 per 1000 | |||||
| Moderate | ||||||
| 221 per 1000 | 230 per 1000 | |||||
| Deterioration in ADL in survivors | Study population | OR 1.21 | 149 | ⊕⊕⊝⊝ | ||
| 243 per 1000 | 280 per 1000 | |||||
| Moderate | ||||||
| 243 per 1000 | 280 per 1000 | |||||
| *The basis for the assumed risk (e.g. the median control group risk across studies) is provided in footnotes. The corresponding risk (and its 95% confidence interval) is based on the assumed risk in the comparison group and the relative effect of the intervention (and its 95% CI). | ||||||
| GRADE Working Group grades of evidence | ||||||
| 1 Limitations for at least one risk of bias criterion or some limitations for multiple criteria, sufficient to lower confidence in the estimate of effect | ||||||
Background
The first geriatric day hospital was opened in the UK in 1952 (Farndale 1961). Day hospitals developed rapidly in the United Kingdom in the 1960's as an important component of care provision for older people designed to complement in‐patient services (Black 2005). The model has since been widely applied in New Zealand, Australia, Canada, the USA and several European countries.
Geriatric day hospitals provide multi‐disciplinary rehabilitation in an outpatient setting and operate in a pivotal position between hospital and home‐based services (Ames 1995; Black 2005; Brocklehurst 1973; Petermans 2011). They provide specialist services for older people, which can include examinations and consultations, all concentrated in one location (Bussche 2010).
Although there is considerable descriptive literature on day hospital care (RCP 1994), concern has been expressed that evidence for effectiveness is equivocal (Brocklehurst 1980; Donaldson 1986) and that day hospital care is expensive (NAO 1994).
Concern is often expressed about the most appropriate health and social services required to address the needs of an aging population. In the UK, for example, the largest population increase is seen in the over 85 age group. A range of different services models, of which the day hospital is one, may be appropriate to address these needs. This review sets out to examine the effectiveness and resource implications of geriatric medical day hospital attendance for older people and to compare it with other models of healthcare delivery for an older population. This is an updated Cochrane review first published in Forster 1999a.
Description of the condition
Geriatric day hospitals are not usually specific to one condition. However, many will provide rehabilitation services appropriate to conditions such as stroke that are likely to be seen in an older population.
Description of the intervention
Geriatric day hospitals are out‐patient healthcare facilities for older people living in the community. They provide multi‐professional treatment on a full or part time basis (Beynon 2009).They serve several functions, including assessment, rehabilitation, and medical, nursing, maintenance, social and respite care (Brocklehurst 1980). Rehabilitation and maintenance comprise the main work of the day hospital: 42% and 23% respectively (RCP 1994), with rehabilitation regarded as the most important function (Brocklehurst 1980). The specific features and services offered by individual geriatric day hospitals are subject to considerable variation. However, they usually include a combination of medical assessment with support from nurses and allied health professionals, often including physiotherapists and occupational therapists. There is no consensus on what types of healthcare professionals should make up the multi‐disciplinary teams (Petermans 2011). Additional services such as chiropody, social work, exercise classes and assistance with bathing and hair washing are offered by some hospitals.
How the intervention might work
Geriatric day hospitals offer a multidisciplinary approach to assessment and rehabilitation, with provision of a variety of services in one location. As a result of assessment and treatment occurring 'under one roof,’ the health requirements of older people should be identified and responded to in an appropriate and timely manner. The day hospital can provide out‐patient delivery of a Comprehensive Geriatric Assessment (CGA) which has a robust evidence base for inpatient setting use (Ellis 2011). A CGA addresses medical, physical, psychological and social needs, and includes the formation of a plan of care and rehabilitation, with a clear method of implementation. Day hospital staff have specific skills, knowledge and experience related to working with older people. Furthermore, the day hospital environment has the advantage of providing social interaction between patients, a factor which domiciliary services and usual care cannot provide. These factors could result in better outcomes for patients through the provision of effective rehabilitation and other healthcare delivery for an older population.
Why it is important to do this review
Between 1985 and 2010 the proportion of the world's population that is aged over 65 years grew by approximately a quarter from 6.0% (291 million) to 7.6% (524 million), and is expected to increase to 13% by 2035, exceeding a billion people globally (UN 2011). As a result of this increase, providing health care that meets the diverse needs of an older population and is cost effective and efficient will be ever more important. Day hospitals are one way of delivering multidisciplinary rehabilitation to older people in an outpatient setting. This review is necessary to assess the effectiveness of day hospitals across a number of health, cost and resource outcomes.
Objectives
The primary question was whether older patients attending a geriatric medical day hospital would experience better outcomes (in terms of death, dependency or institutionalisation) than those receiving alternative forms of care.
Secondary questions concerned the impact of day hospital care on patient satisfaction and subjective health outcomes, carer distress and resource use and costs.
Methods
Criteria for considering studies for this review
Types of studies
We included studies that were of a prospective, controlled design in which there was random assignment of participants to alternative treatment groups (one of which involved day hospital care), not as part of a complex multi‐service intervention. Studies which utilised ‘quasi’ randomisation procedures (for example allocation to groups based on date of birth) were also included.
Types of participants
We included patients receiving medical care (mean/median age of >60 years for individual studies). We are aware that day hospital descriptive studies have indicated that day hospital attendance is determined more by needs than age and that younger patients do attend day hospitals. Our pre‐specified participant criterion of age 60 years and over was chosen to pragmatically capture this clinical practice. Studies which were specific to psychiatric patients were excluded.
Types of interventions
We defined a day hospital as an out‐patient facility where older patients attend for a full or near full day and receive multidisciplinary rehabilitation in a healthcare setting. This is consistent with previous definitions (Siu 1994) and excluded trials evaluating social day centres, or other types of day hospitals such as psychiatric day hospitals for patients with dementia or psychiatric conditions. We excluded studies on day hospitals that only provided services for single, specific conditions (for example, arthritis). We wanted to assess the effects of providing typical general assessment and rehabilitation services relevant to older people. The inclusion of disease‐specific trials would risk incorporating the effects of very specific therapies for specific conditions, which were not the focus of this review.
We anticipated considerable heterogeneity, particularly in the control services, and so pre‐specified key subgroup comparisons prior to reviewing the trials.
1) Day hospital care versus comprehensive care ‐ where control patients had access to a range of geriatric medical services (both inpatient and outpatient).
2) Day hospital care versus domiciliary care ‐ where control patients were provided an approximately equivalent rehabilitation program within their own home or social day centre.
3) Day hospital care versus no comprehensive care ‐ where control patients did not routinely have access to outpatient rehabilitation services.
Types of outcome measures
We wished to identify outcomes which reflected a previous definition of the purpose of day hospital care: to facilitate and prolong independent living for older people in the community (Donaldson 1987). Effective day hospital care would thus be expected to reduce death, to maintain older people in their own home and to reduce admissions to hospital. The following outcomes were therefore selected, all of which were recorded at the end of scheduled follow up.
Primary outcomes
Primary outcomes were:
-
death;
-
the need for institutional care;
-
dependency;
-
global 'poor outcome' comprising death or one of the following (in order of preference): resident in institutional care, severe dependency at end of follow up, or deterioration in physical function during follow up; this outcome was included in anticipation of incomplete data sets.
Secondary outcomes
Secondary outcomes included:
-
dependency, measured by activities of daily living (ADL) scores;
-
patient satisfaction;
-
subjective health status (including mood);
-
resource use (in hospital or institutional care) plus overall cost analyses;
-
carer distress.
We considered all studies that met the eligibility criteria for study design, participants and interventions regardless of whether the pre‐specified primary or secondary outcomes were reported.
Search methods for identification of studies
For this edition of the review, D Andre, University of Leeds Library, developed search strategies in consultation with the authors. They were peer reviewed by M Fiander, EPOC Trials Search Coordinator. We searched the databases listed below for relevant studies.
Electronic searches
-
Effective Practice and Organisation of Care (EPOC) group register of trials (August 2013);
-
Cochrane Central Register of Controlled Trials (CENTRAL; The Cochrane Library, Issue 7, July 2013; Appendix 1);
-
MEDLINE (1996 to July 2013; Appendix 2);
-
Medline in Process (1996 to August 2013; Appendix 3);
-
EMBASE (1996 to August 2013; Appendix 4);
-
Cumulative Index to Nursing and Allied Health Literature (CINAHL; 1996 to August 2013; Appendix 5);
-
Allied and Complementary Medicine Database (AMED; 1996 to August 2013; Appendix 6);
-
Physiotherapy Evidence Database (PEDro; August 2008; Appendix 7);
-
Applied Social Science Index and Abstracts (ASSIA; 1996 to August 2013; Appendix 8);
-
International Bibliography of Social Sciences (IBSS; 1996 to August 2013; Appendix 9);
-
PsycINFO (1996 to August week 1, 2013; Appendix 10);
-
Health Management Information Consortium Database (HMIC; January 2008 to August 2013; Appendix 11);
-
NHS Economic Evaluation Database (NHS EED; searched October 2013; Appendix 12);
-
Health Technology Assessment (HTA) Database (searched October 2013; Appendix 12);
-
Web of Knowledge (1996 to August 2013; Appendix 13);
-
Web of Science, Conference Proceedings Citation Index ‐ Social Science (1990 to 2012; Appendix 14);
-
Google Scholar (searched August 2013; Appendix 15);
-
Index to Theses (1996 to August 2013; Appendix 16);
-
Proquest Dissertations and Theses (1996 to August 2013; Appendix 17);
-
Current Controlled Trials (searched August 2013; Appendix 18).
Search strategies were comprised of natural language (free text) terms and controlled vocabulary (index) terms. Language limits were not applied. Search strategies for this update have been revised in order to improve sensitivity and precision. Changes were made based on an analysis of indexing terms found on previously included studies and by testing terms from the original strategy for precision. Given these changes, searches have been run retrospectively. The results of this search have been de‐duplicated from searches we carried out for the previous update of this review in 2008. The reference list of reviews of potential relevance were also examined (Bours 1998; Mason 2007; Outpatient Service 2004; Prvu Bettger 2007; Petermans 2011).
Searching other resources
-
HSRProj (searched August 2013; Appendix 19);
-
National Research Register (searched September 2007);
-
Australian New Zealand Clinical Trials Registry (May 2008).
Data collection and analysis
Selection of studies
Two review authors independently assessed the titles and abstracts from the electronic searches and excluded obviously irrelevant studies. We obtained full text articles of the remaining studies and at least two review authors independently assessed these against pre‐specified inclusion criteria to determine which trials would be eligible for inclusion. Study authors were contacted for further details when necessary. Disagreements were resolved by discussion with other members of the review team.
Data extraction and management
At least two review authors extracted data independently. Disagreements were resolved through group consensus. When possible, we contacted study authors for additional information and data as required.
Assessment of risk of bias in included studies
Two review authors independently assessed risk of bias in the included studies using the tool for assessing risk of bias in the Cochrane Handbook for Systematic Reviews of Interventions (Higgins 2011). We scored each study as being at ‘high risk of bias’, ‘low risk of bias’ or ‘unclear risk of bias’ for each of the following domains, and reported them in the 'Risk of bias' tables.
-
Random sequence generation (selection bias).
-
Allocation concealment (selection bias).
-
Blinding of participants and personnel (performance bias).
-
Blinding of outcome assessment (detection bias).
-
Incomplete outcome data (attrition bias).
-
Selective reporting (reporting bias).
-
Other possible bias.
Measures of treatment effect
We calculated odds ratios with 95% confidence intervals for the dichotomous outcomes using standard methods. We used a random effects model as the subjects and interventions would have differed in ways which we anticipated would affect results and we could not assume a common effect size (Borenstein 2009).
We calculated inpatient resource use as the average (mean) use of hospital beds (in days) per patient recruited to each trial group. This figure was calculated for individual trials, and groups of trials, by dividing the total number of bed days by the total number of patients.
Unit of analysis issues
In cross‐over trials, we only included data from the first period of the trial in meta‐analyses to guard against carry‐over effects. Where cluster randomised studies presented an estimate of effect that properly accounted for the cluster design, this was used. Where this was not the case, we assumed that the intra‐cluster correlation coefficient (ICC) was the same as for other studies included in the review for that outcome. We calculated an average ICC for the outcome and corrected the values for each unadjusted study by the design effect (Higgins 2011).
Dealing with missing data
Where possible, studies were analysed on an intention‐to‐treat basis. Patients who were lost to follow up or for whom outcome data were not available were excluded from the initial analysis. However, they were included in ‘best case’ (all missing data in favour of day hospital care), intermediate and ‘worst case’ (all missing data in favour of alternative care) sensitivity analyses.
Assessment of heterogeneity
We assessed heterogeneity using I² and the Q statistic, with P < 0.1 determining significant heterogeneity (Higgins 2011).
Assessment of reporting biases
We attempted to reduce the risk of reporting bias by undertaking comprehensive searches of multiple databases and trials registers, and contacting authors. Where sufficient studies were included for individual outcomes, we undertook visual inspection of funnel plots to identify any obvious sources of publication bias.
Data synthesis
For patient outcomes, we undertook meta‐analyses at the end of follow up for the domains of death, death or institutional care, death or deterioration in ADL, death or poor outcome (institutional care, disability or deterioration) and deterioration in ADL in survivors. Analyses were based on the published summary data rather than individual patient data. For other patient outcomes ‐ ADL, subjective health status and patient satisfaction ‐ we present a narrative summary and a summary of the data is provided in the Data and analyses section. A summary of carer outcomes is also presented in the Data and analyses section. To investigate resource use, we performed a meta‐analysis for the domain of requiring institutional care at the end of follow up. For hospital bed use during follow up and cost we present a narrative summary in the Data and analyses section. We assessed the quality of the evidence using the GRADE approach which results in a quality score of high, moderate, low or very low (GRADEpro 2014).
Results
Description of studies
This review update includes 16 randomised controlled trials of medical day hospital versus alternative forms of care for older people. This includes three new studies in addition to the 13 studies from the previous version of this review (Forster 2008).
Results of the search
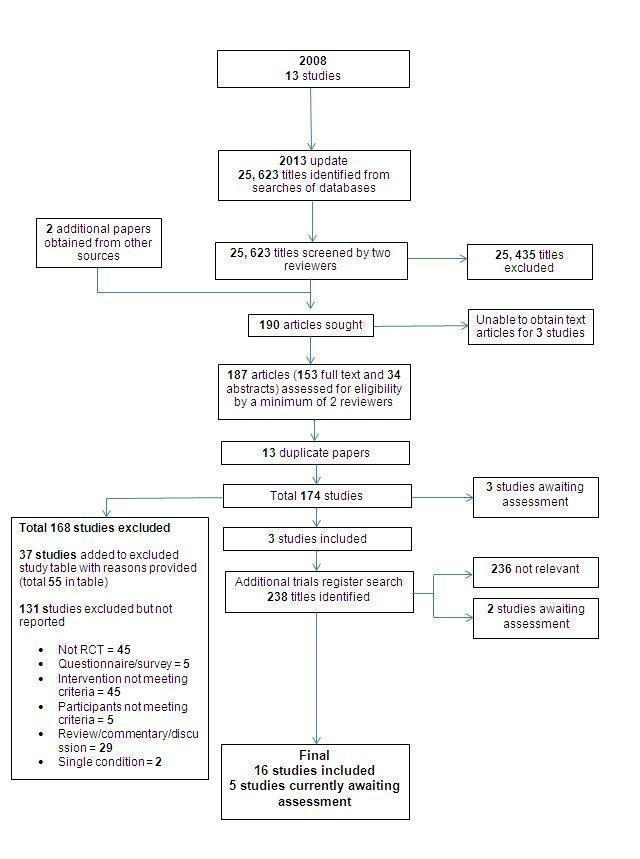
We screened over 25,000 unique citations and reviewed the full text of 190. 153 full papers and 34 abstracts were obtained and reviewed by a minimum of two reviewers to assess eligibility. Of these, three were included; five are awaiting assessment pending translation or availability of a published report (Studies awaiting classification); the majority of studies were excluded for reasons described in Characteristics of excluded studies; a further 131 studies were excluded for this update but not reported, as they were excluded early in the selection process. A flow diagram of the review update process can be found in Figure 1.
Included studies
Three new studies have been added to this review update (Crotty 2008; Masud 2006; Parker 2009). Five studies are currently awaiting assessment.
Interventions
The current analysis includes 16 trials comprising 37 individual day hospitals. In accordance with the definition of day hospital used, multidisciplinary outpatient rehabilitation was available at all sites. Several of the studies evaluated more than one day hospital; the pilot study undertaken by Vetter 1989 involved two, Masud 2006 and Crotty 2008 each involved three, while a further four trials (Hedrick 1993; Parker 2009; Weissert 1980; Young 1992) each evaluated four day hospitals and Roderick 2001 involved five. The studies were undertaken in various countries including the UK (Burch 1999; Gladman 1993; Masud 2006; Parker 2009; Roderick 2001; Vetter 1989; Woodford 1962; Young 1992), USA (Cummings 1985; Hedrick 1993; Weissert 1980), Australia (Crotty 2008), Canada (Eagle 1991), Hong Kong (Hui 1995), Finland (Pitkala 1991) and New Zealand (Tucker 1984). For further details see Characteristics of included studies.
Comparison groups
Attendance at a day hospital was evaluated against various comparison treatments which were grouped together in the following sub‐categories:
1) In five studies the comparison treatment was comprehensive care comprising a range of inpatient, outpatient and domiciliary geriatric medical services (Cummings 1985; Eagle 1991; Hedrick 1993; Pitkala 1991; Tucker 1984).
2) In seven trials the comparison treatment was domiciliary therapy. This was provided in the patient's home (Crotty 2008; Gladman 1993; Parker 2009; Roderick 2001; Vetter 1989; Young 1992) or day centre (Burch 1999). Three of these trials recruited stroke patients only (Gladman 1993; Roderick 2001; Young 1992) and a fourth was a pilot study (Vetter 1989). In the Nottingham trial patients were randomly allocated to domiciliary rehabilitation or hospital‐based rehabilitation in three strata according to discharge ward: health care of older people, general medical unit or stroke unit (Gladman 1993). Hospital‐based rehabilitation was provided during day hospital attendance for patients in the older people care stratum and only patients in this stratum have been included in our analysis.
3) Four trials compared day hospital attendance against a control group in which patients were eligible for, but not referred to, existing services (Hui 1995; Masud 2006; Weissert 1980; Woodford 1962). In Masud 2006 the control arm received information leaflets on falls prevention and usual care from the primary care service until outcome data was completed, after which time control participants were offered access to the day hospital intervention.
We initially allocated Cummings 1985 and Hui 1995 into their own individual sub‐categories according to their comparison group; day hospital versus inpatient care (Cummings 1985) and day hospital versus medical outpatient care (Hui 1995). However, in order to streamline the analysis, these two trials were incorporated into the above categorisation schemes prior to data analysis. The Cummings 1985 trial investigated a day hospital service designed to facilitate early hospital discharge. The service offered to the comparison group was equivalent to comprehensive care and the trial was re‐categorised accordingly. The Hong Kong trial (Hui 1995) recruited stroke patients admitted to the same ward and randomised to receive rehabilitation care led by a neurology team or by a geriatrician team. After discharge, patients assigned to a neurologist were followed up at a medical outpatient clinic and the geriatrician patients by day hospital attendance. There were no differences in length of inpatient stay or dependency at discharge and the main treatment difference at final follow up assessment was the type of supporting aftercare: day hospital or medical outpatients. Further discussion with the trialists indicated that this comparison group could best be categorised as 'no comprehensive care'.
Patient characteristics
This review includes studies with a total of 3689 participants. One trial (Hedrick 1993), which was run by the United States Department of Veterans Affairs, recruited largely (96%) male patients. The other trials had a mix of male and female patients. In all but one trial the mean patient age was over 70 years; the New York trial (Cummings 1985) had a mean patient age of 65 years. Four trials (Gladman 1993; Hui 1995; Roderick 2001; Young 1992) recruited only stroke patients. Masud 2006 specifically recruited participants considered at a high risk of falling. The remaining eleven studies recruited patients with a mixture of diagnoses (Burch 1999; Crotty 2008; Cummings 1985; Eagle 1991; Hedrick 1993; Parker 2009; Pitkala 1991; Tucker 1984; Vetter 1989; Weissert 1980; Woodford 1962). The participants usually had a degree of dependency at recruitment as judged by their ADL scores (for further details see Characteristics of included studies).
Excluded studies
The majority of studies were excluded for reasons including a lack of randomisation, intervention that did not meet our criteria for a day hospital, or participants who were not older patients receiving medical care. It should be noted that only those studies which initially appeared to meet the inclusion criteria, but on closer inspection did not, were reported in the Characteristics of excluded studies. For this update, a further 131 studies were excluded but not reported: 45 were not RCTs; in 45 the intervention did not meet our criteria; 29 were review, commentary or discussion papers; five were questionnaires or surveys; and in two the intervention was for a single condition.
Risk of bias in included studies
Ten studies had a low risk of selection bias (method of random sequence generation) of which four studies used a computer generated method (Burch 1999; Crotty 2008; Hedrick 1993; Roderick 2001), four used a random number table (Gladman 1993; Hui 1995; Tucker 1984; Woodford 1962) and two used external Internet/web based services (Masud 2006; Parker 2009). Pitkala 1991 had a high risk of bias as randomisation was by date of birth. In five studies, the method of random sequence generation was unreported or unclear (Cummings 1985; Eagle 1991; Vetter 1989; Weissert 1980; Young 1992). For review authors' judgements about each risk of bias item presented as percentages across all included studies see Figure 2, and for review authors' judgements about each risk of bias item for each included study see Figure 3.
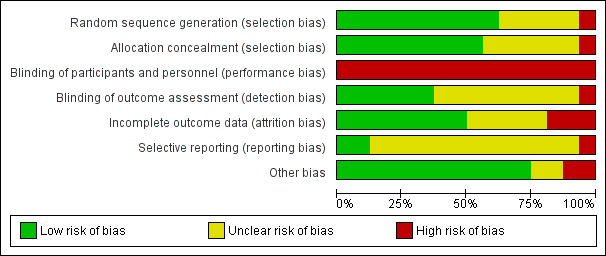
Risk of bias graph: review authors' judgements about each risk of bias item presented as percentages across all included studies.
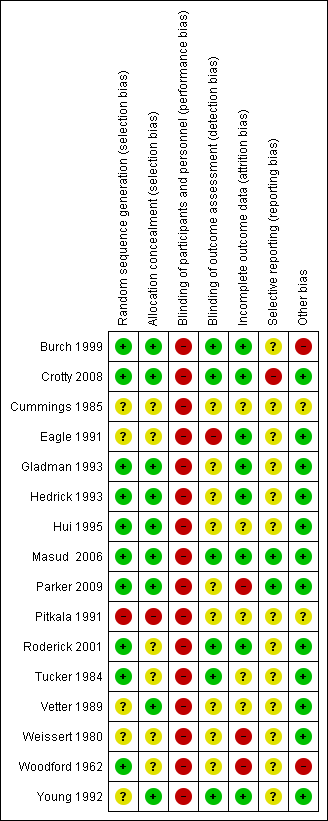
Risk of bias summary: review authors' judgements about each risk of bias item for each included study.
Allocation
Nine studies had an adequate method of allocation concealment (Burch 1999; Crotty 2008; Gladman 1993; Hedrick 1993; Hui 1995; Masud 2006; Parker 2009; Vetter 1989; Young 1992). Methods were unclear in 6 studies (Cummings 1985; Eagle 1991; Roderick 2001; Tucker 1984; Weissert 1980; Woodford 1962). Pitkala 1991 presented with a high risk of bias as their method of randomisation was by date of birth which meant allocation could have been foreseen.
Blinding
Performance bias was a feature of all studies as it was not possible to blind participants due to the nature of the intervention. As a result all studies had a high risk of bias in this domain. Six studies were considered at a low risk for detection bias (blinded outcome assessment; Burch 1999; Crotty 2008; Masud 2006; Roderick 2001; Tucker 1984; Young 1992). Masud 2006 stated that it was not possible to blind researchers to group allocation. However, the review authors considered that the relevant outcome measurements were unlikely to be influenced by a lack of blinding and therefore the risk remained low. The remaining studies were considered to have a high or unclear risk of bias (Cummings 1985; Eagle 1991; Gladman 1993; Hedrick 1993; Hui 1995; Parker 2009; Pitkala 1991; Vetter 1989; Weissert 1980; Woodford 1962).
Incomplete outcome data
Eight studies were considered to be at low risk of bias for attrition (Burch 1999; Crotty 2008; Eagle 1991; Gladman 1993; Hedrick 1993; Masud 2006; Roderick 2001; Young 1992). Three studies were judged to be at high risk of bias. For the Parker 2009 study, losses were similar across the groups but were in excess of 35% by final follow up. For Weissert 1980, 718 participants were excluded for missing data or due to non‐adherence. The numbers lost and reasons lost per group were not reported. For Woodford 1962, approximately a third of participants were lost and whilst numbers were balanced across groups, the reasons were not reported. The remaining studies were unclear regarding attrition (Cummings 1985; Hui 1995; Pitkala 1991; Tucker 1984; Vetter 1989).
Selective reporting
Two studies were judged to be at low risk for reporting bias (Masud 2006; Parker 2009). Crotty 2008 was considered at high risk as not all the proposed outcomes reported in the study protocol were included in the available publication. For the remaining studies it was unclear whether selective reporting occurred, or pre‐study protocols were unavailable (Burch 1999; Cummings 1985; Eagle 1991; Gladman 1993; Hedrick 1993; Hui 1995; Pitkala 1991; Roderick 2001; Tucker 1984; Vetter 1989; Weissert 1980; Woodford 1962; Young 1992).
Other potential sources of bias
The majority of studies were considered at low risk for other sources of bias (Crotty 2008; Eagle 1991; Gladman 1993; Hedrick 1993; Hui 1995; Masud 2006; Parker 2009; Roderick 2001; Tucker 1984; Vetter 1989; Weissert 1980; Woodford 1962; Young 1992).The Cummings 1985 study was judged as unclear as this was an ‘artificial’ day hospital established for the purpose of the study and the under‐utilisation of the facility may introduced bias. Pitkala 1991 was judged as unclear as 23% of the day hospital group refused the care. Burch 1999 was considered to be at a high risk as 10 of 55 patients transferred from day centre to day hospital.
Further details on how individual studies were scored across the different domains of bias are reported in the risk of bias tables in the Characteristics of included studies.
Effects of interventions
See: Summary of findings for the main comparison Day hospitals compared to alternative care or no care for rehabilitation needs; Summary of findings 2 Day hospitals compared to no comprehensive care for rehabilitation needs; Summary of findings 3 Day hospitals compared to domiciliary care for rehabilitation needs; Summary of findings 4 Day hospitals compared to comprehensive care for elderly persons requiring rehabilitation
The 16 trials included in the review recruited a total of 3689 patients.
Patient outcomes
Nine studies provided final outcome data at 12 months (Burch 1999; Eagle 1991; Gladman 1993; Hedrick 1993; Masud 2006; Parker 2009; Pitkala 1991; Weissert 1980; Woodford 1962), four studies at six months (Crotty 2008; Hui 1995; Roderick 2001; Young 1992), one study at five months (Tucker 1984), one study at three months (Cummings 1985) and one at two months (Vetter 1989).
Death
All 16 trials published data, or provided data on request, for the combined outcome of death at the end of follow up. The pooled OR for all the trials for death at the end of scheduled follow up shows no difference between the day hospital and comparison interventions (odds ratio (OR) 1.05; 95% confidence interval (CI) 0.85 to 1.28; P = 0.66). There was no evidence of a difference when day hospital attendance was compared with comprehensive care (OR 1.26; 95% CI 0.87 to 1.82; P = 0.22), domiciliary care (OR 0.97; 95% CI 0.61 to 1.55; P = 0.89) or no comprehensive care (OR 0.88; 95% CI 0.63 to 1.22; P = 0. 43). There was no significant heterogeneity overall (Chi² = 12.04; df = 14; P = 0.60) or for any of the subgroups (P > 0.05) (Analysis 1.1). Outcome data were missing for a total of 102 day hospital patients and 54 controls (representing 3.2% of patients in the comprehensive care subgroup, 0% in the domiciliary subgroup and 7.8% in the no comprehensive care subgroup). Best and worst case sensitivity analyses include the possibility of significant benefit (P < 0.001) or harm (P < 0.01) from day hospital attendance. Visual inspection of funnel plots did not identify any obvious signs of publication bias.
Death or institutional care
Thirteen trials published data, or provided data on request, for death or institutional care by the end of follow up (Burch 1999; Crotty 2008; Eagle 1991; Gladman 1993; Hedrick 1993; Hui 1995; Masud 2006; Pitkala 1991; Tucker 1984; Weissert 1980; Vetter 1989; Woodford 1962; Young 1992). The pooled OR for all the trials for death or institutional care at the end of scheduled follow up shows no difference between the day hospital and comparison interventions. (OR 0.85; 95% CI 0.63 to 1.14; P = 0.28). There was no significant difference between day hospital patients and those receiving comprehensive services (OR 1.00; 95% CI 0.69 to 1.44; P = 0.99), domiciliary care (OR 1.05; 95% CI 0.57 to 1.92; P = 0.88) or no comprehensive services (OR 0.63; 95% CI 0.40 to 1.00; P = 0.05). There were no significant subgroup differences (P = 0.26). There was significant heterogeneity overall for all studies (Chi² = 25.4, df =11, P = 0.01; I² = 57%; Analysis 1.2). Outcome data were missing for a total of 224 day hospital patients and 110 controls (representing 4.2% of patients in the comprehensive care subgroup, 0% in the domiciliary care subgroup and 19.3% in the no comprehensive care subgroup). Best and worst case sensitivity analyses include the possibility of significant benefit (P < 0.0001) or harm (P < 0.0001) from day hospital attendance. Visual inspection of funnel plots did not identify any obvious signs of publication bias.
Death or deterioration in ADL
Seven trials published data on death or deterioration in ADL (Burch 1999; Gladman 1993; Hui 1995; Pitkala 1991; Vetter 1989; Weissert 1980; Young 1992). The pooled OR for all the trials at the end of scheduled follow up shows no difference between the day hospital and comparison interventions (OR 1.07; 95% CI 0.76 to 1.49; P = 0.70). Only Pitkala 1991 provided data for day hospital compared to comprehensive care and the difference was not significant (OR 1.18; 95% CI 0.63 to 2.18, P = 0.61). There was no difference between day hospital and domiciliary care (OR 1.41; 95% CI 0.82 to 2.42; P = 0.21) or no comprehensive care (OR 0.76; 95% CI 0.56 to 1.05; P = 0.09). There were no significant subgroup differences (P = 0.11) and no significant heterogeneity overall (Chi² = 10.25, df = 6, P = 0.11; I² = 41%; Analysis 1.3). Visual inspection of funnel plots did not identify any obvious signs of publication bias.
Death or poor outcome
Thirteen trials published data on death or poor outcome (Burch 1999; Cummings 1985; Eagle 1991; Gladman 1993; Hedrick 1993; Hui 1995; Pitkala 1991; Roderick 2001; Tucker 1984; Vetter 1989; Weissert 1980; Woodford 1962; Young 1992). Roderick 2001 reported data on poor outcome which they defined as "death, recurrent stroke and a six month Barthel score of < 14"; we determined that this was sufficiently similar to our own definition to include in the results. The pooled OR for all the trials at the end of scheduled follow up shows no significant difference between the day hospital and other interventions (OR 0.92; 95% CI 0.74 to 1.15; P = 0.49). There was no significant difference when day hospital was compared with comprehensive care (OR 1.05; 95% CI 0.79 to 1.40; P = 0.74) or domiciliary care (OR 1.08; 95% CI 0.67 to 1.74; P = 0.75). However, there was a significant difference in favour of the day hospital when compared with no comprehensive care (OR 0.72; 95% CI 0.53 to 0.99; P = 0.04), although subgroup results were not significantly different from each other (P = 0.17). There was no significant heterogeneity overall (Chi² = 17.27, df = 12, P = 0.14; I² = 31%; Analysis 1.4). Outcome data were missing for 55 day hospital patients and 121 controls (representing 4.6% of patients in the comprehensive care subgroup, 0.5% in the domiciliary care subgroup and 10.3% in the no comprehensive care subgroup). Best and worst case sensitivity analyses included the possibility of significant benefit (P < 0.0001) or harm (P < 0.05) from day hospital attendance. Visual inspection of funnel plots did not identify any obvious signs of publication bias.
Deterioration in ADL among survivors
We wished to examine the influence of day hospital attendance on the functional status of survivors. Although most trials described results in terms of ADL scores, seven different measures were used and reported in different ways. We therefore describe results in terms of recorded deterioration in ADL and the raw ADL results. Seven trials provided data on deterioration in ADL among survivors (Burch 1999; Gladman 1993; Hui 1995; Pitkala 1991; Vetter 1989; Weissert 1980; Young 1992). We judged the quality of the evidence for the following outcome as low (summary of findings Table for the main comparison). Overall there was no difference between day hospital and alternative care in ADL scores (OR 1.11; 95% CI 0.68 to 1.80; P = 0.67). However, day hospital attenders appeared less likely to deteriorate than those receiving no comprehensive care (OR 0.61; 95% CI 0.38 to 0.97; P = 0.04). Differences were not significant when comparing day hospitals with comprehensive care (OR 1.21; 95% CI 0.58 to 2.52; P = 0.61) or domiciliary care (OR 1.59; 95% CI 0.87 to 2.90; P = 0.13). There were significant subgroup differences (P = 0.04) and evidence of heterogeneity (Chi² = 11.94, df = 6, P = 0.06; I² = 50%; Analysis 1.5). Visual inspection of funnel plots did not identify any obvious signs of publication bias.
ADL score
Fourteen trials reported a standardised measure of ADL among survivors. However, various measures were used and data were insufficient to allow a statistical summary of the results. Two trials demonstrated significant but small improvements in functional ability with day hospital attendance which was not sustained at six month follow up (Hui 1995; Tucker 1984). One trial (Young 1992) reported an improved functional outcome for the comparison group. The other 11 trials (Burch 1999; Cummings 1985; Eagle 1991; Gladman 1993; Hedrick 1993; Masud 2006; Parker 2009; Pitkala 1991; Roderick 2001; Vetter 1989; Weissert 1980) found no difference in disability scores between the day hospital and comparison groups (Analysis 1.6).
Subjective health status
A number of studies investigated subjective health status. However, various measures were used and we were unable to incorporate data into a meta‐analysis. Three studies investigating day hospital versus comprehensive care found no significant difference between the groups (Cummings 1985; Eagle 1991; Hedrick 1993). In Tucker 1984 there was a significant improvement in mood measured by the Zung index in the day hospital group compared to the comprehensive care group at final follow up (P = 0.01). Pitkala 1991 provided no comparable data. There were no significant differences in any of the studies investigating day hospital versus domiciliary care (Burch 1999; Gladman 1993; Parker 2009; Roderick 2001; Vetter 1989; Young 1992). For day hospital versus no comprehensive care, Hui 1995 found no significant differences. Weissert 1980 and Woodford 1962 did not provide comparable data (Analysis 1.7).
Patient satisfaction
Data on patient satisfaction were only available from one study. Hui 1995 found no significant difference between the day hospital and no comprehensive care (Analysis 1.8).
Carer outcomes
Distress
There were no available or comparable data for day hospital versus comprehensive care or day hospital versus no comprehensive care. Data were available from three studies comparing day hospital with domiciliary care. Crotty 2008 and Gladman 1993 found no significant difference at follow up; Burch 1999 found a significant difference in the mean change between baseline and three months in the Caregiver Strain Index in both groups but no significant difference between groups. (Analysis 1.9).
Resource use
Requiring Institutional care at the end of follow up
Thirteen trials provided information about the number of patients requiring institutional care at the end of follow up (Burch 1999; Crotty 2008; Eagle 1991; Gladman 1993; Hedrick 1993; Hui 1995; Masud 2006; Pitkala 1991; Tucker 1984; Vetter 1989; Weissert 1980; Woodford 1962; Young 1992). In one trial (Weissert 1980) these data were available only for a subgroup of patients (384 patients of 552 recruited to the main study). There was no difference between day hospital and all other services (OR 0.84; 95% CI 0.58 to 1.21; P = 0.35), or for any of the subgroups: day hospital versus comprehensive care (OR 0.91; 95% CI 0.70 to 1.19; P = 0.49), day hospital versus domiciliary care (OR 1.49; 95% CI 0.53 to 4.25; P = 0.45) or day hospital versus no comprehensive care (OR 0.58; 95% CI 0.28 to 1.20; P = 0.14). Overall there was significant heterogeneity (Chi² = 20.03, df = 11, P = 0.04; I² = 45%; Analysis 2.1). On the basis of these data (95% CI 10 to 34) 21 patients (95% CI 12.3 to 70.9) would need to attend day hospital (as opposed to receiving no comprehensive service) to prevent one admission to long term institutional care. Visual inspection of funnel plots did not identify any obvious signs of publication bias.
Hospital bed use
Although hospital use was described in several ways in the trials, it proved possible to obtain a standardised measure for 14 trials of average (mean) hospital bed use per patient recruited (Burch 1999; Cummings 1985; Eagle 1991; Gladman 1993; Hedrick 1993; Hui 1995; Masud 2006; Pitkala 1991; Roderick 2001; Tucker 1984; Vetter 1989; Weissert 1980; Woodford 1962; Young 1992; Analysis 2.2). A measure of variance was not possible for this analysis and therefore confidence limits cannot be reported. The results show a small reduction in bed use by the day hospital patients compared to other treatment across all trials: 13.6 versus 14.6 (Analysis 2.2), with subgroup results as follows:
Day hospital versus comprehensive care ‐ 20.5 versus 21.5.
Day hospital versus domiciliary care ‐ 6.8 versus 9.2.
Day hospital versus no comprehensive care ‐ 9.3 versus 9.4.
Data from Parker 2009 was in a format that did not allow us to incorporate it into the above analysis. However, they reported the mean total length of stay in hospital for patients which was higher in the day hospital group compared to the home rehabilitation group (mean difference 9.3 days; 95% CI 12.5 to 31.1; P > 0.05).
Costs
A number of studies reported a comparison of treatment costs (Analysis 2.3), but methods for reporting data were not consistent and therefore the data could not be incorporated into a meta‐analysis. Seven studies reported that day hospital attendance was more expensive than the comparison treatment (Burch 1999; Gladman 1993; Hedrick 1993; Masud 2006; Tucker 1984; Weissert 1980; Young 1992). Three trials reported that the costs were similar (Hui 1995; Cummings 1985; Roderick 2001). Woodford 1962 reported that day hospital attendance was considerably less expensive than inpatient care (8% of weekly inpatient costs) but made no comparison of other costs incurred specifically by the comparison group. Parker 2009 reported that there was insufficient evidence to support the hypothesis that rehabilitation is less expensive in a home based setting.
For the sub category comparing mean treatment costs between day hospital care and other comprehensive care services, Cummings 1985, Hedrick 1993 and Tucker 1984 reported higher costs for the day hospital. The Cummings 1985 and Hedrick 1993 trials included the cost of nursing home care. There was no information from two trials for this comparison (Eagle 1991; Pitkala 1991). For the sub category comparing treatment costs between day hospital care and domiciliary care the Burch 1999; Gladman 1993 and Young 1992 trials found that day hospital was more expensive. In the Roderick 2001 trial, the day hospital was more expensive for rehabilitations costs but was less so when considering total health and social services costs. There was no information from three trials for this comparison (Crotty 2008; Parker 2009; Vetter 1989). For the sub category comparing treatment costs between day hospital care and no comprehensive care, day hospital was more expensive than no comprehensive care in Hui 1995, Masud 2006 and Weissert 1980. No formal costing data were provided by Woodford 1962.
Assessments of the quality of the body of evidence
Using the GRADE approach we judged the quality of the body of evidence to be low for the patient outcomes of death, death or institutional care, death or deterioration in ADL, death or poor outcome, and deterioration in ADL (summary of findings Table for the main comparison; summary of findings Table 2; summary of findings Table 3; summary of findings Table 4; Appendix 20). For each outcome the body of evidence was from randomised controlled trials but we reduced the quality rating because of a high likelihood of bias in the included studies and imprecision in the effect estimates (wide CIs). We did not reduce the quality rating despite evidence of heterogeneity because this was anticipated due to the diversity of the populations and of the interventions.
Discussion
Summary of main results
The majority of included studies have compared day hospital care with other services. Only four trials employed a comparison group of patients who received neither comprehensive care nor domiciliary rehabilitation (Masud 2006; Woodford 1962; Hui 1995; Weissert 1980). The results from this group were the most favourable to day hospital care, but these four trials are now quite old. Overall the quality of the evidence was low, therefore further research is very likely to have an important impact on our confidence in the estimate of effect and is likely to change the estimate.
For the outcome of death, there was no difference between day hospitals and other services, including when day hospitals were compared with any of the subcategories individually. For the combined outcome of death or institutional care there was no significant difference between the day hospital and all other services. For the combined outcome of death or deterioration in ADL, there was no significant difference between the day hospital and other services although there was a trend in favour of the day hospital compared with no comprehensive care. For the combined outcome of death or poor outcome, there was a significant difference in favour of the day hospital when compared with no comprehensive services. For the outcome of deterioration in ADL, there was a significant difference between attending day hospital and no comprehensive care. However, there was no difference between the day hospital and other services.
When considering resource implications among those requiring institutional care, there was no difference at the end of follow up between day hospital and other services. There was a slight reduction in hospital bed use overall for day hospital patients and particularly when day hospitals were compared with domiciliary services; however, whilst a summary statistic was not possible for hospital bed use or cost, individual studies suggest that day hospitals are predominantly as expensive or more expensive than others services.
Overall completeness and applicability of evidence
The day hospital trials included in this systematic review have predominantly employed a pragmatic design and have attempted to address broad questions of overall day hospital effectiveness. This review included 16 studies with 3689 participants, although within the analyses of specific outcomes these numbers were reduced as each study only contributed data for some comparisons. It is unfortunate that data was not available, or in a suitable format, to undertake statistical analyses for the patient outcomes of activities of daily living, subjective health status, patient satisfaction or carer distress, or for the resource outcome of cost. It also proved impossible to determine a summary statistic for disability because, although included as an outcome measure in 11 trials, different measurement instruments were used and variance data were not available. The outcome of death was reported by all studies, however other adverse events and effects were not reported consistently by all studies, thus compromising the overall completeness of findings.
We have based the systematic review on a broad comparison of day hospital care versus alternative services. We wanted to be able to generalise to a range of scenarios and not defined populations. As we anticipated considerable variations in the comparison services, these were identified and categorised prior to data collection and analysis. We have ensured that the treatment schedules described matched our pre‐determined definition of day hospital care. Thus, whilst the study by Weissert and colleagues (Weissert 1980) refers to ‘day care’ services, the intervention provided fitted our definition of day hospital care and was therefore included. A lack of consensus in terminology related to day hospitals has also been noted elsewhere (Petermans 2011).
The applicability of the findings from this review to various regions will depend on current health care provision and populations. As comprehensive care, in one form or another, is likely to be available to many older patients who require rehabilitation, the relevance of some comparisons may be limited in certain countries and populations; specifically the findings from the comparison between day hospitals and no comprehensive care (which was favourable for the day hospital on the combined measure of death or poor outcome, with a trend in favour of the day hospital for the combined measure of death or institutional care). This review found little evidence that day hospitals were better than alternative types of comprehensive service. However, the diversity in the content of alternative services and the populations being served (studies originated from seven different counties) means the external validity of this finding may be compromised. Furthermore, 10 of the studies were at least 20 years old and the types of health service and the populations being served may not reflect current practice or requirements. Services may need to be considered on a case by case basis regarding their applicability against current health provision.
Two main limitations of our review lie in the multinational settings of the studies and in the forty year time span of study publication, during which time health and social care policies inevitably changed. It is disappointing that there have been only four further evaluations of the effectiveness of day hospital care since this review was first published (Forster 1999a). Nonetheless, the data presented here probably represent the best evidence currently available upon which to base a judgment of day hospital effectiveness.
Quality of the evidence
There are limitations due to the lack of statistical power resulting from small, heterogeneous trials. As a result there is a danger of both false‐positive and false‐negative results being generated. Furthermore, the data was from a series of studies performed by researchers operating independently and the studies were therefore not functionally equivalent. This resulted in significant heterogeneity through variations in participants and in the interventions employed in the various day hospitals and comparison treatments. Participants and interventions likely differed in ways that impacted the results. Consequently, we cannot assume a common effect size (Borenstein 2009). A frequently encountered issue with pragmatic rehabilitation trials is that the methods to record subject characteristics, which might influence prognosis and treatment processes, are poorly developed. Considerable detail was recorded in the USA (Hedrick 1993) trial; it is important that any future trials also address this issue. Data were missing for a number of outcomes which could theoretically alter the scale and direction of the results. All of our conclusions must be qualified by this condition.
It is possible that biases have resulted in the overestimation or underestimation of the effects of the intervention. All studies were at a high risk of bias for blinding of participants and personnel; this is typical of such an intervention and effective blinding would be challenging to implement in view of ethical considerations which require participants to have prior knowledge of potential interventions. However, a lack of blinding of outcome assessment was also problematic and only half the studies were considered to have a low risk in this domain. Contamination can result in the underestimation of treatment effects and whilst not all studies were judged to be of high risk, contamination and deviation from the protocol (switching between interventions) did feature in some studies comparing day hospitals with other comprehensive services and domiciliary care. In addition, the risk of selective reporting was often unclear. Only the three studies which were reported in the last eight years had available protocols against which their reports could be assessed to determine if all outcomes had been reported. Finally, half of the studies were considered to have a low risk of bias for the domain of incomplete outcome data. This should be considered positive, taking into account the nature of the intervention and participants, post intervention follow up periods, and the age of the studies where attrition was less frequently reported.
Potential biases in the review process
The search strategy was extensive, taking into account multiple databases and sources, and this is reflected in the large number of titles identified. Two authors extracted all data, discussions were undertaken to achieve consensus, and a third person was utilised where disagreements remained. As a result, we are confident in the quality of the review. It was unfortunate, however, that we could not quantitatively combine data for a number of outcomes, due to the diversity of measures used (for example, ADL, subjective health status, patient satisfaction, carer distress, bed use and resource use).
Publication bias (Egger 1997) remains a possibility in any review process. However, our search strategy was extensive and included contacting the authors of papers relating to day hospital care around the world.
We were fortunate that many of the authors of the published papers or abstracts were able to provide additional information which has not been published previously.
Agreements and disagreements with other studies or reviews
Another systematic review drew similar conclusions to our review (Petermans 2011). They found that geriatric day hospitals were better for patients undergoing assessment and intervention than no comprehensive care. However, they found little benefit when compared to treatment in a geriatric ward or other geriatric services. They also found few studies reporting on the outcome of patient satisfaction. The authors did not include meta‐analysis and they did not report on any cost‐benefit outcomes; their conclusions were drawn from various sources including RCTs and cohort studies. Another systematic review, with meta‐analysis, found that comprehensive geriatric assessments linking geriatric evaluation with long term management are effective in improving survival and function in older people (Stuck 1993).
Individual results from the included studies suggest that day hospitals are probably as expensive or more expensive than other comprehensive or domiciliary services. Several costing studies have drawn attention to the expense of day hospital services (Eagle 1987; Gerard 1988; Gladman 1994; MacFarlane 1979; Young 1993).


Risk of bias graph: review authors' judgements about each risk of bias item presented as percentages across all included studies.

Risk of bias summary: review authors' judgements about each risk of bias item for each included study.

Comparison 1 Day Hospital vs Alternative Care ‐ patient outcomes, Outcome 1 Death by the end of follow up.

Comparison 1 Day Hospital vs Alternative Care ‐ patient outcomes, Outcome 2 Death or institutional care by the end of follow up.

Comparison 1 Day Hospital vs Alternative Care ‐ patient outcomes, Outcome 3 Death or deterioration in activities of daily living (ADL).

Comparison 1 Day Hospital vs Alternative Care ‐ patient outcomes, Outcome 4 Death or poor outcome (institutional care, disability or deterioration).

Comparison 1 Day Hospital vs Alternative Care ‐ patient outcomes, Outcome 5 Deterioration in activities of daily living (ADL) in survivors.
| Study | |
| Day hospital vs Comprehensive elderly care | |
| Cummings 1985 | No significant difference in the Kenny ADL score ‐ |
| Eagle 1991 | No significant difference in the Geriatric Quality of Life Questionnaire ADL score ‐ |
| Hedrick 1993 | No significant in the physical dimension of the Sickness Impact Profile (NB high score indicates increased disability) ‐ |
| Pitkala 1991 | No data in this form |
| Tucker 1984 | No significant difference in the mean change in Northwick Park ADL score from baseline (NB high score indicates increased disability) |
| Day hospital vs Domiciliary care | |
| Burch 1999 | No significant difference in Barthel index ‐ |
| Gladman 1993 | No significant difference in median Barthel index ‐ |
| Parker 2009 | No significant difference in mean (SD) Nottingham Extended Activities of Daily Living Scale Day hospital: 31.6 (15.4) Control: 28.1 (17.5) |
| Roderick 2001 | Significant improvement in Barthel score in both groups. |
| Vetter 1989 | No significant difference in mean Barthel index ‐ |
| Young 1992 | Significantly (P=0.01) lower Barthel ADL score ‐ |
| Day hospital vs No comprehensive elderly care | |
| Hui 1995 | No significant difference in mean Barthel index ‐ |
| Masud 2006 | No significant difference in median (IQR) Barthel index scores No significant difference in median (IQR) Nottingham Extended Activities of Daily Living (NEADL) scores Day hospital: 53 (43‐62) |
| Weissert 1980 | No comparable data |
| Woodford 1962 | No comparable data |
Comparison 1 Day Hospital vs Alternative Care ‐ patient outcomes, Outcome 6 Activities of daily living (ADL) scores.
| Study | |
| Day hospital vs Comprehensive elderly care | |
| Cummings 1985 | No significant difference in the modified Dupay assessment ‐ |
| Eagle 1991 | No significant difference in the General Health Questionnaire ‐ |
| Hedrick 1993 | No significant difference in the Sickness Impact Profile ‐ |
| Pitkala 1991 | No comparable data |
| Tucker 1984 | There was a statistically significant improvement in mood measured by the Zung index in the Day hospital group compared to the Comprehensive elderly care group at final follow up (P = 0.01) |
| Day hospital vs Domiciliary care | |
| Burch 1999 | No significant difference in the change in the Philidelphia Geriatric Morale scale during follow up ‐ |
| Gladman 1993 | No significant difference in the number of patients with distress (Nottingham Health Profile >30) ‐ |
| Parker 2009 | There was no significant difference in the EuroQol index (difference in means 0.147, P = 0.141) or the EuroQol VAS (difference in means 0. 6.315, P = 0.187) |
| Roderick 2001 | No between groups significant difference for SF‐36 physical or mental health scales. |
| Vetter 1989 | No significant difference in the Sickness Impact Profile |
| Young 1992 | No significant difference in the number of patients with distress (Nottingham Health Profile >30) ‐ |
| Day hospital vs No comprehensive elderly care | |
| Hui 1995 | No significant difference in the Geriatric Depression Scale |
| Weissert 1980 | No comparable data |
| Woodford 1962 | No comparable data |
Comparison 1 Day Hospital vs Alternative Care ‐ patient outcomes, Outcome 7 Subjective health status.
| Study | |
| Day hospital vs Comprehensive elderly care | |
| Cummings 1985 | No available data |
| Eagle 1991 | No available data |
| Hedrick 1993 | No comparable data |
| Pitkala 1991 | No comparable data |
| Tucker 1984 | No available data |
| Day hospital vs Domiciliary care | |
| Burch 1999 | No available data |
| Gladman 1993 | No available data |
| Roderick 2001 | No available data |
| Vetter 1989 | No available data |
| Young 1992 | No available data |
| Day hospital vs No comprehensive elderly care | |
| Hui 1995 | No significant difference in the level of satisfaction |
| Weissert 1980 | No available data |
| Woodford 1962 | No available data |
Comparison 1 Day Hospital vs Alternative Care ‐ patient outcomes, Outcome 8 Patient satisfaction.
| Study | |
| Day hospital vs Comprehensive elderly care | |
| Cummings 1985 | No comparable data |
| Eagle 1991 | No available data |
| Hedrick 1993 | No comparable data |
| Pitkala 1991 | No comparable data |
| Tucker 1984 | No data available |
| Day hospital vs Domiciliary care | |
| Burch 1999 | There was a significant difference in the mean change between baseline and 3 months in the Caregiver Strain Index in both groups There was no significant difference between between groups |
| Crotty 2008 | No significant difference at 3 months in the Carer Strain Index |
| Gladman 1993 | No significant difference at 6 months in the median Life Satisfaction Index ‐ |
| Roderick 2001 | No available data |
| Vetter 1989 | No data available |
| Young 1992 | Proportion of carers showing distress (General Health Questionnaire 28 score > 5) ‐ Differences were not significant |
| Day hospital vs No comprehensive elderly care | |
| Hui 1995 | No available data |
| Weissert 1980 | No available data |
| Woodford 1962 | No available data |
Comparison 1 Day Hospital vs Alternative Care ‐ patient outcomes, Outcome 9 Carer Distress.

Comparison 2 Day Hospital vs Alternative Care ‐ resource outcomes, Outcome 1 Requiring institutional care at the end of follow up.
| Study | |
| Day hospital vs Comprehensive elderly care | |
| Cummings 1985 | Day hospital: 206 bed days for 48 patients (4.3 days per patient) |
| Eagle 1991 | Day hospital: 1388 bed days for 55 patients (25.2 days per patient) |
| Hedrick 1993 | Day hospital: 8020 bed days for 411 patients (19.5 days per patient) |
| Pitkala 1991 | Day hospital: 3538 bed days for 88 patients (40.2 days per patient) |
| Tucker 1984 | Day hospital: 472 bed days for 62 patients (7.6 days per patient) |
| Day hospital vs Domiciliary care | |
| Burch 1999 | Day hospital: 923 bed days for 50 patients (18.5 per patient) |
| Gladman 1993 | Day hospital: 436 bed days for 76 patients (5.7 days per patient) |
| Roderick 2001 | Day hospital: 296 bed days for 74 patients ( 4 days per patient) |
| Vetter 1989 | No bed days used in either group |
| Young 1992 | Day hospital: 311 bed days for 61 patients (5.1 days per patient) |
| Day hospital vs No comprehensive elderly care | |
| Hui 1995 | Day hospital: 81 bed days for 59 patients (1.4 days per patient) |
| Masud 2006 | Day hospital: 552 bed days for 172 patients (3.2 days per patient) |
| Weissert 1980 | Day hospital: 3443 bed days for 313 patients (11.0 days per patient) |
| Woodford 1962 | Day hospital: 2534 bed days for 168 patients (15.1 days per patient) |
Comparison 2 Day Hospital vs Alternative Care ‐ resource outcomes, Outcome 2 Hospital bed use during follow up.
| Study | |
| Day hospital vs Comprehensive elderly care | |
| Cummings 1985 | Average treatment cost per patient to 3 months post discharge ‐ |
| Eagle 1991 | No cost data |
| Hedrick 1993 | Mean total costs over 12 months ‐ |
| Pitkala 1991 | No costing data |
| Tucker 1984 | Average cost for 5 months care ‐ |
| Day hospital vs Domiciliary care | |
| Burch 1999 | Total annual cost per attendance ‐ |
| Gladman 1993 | Mean total health service cost per patient ‐ |
| Parker 2009 | (entries) Mean total cost at 213 days: Day hospital (21) £10,102; Home based rehab (25) £14,330 (note SDs not reported) (entries) Mean total cost at 395 days: Day hospital (13) £23,812; Home based rehab (23) £26,105 (note SDs not reported) (entries) Median total cost at 213 days: Day hospital (21) £5958; Home based rehab (25) £7679 (note IQRs not reported) (entries) Median total cost at 395 days: Day hospital (13) £9842; Home based rehab (23) £18,432 (note IQRs not reported) |
| Roderick 2001 | Median costs per patient: Rehabilitation costs: Day hospital:£1090 (IQR 513‐1475), |
| Vetter 1989 | No cost data |
| Young 1992 | Mean total costs for 8 weeks treatment ‐ |
| Day hospital vs No comprehensive elderly care | |
| Hui 1995 | Mean cost of treatment to the health service over 6 months ‐ |
| Masud 2006 | The mean falls programme cost was £349 per person. With additional health‐care costs, this resulted in a mean incremental cost of £578 for the intervention Health service resource use and costs. Total cost per participant mean (SD): Day hospital £2,238 (4957) Control £1,659 (5100) |
| Weissert 1980 | Average cost for 1 year ‐ |
| Woodford 1962 | No formal costing |
Comparison 2 Day Hospital vs Alternative Care ‐ resource outcomes, Outcome 3 Resource use.
| Day hospitals compared to alternative or no care for rehabilitation | ||||||
| Patient or population: patients with rehabilitation needs | ||||||
| Outcomes | Illustrative comparative risks* (95% CI) | Relative effect | No of Participants | Quality of the evidence | Comments | |
| Assumed risk | Corresponding risk | |||||
| Alternative or no care | Day hospitals | |||||
| Death by the end of follow up | Study population | OR 1.05 | 3533 | ⊕⊕⊝⊝ | ||
| 127 per 1000 | 132 per 1000 | |||||
| Moderate | ||||||
| 66 per 1000 | 69 per 1000 | |||||
| Death or institutional care by the end of follow up | Study population | OR 0.85 | 3030 | ⊕⊕⊝⊝ | ||
| 303 per 1000 | 270 per 1000 | |||||
| Moderate | ||||||
| 221 per 1000 | 194 per 1000 | |||||
| Death or deterioration in activities of daily living (ADL) | Study population | OR 1.07 | 1268 | ⊕⊕⊝⊝ | ||
| 407 per 1000 | 423 per 1000 | |||||
| Moderate | ||||||
| 430 per 1000 | 447 per 1000 | |||||
| Death or poor outcome (institutional care, disability or deterioration) | Study population | OR 0.92 | 2831 | ⊕⊕⊝⊝ | ||
| 365 per 1000 | 346 per 1000 | |||||
| Moderate | ||||||
| 241 per 1000 | 226 per 1000 | |||||
| Deterioration in ADL in survivors | Study population | OR 1.11 | 905 | ⊕⊕⊝⊝ | ||
| 251 per 1000 | 271 per 1000 | |||||
| Moderate | ||||||
| 233 per 1000 | 252 per 1000 | |||||
| *The basis for the assumed risk (e.g. the median control group risk across studies) is provided in footnotes. The corresponding risk (and its 95% confidence interval) is based on the assumed risk in the comparison group and the relative effect of the intervention (and its 95% CI). | ||||||
| GRADE Working Group grades of evidence | ||||||
| 1 Limitations for at least one risk of bias criterion, or some limitations for multiple criteria, sufficient to lower confidence in the estimate of effect | ||||||
| Day hospitals compared to no comprehensive care for rehabilitation needs | ||||||
| Patient or population: patients with rehabilitation needs | ||||||
| Outcomes | Illustrative comparative risks* (95% CI) | Relative effect | No of Participants | Quality of the evidence | Comments | |
| Assumed risk | Corresponding risk | |||||
| No comprehensive care | Day hospitals | |||||
| Death by the end of follow up | Study population | OR 0.88 | 1345 | ⊕⊕⊝⊝ | ||
| 128 per 1000 | 114 per 1000 | |||||
| Moderate | ||||||
| 131 per 1000 | 117 per 1000 | |||||
| Death or institutional care by the end of follow up | Study population | OR 0.63 | 1177 | ⊕⊕⊝⊝ | ||
| 248 per 1000 | 172 per 1000 | |||||
| Moderate | ||||||
| 307 per 1000 | 218 per 1000 | |||||
| Death or deterioration in ADL | Study population | OR 0.76 | 651 | ⊕⊕⊝⊝ | ||
| 436 per 1000 | 370 per 1000 | |||||
| Moderate | ||||||
| 446 per 1000 | 380 per 1000 | |||||
| Death or poor outcome (institutional care, disability or deterioration) | Study population | OR 0.72 | 982 | ⊕⊕⊝⊝ | ||
| 347 per 1000 | 277 per 1000 | |||||
| Moderate | ||||||
| 400 per 1000 | 324 per 1000 | |||||
| Deterioration in ADL in survivors | Study population | OR 0.61 | 407 | ⊕⊕⊝⊝ | ||
| 277 per 1000 | 189 per 1000 | |||||
| Moderate | ||||||
| 227 per 1000 | 152 per 1000 | |||||
| *The basis for the assumed risk (e.g. the median control group risk across studies) is provided in footnotes. The corresponding risk (and its 95% confidence interval) is based on the assumed risk in the comparison group and the relative effect of the intervention (and its 95% CI). | ||||||
| GRADE Working Group grades of evidence | ||||||
| 1 Limitations for at least one risk of bias criterion or some limitations for multiple criteria, sufficient to lower confidence in the estimate of effect | ||||||
| Day hospitals compared to domiciliary care for rehabilitation | ||||||
| Patient or population: patients with rehabilitation needs | ||||||
| Outcomes | Illustrative comparative risks* (95% CI) | Relative effect | No of Participants | Quality of the evidence | Comments | |
| Assumed risk | Corresponding risk | |||||
| Domiciliary care | Day hospitals | |||||
| Death by the end of follow up | Study population | OR 0.97 | 901 | ⊕⊕⊝⊝ | ||
| 101 per 1000 | 98 per 1000 | |||||
| Moderate | ||||||
| 64 per 1000 | 62 per 1000 | |||||
| Death or institutional care by the end of follow up | Study population | OR 1.05 | 672 | ⊕⊕⊝⊝ | ||
| 187 per 1000 | 194 per 1000 | |||||
| Moderate | ||||||
| 69 per 1000 | 72 per 1000 | |||||
| Death or deterioration in ADL | Study population | OR 1.41 | 443 | ⊕⊕⊝⊝ | ||
| 392 per 1000 | 476 per 1000 | |||||
| Moderate | ||||||
| 334 per 1000 | 414 per 1000 | |||||
| Death or poor outcome (institutional care, disability or deterioration) | Study population | OR 1.08 | 581 | ⊕⊕⊝⊝ | ||
| 297 per 1000 | 313 per 1000 | |||||
| Moderate | ||||||
| 364 per 1000 | 382 per 1000 | |||||
| Deterioration in ADL in survivors | Study population | OR 1.59 | 349 | ⊕⊕⊝⊝ | ||
| 225 per 1000 | 315 per 1000 | |||||
| Moderate | ||||||
| 188 per 1000 | 269 per 1000 | |||||
| *The basis for the assumed risk (e.g. the median control group risk across studies) is provided in footnotes. The corresponding risk (and its 95% confidence interval) is based on the assumed risk in the comparison group and the relative effect of the intervention (and its 95% CI). | ||||||
| GRADE Working Group grades of evidence | ||||||
| 1 Limitations for at least one risk of bias criterion or some limitations for multiple criteria, sufficient to lower confidence in the estimate of effect | ||||||
| Day hospitals compared to comprehensive care for older people requiring rehabilitation | ||||||
| Patient or population: older people requiring rehabilitation | ||||||
| Outcomes | Illustrative comparative risks* (95% CI) | Relative effect | No of Participants | Quality of the evidence | Comments | |
| Assumed risk | Corresponding risk | |||||
| Comprehensive care | Day hospitals | |||||
| Death by the end of follow up | Study population | OR 1.26 | 1287 | ⊕⊕⊝⊝ | ||
| 144 per 1000 | 175 per 1000 | |||||
| Moderate | ||||||
| 69 per 1000 | 85 per 1000 | |||||
| Death or institutional care by the end of follow up | Study population | OR 1 | 1181 | ⊕⊕⊝⊝ | ||
| 426 per 1000 | 426 per 1000 | |||||
| Moderate | ||||||
| 231 per 1000 | 231 per 1000 | |||||
| Death or deterioration in ADL | Study population | OR 1.18 | 174 | ⊕⊕⊝⊝ | ||
| 349 per 1000 | 387 per 1000 | |||||
| Moderate | ||||||
| 349 per 1000 | 387 per 1000 | |||||
| Death or poor outcome (institutional care, disability or deterioration) | Study population | OR 1.05 | 1268 | ⊕⊕⊝⊝ | ||
| 410 per 1000 | 422 per 1000 | |||||
| Moderate | ||||||
| 221 per 1000 | 230 per 1000 | |||||
| Deterioration in ADL in survivors | Study population | OR 1.21 | 149 | ⊕⊕⊝⊝ | ||
| 243 per 1000 | 280 per 1000 | |||||
| Moderate | ||||||
| 243 per 1000 | 280 per 1000 | |||||
| *The basis for the assumed risk (e.g. the median control group risk across studies) is provided in footnotes. The corresponding risk (and its 95% confidence interval) is based on the assumed risk in the comparison group and the relative effect of the intervention (and its 95% CI). | ||||||
| GRADE Working Group grades of evidence | ||||||
| 1 Limitations for at least one risk of bias criterion or some limitations for multiple criteria, sufficient to lower confidence in the estimate of effect | ||||||
| Outcome or subgroup title | No. of studies | No. of participants | Statistical method | Effect size |
| 1 Death by the end of follow up Show forest plot | 16 | 3533 | Odds Ratio (M‐H, Random, 95% CI) | 1.05 [0.85, 1.28] |
| 1.1 Day Hospital vs Comprehensive elderly care | 5 | 1287 | Odds Ratio (M‐H, Random, 95% CI) | 1.26 [0.87, 1.82] |
| 1.2 Day hospital vs Domiciliary care | 7 | 901 | Odds Ratio (M‐H, Random, 95% CI) | 0.97 [0.61, 1.55] |
| 1.3 Day hospital vs No comprehensive elderly care | 4 | 1345 | Odds Ratio (M‐H, Random, 95% CI) | 0.88 [0.63, 1.22] |
| 2 Death or institutional care by the end of follow up Show forest plot | 13 | 3030 | Odds Ratio (M‐H, Random, 95% CI) | 0.85 [0.63, 1.14] |
| 2.1 Day hospital vs Comprehensive elderly care | 4 | 1181 | Odds Ratio (M‐H, Random, 95% CI) | 1.00 [0.69, 1.44] |
| 2.2 Day hospital vs Domiciliary care | 5 | 672 | Odds Ratio (M‐H, Random, 95% CI) | 1.05 [0.57, 1.92] |
| 2.3 Day hospital vs No comprehensive elderly care | 4 | 1177 | Odds Ratio (M‐H, Random, 95% CI) | 0.63 [0.40, 1.00] |
| 3 Death or deterioration in activities of daily living (ADL) Show forest plot | 7 | 1268 | Odds Ratio (M‐H, Random, 95% CI) | 1.07 [0.76, 1.49] |
| 3.1 Day hospital vs Comprehensive elderly care | 1 | 174 | Odds Ratio (M‐H, Random, 95% CI) | 1.18 [0.63, 2.18] |
| 3.2 Day hospital vs Domiciliary care | 4 | 443 | Odds Ratio (M‐H, Random, 95% CI) | 1.41 [0.82, 2.42] |
| 3.3 Day hospital vs No comprehensive elderly care | 2 | 651 | Odds Ratio (M‐H, Random, 95% CI) | 0.76 [0.56, 1.05] |
| 4 Death or poor outcome (institutional care, disability or deterioration) Show forest plot | 13 | 2831 | Odds Ratio (M‐H, Random, 95% CI) | 0.92 [0.74, 1.15] |
| 4.1 Day hospital vs Comprehensive elderly care | 5 | 1268 | Odds Ratio (M‐H, Random, 95% CI) | 1.05 [0.79, 1.40] |
| 4.2 Day hospital vs Domiciliary care | 5 | 581 | Odds Ratio (M‐H, Random, 95% CI) | 1.08 [0.67, 1.74] |
| 4.3 Day hospital vs No comprehensive elderly care | 3 | 982 | Odds Ratio (M‐H, Random, 95% CI) | 0.72 [0.53, 0.99] |
| 5 Deterioration in activities of daily living (ADL) in survivors Show forest plot | 7 | 905 | Odds Ratio (M‐H, Random, 95% CI) | 1.11 [0.68, 1.80] |
| 5.1 Day hospital vs Comprehensive elderly care | 1 | 149 | Odds Ratio (M‐H, Random, 95% CI) | 1.21 [0.58, 2.52] |
| 5.2 Day hospital vs Domiciliary care | 4 | 349 | Odds Ratio (M‐H, Random, 95% CI) | 1.59 [0.87, 2.90] |
| 5.3 Day hospital vs No comprehensive elderly care | 2 | 407 | Odds Ratio (M‐H, Random, 95% CI) | 0.61 [0.38, 0.97] |
| 6 Activities of daily living (ADL) scores Show forest plot | Other data | No numeric data | ||
| 6.1 Day hospital vs Comprehensive elderly care | Other data | No numeric data | ||
| 6.2 Day hospital vs Domiciliary care | Other data | No numeric data | ||
| 6.3 Day hospital vs No comprehensive elderly care | Other data | No numeric data | ||
| 7 Subjective health status Show forest plot | Other data | No numeric data | ||
| 7.1 Day hospital vs Comprehensive elderly care | Other data | No numeric data | ||
| 7.2 Day hospital vs Domiciliary care | Other data | No numeric data | ||
| 7.3 Day hospital vs No comprehensive elderly care | Other data | No numeric data | ||
| 8 Patient satisfaction Show forest plot | Other data | No numeric data | ||
| 8.1 Day hospital vs Comprehensive elderly care | Other data | No numeric data | ||
| 8.2 Day hospital vs Domiciliary care | Other data | No numeric data | ||
| 8.3 Day hospital vs No comprehensive elderly care | Other data | No numeric data | ||
| 9 Carer Distress Show forest plot | Other data | No numeric data | ||
| 9.1 Day hospital vs Comprehensive elderly care | Other data | No numeric data | ||
| 9.2 Day hospital vs Domiciliary care | Other data | No numeric data | ||
| 9.3 Day hospital vs No comprehensive elderly care | Other data | No numeric data | ||
| Outcome or subgroup title | No. of studies | No. of participants | Statistical method | Effect size |
| 1 Requiring institutional care at the end of follow up Show forest plot | 13 | 3003 | Odds Ratio (M‐H, Random, 95% CI) | 0.84 [0.58, 1.21] |
| 1.1 Day hospital vs Comprehensive elderly care | 4 | 1181 | Odds Ratio (M‐H, Random, 95% CI) | 0.91 [0.70, 1.19] |
| 1.2 Day hospital vs Domiciliary care | 5 | 672 | Odds Ratio (M‐H, Random, 95% CI) | 1.49 [0.53, 4.25] |
| 1.3 Day hospital vs No comprehensive elderly care | 4 | 1150 | Odds Ratio (M‐H, Random, 95% CI) | 0.58 [0.28, 1.20] |
| 2 Hospital bed use during follow up Show forest plot | Other data | No numeric data | ||
| 2.1 Day hospital vs Comprehensive elderly care | Other data | No numeric data | ||
| 2.2 Day hospital vs Domiciliary care | Other data | No numeric data | ||
| 2.3 Day hospital vs No comprehensive elderly care | Other data | No numeric data | ||
| 3 Resource use Show forest plot | Other data | No numeric data | ||
| 3.1 Day hospital vs Comprehensive elderly care | Other data | No numeric data | ||
| 3.2 Day hospital vs Domiciliary care | Other data | No numeric data | ||
| 3.3 Day hospital vs No comprehensive elderly care | Other data | No numeric data | ||