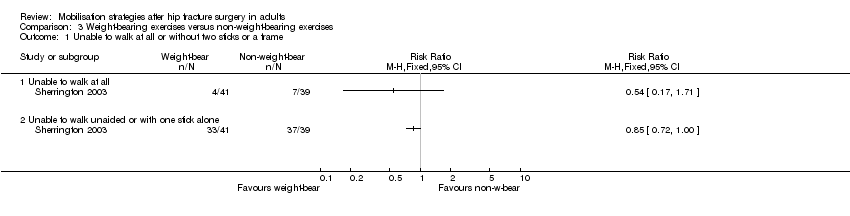
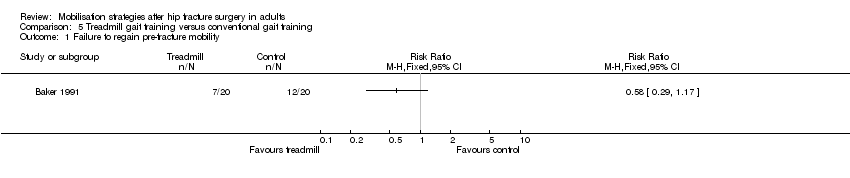
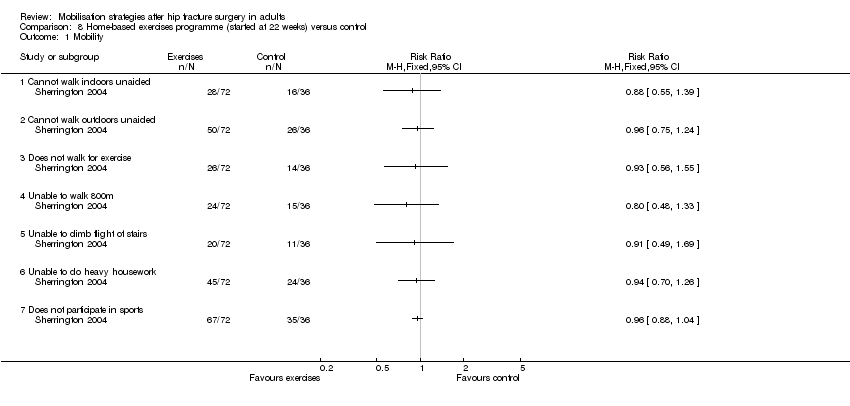
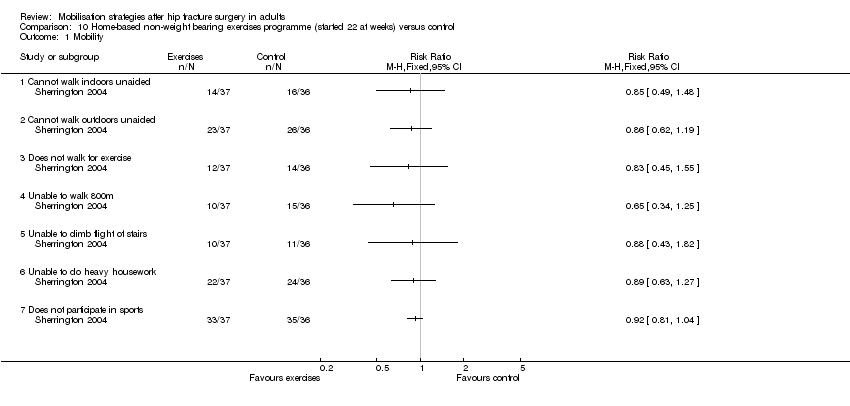
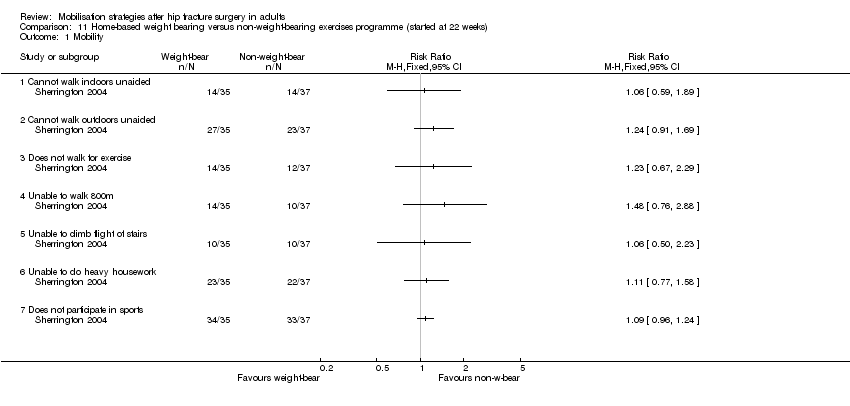
| 1 Mobility Show forest plot | 1 | | Risk Ratio (M‐H, Fixed, 95% CI) | Totals not selected |
|
| 1.1 Cannot walk indoors unaided | 1 | | Risk Ratio (M‐H, Fixed, 95% CI) | 0.0 [0.0, 0.0] |
| 1.2 Cannot walk outdoors unaided | 1 | | Risk Ratio (M‐H, Fixed, 95% CI) | 0.0 [0.0, 0.0] |
| 1.3 Does not walk for exercise | 1 | | Risk Ratio (M‐H, Fixed, 95% CI) | 0.0 [0.0, 0.0] |
| 1.4 Unable to walk 800m | 1 | | Risk Ratio (M‐H, Fixed, 95% CI) | 0.0 [0.0, 0.0] |
| 1.5 Unable to climb flight of stairs | 1 | | Risk Ratio (M‐H, Fixed, 95% CI) | 0.0 [0.0, 0.0] |
| 1.6 Unable to do heavy housework | 1 | | Risk Ratio (M‐H, Fixed, 95% CI) | 0.0 [0.0, 0.0] |
| 1.7 Does not participate in sports | 1 | | Risk Ratio (M‐H, Fixed, 95% CI) | 0.0 [0.0, 0.0] |
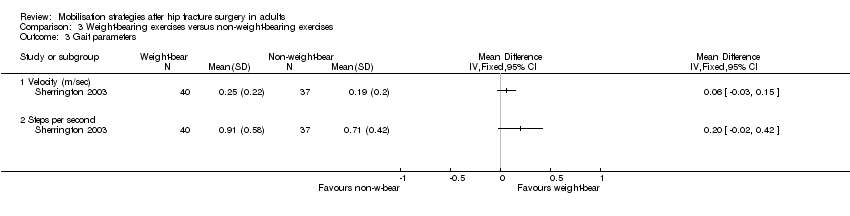
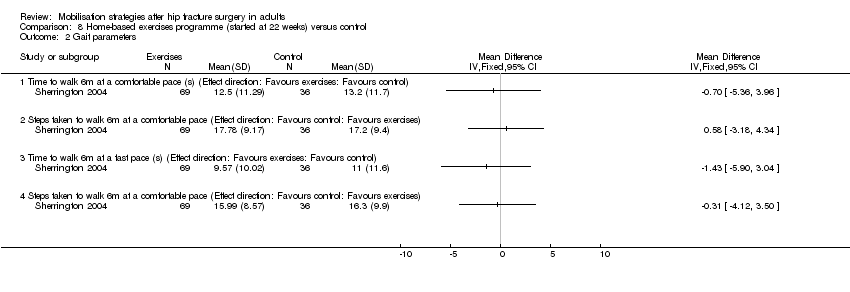
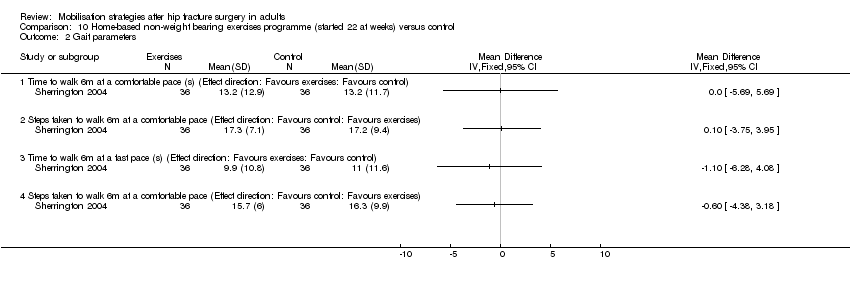
| 2 Gait parameters Show forest plot | 1 | | Mean Difference (IV, Fixed, 95% CI) | Totals not selected |
|
| 2.1 Time to walk 6m at a comfortable pace (s) (Effect direction: Favours weight‐bear: Favours non‐w‐bear) | 1 | | Mean Difference (IV, Fixed, 95% CI) | 0.0 [0.0, 0.0] |
| 2.2 Steps taken to walk 6m at a comfortable pace (Effect direction: Favours non‐w‐bear: Favours weight‐bear) | 1 | | Mean Difference (IV, Fixed, 95% CI) | 0.0 [0.0, 0.0] |
| 2.3 Time to walk 6m at a fast pace (s) (Effect direction: Favours weight‐bear: Favours non‐w‐bear) | 1 | | Mean Difference (IV, Fixed, 95% CI) | 0.0 [0.0, 0.0] |
| 2.4 Steps taken to walk 6m at a comfortable pace (Effect direction: Favours non‐w‐bear: Favours weight‐bear) | 1 | | Mean Difference (IV, Fixed, 95% CI) | 0.0 [0.0, 0.0] |
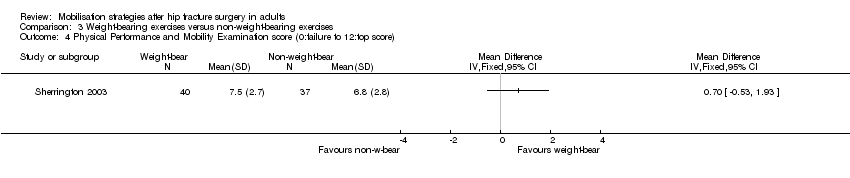
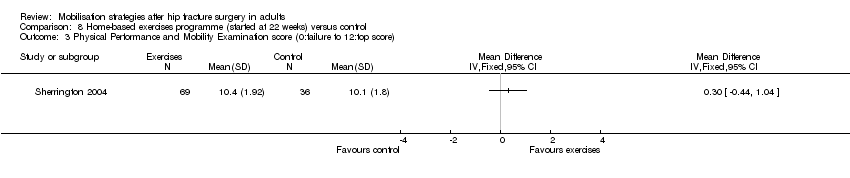
| 3 Physical Performance and Mobility Examination score (0:failure to 12:top score) Show forest plot | 1 | | Mean Difference (IV, Fixed, 95% CI) | Totals not selected |
|
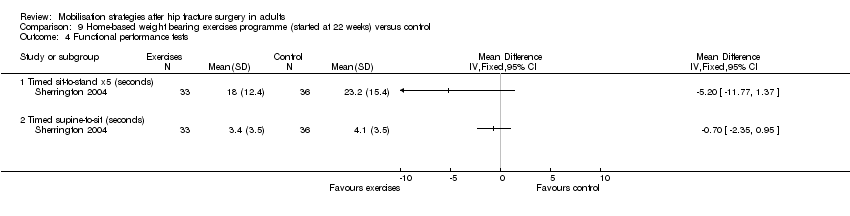
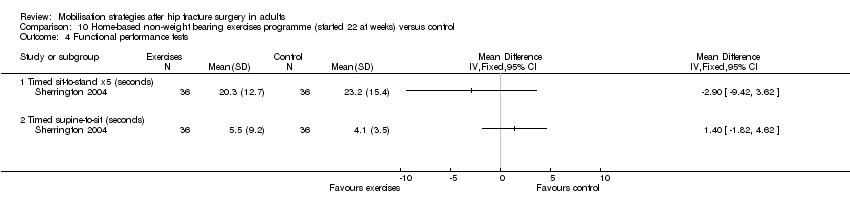
| 4 Functional performance tests Show forest plot | 1 | | Mean Difference (IV, Fixed, 95% CI) | Totals not selected |
|
| 4.1 Timed sit‐to‐stand x5 (seconds) | 1 | | Mean Difference (IV, Fixed, 95% CI) | 0.0 [0.0, 0.0] |
| 4.2 Timed supine‐to‐sit (seconds) | 1 | | Mean Difference (IV, Fixed, 95% CI) | 0.0 [0.0, 0.0] |
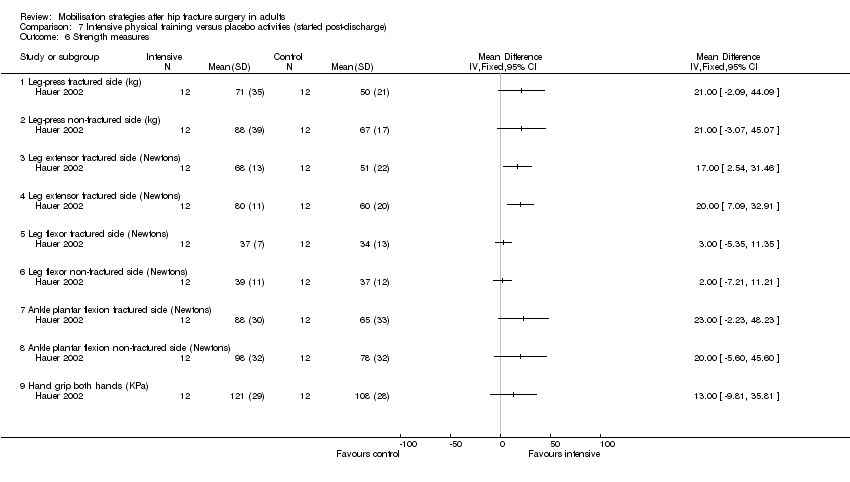
| 5 Strength measures (newtons) Show forest plot | 1 | | Mean Difference (IV, Fixed, 95% CI) | Totals not selected |
|
| 5.1 Hip abduction fractured leg | 1 | | Mean Difference (IV, Fixed, 95% CI) | 0.0 [0.0, 0.0] |
| 5.2 Hip abduction non‐fractured leg | 1 | | Mean Difference (IV, Fixed, 95% CI) | 0.0 [0.0, 0.0] |
| 5.3 Hip flexion fractured leg | 1 | | Mean Difference (IV, Fixed, 95% CI) | 0.0 [0.0, 0.0] |
| 5.4 Hip flexion non‐fractured leg | 1 | | Mean Difference (IV, Fixed, 95% CI) | 0.0 [0.0, 0.0] |
| 5.5 Knee extension fractured leg | 1 | | Mean Difference (IV, Fixed, 95% CI) | 0.0 [0.0, 0.0] |
| 5.6 Knee extension non‐fractured leg | 1 | | Mean Difference (IV, Fixed, 95% CI) | 0.0 [0.0, 0.0] |
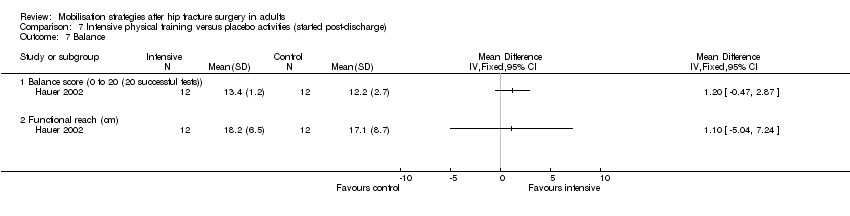
| 6 Balance Show forest plot | 1 | | Mean Difference (IV, Fixed, 95% CI) | Totals not selected |
|
| 6.1 Step test fractured leg (steps) (Effect direction: Favours non‐w‐bear: Favours weight‐bear) | 1 | | Mean Difference (IV, Fixed, 95% CI) | 0.0 [0.0, 0.0] |
| 6.2 Step test non‐fractured leg (steps) (Effect direction: Favours non‐w‐bear: Favours weigh‐bear) | 1 | | Mean Difference (IV, Fixed, 95% CI) | 0.0 [0.0, 0.0] |
| 6.3 Functional reach (cm) (Effect direction: Favours non‐w‐bear: Favours weight‐bear) | 1 | | Mean Difference (IV, Fixed, 95% CI) | 0.0 [0.0, 0.0] |
| 6.4 Sway distance floor (mm) (Effect direction: Favours weight‐bear: Favours non‐w‐bear) | 1 | | Mean Difference (IV, Fixed, 95% CI) | 0.0 [0.0, 0.0] |
| 6.5 Sway distance foam (mm) (Effect direction: Favours weight‐bear: Favours non‐w‐bear) | 1 | | Mean Difference (IV, Fixed, 95% CI) | 0.0 [0.0, 0.0] |
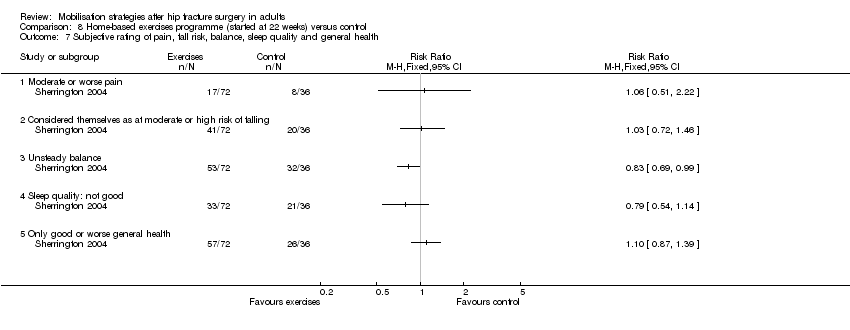
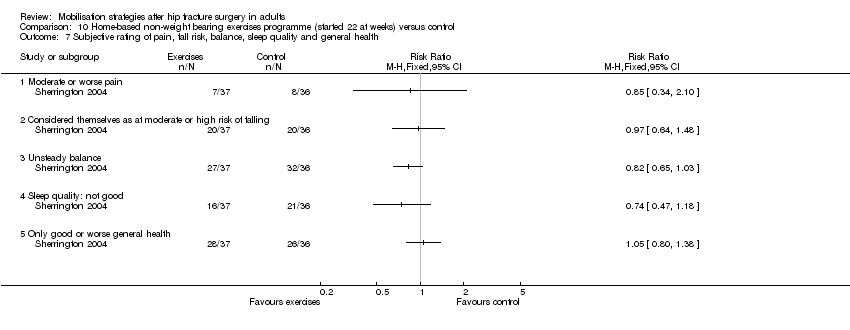
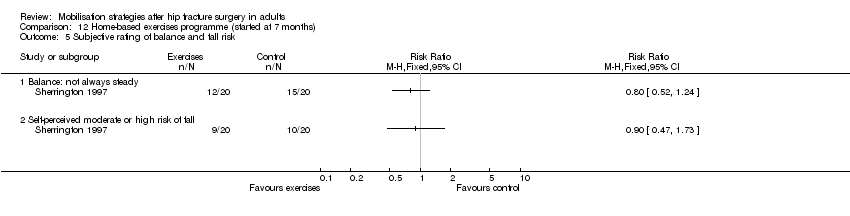
| 7 Subjective rating of pain, fall risk, balance, sleep quality and general health Show forest plot | 1 | | Risk Ratio (M‐H, Fixed, 95% CI) | Totals not selected |
|
| 7.1 Moderate or worse pain | 1 | | Risk Ratio (M‐H, Fixed, 95% CI) | 0.0 [0.0, 0.0] |
| 7.2 Considered themselves as at moderate or high risk of falling | 1 | | Risk Ratio (M‐H, Fixed, 95% CI) | 0.0 [0.0, 0.0] |
| 7.3 Unsteady balance | 1 | | Risk Ratio (M‐H, Fixed, 95% CI) | 0.0 [0.0, 0.0] |
| 7.4 Sleep quality: not good | 1 | | Risk Ratio (M‐H, Fixed, 95% CI) | 0.0 [0.0, 0.0] |
| 7.5 Only good or worse general health | 1 | | Risk Ratio (M‐H, Fixed, 95% CI) | 0.0 [0.0, 0.0] |
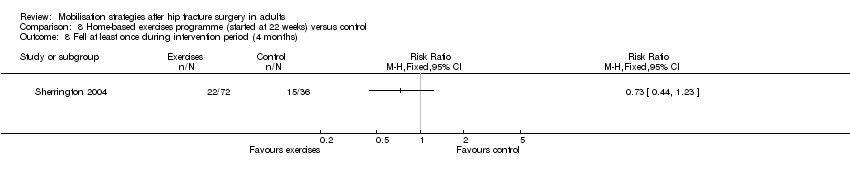
| 8 Fell at least once during intervention period (4 months) Show forest plot | 1 | | Risk Ratio (M‐H, Fixed, 95% CI) | Totals not selected |
|
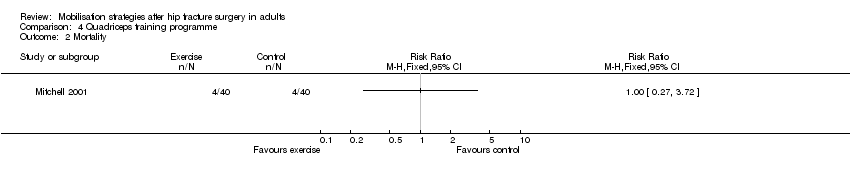
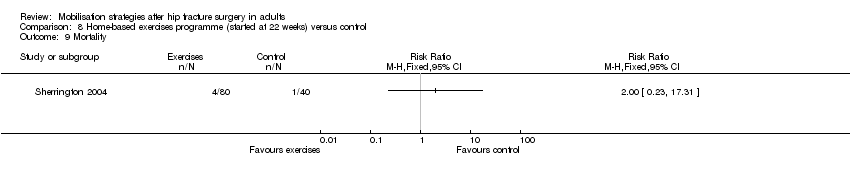
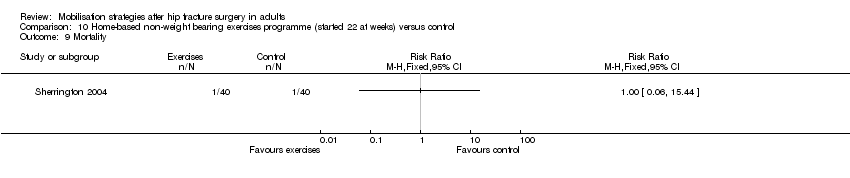
| 9 Mortality Show forest plot | 1 | | Risk Ratio (M‐H, Fixed, 95% CI) | Totals not selected |
|
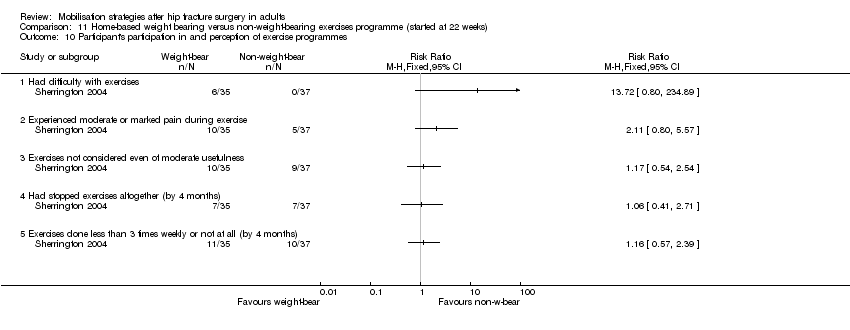
| 10 Participant's participation in and perception of exercise programmes Show forest plot | 1 | | Risk Ratio (M‐H, Fixed, 95% CI) | Totals not selected |
|
| 10.1 Had difficulty with exercises | 1 | | Risk Ratio (M‐H, Fixed, 95% CI) | 0.0 [0.0, 0.0] |
| 10.2 Experienced moderate or marked pain during exercise | 1 | | Risk Ratio (M‐H, Fixed, 95% CI) | 0.0 [0.0, 0.0] |
| 10.3 Exercises not considered even of moderate usefulness | 1 | | Risk Ratio (M‐H, Fixed, 95% CI) | 0.0 [0.0, 0.0] |
| 10.4 Had stopped exercises altogether (by 4 months) | 1 | | Risk Ratio (M‐H, Fixed, 95% CI) | 0.0 [0.0, 0.0] |
| 10.5 Exercises done less than 3 times weekly or not at all (by 4 months) | 1 | | Risk Ratio (M‐H, Fixed, 95% CI) | 0.0 [0.0, 0.0] |