Tratamiento corticosteroide para el síndrome nefrótico en niños
Información
- DOI:
- https://doi.org/10.1002/14651858.CD001533.pub6Copiar DOI

- Base de datos:
-
- Cochrane Database of Systematic Reviews
- Versión publicada:
-
- 31 agosto 2020see what's new
- Tipo:
-
- Intervention
- Etapa:
-
- Review
- Grupo Editorial Cochrane:
-
Grupo Cochrane de Riñón y trasplante
- Copyright:
-
- Copyright © 2020 The Cochrane Collaboration. Published by John Wiley & Sons, Ltd.
Cifras del artículo
Altmetric:
Citado por:
Autores
Contributions of authors
-
Deirdre Hahn: Study selection, quality appraisal, data extraction, data analysis, writing review, updating review.
-
Susan Samuel: Study selection, data extraction, updating review
-
Narelle Willis: Literature search, obtaining articles, organising translation, data extraction, data analysis, data display, updating review.
-
Jonathan Craig: Data analysis, writing review, updating review.
-
Elisabeth Hodson: Study selection, quality appraisal, data extraction, data analysis, writing review, updating review.
Declarations of interest
-
Deirdre Hahn: none known
-
Susan Samuel: none known
-
Narelle Willis: none known
-
Jonathan Craig: none known
-
Elisabeth Hodson: none known
Acknowledgements
We are grateful to Dr John F Knight who contributed to the design, quality assessment, data collection, entry, analysis and interpretation, and writing of early versions of this review (Hodson 2000; Hodson 2005).
The authors would like to thank Professor A Bagga, Professor A Abeyagunawardena, Professor PF Hoyer, Professor UK Jayantha, Dr C Kleinknecht, Professor M Liern, Professor TE Mattoo, Professor O Mishra, Professor RK Sharma, Professor Nicholas Webb and Professor N Yoshikawa for the information that they provided about their studies. The authors wish to thank Professors Barratt, Brodehl, Broyer and Ponticelli for responding to our requests for information about unpublished studies.
The authors are grateful to the following peer reviewers for their time and comments for this review update: William Wong (Director of Paediatric Nephrology, Clinical Director, Paediatric Medical Specialties, Starship Children's Hospital, New Zealand); Damien Noone (Division of Nephrology, The Hospital for Sick Children, Toronto, Canada).
Version history
| Published | Title | Stage | Authors | Version |
| 2020 Aug 31 | Corticosteroid therapy for nephrotic syndrome in children | Review | Deirdre Hahn, Susan M Samuel, Narelle S Willis, Jonathan C Craig, Elisabeth M Hodson | |
| 2015 Mar 18 | Corticosteroid therapy for nephrotic syndrome in children | Review | Deirdre Hahn, Elisabeth M Hodson, Narelle S Willis, Jonathan C Craig | |
| 2007 Oct 17 | Corticosteroid therapy for nephrotic syndrome in children | Review | Elisabeth M Hodson, Narelle S Willis, Jonathan C Craig | |
| 2005 Jan 24 | Corticosteroid therapy for nephrotic syndrome in children | Review | Elisabeth M Hodson, John F Knight, Narelle S Willis, Jonathan C Craig | |
| 2003 Apr 22 | Corticosteroid therapy for nephrotic syndrome in children | Review | Elisabeth M Hodson, John JF Knight, Narelle S Willis, Jonathan J C Craig | |
| 2002 Sep 23 | Corticosteroid therapy for nephrotic syndrome in children | Review | Elisabeth Hodson, John JF Knight, Narelle S Willis, Jonathan C Craig | |
Differences between protocol and review
Risk of bias assessment tool has replaced the Quality assessment checklist list used in the previous versions of this review.
Keywords
MeSH
Medical Subject Headings (MeSH) Keywords
- Anti-Inflammatory Agents [*therapeutic use];
- Drug Administration Schedule;
- Glucocorticoids [adverse effects, therapeutic use];
- Nephrotic Syndrome [*drug therapy];
- Prednisone [therapeutic use];
- Pregnenediones [therapeutic use];
- Randomized Controlled Trials as Topic;
- Recurrence;
- Respiratory Tract Infections [drug therapy, virology];
- Secondary Prevention;
- Virus Diseases [drug therapy];
Medical Subject Headings Check Words
Adolescent; Child; Child, Preschool; Humans; Infant;
PICO
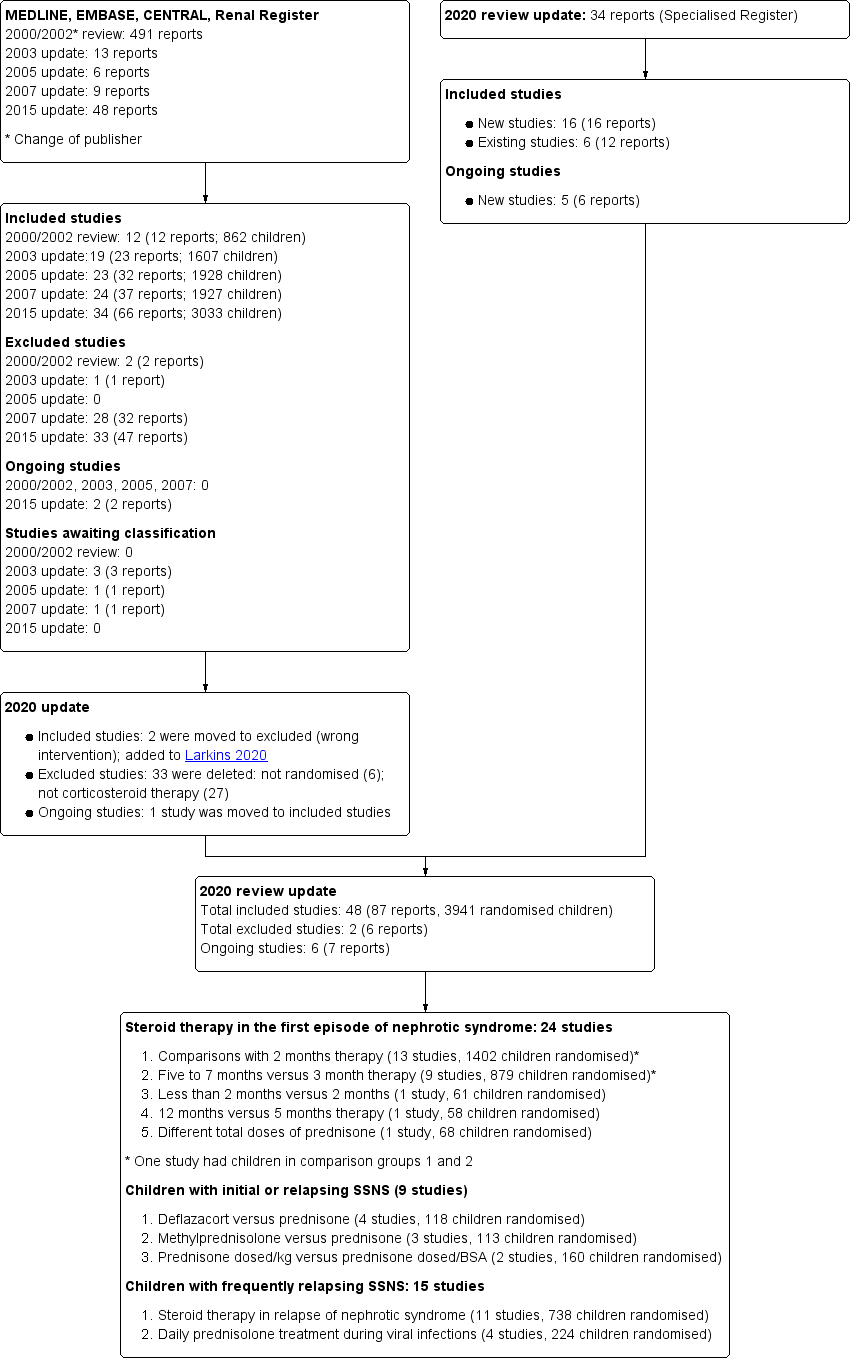
Study flow diagram.

Risk of bias graph: review authors' judgements about each risk of bias item presented as percentages across all included studies.

Risk of bias summary: review authors' judgements about each risk of bias item for each included study.

Forest plot of comparison: 1 Steroid therapy in first episode: ≥ 3 months versus 2 months therapy, outcome: 1.3 Number with frequent relapses by 12 to 24 months stratified by risk of bias for selection bias.

Forest plot of comparison: 2 Steroid therapy in first episode: 5 to 7 months versus 3 months, outcome: 2.3 Number with frequent relapses stratified by risk of selection bias.

Comparison 1: Steroid therapy in first episode: ≥ 3 months versus 2 months therapy, Outcome 1: Number with frequent relapses by 12 to 24 months

Comparison 1: Steroid therapy in first episode: ≥ 3 months versus 2 months therapy, Outcome 2: Number of children relapsing by 12 to 24 months

Comparison 1: Steroid therapy in first episode: ≥ 3 months versus 2 months therapy, Outcome 3: Number with frequent relapses by 12 to 24 months stratified by risk of bias for selection bias

Comparison 1: Steroid therapy in first episode: ≥ 3 months versus 2 months therapy, Outcome 4: Number of children relapsing by 12 to 24 months stratified by risk of selection bias

Comparison 1: Steroid therapy in first episode: ≥ 3 months versus 2 months therapy, Outcome 5: Adverse events

Comparison 2: Steroid therapy in first episode: 5 to 7 months versus 3 months, Outcome 1: Number with frequent relapses by 12 to 24 months

Comparison 2: Steroid therapy in first episode: 5 to 7 months versus 3 months, Outcome 2: Number of children relapsing by 12 to 24 months

Comparison 2: Steroid therapy in first episode: 5 to 7 months versus 3 months, Outcome 3: Number with frequent relapses stratified by risk of selection bias

Comparison 2: Steroid therapy in first episode: 5 to 7 months versus 3 months, Outcome 4: Number of children relapsing by 12 to 24 months stratified by risk of selection bias

Comparison 2: Steroid therapy in first episode: 5 to 7 months versus 3 months, Outcome 5: Adverse events

Comparison 3: Steroid therapy in the first episode: 1 month versus 2 months therapy, Outcome 1: Number of children relapsing by 6 to 12 months

Comparison 3: Steroid therapy in the first episode: 1 month versus 2 months therapy, Outcome 2: Number of children relapsing by 12 to 24 months

Comparison 3: Steroid therapy in the first episode: 1 month versus 2 months therapy, Outcome 3: Number with frequent relapses

Comparison 4: Steroid therapy in the first episode: 12 months versus 5 months therapy, Outcome 1: Number with relapse

Comparison 5: Steroid therapy in the first episode of nephrotic syndrome: different total doses given over the same duration, Outcome 1: Relapse at 12 months

Comparison 5: Steroid therapy in the first episode of nephrotic syndrome: different total doses given over the same duration, Outcome 2: Number with FRNS

Comparison 5: Steroid therapy in the first episode of nephrotic syndrome: different total doses given over the same duration, Outcome 3: Adverse effects

Comparison 6: Methylprednisolone in steroid therapy in first episode of nephrotic syndrome: methylprednisone versus prednisolone, Outcome 1: Time to remission

Comparison 6: Methylprednisolone in steroid therapy in first episode of nephrotic syndrome: methylprednisone versus prednisolone, Outcome 2: Number with relapse

Comparison 7: Daily prednisolone treatment during viral infections, Outcome 1: Number with relapse with infection

Comparison 7: Daily prednisolone treatment during viral infections, Outcome 2: Number of relapses/patient

Comparison 7: Daily prednisolone treatment during viral infections, Outcome 3: Number of relapses/patient at 2 years

Comparison 8: Deflazacort versus prednisolone, Outcome 1: Number with remission

Comparison 8: Deflazacort versus prednisolone, Outcome 2: Number of children with relapse by 9 to 12 months

Comparison 9: Treatment therapy (various) versus standard therapy in relapsing nephrotic syndrome, Outcome 1: Number of children relapsing during therapy

Comparison 9: Treatment therapy (various) versus standard therapy in relapsing nephrotic syndrome, Outcome 2: Number of children with relapses by 9 to 12 months

Comparison 9: Treatment therapy (various) versus standard therapy in relapsing nephrotic syndrome, Outcome 3: Mean time to relapse

Comparison 9: Treatment therapy (various) versus standard therapy in relapsing nephrotic syndrome, Outcome 4: Mean relapse rate/patient/year

Comparison 9: Treatment therapy (various) versus standard therapy in relapsing nephrotic syndrome, Outcome 5: Cumulative steroid dose

Comparison 9: Treatment therapy (various) versus standard therapy in relapsing nephrotic syndrome, Outcome 6: Mean time to remission

Comparison 9: Treatment therapy (various) versus standard therapy in relapsing nephrotic syndrome, Outcome 7: Serious adverse events

Comparison 10: Steroid therapy for relapse: different prednisone doses, Outcome 1: Time to remission with different prednisone doses

Comparison 10: Steroid therapy for relapse: different prednisone doses, Outcome 2: Cumulative prednisone dose to achieve remission

Comparison 10: Steroid therapy for relapse: different prednisone doses, Outcome 3: Number with relapse

Comparison 11: Daily versus alternate‐day prednisone for relapsing nephrotic syndrome, Outcome 1: Number of relapses in 12 months

Comparison 11: Daily versus alternate‐day prednisone for relapsing nephrotic syndrome, Outcome 2: Adverse effects

Comparison 12: Weight‐based versus body surface area (BSA)‐based dosing of prednisolone, Outcome 1: Relapse at 6 months

Comparison 12: Weight‐based versus body surface area (BSA)‐based dosing of prednisolone, Outcome 2: Adverse effects

Comparison 12: Weight‐based versus body surface area (BSA)‐based dosing of prednisolone, Outcome 3: Prednisone dose

Comparison 13: Prolonged steroid therapy (7 months) for relapsing nephrotic syndrome, Outcome 1: Number with relapses

Comparison 13: Prolonged steroid therapy (7 months) for relapsing nephrotic syndrome, Outcome 2: Relapse rate/patient/year

Comparison 13: Prolonged steroid therapy (7 months) for relapsing nephrotic syndrome, Outcome 3: Number with FRNS or SDNS

Comparison 13: Prolonged steroid therapy (7 months) for relapsing nephrotic syndrome, Outcome 4: Cumulative steroid dose

Comparison 13: Prolonged steroid therapy (7 months) for relapsing nephrotic syndrome, Outcome 5: Adverse effects
| Steroid therapy in first episode of nephrotic syndrome: 3 months or more versus 2 months of therapy for nephrotic syndrome in children | |||||
| Patient or population: children with nephrotic syndrome | |||||
| Outcomes | Anticipated absolute effects* (95% CI) | Relative effect | No. of participants | Certainty of the evidence | |
|---|---|---|---|---|---|
| Assumed risk | Corresponding risk | ||||
| Risk with 2 months of therapy | Risk with 3 months or more of therapy | ||||
| Number with frequent relapses by 12 to 24 months | 450 per 1,000 | 387 per 1,000 | RR 0.86 | 976 (8) | ⊕⊕⊕⊝1 |
| Number of children relapsing by 12 to 24 months | 646 per 1,000 | 497 per 1,000 | RR 0.77 | 1309 (12) | ⊕⊕⊝⊝1,2 |
| Number with frequent relapses by 12 to 24 months stratified by risk of selection bias: Low risk of selection bias | 413 per 1,000 | 409 per 1,000 | RR 0.99 | 585 (4) | ⊕⊕⊕⊕ |
| Number with frequent relapses by 12 to 24 months stratified by risk of selection bias: Unclear or high risk of bias for allocation bias | 357 per 1,000 | 161 per 1,000 | RR 0.45 | 220 (3) | ⊕⊕⊝⊝ 1,2 |
| Adverse events: psychological disorders | 470 per 1,000 | 470 per 1,000 | RR 1.00 | 456 (4) | ⊕⊕⊝⊝2,3 |
| Adverse events: hypertension | 50 per 1,000 | 89 per 1,000 | RR 1.78 | 548 (7) | ⊕⊕⊕⊝ 1 |
| Adverse events: Cushing's syndrome | 402 per 1,000 | 450 per 1,000 | RR 1.12 | 547 (5) | ⊕⊕⊕⊝1 |
| *The risk in the intervention group (and its 95% CI) is based on the assumed risk in the comparison group and the relative effect of the intervention (and its 95% CI). | |||||
| GRADE Working Group grades of evidence | |||||
| 1 Significant heterogeneity between studies 2 Some studies at high or unclear risk of bias 3 Few studies included in analyses | |||||
| Steroid therapy in first episode of nephrotic syndrome: 5 to 7 months versus 3 months for nephrotic syndrome in children | |||||
| Patient or population: children with nephrotic syndrome | |||||
| Outcomes | Illustrative comparative risks* (95% CI) | Relative effect | No. of Participants | Quality of the evidence | |
|---|---|---|---|---|---|
| Assumed risk | Corresponding risk | ||||
| Risk with 3 months of therapy | Risk with 5 to 7 months of therapy | ||||
| Number with frequent relapses by 12 to 24 months | 387 per 1000 | 282 per 1000 | RR 0.73 | 706 (6) | ⊕⊕⊕⊝ |
| Number of children relapsing by 12 to 24 months | 696 per 1000 | 432 per 1000 | RR 0.62 | 762 (7) | ⊕⊕⊝⊝ |
| Subgroup analysis by risk of bias for number with frequent relapses: low risk of selection bias | 440 per 1000 | 436 per 1000 | RR 0.99 | 376 (3) | ⊕⊕⊕⊕ |
| Subgroup analysis by risk of bias for number with frequent relapses: Unclear or high risk of selection bias | 327 per 1000 | 157 per 1000 | RR 0.48 | 330 (3) | ⊕⊕⊕⊝ |
| Adverse events: hypertension | 126 per 1000 | 140 per 1000 | RR 1.11 | 752 (6) | ⊕⊕⊕⊝ |
| Adverse events: eye complications | 36 per 1000 | 17 per 1000 | RR 0.46 | 614 | ⊕⊕⊕⊝ |
| Adverse events: Cushingoid appearance | 375 per 1000 | 323 per 1000 | RR 0.86 | 762 (6) | ⊕⊕⊕⊝ |
| Adverse events: psychological disorders | 53 per 1000 | 16 per 1000 | RR 0.30 | 505 (4) | ⊕⊕⊝⊝ |
| *The basis for the assumed risk (e.g. the median control group risk across studies) is provided in footnotes. The corresponding risk (and its 95% CI) is based on the assumed risk in the comparison group and the relative effect of the intervention (and its 95% CI). | |||||
| GRADE Working Group grades of evidence | |||||
| 1 Significant heterogeneity between studies 2 Some studies at high or unclear risk of bias 3 Few studies included in analyses | |||||
| Outcome or subgroup title | No. of studies | No. of participants | Statistical method | Effect size |
| 1.1 Number with frequent relapses by 12 to 24 months Show forest plot | 8 | 976 | Risk Ratio (M‐H, Random, 95% CI) | 0.86 [0.71, 1.06] |
| 1.2 Number of children relapsing by 12 to 24 months Show forest plot | 12 | 1309 | Risk Ratio (M‐H, Random, 95% CI) | 0.77 [0.63, 0.95] |
| 1.3 Number with frequent relapses by 12 to 24 months stratified by risk of bias for selection bias Show forest plot | 7 | 805 | Risk Ratio (M‐H, Random, 95% CI) | 0.79 [0.59, 1.06] |
| 1.3.1 Low risk of selection bias | 4 | 585 | Risk Ratio (M‐H, Random, 95% CI) | 0.99 [0.82, 1.19] |
| 1.3.2 Unclear or high risk of selection bias | 3 | 220 | Risk Ratio (M‐H, Random, 95% CI) | 0.45 [0.26, 0.77] |
| 1.4 Number of children relapsing by 12 to 24 months stratified by risk of selection bias Show forest plot | 11 | 1108 | Risk Ratio (M‐H, Random, 95% CI) | 0.79 [0.65, 0.95] |
| 1.4.1 Low risk of selection bias | 5 | 637 | Risk Ratio (M‐H, Random, 95% CI) | 0.91 [0.78, 1.06] |
| 1.4.2 Unclear or high risk of selection bias | 6 | 471 | Risk Ratio (M‐H, Random, 95% CI) | 0.69 [0.49, 0.98] |
| 1.5 Adverse events Show forest plot | 8 | Risk Ratio (M‐H, Random, 95% CI) | Subtotals only | |
| 1.5.1 Psychological disorders | 4 | 456 | Risk Ratio (M‐H, Random, 95% CI) | 1.00 [0.53, 1.90] |
| 1.5.2 Hypertension | 7 | 548 | Risk Ratio (M‐H, Random, 95% CI) | 1.78 [0.55, 5.73] |
| 1.5.3 Cataracts/eye disorders | 6 | 623 | Risk Ratio (M‐H, Random, 95% CI) | 0.41 [0.11, 1.52] |
| 1.5.4 Retarded growth | 4 | 354 | Risk Ratio (M‐H, Random, 95% CI) | 0.54 [0.25, 1.18] |
| 1.5.5 Cushingoid facies | 5 | 547 | Risk Ratio (M‐H, Random, 95% CI) | 1.12 [0.76, 1.65] |
| 1.5.6 Infections | 2 | 172 | Risk Ratio (M‐H, Random, 95% CI) | 0.79 [0.53, 1.17] |
| 1.5.7 Osteoporosis | 3 | 233 | Risk Ratio (M‐H, Random, 95% CI) | 0.47 [0.06, 3.38] |
| Outcome or subgroup title | No. of studies | No. of participants | Statistical method | Effect size |
| 2.1 Number with frequent relapses by 12 to 24 months Show forest plot | 6 | 706 | Risk Ratio (M‐H, Random, 95% CI) | 0.73 [0.49, 1.09] |
| 2.2 Number of children relapsing by 12 to 24 months Show forest plot | 7 | 762 | Risk Ratio (M‐H, Random, 95% CI) | 0.62 [0.45, 0.85] |
| 2.3 Number with frequent relapses stratified by risk of selection bias Show forest plot | 6 | 706 | Risk Ratio (M‐H, Random, 95% CI) | 0.73 [0.49, 1.09] |
| 2.3.1 Studies at low risk of selection bias | 3 | 376 | Risk Ratio (M‐H, Random, 95% CI) | 0.99 [0.74, 1.33] |
| 2.3.2 Studies at high or unclear risk of selection bias | 3 | 330 | Risk Ratio (M‐H, Random, 95% CI) | 0.48 [0.32, 0.72] |
| 2.4 Number of children relapsing by 12 to 24 months stratified by risk of selection bias Show forest plot | 7 | 762 | Risk Ratio (M‐H, Random, 95% CI) | 0.62 [0.45, 0.85] |
| 2.4.1 Studies at low risk of selection bias | 3 | 376 | Risk Ratio (M‐H, Random, 95% CI) | 0.88 [0.69, 1.11] |
| 2.4.2 Studies at high or unclear risk of selection bias | 4 | 386 | Risk Ratio (M‐H, Random, 95% CI) | 0.47 [0.34, 0.67] |
| 2.5 Adverse events Show forest plot | 6 | Risk Ratio (M‐H, Random, 95% CI) | Subtotals only | |
| 2.5.1 Hypertension | 6 | 752 | Risk Ratio (M‐H, Random, 95% CI) | 1.11 [0.71, 1.74] |
| 2.5.2 Eye complications | 5 | 614 | Risk Ratio (M‐H, Random, 95% CI) | 0.46 [0.18, 1.17] |
| 2.5.3 Infections | 5 | 702 | Risk Ratio (M‐H, Random, 95% CI) | 0.98 [0.65, 1.46] |
| 2.5.4 Cushingoid appearance | 6 | 762 | Risk Ratio (M‐H, Random, 95% CI) | 0.86 [0.60, 1.23] |
| 2.5.5 Gastrointestinal bleeding | 1 | 140 | Risk Ratio (M‐H, Random, 95% CI) | 1.50 [0.26, 8.70] |
| 2.5.6 Addisonian crisis | 1 | 140 | Risk Ratio (M‐H, Random, 95% CI) | 0.50 [0.05, 5.39] |
| 2.5.7 Psychological disorders | 4 | 505 | Risk Ratio (M‐H, Random, 95% CI) | 0.30 [0.05, 1.83] |
| 2.5.8 Growth | 3 | 436 | Risk Ratio (M‐H, Random, 95% CI) | 0.73 [0.36, 1.48] |
| Outcome or subgroup title | No. of studies | No. of participants | Statistical method | Effect size |
| 3.1 Number of children relapsing by 6 to 12 months Show forest plot | 1 | Risk Ratio (M‐H, Random, 95% CI) | Totals not selected | |
| 3.2 Number of children relapsing by 12 to 24 months Show forest plot | 1 | Risk Ratio (M‐H, Random, 95% CI) | Totals not selected | |
| 3.3 Number with frequent relapses Show forest plot | 1 | Risk Ratio (M‐H, Random, 95% CI) | Totals not selected | |
| Outcome or subgroup title | No. of studies | No. of participants | Statistical method | Effect size |
| 4.1 Number with relapse Show forest plot | 1 | Risk Ratio (M‐H, Random, 95% CI) | Totals not selected | |
| Outcome or subgroup title | No. of studies | No. of participants | Statistical method | Effect size |
| 5.1 Relapse at 12 months Show forest plot | 1 | Risk Ratio (M‐H, Random, 95% CI) | Totals not selected | |
| 5.2 Number with FRNS Show forest plot | 1 | Risk Ratio (M‐H, Random, 95% CI) | Totals not selected | |
| 5.3 Adverse effects Show forest plot | 1 | Risk Ratio (M‐H, Random, 95% CI) | Totals not selected | |
| 5.3.1 Hypertension | 1 | Risk Ratio (M‐H, Random, 95% CI) | Totals not selected | |
| 5.3.2 Psychological disorders | 1 | Risk Ratio (M‐H, Random, 95% CI) | Totals not selected | |
| 5.3.3 Cushing's Syndrome | 1 | Risk Ratio (M‐H, Random, 95% CI) | Totals not selected | |
| Outcome or subgroup title | No. of studies | No. of participants | Statistical method | Effect size |
| 6.1 Time to remission Show forest plot | 2 | 38 | Mean Difference (IV, Random, 95% CI) | ‐5.54 [‐8.46, ‐2.61] |
| 6.2 Number with relapse Show forest plot | 1 | Risk Ratio (M‐H, Random, 95% CI) | Totals not selected | |
| Outcome or subgroup title | No. of studies | No. of participants | Statistical method | Effect size |
| 7.1 Number with relapse with infection Show forest plot | 1 | Risk Ratio (M‐H, Random, 95% CI) | Totals not selected | |
| 7.2 Number of relapses/patient Show forest plot | 1 | Mean Difference (IV, Random, 95% CI) | Totals not selected | |
| 7.2.1 Number of infection‐related relapses/patient/year | 1 | Mean Difference (IV, Random, 95% CI) | Totals not selected | |
| 7.2.2 Total relapses (episodes/patient/1 year) | 1 | Mean Difference (IV, Random, 95% CI) | Totals not selected | |
| 7.3 Number of relapses/patient at 2 years Show forest plot | 1 | Mean Difference (IV, Random, 95% CI) | Totals not selected | |
| Outcome or subgroup title | No. of studies | No. of participants | Statistical method | Effect size |
| 8.1 Number with remission Show forest plot | 2 | 67 | Risk Ratio (M‐H, Random, 95% CI) | 1.08 [0.94, 1.24] |
| 8.2 Number of children with relapse by 9 to 12 months Show forest plot | 2 | 63 | Risk Ratio (M‐H, Random, 95% CI) | 0.46 [0.27, 0.78] |
| Outcome or subgroup title | No. of studies | No. of participants | Statistical method | Effect size |
| 9.1 Number of children relapsing during therapy Show forest plot | 2 | Risk Ratio (M‐H, Random, 95% CI) | Totals not selected | |
| 9.1.1 Intermittent dose versus alternate‐day therapy (6 months therapy) | 1 | Risk Ratio (M‐H, Random, 95% CI) | Totals not selected | |
| 9.1.2 Daily versus intermittent therapy (2 months therapy) | 1 | Risk Ratio (M‐H, Random, 95% CI) | Totals not selected | |
| 9.2 Number of children with relapses by 9 to 12 months Show forest plot | 4 | Risk Ratio (M‐H, Random, 95% CI) | Totals not selected | |
| 9.2.1 Intermittent dose versus alternate‐day therapy (6 months therapy) | 1 | Risk Ratio (M‐H, Random, 95% CI) | Totals not selected | |
| 9.2.2 Single versus divided dose therapy (2 months therapy) | 1 | Risk Ratio (M‐H, Random, 95% CI) | Totals not selected | |
| 9.2.3 Intravenous versus oral therapy (6 months therapy) | 1 | Risk Ratio (M‐H, Random, 95% CI) | Totals not selected | |
| 9.2.4 Prolonged oral versus intermittent therapy (2 months therapy) | 1 | Risk Ratio (M‐H, Random, 95% CI) | Totals not selected | |
| 9.3 Mean time to relapse Show forest plot | 2 | Mean Difference (IV, Random, 95% CI) | Totals not selected | |
| 9.3.1 Single versus divided dose therapy (2 months therapy) | 1 | Mean Difference (IV, Random, 95% CI) | Totals not selected | |
| 9.3.2 Daily versus intermittent therapy (2 months therapy) | 1 | Mean Difference (IV, Random, 95% CI) | Totals not selected | |
| 9.4 Mean relapse rate/patient/year Show forest plot | 2 | Mean Difference (IV, Random, 95% CI) | Totals not selected | |
| 9.4.1 Single versus divided dose therapy (2 months therapy) | 1 | Mean Difference (IV, Random, 95% CI) | Totals not selected | |
| 9.4.2 Daily versus intermittent therapy (2 months therapy) | 1 | Mean Difference (IV, Random, 95% CI) | Totals not selected | |
| 9.5 Cumulative steroid dose Show forest plot | 1 | Mean Difference (IV, Random, 95% CI) | Totals not selected | |
| 9.6 Mean time to remission Show forest plot | 2 | 138 | Mean Difference (IV, Random, 95% CI) | 0.04 [‐0.98, 1.06] |
| 9.7 Serious adverse events Show forest plot | 2 | 138 | Risk Ratio (M‐H, Random, 95% CI) | 0.41 [0.18, 0.91] |
| Outcome or subgroup title | No. of studies | No. of participants | Statistical method | Effect size |
| 10.1 Time to remission with different prednisone doses Show forest plot | 2 | 79 | Mean Difference (IV, Random, 95% CI) | 0.71 [‐0.43, 1.86] |
| 10.2 Cumulative prednisone dose to achieve remission Show forest plot | 1 | Mean Difference (IV, Random, 95% CI) | Totals not selected | |
| 10.3 Number with relapse Show forest plot | 2 | 59 | Risk Ratio (M‐H, Random, 95% CI) | 0.66 [0.16, 2.68] |
| Outcome or subgroup title | No. of studies | No. of participants | Statistical method | Effect size |
| 11.1 Number of relapses in 12 months Show forest plot | 1 | Mean Difference (IV, Random, 95% CI) | Totals not selected | |
| 11.2 Adverse effects Show forest plot | 1 | Risk Ratio (M‐H, Random, 95% CI) | Totals not selected | |
| 11.2.1 Cushingoid facies | 1 | Risk Ratio (M‐H, Random, 95% CI) | Totals not selected | |
| 11.2.2 Cataracts | 1 | Risk Ratio (M‐H, Random, 95% CI) | Totals not selected | |
| Outcome or subgroup title | No. of studies | No. of participants | Statistical method | Effect size |
| 12.1 Relapse at 6 months Show forest plot | 2 | 146 | Risk Ratio (M‐H, Random, 95% CI) | 1.03 [0.71, 1.49] |
| 12.2 Adverse effects Show forest plot | 2 | Risk Ratio (M‐H, Random, 95% CI) | Subtotals only | |
| 12.2.1 Cushingoid features | 2 | 144 | Risk Ratio (M‐H, Random, 95% CI) | 1.16 [0.58, 2.32] |
| 12.2.2 Serious infections | 2 | 144 | Risk Ratio (M‐H, Random, 95% CI) | 0.58 [0.20, 1.66] |
| 12.2.3 Eye changes | 1 | 84 | Risk Ratio (M‐H, Random, 95% CI) | 0.52 [0.05, 5.57] |
| 12.2.4 Hypertension | 2 | 144 | Risk Ratio (M‐H, Random, 95% CI) | 0.28 [0.05, 1.73] |
| 12.3 Prednisone dose Show forest plot | 1 | Mean Difference (IV, Random, 95% CI) | Totals not selected | |
| 12.3.1 Induction dose | 1 | Mean Difference (IV, Random, 95% CI) | Totals not selected | |
| 12.3.2 Cumulative dose over 6 months | 1 | Mean Difference (IV, Random, 95% CI) | Totals not selected | |
| Outcome or subgroup title | No. of studies | No. of participants | Statistical method | Effect size |
| 13.1 Number with relapses Show forest plot | 1 | Risk Ratio (M‐H, Random, 95% CI) | Totals not selected | |
| 13.1.1 Relapse by 6 months | 1 | Risk Ratio (M‐H, Random, 95% CI) | Totals not selected | |
| 13.1.2 Relapse by 12 months | 1 | Risk Ratio (M‐H, Random, 95% CI) | Totals not selected | |
| 13.1.3 Relapse by 2 years | 1 | Risk Ratio (M‐H, Random, 95% CI) | Totals not selected | |
| 13.1.4 Relapse by 3 years | 1 | Risk Ratio (M‐H, Random, 95% CI) | Totals not selected | |
| 13.2 Relapse rate/patient/year Show forest plot | 1 | Mean Difference (IV, Random, 95% CI) | Totals not selected | |
| 13.2.1 Relapse rate at 1 year | 1 | Mean Difference (IV, Random, 95% CI) | Totals not selected | |
| 13.2.2 Relapse rate at 2 years | 1 | Mean Difference (IV, Random, 95% CI) | Totals not selected | |
| 13.2.3 Relapse rate at 3 years | 1 | Mean Difference (IV, Random, 95% CI) | Totals not selected | |
| 13.3 Number with FRNS or SDNS Show forest plot | 1 | Risk Ratio (M‐H, Random, 95% CI) | Totals not selected | |
| 13.4 Cumulative steroid dose Show forest plot | 1 | Mean Difference (IV, Random, 95% CI) | Totals not selected | |
| 13.4.1 After 1 year | 1 | Mean Difference (IV, Random, 95% CI) | Totals not selected | |
| 13.4.2 After 2 years | 1 | Mean Difference (IV, Random, 95% CI) | Totals not selected | |
| 13.4.3 After 3 years | 1 | Mean Difference (IV, Random, 95% CI) | Totals not selected | |
| 13.5 Adverse effects Show forest plot | 1 | Risk Ratio (M‐H, Random, 95% CI) | Totals not selected | |
| 13.5.1 Number with hypertension | 1 | Risk Ratio (M‐H, Random, 95% CI) | Totals not selected | |
| 13.5.2 Number with growth failure | 1 | Risk Ratio (M‐H, Random, 95% CI) | Totals not selected | |