Tratamiento corticosteroide para el síndrome nefrótico en niños
Resumen
Antecedentes
En el síndrome nefrótico se produce la filtración de proteínas de la sangre a la orina a través de los glomérulos, y esto causa hipoproteinemia y edema generalizado. Aunque la mayoría de los niños con síndrome nefrótico responde a los corticosteroides, el 80% presenta recaídas. Los corticosteroides han reducido la tasa de muerte a cerca de un 3%. Sin embargo, estos fármacos presentan efectos adversos potencialmente graves bien conocidos como la obesidad, el crecimiento deficiente, la hipertensión, la diabetes mellitus, la osteoporosis y los trastornos conductuales. Esta es una actualización de una revisión publicada por primera vez en 2000 y actualizada en 2002, 2005, 2007 y 2015.
Objetivos
El objetivo de esta revisión fue evaluar los efectos beneficiosos y perjudiciales de los diferentes regímenes de tratamiento con corticosteroides en niños con síndrome nefrótico sensible a los esteroides (SNSE). Los efectos beneficiosos y perjudiciales del tratamiento se estudiaron en dos grupos de niños: 1) niños con un episodio inicial de SNSE, y 2) niños que experimentan un curso recurrente del SNSE.
Métodos de búsqueda
Se realizaron búsquedas en el registro de estudios del Grupo Cochrane de Riñón y Trasplante hasta el 30 de mayo de 2020, mediante contacto con el documentalista y con el uso de términos de búsqueda relevantes para esta revisión. Los estudios en el registro se identifican mediante búsquedas en CENTRAL, MEDLINE y EMBASE, en actas de congresos, en el portal de búsqueda del International Clinical Trials Register (ICTRP), y en ClinicalTrials.gov.
Criterios de selección
Ensayos controlados aleatorizados (ECA) en niños (de un mes a 18 años de edad) en el episodio inicial o posterior de SNSE, que compararon diferentes duraciones, dosis totales u otras estrategias de dosis de cualquier agente corticosteroide.
Obtención y análisis de los datos
Dos autores de la revisión, de forma independiente, evaluaron el riesgo de sesgo y extrajeron los datos. Los resultados se presentaron como riesgos relativos (RR) o diferencias de medias (DM), con intervalos de confianza (IC) del 95%.
Resultados principales
En esta actualización de la revisión de 2020 se identificaron 16 nuevos estudios incluidos que proporcionaron un total de 48 estudios incluidos con 3941 participantes asignados al azar.
La metodología del riesgo de sesgo a menudo se llevó a cabo de manera deficiente, ya que sólo 25 y 22 estudios, respectivamente, se consideraron de bajo riesgo para la generación de secuencias aleatorias y la ocultación de la asignación. Solo nueve estudios (19%) presentaron un bajo riesgo de sesgo de realización (cegamiento de los participantes y el personal) y 11 estudios tuvieron un bajo riesgo de sesgo de detección (cegamiento de la evaluación de resultados). Nueve de estos estudios fueron ECA controlados con placebo. Veintidós estudios (menos del 50%) tuvieron un bajo riesgo de sesgo de desgaste y 23 estudios tuvieron un bajo riesgo de sesgo de notificación (notificación selectiva de resultados).
En siete estudios, que evaluaron a niños en su episodio inicial de SNSE y tuvieron un bajo riesgo de sesgo de selección, hay poca o ninguna diferencia en el número de niños con recaídas frecuentes cuando se comparan dos meses de prednisona con tres meses o más (RR 0,99, IC del 95%: 0,82 a 1,19; 585 participantes, cuatro estudios; I2 = 0%) o cuando se comparan tres meses con cinco a siete meses de tratamiento (RR 0,99, IC del 95%: 0,74 a 1,33; 376 participantes, tres estudios; I2 = 35%; evidencia de certeza alta). En el análisis de ocho estudios con riesgo de sesgo de selección bajo existe una diferencia pequeña o nula en el número de niños con recaída a los 12 a 24 meses cuando se compara prednisona durante dos meses con tres meses o más (RR 0,91, IC del 95%: 0,78 a 1,06; 637 participantes, cinco estudios, I2 = 47%) o cuando se hace la comparación entre tres meses y cinco a siete meses de tratamiento (RR 0,88, IC del 95%: 0,70 a 1,11; 377 participantes, tres estudios; I2 = 53%). Se observó poca o ninguna diferencia en los efectos adversos entre las diferentes duraciones del tratamiento.
Entre los niños con SNSE recidivante, dos estudios pequeños mostraron que el tiempo hasta la remisión no difirió entre las dosis de prednisona de 1 mg/kg en comparación con la dosis convencional de 2 mg/kg (DM 0,71 días, IC del 95%: ‐0,43 a 1,86; 79 participantes) y que la dosis total de prednisona administrada fue menor (DM ‐20,60 mg/kg, IC del 95%: ‐25,65 a ‐15,55; 20 participantes). Dos estudios encontraron poca o ninguna diferencia en el número con recaída a los seis meses cuando se comparó la dosis por peso con la dosis por superficie (RR 1,03; IC del 95%: 0,71 a 1,49; 146 participantes). Un estudio encontró un riesgo reducido de recaída con una dosis diaria baja en comparación con una dosis diaria alterna (MD ‐0,90 número de recaídas/año, IC del 95%: ‐1,33 a ‐0,47). Cuatro estudios encontraron que en los niños con enfermedades con recaídas frecuentes, la prednisona diaria durante las infecciones víricas redujo significativamente la tasa de recaídas, en comparación con la prednisona en días alternos o ningún tratamiento.
Conclusiones de los autores
Actualmente, hay cuatro estudios bien diseñados que asignaron al azar a 823 niños y que han demostrado claramente que prolongar el tratamiento con prednisona más allá de dos o tres meses en el primer episodio de SNSE no ofrece efectos beneficiosos. En estudios pequeños realizados en niños con recaídas en la enfermedad no se han identificado diferencias en los tiempos hasta la remisión utilizando la mitad de la dosis de inducción convencional de 2 mg/kg o 60 mg/m2. Es imperativo que se lleve a cabo un estudio mucho más amplio para confirmar estos hallazgos.
El tratamiento con una dosis más baja de prednisona administrada diariamente durante una infección de las vías respiratorias superiores u otra infección reduce el riesgo de recaída en comparación con la prednisona de días alternos continuos o la ausencia de prednisona, según cuatro estudios pequeños. Se esperan los resultados de un ECA mucho más amplio, en el que participaron más de 300 niños, para determinar la eficacia relativa y los efectos adversos del uso de la prednisona en días alternos, en comparación con la prednisona diaria, para prevenir la recaída en niños con infecciones concomitantes.
PICO
Resumen en términos sencillos
Tratamiento corticosteroide en niños con síndrome nefrótico
¿Cuál es el problema?
El síndrome nefrótico es una enfermedad en la que se produce el paso de proteínas de la sangre a la orina en los riñones. Cuando no se trata, los niños pueden sufrir infecciones graves. En la mayoría de los niños con síndrome nefrótico, esta filtración de proteínas se corrige con corticosteroides (prednisona, prednisolona) reduciendo el riesgo de una infección grave. Sin embargo, los niños generalmente presentan episodios repetidos, que suelen desencadenarse por infecciones víricas. Los corticosteroides pueden tener efectos secundarios graves en los niños, por lo que se debe saber cuál es la mejor manera de usarlos.
¿Qué se hizo?
Se consideró la evidencia de 48 estudios que asignaron al azar a 3941 niños. Catorce estudios en niños con su primer episodio del síndrome nefrótico evaluaron la prednisona durante dos o tres meses comparada con duraciones más largas. Trece estudios evaluaron diferentes regímenes de corticosteroides en niños que presentaban enfermedades con recaídas frecuentes (SNRF). Los estudios fueron de calidad variable y sólo alrededor de la mitad de los estudios presentó un riesgo bajo de sesgo produciendo resultados sesgados.
¿Qué se encontró?
En los estudios de alta calidad, no hubo diferencias en el riesgo de recaída ni en el número de niños que recaen con frecuencia entre la larga duración (tres a siete meses) y las duraciones más cortas (dos a tres meses) de la prednisona (evidencia de certeza alta). La administración de prednisona a diario en lugar de en días alternos durante una infección vírica puede reducir el número de niños que recaen. Dos estudios muy pequeños sugirieron que se pueden utilizar dosis más bajas de prednisona para lograr y mantener la remisión.
Conclusiones
Los niños con el primer episodio de síndrome nefrótico sólo necesitan prednisona durante dos o tres meses, ya que los cursos más largos no reducen el riesgo de recaída ni el riesgo de que el niño recaiga con frecuencia. Se necesita más información para determinar si la administración diaria de prednisona durante una infección reduce el riesgo de recaída. Se necesita un gran estudio para determinar si se pueden usar dosis más bajas de prednisona para tratar una recaída en niños con síndrome nefrótico.
Authors' conclusions
Summary of findings
| Steroid therapy in first episode of nephrotic syndrome: 3 months or more versus 2 months of therapy for nephrotic syndrome in children | |||||
| Patient or population: children with nephrotic syndrome | |||||
| Outcomes | Anticipated absolute effects* (95% CI) | Relative effect | No. of participants | Certainty of the evidence | |
|---|---|---|---|---|---|
| Assumed risk | Corresponding risk | ||||
| Risk with 2 months of therapy | Risk with 3 months or more of therapy | ||||
| Number with frequent relapses by 12 to 24 months | 450 per 1,000 | 387 per 1,000 | RR 0.86 | 976 (8) | ⊕⊕⊕⊝1 |
| Number of children relapsing by 12 to 24 months | 646 per 1,000 | 497 per 1,000 | RR 0.77 | 1309 (12) | ⊕⊕⊝⊝1,2 |
| Number with frequent relapses by 12 to 24 months stratified by risk of selection bias: Low risk of selection bias | 413 per 1,000 | 409 per 1,000 | RR 0.99 | 585 (4) | ⊕⊕⊕⊕ |
| Number with frequent relapses by 12 to 24 months stratified by risk of selection bias: Unclear or high risk of bias for allocation bias | 357 per 1,000 | 161 per 1,000 | RR 0.45 | 220 (3) | ⊕⊕⊝⊝ 1,2 |
| Adverse events: psychological disorders | 470 per 1,000 | 470 per 1,000 | RR 1.00 | 456 (4) | ⊕⊕⊝⊝2,3 |
| Adverse events: hypertension | 50 per 1,000 | 89 per 1,000 | RR 1.78 | 548 (7) | ⊕⊕⊕⊝ 1 |
| Adverse events: Cushing's syndrome | 402 per 1,000 | 450 per 1,000 | RR 1.12 | 547 (5) | ⊕⊕⊕⊝1 |
| *The risk in the intervention group (and its 95% CI) is based on the assumed risk in the comparison group and the relative effect of the intervention (and its 95% CI). | |||||
| GRADE Working Group grades of evidence | |||||
| 1 Significant heterogeneity between studies 2 Some studies at high or unclear risk of bias 3 Few studies included in analyses | |||||
| Steroid therapy in first episode of nephrotic syndrome: 5 to 7 months versus 3 months for nephrotic syndrome in children | |||||
| Patient or population: children with nephrotic syndrome | |||||
| Outcomes | Illustrative comparative risks* (95% CI) | Relative effect | No. of Participants | Quality of the evidence | |
|---|---|---|---|---|---|
| Assumed risk | Corresponding risk | ||||
| Risk with 3 months of therapy | Risk with 5 to 7 months of therapy | ||||
| Number with frequent relapses by 12 to 24 months | 387 per 1000 | 282 per 1000 | RR 0.73 | 706 (6) | ⊕⊕⊕⊝ |
| Number of children relapsing by 12 to 24 months | 696 per 1000 | 432 per 1000 | RR 0.62 | 762 (7) | ⊕⊕⊝⊝ |
| Subgroup analysis by risk of bias for number with frequent relapses: low risk of selection bias | 440 per 1000 | 436 per 1000 | RR 0.99 | 376 (3) | ⊕⊕⊕⊕ |
| Subgroup analysis by risk of bias for number with frequent relapses: Unclear or high risk of selection bias | 327 per 1000 | 157 per 1000 | RR 0.48 | 330 (3) | ⊕⊕⊕⊝ |
| Adverse events: hypertension | 126 per 1000 | 140 per 1000 | RR 1.11 | 752 (6) | ⊕⊕⊕⊝ |
| Adverse events: eye complications | 36 per 1000 | 17 per 1000 | RR 0.46 | 614 | ⊕⊕⊕⊝ |
| Adverse events: Cushingoid appearance | 375 per 1000 | 323 per 1000 | RR 0.86 | 762 (6) | ⊕⊕⊕⊝ |
| Adverse events: psychological disorders | 53 per 1000 | 16 per 1000 | RR 0.30 | 505 (4) | ⊕⊕⊝⊝ |
| *The basis for the assumed risk (e.g. the median control group risk across studies) is provided in footnotes. The corresponding risk (and its 95% CI) is based on the assumed risk in the comparison group and the relative effect of the intervention (and its 95% CI). | |||||
| GRADE Working Group grades of evidence | |||||
| 1 Significant heterogeneity between studies 2 Some studies at high or unclear risk of bias 3 Few studies included in analyses | |||||
Background
Description of the condition
Nephrotic syndrome is the most common acquired childhood kidney disease. The characteristic features, including oedema, proteinuria and hypoalbuminaemia, result from alterations of the perm‐selectivity barrier of the glomerular capillary wall.
The reported incidence is 2 to 7/100,000 children, with a prevalence of 16/100,000 (Eddy 2003). There are marked differences in the incidence of nephrotic syndrome depending on ethnicity with proportions ranging from 1.15 to 16.9/100,000 children with the highest incidence in children from south Asia (Noone 2018). Most children have minimal change disease, in which changes on light microscopy are minor or absent and respond to corticosteroid agents. The histological variant seen and the response to immunosuppressive treatment varies with ethnicity (Eddy 2003). Steroid‐sensitive nephrotic syndrome (SSNS) is less common in African and African‐American children, and in South Africa only 7.2% of 236 African children had SSNS compared with 62% of 286 Indian children (Bhimma 1997). The pathogenesis of SSNS remains unknown but appears to be related to abnormalities in T‐cell and B‐cell regulation leading to injury of the podocyte, a key component of the glomerular filtration barrier.
About 80% of children who respond to corticosteroids experience a relapsing course with recurrent episodes of oedema and proteinuria (Koskimies 1982; Tarshish 1997). The complications of nephrotic syndrome are related to effects of the disease itself, and to adverse effects related to corticosteroid therapy and to corticosteroid sparing agents. Children with nephrotic syndrome are at increased risk of bacterial infection (characteristically resulting in peritonitis, cellulitis, or septicaemia), thromboembolic phenomena, protein calorie malnutrition, and acute kidney injury. Before antibiotics became available, two thirds of children with nephrotic syndrome died. Death rates fell to 35% with the introduction of sulphonamides and penicillin (Arneil 1971) and fell further with the use of corticosteroid medications (Arneil 1956).
Description of the intervention
Corticosteroids have been used to treat childhood nephrotic syndrome since 1950 when large doses of adrenocorticotrophic hormone (ACTH) and cortisone given for two to three weeks were found to induce diuresis with loss of oedema and proteinuria (Arneil 1956, Arneil 1971). Corticosteroid usage has reduced the death rate in childhood nephrotic syndrome to around 3%, with infection remaining the most important cause of death (ISKDC 1984). Of children who present with their first episode of nephrotic syndrome, approximately 80% will achieve remission with corticosteroid therapy (Koskimies 1982). Because of this dramatic before‐after treatment evidence, oral corticosteroids are the first‐line treatment of a child presenting with idiopathic nephrotic syndrome and no randomised controlled prospective studies of corticosteroids compared to placebo were carried out. The achievement of remission with corticosteroid therapy determines long term prognosis for kidney function irrespective of kidney histology (Niaudet 2009). However, corticosteroids have well documented adverse effects in children. Major complications related to prolonged corticosteroid use in nephrotic syndrome include growth impairment, particularly with steroid therapy administered daily (Hyams 1988), cataracts (Aydin 2019; Ng 2001), arterial hypertension (Aydin 2019) and excessive weight gain or obesity (Ruth 2005). Two studies (Mishra 2010; Neuhaus 2010) highlight the impact of psychological and behavioural abnormalities related to corticosteroid therapy. Anxiety, depression, emotional lability, aggressive behaviour and attention problems had already developed with completion of 12 weeks of therapy (Mishra 2010). Neuhaus 2010 demonstrated that family background, particularly maternal distress, reduced the quality of life and psychosocial adjustment. Patients and families report challenges in living with the disease because the condition is poorly understood and the clinical course is uncertain (Beanlands 2017). Adverse effects are particularly prevalent in those children who relapse frequently and require multiple courses of corticosteroids.
How the intervention might work
Glucocorticoids are potent anti‐inflammatory and immunosuppressant drugs. The effects of glucocorticoids are known to be mediated by both genomic and non‐genomic mechanisms (Schijvens 2019). It is widely believed the main effect is through the regulation of nuclear gene expression via the cytosolic glucocorticoid receptor, which activates genes for anti‐inflammatory cytokines and suppresses genes for pro‐inflammatory cytokines (Kadmiel 2013; Kirshcke 2014; Ponticelli 2018). Glucocorticoids are lipid soluble and can easily pass through cell membranes. This process takes several hours. More recently research had identified corticosteroid effects, which are independent of nuclear gene transcription and occur earlier (Ramamoorthy 2016). These are mediated via interactions of various kinases with cytosolic or membrane‐bound glucocorticoid receptors and do not require protein synthesis. At high glucocorticoid doses, suppression of T‐cell function occurs. Corticosteroids also act directly to stabilise the podocyte cytoskeleton (Guess 2010; Ohashi 2011).
Why it is important to do this review
The original treatment schedules for childhood nephrotic syndrome were developed in an ad hoc manner more than 50 years ago. The International Study of Kidney Disease in Children (ISKDC) was established in 1966 and determined by consensus a regimen of daily corticosteroids for four weeks followed by corticosteroids given on three consecutive days out of seven for four weeks (Arneil 1971). Since then, many physicians have used regimens involving periods of daily followed by alternate‐day or intermittent therapy and RCTs have investigated different durations and total corticosteroid therapy doses in an effort to delineate the optimal doses and durations of corticosteroid therapy balancing efficacy and toxicity. These have been evaluated in previous versions of this systematic review. However, despite these data, there remains no consensus on the most appropriate corticosteroid regimen to achieve and maintain remission with the least adverse effects. Observational data (Raja 2017) and very small RCTs (Borovitz 2020; Sheikh 2019) suggest that children can be successfully treated with smaller doses and durations of corticosteroid therapy. Therefore, the 2020 update of this review has been undertaken to identify whether new RCTs, which evaluate different corticosteroid regimens in the initial episode of SSNS and in relapsing disease, provide additional information on the most effective corticosteroid therapy for steroid sensitive nephrotic syndrome in children.
Objectives
The aim of this review was to assess the benefits and harms of different corticosteroid regimens in children with SSNS. The benefits and harms of therapy were studied in two groups of children:
-
Children in their initial episode of SSNS
-
Children who experience a relapsing course of SSNS.
Methods
Criteria for considering studies for this review
Types of studies
All RCTs and quasi‐RCTs were included in which different doses, dose strategies, routes of administration and durations of treatment with prednisone, prednisolone or other corticosteroid agent are compared in the treatment of SSNS in children.
Types of participants
Inclusion criteria
Children aged one to 18 years with SSNS (i.e. become oedema free with urine protein ≤ 1+ on dipstick, urinary protein/creatinine ratio ≤ 20 mg/mmol or ≤ 4 mg/m2/hour for three consecutive days while receiving corticosteroid therapy). A kidney biopsy diagnosis of minimal change disease was not required for inclusion of the study.
-
Children with initial episode of SSNS
-
Children with relapsing SSNS
Exclusion criteria
-
Children with steroid‐resistant nephrotic syndrome (failure to achieve remission following four weeks or more of prednisone at 60 mg/m2/day) or congenital or infantile nephrotic syndrome
-
Children with other kidney or systemic forms of nephrotic syndrome defined on kidney biopsy, clinical features or serology (e.g. idiopathic membranous glomerulonephritis, mesangiocapillary glomerulonephritis, post‐infectious glomerulonephritis, Henoch‐Schönlein nephritis, systemic lupus erythematosus)
Types of interventions
Prednisone, prednisolone, or other corticosteroid medication given orally or intravenously. The following aspects of the corticosteroid regimens were considered.
-
Shorter duration compared with two months of corticosteroid treatment
-
Longer durations compared with three months or more of corticosteroid treatment
-
Comparisons of different doses of corticosteroid medication given for induction of a remission
-
Comparisons of other regimens of corticosteroid therapy
-
Different corticosteroid agents (e.g. deflazacort, methylprednisolone) compared with standard agents (e.g. prednisone, prednisolone)
-
Comparisons of daily, alternate‐day or intermittent administration of corticosteroid medication. Intermittent administration refers to the administration of corticosteroids on three consecutive days of seven days
-
Single daily dose compared with divided daily doses of corticosteroid medication.
Types of outcome measures
Primary outcomes
-
The numbers of children with and without relapse at 12 months or more after completion of treatment.
-
The number of children who developed frequently relapsing nephrotic syndrome (FRNS).
Secondary outcomes
-
Mean relapse rates
-
Serious adverse events including reduced growth rates, hypertension, cataracts/glaucoma, psychological disorders, infections, thromboses and osteoporosis
-
Cumulative corticosteroid dosage
Search methods for identification of studies
Electronic searches
We searched the Cochrane Kidney and Transplant Register of Studies up to 30 May 2020 through contact with the Information Specialist using search terms relevant to this review. The Register contains studies identified from the following sources.
-
Monthly searches of the Cochrane Central Register of Controlled Trials (CENTRAL)
-
Weekly searches of MEDLINE OVID SP
-
Searches of kidney and transplant journals, and the proceedings and abstracts from major kidney and transplant conferences
-
Searching of the current year of EMBASE OVID SP
-
Weekly current awareness alerts for selected kidney and transplant journals
-
Searches of the International Clinical Trials Register (ICTRP) Search Portal and ClinicalTrials.gov.
Studies contained in the Register are identified through searches of CENTRAL, MEDLINE, and EMBASE based on the scope of Cochrane Kidney and Transplant. Details of search strategies, as well as a list of handsearched journals, conference proceedings and current awareness alerts, are available on the Cochrane Kidney and Transplant website.
See Appendix 1 for search terms used in strategies for this review.
Searching other resources
-
Reference lists of review articles, relevant studies, and clinical practice guidelines.
-
Contacting relevant individuals/organisations seeking information about unpublished or incomplete studies.
-
Conference proceedings of meetings of the International Pediatric Nephrology Association and European Society for Paediatric Nephrology.
Data collection and analysis
Selection of studies
The initial review was undertaken by four authors. The titles and abstracts were screened by two authors who discarded studies that were not relevant (i.e. studies of lipid lowering agents) although studies and reviews that could have included relevant data or information on studies were retained initially. Three authors independently assessed abstracts, and if necessary, the full text, to determine which studies satisfied the characteristics required for inclusion. Updates in 2003, 2005, 2007 and 2015 were undertaken by three or four authors (DH, EH, NW, JC). The 2020 update was undertaken by three reviewers (DH, SS, EH) with final review by two other reviewers (NW and JC).
Data extraction and management
Data extraction and assessment of risk of bias were performed by two authors using standardised data extraction forms. Studies in languages other than English were translated before data extraction. Where more than one report of a study was identified, data were extracted from all reports. Where there were discrepancies between reports, data from the primary source was used. Study authors were contacted for additional information about studies where possible.
Assessment of risk of bias in included studies
For this update, the following items were assessed independently by two authors using the risk of bias assessment tool (Higgins 2011) (see Appendix 2).
-
Was there adequate sequence generation (selection bias)?
-
Was allocation adequately concealed (selection bias)?
-
Was knowledge of the allocated interventions adequately prevented during the study?
-
Participants and personnel (performance bias)
-
Outcome assessors (detection bias)
-
-
Were incomplete outcome data adequately addressed (attrition bias)?
-
Are reports of the study free of suggestion of selective outcome reporting (reporting bias)?
-
Was the study apparently free of other problems that could put it at a risk of bias?
Measures of treatment effect
For dichotomous outcomes (relapse or no relapse, side effects) the risk ratio (RR) for individual studies were calculated and summary statistics estimated using the random effects model and results compared to those obtained using a fixed effects model. Where continuous scales of measurement were used to assess the effects of treatment (cumulative steroid therapy, relapse rate), these data were analysed as the mean difference (MD) or standardised mean difference (SMD) if different scales had been used. The time to relapse was not included since many children did not experience relapse so the data would be biased.
Unit of analysis issues
Data from cross‐over studies were included in the meta‐analyses if separate data for the first part of the study were available. Otherwise results of cross‐over studies were reported in the text only.
Dealing with missing data
We aimed to analyse available data in meta‐analyses using ITT data. However, where ITT data were not provided, or additional information could not be obtained from authors, available published data were used in the analyses.
Assessment of heterogeneity
We first assessed the heterogeneity by visual inspection of the forest plot. We then quantified statistical heterogeneity using the I2 statistic, which describes the percentage of total variation across studies that is due to heterogeneity rather than sampling error (Higgins 2003). A guide to the interpretation of I2 values is as follows.
-
0% to 40%: might not be important
-
30% to 60%: may represent moderate heterogeneity
-
50% to 90%: may represent substantial heterogeneity
-
75% to 100%: considerable heterogeneity.
The importance of the observed value of I2 depends on the magnitude and direction of treatment effects and the strength of evidence for heterogeneity (e.g. P‐value from the Chi2 test, or a confidence interval for I2) (Higgins 2011).
Assessment of reporting biases
The search strategy used aimed to reduce publication bias caused by lack of publication of studies with negative results. Where there were several publications on the same study, all reports were reviewed to ensure that all details of methods and results were included to reduce the risk of selective outcome reporting bias.
Data synthesis
Data were combined using random effects model for dichotomous and continuous data.
Subgroup analysis and investigation of heterogeneity
Subgroup analysis was used to investigate between study differences based on risk of bias, differences between definitions of FRNS and different durations of treatment in the experimental group in studies of initial treatment with different durations of prednisone.
Sensitivity analysis
Where a single study differed considerably from the other studies in the meta‐analysis, this study was temporarily excluded to determine whether its removal altered the results of the meta‐analysis.
Summary of findings and assessment of the certainty of the evidence
We presented the main results of the review in 'Summary of findings' tables. These tables present key information concerning the quality of the evidence, the magnitude of the effects of the interventions examined, and the sum of the available data for the main outcomes (Schunemann 2011a). The 'Summary of findings' tables also include an overall grading of the evidence related to each of the main outcomes using the GRADE (Grades of Recommendation, Assessment, Development and Evaluation) approach (GRADE 2008; GRADE 2011). The GRADE approach defines the quality of a body of evidence as the extent to which one can be confident that an estimate of effect or association is close to the true quantity of specific interest. The quality of a body of evidence involves consideration of within‐trial risk of bias (methodological quality), directness of evidence, heterogeneity, precision of effect estimates and risk of publication bias (Schunemann 2011b). We presented the following outcomes in the 'Summary of findings' tables.
Outcomes included in Summary of Findings Tables
-
Number with relapse
-
Number with frequent relapse (total and stratified for risk of bias)
-
Adverse effects (psychological disturbances, hypertension, Cushing's Syndrome, eye complications)
Results
Description of studies
Results of the search
Search results are shown in Figure 1.
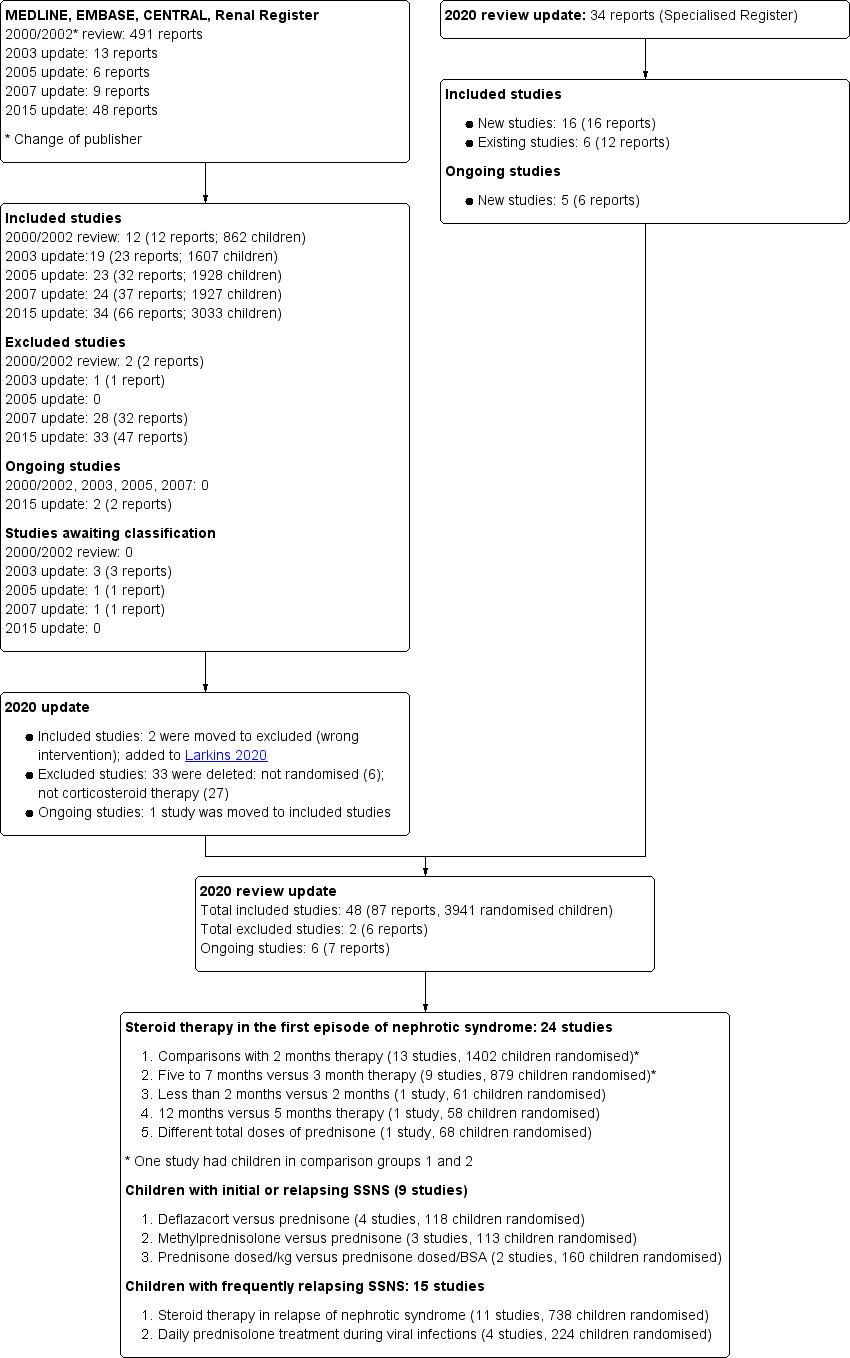
Study flow diagram.
For the 2020 update, our search (to 30 May 2020) identified 34 new reports. After full‐text review, 14 new included studies were identified (16 reports); one previous ongoing study has now been included. In addition, 12 new reports of six existing studies were identified. Two studies (APN 2006; Zhang 2014), which evaluated non‐corticosteroid agents with prednisone in the initial episode of SSNS, have been transferred to the Cochrane review evaluating non‐corticosteroid agents in SSNS (Larkins 2020) so that this review now only includes studies assessing corticosteroids. No other new excluded studies were identified. Five new ongoing studies were identified (CTRI/2015/11/006345; CTRI/2018/05/013634; CTRI/2018/05/014075; RESTERN 2017; Sinha 2016) and one study (PREDNOS 2 2014) identified in Hahn 2015 is continuing.
For the search results of our previous reviews please see (Hodson 2002; Hodson 2003; Hodson 2005; Hodson 2007; Hahn 2015).
Included studies
The 48 included studies randomised/analysed 3941/3659 children and were divided into groups according to the comparisons of corticosteroid regimens. Most studies used prednisone or prednisolone. For ease of reading, the term "prednisone" has been used in the text for both medications.
Three months or more versus two months therapy in the initial episode of SSNS (13 studies; 1465 randomised children)
Thirteen studies (APN 1993; Bagga 1999; Jayantha 2002a; Ksiazek 1995 (Groups 1 and 3); Moundekhel 2012; Norero 1996; Paul 2014; PREDNOS 2019; PREDNOS PILOT 2019; Satomura 2001; Ueda 1988; Yoshikawa 1998; Yoshikawa 2015) compared durations of two months with three months or more of prednisone therapy. In all of these studies except Satomura 2001, increased duration of treatment resulted in increased total prednisone dose compared with the control group. Satomura 2001 compared three months of treatment with two months using the same total dose of prednisone in each group. In Ksiazek 1995, which compared three different regimens, data from the two month therapy group (Group 3) and the group treated for six months (group 1) were included in the meta‐analysis. Norero 1996 excluded those children who became steroid dependent. In this update, Yoshikawa 1998, which compared two months of prednisone with 4.5 months with both groups received the Chinese herb, Sairei‐to, was included in this analysis on the assumption that the effect of the herb would be the same in both treatment groups. Data from Paul 2014 could not be included in meta‐analyses because of differential loss to follow up, with loss to follow up of 15/47 children (33%) in the 12‐week treatment group compared with 6/46 children (13%) in the 8‐week treatment group.
Five to seven months versus three months therapy in the initial episode of SSNS (nine studies; 992 randomised children)
Nine studies (Al Talhi 2018; Anand 2013; Hiraoka 2003; Ksiazek 1995 (Groups 1 and 2); Mishra 2012, Pecoraro 2003; Sharma 2002; Sinha 2015; Teeninga 2013) compared five to seven months with three months of prednisone therapy. One study including 60 children (Anand 2013) did not report the numbers of children treated in each group so data from only eight studies could be included in the meta‐analyses. Increased duration of prednisone treatment led to increased total prednisone dose compared with the three month group in all studies except Teeninga 2013, who compared three months with six months therapy, using the same total dose of prednisone in both groups. From Ksiazek 1995, data from the experimental groups treated for three months (group 2) and six months (group 1) were included in this analysis. Pecoraro 2003 included three groups ‐ a control group treated for three months and two experimental groups treated for six months with different total doses of prednisone. Only the control group and treatment group 1 (total prednisone dose 5235 mg/m2) were included in the meta‐analysis.
Daily prednisone treatment during viral infections in children with relapsing or initial episode of SSNS (four studies; 224 randomised children)
Three studies (Abeyagunawardena 2008; Gulati 2011; Mattoo 2000) compared daily with alternate‐day prednisone to prevent relapse during viral infections in children with SSNS receiving alternate‐day prednisone. One study (Abeyagunawardena 2014) compared daily prednisone with placebo to prevent relapse during upper respiratory tract viral infections in children not receiving prednisone.
Deflazacort versus prednisone therapy in children with relapsing or initial episode of SSNS (four studies; 118 randomised children)
Four studies explored different regimens of deflazacort versus prednisone.
-
Agarwal 2010 compared deflazacort with prednisone in children with the initial episode of SSNS but the details of the intervention were not reported
-
Broyer 1997 compared deflazacort with an equivalent dose of prednisone with reducing doses over 12 months in children with steroid dependent SSNS
-
Liern 2008 compared deflazacort with methylprednisolone for 12 weeks in children with relapsing SSNS in a cross over study
-
Singhal 2015 compared deflazacort with prednisone for 12 weeks in children with the initial episode of SSNS
Oral methylprednisolone regimens in children with the initial episode of SSNS (three studies; 113 randomised children)
Three studies compared different regimens of methylprednisolone with prednisone
-
Imbasciati 1985 compared six months of treatment commencing with methylprednisolone with prednisone with six months of prednisone
-
Mocan 1999 compared 14 days of high dose methylprednisolone with six months of prednisone
-
Zhang 2007d compared six months of treatment involving methylprednisolone with six months of prednisone. The details of interventions were not reported.
One month therapy versus two months of therapy in the initial episode of SSNS (one study; 61 randomised children)
-
APN 1988 compared less than two months of prednisone with two months.
Five months versus 12 months therapy in the initial episode of SSNS (one study; 58 randomised children)
-
Kleinknecht 1982 compared five months of prednisone with 12 months; the timing of the follow‐up period in relation to the duration of initial therapy was not stated.
Different total doses of prednisone given for three months in the initial episode of SSNS (one study; 68 randomised children)
-
Hiraoka 2000 compared a higher dose versus a conventional dose of prednisone given for three months.
Alternate‐day therapy versus intermittent therapy in relapsing SSNS (one study; 64 randomised children)
-
APN 1981 compared an alternate‐day prednisone regimen with three out of seven day regimen to maintain remission.
Daily therapy versus intermittent therapy in relapsing SSNS (one study; 64 randomised children)
-
ISKDC 1979 compared a daily prednisone regimen with a 3 out of 7 day regimen to maintain remission.
Single daily doses versus multiple daily doses in relapsing nephrotic syndrome (two studies; 150 randomised children)
Low versus conventional dose prednisone in relapsing nephrotic syndrome (three studies; 130 randomised children)
-
Borovitz 2020 compared two reduced doses (1 mg/kg/day; 1.5 mg/kg/day) with conventional dose prednisone 2 mg/kg/day to achieve remission
-
Sheikh 2019 compared reduced dose (1 mg/kg/day) of prednisone with conventional dose (2 mg/kg/day) to achieve remission
-
Kansal 2019 compared different alternate‐day prednisone doses in the second month of initial treatment to maintain remission
Daily versus alternate‐day prednisone in relapsing nephrotic syndrome (one study; 62 randomised children)
-
Yadav 2019 compared daily with alternate‐day prednisone for one year in children with frequently relapsing SSNS
Weight‐based versus body surface area‐based dosing of prednisone in the initial episode of SSNS (two studies; 160 randomised children)
-
Two studies (Basu 2020; Raman 2016) compared weight‐based dosing with body surface area‐based dosing in children with their initial episode of SSNS and with relapse of SSNS.
Alternate‐day prednisone for four weeks versus eight week weaning regimen in relapsing nephrotic syndrome (one study; 126 randomised children)
-
PROPINE 2018 compared four weeks of alternate‐day prednisone with an eight week weaning regimen using the same cumulative prednisone dose. The authors reported that the probability of remission at one year was similar between groups.
Three months or more versus two months therapy in relapsing nephrotic syndrome (one study; 129 randomised children)
-
Jayantha 2002b compared two months of prednisone with seven months in children with relapsing nephrotic syndrome.
Addition of cortisol to prednisone regimen compared with no cortisol addition in relapsing nephrotic syndrome (one cross‐over study: 13 randomised children)
-
Leisti 1978 compared the addition of cortisol supplementation with no cortisol In children with relapsing nephrotic syndrome and a subnormal response to 2 hour ACTH test 1 to 12 days after completing prednisone,
Excluded studies
In the 2015 review (Hahn 2015), we excluded 33 studies (47 reports) after full text assessment for this review. Of these 33 excluded studies, six were not RCTs and 27 were RCTs involving non‐corticosteroid interventions in children with SSNS. In the 2020 review these studies have been removed. In addition, two studies previously included (APN 2006; Zhang 2014) were excluded from this review and transferred to the Cochrane review of "Non‐corticosteroid interventions in children with steroid sensitive nephrotic syndrome" (Larkins 2020).
Risk of bias in included studies
Risk of bias assessments were performed using Cochrane's risk of bias assessment tool (Appendix 2). Summaries of risk of bias assessments are shown in Figure 2; Figure 3.

Risk of bias graph: review authors' judgements about each risk of bias item presented as percentages across all included studies.

Risk of bias summary: review authors' judgements about each risk of bias item for each included study.
Allocation
Random sequence generation was considered at low risk of bias in 25 studies (Abeyagunawardena 2008; Abeyagunawardena 2014; Agarwal 2010; APN 1993; Bagga 1999; Basu 2020; Broyer 1997; Gulati 2011; Hiraoka 2003; Imbasciati 1985; Jayantha 2002a; Jayantha 2002b; Kleinknecht 1982; Liern 2008; Mishra 2012; PREDNOS 2019; PREDNOS PILOT 2019; Raman 2016; Sharma 2002; Singhal 2015; Sinha 2015; Teeninga 2013; Yadav 2019; Yoshikawa 1998; Yoshikawa 2015) and high risk in seven studies (Borovitz 2020; Li 1994; Mattoo 2000; Mocan 1999; Moundekhel 2012; Pecoraro 2003; Satomura 2001). Sequence generation methods was assessed as unclear in the remaining 16 studies.
Allocation concealment was considered to be at low risk of bias in 22 studies (Abeyagunawardena 2008; Abeyagunawardena 2014; Al Talhi 2018; APN 1981; APN 1988; APN 1993; Bagga 1999; Basu 2020; Broyer 1997; Gulati 2011; Hiraoka 2003; Imbasciati 1985; Kleinknecht 1982; Liern 2008; PREDNOS 2019; PREDNOS PILOT 2019; Raman 2016; Sinha 2015; Teeninga 2013; Yadav 2019; Yoshikawa 1998; Yoshikawa 2015) and at high risk of bias in nine studies (Borovitz 2020; Ksiazek 1995; Li 1994; Mattoo 2000; Mocan 1999; Moundekhel 2012; Norero 1996; Pecoraro 2003; Satomura 2001). Ksiazek 1995 stated that parents could influence which treatment group their child was assigned. Allocation concealment methods was assessed as unclear in the remaining 17 studies.
Blinding
Nine studies were considered to be at low risk of performance and detection bias because they were placebo controlled studies (Abeyagunawardena 2008; Abeyagunawardena 2014; Broyer 1997; Leisti 1978; Liern 2008; PREDNOS 2019; PREDNOS PILOT 2019; Sinha 2015; Teeninga 2013). Basu 2020 and Yoshikawa 2015 was open‐label studies so at high risk of performance bias but were at low risk of detection bias. Kansal 2019 was assessed as unclear risk for both performance and detection bias. The remaining studies were at high risk of both performance and detection bias. Most studies reported the primary outcome of relapse using the ISKDC definition of relapse (ISKDC 1970).
Incomplete outcome data
We assessed 22 studies to be at low risk of attrition bias because they reported fewer than 10% of participants lost to follow‐up or excluded from analysis (Al Talhi 2018; APN 1993; Bagga 1999; Basu 2020; Borovitz 2020; Broyer 1997; Hiraoka 2000; Hiraoka 2003; Imbasciati 1985; Ksiazek 1995; Leisti 1978; Mattoo 2000; Mishra 2012; PREDNOS 2019; PREDNOS PILOT 2019; Raman 2016; Sheikh 2019; Singhal 2015; Sinha 2015; Teeninga 2013; Yadav 2019; Yoshikawa 2015). Fifteen studies were considered at high risk of attrition bias because more than 10% of participants were lost to follow‐up or excluded from the analysis (Abeyagunawardena 2008; Abeyagunawardena 2014; APN 1981; APN 1988; Ekka 1997; Gulati 2011; ISKDC 1979; Jayantha 2002a; Jayantha 2002b; Mocan 1999; Norero 1996; Paul 2014; PROPINE 2018; Sharma 2002; Yoshikawa 1998). The remaining 11 studies were considered to be unclear risk of attrition bias.
Selective reporting
Studies were deemed to be at risk of reporting bias if outcome data did not include one or more outcomes of FRNS, relapse rate and adverse events. Studies were also considered to be at high risk of bias if data were provided in a format, which could not be entered into the meta‐analyses. Cross‐over studies were considered to be at high risk of bias if data from the first and second parts of the study were not separable. Twenty‐three studies were at low risk of reporting bias (Al Talhi 2018; APN 1981; APN 1993; Bagga 1999; Basu 2020; Broyer 1997; Ekka 1997; Gulati 2011; Hiraoka 2000; Hiraoka 2003; Imbasciati 1985; Jayantha 2002a; Norero 1996; PREDNOS 2019; PREDNOS PILOT 2019; Sharma 2002; Sheikh 2019; Singhal 2015; Sinha 2015; Teeninga 2013; Yadav 2019; Yoshikawa 2015; Ueda 1988). There were 19 studies at high risk of selective reporting bias (Abeyagunawardena 2008; Abeyagunawardena 2014; APN 1988; Borovitz 2020; ISKDC 1979; Jayantha 2002b; Kleinknecht 1982; Ksiazek 1995; Leisti 1978; Li 1994; Liern 2008; Mattoo 2000; Mocan 1999; Moundekhel 2012; Paul 2014; Pecoraro 2003; PROPINE 2018; Raman 2016; Yoshikawa 1998). The remaining six studies were at unclear risk of selective reporting bias.
Other potential sources of bias
Fifteen studies were considered at low risk of potential bias as they were funded by educational or philanthropic organisations or stated that they received no funding (Abeyagunawardena 2008; APN 1981; APN 1988; Bagga 1999; Basu 2020; Gulati 2011; Leisti 1978; Norero 1996; PREDNOS 2019; PREDNOS PILOT 2019; Sinha 2015; Teeninga 2013; Ueda 1988; Yadav 2019; Yoshikawa 2015). One study was considered to be at high risk of bias as it was funded by industry and no full‐text publication has been identified 10 years after the first conference abstract (Pecoraro 2003). The remaining 32 studies were deemed unclear of other risk of bias as no information on funding sources was provided.
In Ueda 1988 the calculated total protocol dose (4620 mg/m2) exceeded the dose administered (3132 ± 417 mg/m2) suggesting that the protocol was not adhered to in all patients. In three studies (Jayantha 2002a; Ksiazek 1995; Ueda 1988) the numbers of children in the treatment and control groups differed markedly.
Effects of interventions
See: Summary of findings 1 Steroid therapy in first episode of nephrotic syndrome: 3 months or more versus 2 months of therapy for nephrotic syndrome in children; Summary of findings 2 Steroid therapy in first episode of nephrotic syndrome: five to seven months versus three months for nephrotic syndrome in children
Three months or more versus two months therapy in the initial episode of SSNS
-
Therapy for three months or more probably makes little or no difference to the number of children with frequent relapses by 12 to 24 months compared to two months of therapy (Analysis 1.1: RR 0.86, 95% CI 0.71 to 1.06; 976 participants, 8 studies; I2 = 33%; moderate certainty of evidence).
-
Therapy for three months or more may reduce the number of children relapsing by 12 to 24 months (Analysis 1.2: RR 0.77, 95% CI 0.63 to 0.95; 1309 participants, 12 studies; I2 = 77%; low certainty of evidence).
-
In subgroups of studies at low risk of selection bias, there is little or no difference in the number with frequent relapses between the two groups (Analysis 1.3.1: RR 0.99, 95% CI 0.82 to 1.19; 585 participants; 4 studies; I2 = 0%) or the number of children relapsing by 12 to 24 months (Analysis 1.4.1: RR 0.91, 95% CI 0.78 to 1.06; 637 participants; 5 studies; I2 = 47%) (high certainty of evidence).Figure 4
-
In contrast, in subgroups of studies at unclear or high risk of selection bias, longer duration of prednisone therapy probably reduces the number of children with frequent relapses (Analysis 1.3.2: RR 0.45, 95% CI 0.26 to 0.77; 220 participants, 3 studies; I2 = 0%) (moderate certainty evidence) or the number of children relapsing by 12 to 24 month (Analysis 1.4.2: RR 0.69, 95% CI 0.49 to 0.98; 471 participants, 6 studies; I2 = 72%).
-
Similar differences in results were shown when data were stratified according to risk of bias for detection and performance bias or for attrition bias (data not shown).
-
There may be little or no difference in adverse events between the two groups (Analysis 1.5) (low or moderate certainty of evidence). In Yoshikawa 2015, results were reported as events not patients so could not be included in the meta‐analyses. The authors reported that frequency and severity of adverse events were similar in both groups.

Forest plot of comparison: 1 Steroid therapy in first episode: ≥ 3 months versus 2 months therapy, outcome: 1.3 Number with frequent relapses by 12 to 24 months stratified by risk of bias for selection bias.
Results were downgraded for medium to high levels of heterogeneity between studies and for risk of bias issues (summary of findings Table 1).The heterogeneity between studies was explained by the risk of bias issues (Analysis 1.3.1 and Analysis 1.3.2, and Analysis 1.4.1 and Analysis 1.4.2) but not by inclusion/exclusion of patients with steroid‐dependent disease, different durations of prednisone (two months versus three months or more) or different definitions of FRNS (ISKDC definition compared with other definitions) (Data not shown in 2020 update).
Five to seven months versus three months therapy in the initial episode of SSNS
-
Five to seven months of therapy probably makes little or no difference to the number of children with frequent relapses by 12 to 24 months compared to three months of therapy (Analysis 2.1: RR 0.73, 95% CI 0.49 to 1.09; 707 participants, 6 studies; I2 = 68%; moderate certainty of evidence).
-
Five to seven months of therapy may reduce the number of children relapsing by 12 to 24 months compared to three months of therapy (Analysis 2.2: RR 0.62, 95% CI 0.45 to 0.85; 763 participants, 7 studies; I2 = 83%; low certainty of evidence).
-
In subgroups of studies at low risk of selection bias there is little or no difference in the number with frequent relapses (Analysis 2.3.1: RR 0.99, 95% CI 0.74 to 1.33; 376 participants, 3 studies; I2 = 35%; high certainty of evidence) or in the number relapsing by 12 to 24 months (Analysis 2.4.1 (RR 0.88, 95% CI 0.69 to 1.11; 376 participants, 3 studies; I2 = 53%).Figure 5
-
In contrast, in subgroups of studies at high or unclear risk of selection bias, five to seven months therapy probably reduces the risk of FRNS (Analysis 2.3.2: RR 0.48, 95% CI 0.32 to 0.72; 330 participants, 3 studies; I2 = 0% moderate certainty of evidence) or in the number relapsing by 12 to 24 months (Analysis 2.4.2: RR 0.47, 95% CI 0.34 to 0.67; 386 participants, 4 studies; I2 = 52%).
-
Similar differences in results were shown when data were stratified according to risk of bias for detection and performance bias or for attrition bias (data not shown).
-
There was little or no difference in adverse events including psychological disorders, growth retardation, hypertension, cataracts/glaucoma, osteoporosis, infections or Cushingoid features (Analysis 2.5; low or moderate certainty of evidence).
-
Anand 2013 reported that the number with relapse at 12 months was lower with six months of prednisone compared with three months. Data could not be included in the meta‐analysis as the numbers in each treatment group were not provided.

Forest plot of comparison: 2 Steroid therapy in first episode: 5 to 7 months versus 3 months, outcome: 2.3 Number with frequent relapses stratified by risk of selection bias.
Results were downgraded for medium to high levels of heterogeneity between studies and for risk of bias issues (summary of findings Table 2).The heterogeneity between studies was explained by the risk of bias issues (Analysis 2.3.1 and Analysis 2.3.2 and Analysis 2.4.1 and Analysis 2.4.2) but not by inclusion/exclusion of patients with steroid‐dependent disease, different durations of prednisone (three months versus five to seven months) or different definitions of FRNS (ISKDC definition compared with other definitions) (Data not shown in 2020 update).
One month versus two months therapy in the initial episode of SSNS (one study)
-
APN 1988 reported one month of therapy compared to two months may reduce the risk of relapse at 6 to 12 months (Analysis 3.1: RR 1.60, 95% CI 1.01 to 2.54; 61 participants) and 12 to 24 months (RR 1.46, 95% CI 1.01 to 2.12; 60 participants).
Five months versus 12 months therapy in the initial episode of SSNS (one study)
-
It was uncertain whether the number with relapse was reduced with prolonged prednisone therapy at 12 months versus 5 months in Ksiazek 1995 (Analysis 4.1: RR 0.76, 95% CI 0.51 to 1.13; 58 participants).
Different total doses of prednisone given for three months in the initial episode of SSNS (one study)
-
Hiraoka 2000 reported a higher dose may reduce the number of children relapsing by 12 months (Analysis 5.1: RR 0.63, 95% CI 0.42 to 0.94; 59 participants); but may make little or no difference to the number with frequent relapses (Analysis 5.2: RR 0.69, 95% CI 0.35 to 1.37; 60 participants).
-
Adverse effects may not differ between the groups (Analysis 5.3).
Oral methylprednisolone in children with relapsing or initial episode of SSNS (three studies)
-
Methylprednisolone compared with prednisolone may reduce the time to remission (Analysis 6.1: MD ‐5.54 days, 95% CI ‐8.46 to ‐2.61; 38 participants, 2 studies; I2 = 0%).
-
Imbasciati 1985 reported methylprednisolone compared with prednisolone may make little or no difference to the number of children who relapse (Analysis 6.2: RR 1.00, 95% CI 0.71 to 1.41; 62 participants).
Daily prednisone treatment during viral infections in children with relapsing or initial episode of SSNS (four studies)
-
Abeyagunawardena 2008 reported daily prednisone therapy during upper respiratory tract infections (URTI) resulted in seven relapses in 40 children compared with 19 relapses in 40 children receiving placebo in a cross‐over study continued until all children had completed two episodes of treatment associated with URTI.
-
Gulati 2011 reported daily prednisone therapy may reduce the infection related relapses/patient‐year (Analysis 7.2.1: MD ‐0.70, 95% CI ‐0.87 to ‐0.53; 95 participants) and the total number of relapses/patient/year (Analysis 7.2.2: MD ‐0.90, 95% CI ‐1.08 to ‐0.72; 95 participants).
-
Mattoo 2000 reported daily prednisone may reduce total relapse episodes/patient at two years compared with alternate‐day prednisone (Analysis 7.3: MD ‐3.30, 95% CI ‐4.03 to ‐2.57; 36 participants).
-
In a cross‐over study in children who had not received alternate‐day prednisone for at least three months, Abeyagunawardena 2014 reported daily prednisone administered at the onset of URTI resulted in 11 relapses associated with 115 episodes of URTI in 33 children compared with 25 relapses associated with 101 episodes of URTI in 33 children completing two years.
Deflazacort versus prednisone therapy in children with relapsing or initial episode of SSNS (four studies)
-
Deflazacort compared with prednisone may make little or no difference to the number achieving remission (Analysis 8.1: RR 1.08, 95% CI 0.94 to 1.24; 67 participants, 2 studies; I2 = 0%).
-
Deflazacort compared with prednisone may reduce the number of children with relapses by 9 to 12 months (Analysis 8.2: (RR 0.46, 95% CI 0.27 to 0.78; 63 participants, 2 studies; I2 = 0%).
-
No differences in time to remission or time to relapse in 11 children treated with deflazacort or methylprednisolone were found in a cross‐over study by Liern 2008.
Alternate‐day therapy or daily versus intermittent therapy in relapsing SSNS (one study)
-
There may be little or no difference between alternate‐day therapy and intermittent therapy in maintaining remission after ceasing therapy (Analysis 9.2.1 (RR 1.20, 95% CI 0.93 to 1.55; 1 study; 48 participants).
Daily therapy versus intermittent therapy in relapsing SSNS (one study)
-
There may be little or no difference during therapy between daily and intermittent therapy in maintaining remission after ceasing therapy (Analysis 9.2.5 (RR 1.00, 95% CI 0.89 to 1.12; 1 study; 50 participants).
Single daily doses versus multiple daily doses in relapsing nephrotic syndrome (two studies)
-
There may be little or no difference between single daily doses versus divided daily dosing in maintaining remission (Analysis 9.2.2: (RR 1.10, 95% CI 0.78 to 1.54; 56 participants (Ekka 1997), or the time to remission (Analysis 9.6: MD 0.04 days, 95% CI ‐0.98 to 1.06); 138 participants, 2 studies; I2 = 0%).
-
Serious side effects including hypertension may be less common in the single daily dose patients compared with divided dose patients (Analysis 9.7: RR 0.41, 95% CI 0.18 to 0.91; 138 participants, 2 studies; I2 = 0%).
Low versus conventional dose prednisone in relapsing nephrotic syndrome (three studies)
-
There may be little or no difference in time to remission between reduced (1 mg/kg) and standard prednisone doses (2 mg/kg) (Analysis 10.1: MD 0.71 days, 95% CI ‐0.43 to 1.86; 79 participants, 2 studies; I2 = 0%).
-
Borovitz 2020 reported that compared to a dose of 2 mg/kg/day, the cumulative dose of prednisone to achieve remission may be less in children treated with a dose of 1 mg/kg/day (Analysis 10.2: MD ‐20.60 mg/kg, 95% CI ‐25.65 to ‐15.55; 20 participants).
-
There may be little or no difference in the number with relapse at one month between reduced and standard prednisone doses (Analysis 10.3: RR 0.66, 95% CI 0.16 to 2.68; 59 participants, 2 studies; I2 = 57%)
-
Borovitz 2020 reported that none of the included participants had treatment related complications. Kansal 2019 reported that prednisone adverse effects were more common in the standard dose group compared with the low dose group. Sheikh 2019 did not provide any information on adverse effects.
Daily versus alternate‐day prednisone in relapsing nephrotic syndrome (one study)
-
Yadav 2019 reported daily compared with alternate‐day prednisone may reduce the number of relapses during 12 months of therapy (Analysis 11.1: MD ‐0.90 relapses/year, 95% CI ‐1.33 to ‐0.47; 62 participants).
-
There may be little or no difference in the frequency of adverse effects (Analysis 11.2).
Weight‐based versus body surface area‐based dosing of prednisone in relapsing nephrotic syndrome (two studies)
-
Weight‐based dosing may make little or no difference to the number with relapse at 6 months compared to BSA‐based dosing (Analysis 12.1.1: RR 1.03, 95% CI 0.71 to 1.49; 2 studies; 146 participants; I2 = 0%).
-
Weight‐based dosing may make little or no difference to the risk of adverse effects (Analysis 12.2). Raman 2016 reported one patient in the BSA group developed hypertensive encephalopathy.
-
Mean cumulative prednisone dose for induction (Analysis 12.3.1) over six months was lower in the weight‐based dosing group compared with the BSA‐based dosing group (Basu 2020). Median cumulative prednisone dose (Analysis 12.3.2) was lower in the weight‐based group (81 g/kg) compared with the BSA‐based group (96 g/kg) (Raman 2016).
Seven months of prednisone compared with two months in children with relapsing SSNS (one study)
-
Seven months of prednisone may reduce the risk of relapse at 12 months (Analysis 13.1.2) and 24 months (Analysis 13.1.3).
-
Adverse effects may not differ between treatment groups (Analysis 13.5)
Cortisol supplementation in children with relapsing nephrotic syndrome and adrenocortical suppression (one study)
In a cross‐over study by Leisti 1978, cortisol substitution may result in fewer children with post‐prednisone adrenocortical suppression relapsing during a six‐month period. After three months of treatment, 5/13 children (38%) receiving cortisol had relapsed compared with 12/13 receiving placebo (92%) (Chi2 = 4.0, P = 0.05), and at six months 9/13 children receiving cortisol had relapsed compared with 12/13 receiving placebo.
Discussion
Summary of main results
We have added 16 new included studies to this 2020 update to bring the total number of included studies to 48, which randomised 3941 children.
Prednisone in the first episode of SSNS
In earlier iterations of this review (2000 to 2007), we concluded that prednisone administered for longer durations compared with two or three months reduced the risk of relapse and of FRNS in the initial episode of SSNS. In practice considerable variation exists among paediatric nephrologists in the duration of prednisone used in the initial episode of nephrotic syndrome reflecting in part the poor quality of the evidence from earlier randomised studies (MacHardy 2009; Samuel 2013). The last update of this review (Hahn 2015) included three well designed and adequately powered studies (Sinha 2015; Teeninga 2013; Yoshikawa 2015) which clearly demonstrated that there was no benefit of prolonging prednisone therapy beyond two or three months. In this 2020 update a further well designed study (PREDNOS 2019) also concluded that there was no benefit of prolonging prednisone therapy beyond two months. In our analysis of factors, which might account for the differences in results, we concluded that in studies at low risk of selection or performance bias, no benefit of extending prednisone therapy was identified. In contrast studies at high risk for these biases found a benefit of longer durations of therapy. In this 2020 update we included four new studies (Al Talhi 2018; Anand 2013; Moundekhel 2012; Paul 2014) which evaluated longer durations of prednisone compared with two or three months. All four studies concluded that there was a benefit of longer duration of prednisone therapy. However, all were at high risk of selection and performance bias. Since there are already four well designed studies randomising 823 children with nephrotic syndrome, which clearly demonstrate that there is no benefit of durations of prednisone exceeding two or three months, resources should not be wasted on further studies to evaluate different durations of prednisone in the initial episode of steroid sensitive nephrotic syndrome.
Prednisone in relapsing SSNS
Daily prednisone during viral infections compared with alternate‐day prednisone therapy reduced the rate of relapse in four studies involving 204 children suggesting that this regimen may benefit children with FRNS. Confirmation of this benefit depends on the results from the much larger PREDNOS 2 2014 study, in which the planned enrolment is 300 children. Because of limited data (one study, 48 participants), it remains unclear whether children not already on alternate‐day prednisone should restart daily prednisone for seven days at the onset of viral infections. In this update, an additional nine studies evaluated prednisone in relapsing disease but these were small studies generally evaluating different interventions. One study (Yadav 2019) enrolling 62 participants found that daily prednisone compared with alternate‐day prednisone in children with FRNS was associated with a reduced risk of relapse. Currently the KDIGO 2012 guidelines suggest that alternate‐day prednisone should be used. Two important but small studies (Borovitz 2020; Sheikh 2019) evaluated regimens using lower doses of prednisone for relapsing SSNS and suggested that smaller doses were as effective as the conventional regimen for relapse of prednisone 60 mg/m2 daily till remission followed by four weeks of alternate‐day prednisone at 40 mg/m2. Much larger studies are needed to confirm these findings.
Overall completeness and applicability of evidence
Four well designed studies randomising 823 children in their first episode of SSNS have confirmed that the optimum duration of prednisone therapy is two or three months with no additional benefit found with longer duration of therapy in reducing the number with relapse. Now that we have these data, there is no requirement for further RCTs evaluating duration of prednisone therapy involving children of all ages with their first episode of SSNS. However post hoc analyses in two studies (PREDNOS 2019; Sinha 2015) suggested that a benefit of longer duration therapy in young children has not been completely excluded and this is being assessed in an ongoing study enrolling children below four years of age (Sinha 2016). There are currently no studies assessing whether lower doses of prednisone can be used in the first episode of SSNS.
Data on the management of relapsing syndrome remains inadequate. Four small studies (Abeyagunawardena 2008; Abeyagunawardena 2014; Gulati 2011; Mattoo 2000) report that the risk of relapse associated with infective episodes is reduced with daily prednisone initiated at the onset of the infection. However, clinicians are unlikely to use this regimen without additional data to confirm its efficacy and safety. Similarly although Yadav 2019 demonstrated that daily compared with alternate‐day prednisone using the same total dose of prednisone was more effective in maintaining remission without demonstrable additional adverse effects, clinicians are likely to be wary of using this regimen because of the fear of the risk of more serious adverse effects.
Two small studies (Borovitz 2020; Sheikh 2019) are the first studies to examine whether lower doses of prednisone can be used to treat relapsing nephrotic syndrome. It is imperative that a large study is undertaken to confirm that lower doses of prednisone are as effective in achieving and maintaining remission as the conventional dose regimens which have been used for 50 years. Otherwise there is a risk that clinicians will try using smaller doses of prednisone in relapsing nephrotic syndrome without data from RCTs to support such a change in management.
Although adverse effects of medications were reported in more detail in the four recent high quality studies (PREDNOS 2019; Sinha 2015; Teeninga 2013; Yoshikawa 2015), generally there was limited reporting of adverse effects. Among 22 studies evaluating increased duration or dose in the initial episode of SSNS, hypertension, ophthalmological disorders and Cushing's syndrome were reported in 14, 11 and 12 studies, respectively. Prednisone therapy is known to be associated with significant behavioural and psychological adverse effects (Mishra 2010; Neuhaus 2010). However only eight studies reported this outcome. In PREDNOS 2019 detailed analysis of quantitative data collected using the Achenbach child behaviour checklist found no differences in behaviour score between the two durations of prednisone although parents reported more poor behaviour in children treated for two months. No studies reported on the burden of having a chronic kidney condition on the child or their family (Beanlands 2017).
The studies included the major ethnic groups, but there are no separable data on efficacy and safety for African‐American or African children. These groups of children, who are known to have a higher incidence of initial and late SRNS (Gipson 2011; Kim 2005), may show different responses in studies of increased dose or duration of prednisone. The four recent high quality studies were carried out in Europe, Japan, and India, so few African children would have been included in the studies.
Quality of the evidence
Of the 48 included studies, only 25 (52%) and 22 (46%) studies reported adequate random sequence generation and allocation concealment, respectively.
Only nine studies (19%) were at low risk of bias for performance (blinding of participants and personnel) and detection bias (blinding of outcome assessment) since these studies were placebo controlled studies. Yoshikawa 2015 was an open‐label study and so at high risk of performance bias but this study was at low risk of detection bias. The remaining studies were at high risk of bias for both performance and detection bias. Studies without blinding are considered at high risk of bias because knowledge of treatment groups could influence both patient management and reporting of remission and relapse (Moher 1998; Schulz 1995).
Fewer than 50% of studies were at low risk for both attrition bias (incomplete reporting of outcome data) and reporting bias (selective outcome reporting). Fifteen studies were considered at low risk of other potential bias as they were funded by educational or philanthropic organisations.
In the summary of findings tables (summary of findings Table 1; summary of findings Table 2), the certainty of the evidence was considered moderate or low for efficacy outcomes related to risk of bias and heterogeneity between studies. When studies were separated into subgroups according to the risk of selection bias, the certainty of the evidence was assessed as high for the primary efficacy outcomes of FRNS in seven well designed studies while the certainty of the evidence was judged low or moderate for these outcomes in studies at high or uncertain risk of selection bias. The quality of studies for the adverse effects was considered moderate or low because of inclusion of some studies at high risk of bias and few included studies.
Only 18 of the 48 studies were included in the summary of findings tables and all compared treatment regimens in the first episode of nephrotic syndrome. The remaining studies were either single studies of an intervention or data were reported differently for each study so could not be included in the meta‐analyses.
Potential biases in the review process
A detailed search using the Cochrane Kidney and Transplant Register of Studies was completed in May 2020. The Cochrane Kidney and Transplant Register of Studies contains conference abstracts as well as published studies and there is no language restriction. This minimised the risk that eligible studies were omitted, although more recently published eligible studies and eligible studies in some congress proceedings not searched could have been missed. There were 12 (26%) included studies that were only available in abstract form with limited information on study methods and outcomes. Failure to include these studies could result in overestimation of treatment effect since it is known that negative studies are less likely to be published or may be published later than positive studies (Hopewell 2007). Alternately, some authors have argued that inclusion of these studies could result in overestimation of treatment effect through selective outcome reporting and incomplete reporting of the number of patients completing follow‐up (Egger 2001).
Many studies were small and had incomplete information related to study methodology and results, and further information particularly of older studies could not be obtained despite contacting authors. Of the 48 included studies 16 were published in or before 2000 ‐ before the CONSORT checklist first published in 1996 would be likely to influence study methodology and reporting (Moher 2001).
This was an extensive review; each step was completed independently by at least two authors thus minimising the risks of errors in determining study eligibility, data extraction and risk of bias assessment and data synthesis.
Agreements and disagreements with other studies or reviews
New studies at low risk of bias included in this review indicate that there is no benefit in prolonging the corticosteroid treatment of all children for more than two to three months in the initial episode of SSNS. These data are supported from the recent KDIGO Controversies Conference suggesting recent RCTs do not support corticosteroid exposure beyond eight to 12 weeks (KDIGO Executive Conclusions 2019; Vivarelli 2017).
Older guidelines (Gipson 2009; IPNG‐IAP 2008; KDIGO 2012) recommend treatment with three months or more of prednisone for the initial episode of SSNS.
In support of the KDIGO guidelines (KDIGO 2012), this review identified four studies showing that increasing prednisone administration from alternate‐day to daily or giving prednisone to children not on prednisone at the onset of an intercurrent viral infection reduces the risk of relapse though the results of large study addressing this intervention are awaited (PREDNOS 2 2014).
Current guidelines (Gipson 2009; IPNG‐IAP 2008; KDIGO 2012) recommend that alternate‐day prednisone therapy be used to reduce the risk of relapse in children with FRNS. However a study (Yadav 2019) identified for this review update showed that the number of relapses was lower in children treated with low dose daily prednisone compared with alternate‐day dosing with no differences in adverse effects. Guidelines also recommend that children be dosed with prednisone according to body surface area (BSA) rather than weight in children weighing less than 30 kg because the calculation of dose by weight results in a lower dose compared with calculation based on BSA. However Raman 2016 found no differences in the number with relapse or in adverse effects between the two dosing schedules.
The listed guidelines emphasise the use of non‐corticosteroid immunosuppressive medications in children with frequently relapsing or steroid dependent disease. These medications are the subject of another Cochrane systematic review (Larkins 2020).

Study flow diagram.

Risk of bias graph: review authors' judgements about each risk of bias item presented as percentages across all included studies.

Risk of bias summary: review authors' judgements about each risk of bias item for each included study.

Forest plot of comparison: 1 Steroid therapy in first episode: ≥ 3 months versus 2 months therapy, outcome: 1.3 Number with frequent relapses by 12 to 24 months stratified by risk of bias for selection bias.

Forest plot of comparison: 2 Steroid therapy in first episode: 5 to 7 months versus 3 months, outcome: 2.3 Number with frequent relapses stratified by risk of selection bias.

Comparison 1: Steroid therapy in first episode: ≥ 3 months versus 2 months therapy, Outcome 1: Number with frequent relapses by 12 to 24 months

Comparison 1: Steroid therapy in first episode: ≥ 3 months versus 2 months therapy, Outcome 2: Number of children relapsing by 12 to 24 months

Comparison 1: Steroid therapy in first episode: ≥ 3 months versus 2 months therapy, Outcome 3: Number with frequent relapses by 12 to 24 months stratified by risk of bias for selection bias

Comparison 1: Steroid therapy in first episode: ≥ 3 months versus 2 months therapy, Outcome 4: Number of children relapsing by 12 to 24 months stratified by risk of selection bias

Comparison 1: Steroid therapy in first episode: ≥ 3 months versus 2 months therapy, Outcome 5: Adverse events

Comparison 2: Steroid therapy in first episode: 5 to 7 months versus 3 months, Outcome 1: Number with frequent relapses by 12 to 24 months

Comparison 2: Steroid therapy in first episode: 5 to 7 months versus 3 months, Outcome 2: Number of children relapsing by 12 to 24 months

Comparison 2: Steroid therapy in first episode: 5 to 7 months versus 3 months, Outcome 3: Number with frequent relapses stratified by risk of selection bias

Comparison 2: Steroid therapy in first episode: 5 to 7 months versus 3 months, Outcome 4: Number of children relapsing by 12 to 24 months stratified by risk of selection bias

Comparison 2: Steroid therapy in first episode: 5 to 7 months versus 3 months, Outcome 5: Adverse events

Comparison 3: Steroid therapy in the first episode: 1 month versus 2 months therapy, Outcome 1: Number of children relapsing by 6 to 12 months

Comparison 3: Steroid therapy in the first episode: 1 month versus 2 months therapy, Outcome 2: Number of children relapsing by 12 to 24 months

Comparison 3: Steroid therapy in the first episode: 1 month versus 2 months therapy, Outcome 3: Number with frequent relapses

Comparison 4: Steroid therapy in the first episode: 12 months versus 5 months therapy, Outcome 1: Number with relapse

Comparison 5: Steroid therapy in the first episode of nephrotic syndrome: different total doses given over the same duration, Outcome 1: Relapse at 12 months

Comparison 5: Steroid therapy in the first episode of nephrotic syndrome: different total doses given over the same duration, Outcome 2: Number with FRNS

Comparison 5: Steroid therapy in the first episode of nephrotic syndrome: different total doses given over the same duration, Outcome 3: Adverse effects

Comparison 6: Methylprednisolone in steroid therapy in first episode of nephrotic syndrome: methylprednisone versus prednisolone, Outcome 1: Time to remission

Comparison 6: Methylprednisolone in steroid therapy in first episode of nephrotic syndrome: methylprednisone versus prednisolone, Outcome 2: Number with relapse

Comparison 7: Daily prednisolone treatment during viral infections, Outcome 1: Number with relapse with infection

Comparison 7: Daily prednisolone treatment during viral infections, Outcome 2: Number of relapses/patient

Comparison 7: Daily prednisolone treatment during viral infections, Outcome 3: Number of relapses/patient at 2 years

Comparison 8: Deflazacort versus prednisolone, Outcome 1: Number with remission

Comparison 8: Deflazacort versus prednisolone, Outcome 2: Number of children with relapse by 9 to 12 months

Comparison 9: Treatment therapy (various) versus standard therapy in relapsing nephrotic syndrome, Outcome 1: Number of children relapsing during therapy

Comparison 9: Treatment therapy (various) versus standard therapy in relapsing nephrotic syndrome, Outcome 2: Number of children with relapses by 9 to 12 months

Comparison 9: Treatment therapy (various) versus standard therapy in relapsing nephrotic syndrome, Outcome 3: Mean time to relapse

Comparison 9: Treatment therapy (various) versus standard therapy in relapsing nephrotic syndrome, Outcome 4: Mean relapse rate/patient/year

Comparison 9: Treatment therapy (various) versus standard therapy in relapsing nephrotic syndrome, Outcome 5: Cumulative steroid dose

Comparison 9: Treatment therapy (various) versus standard therapy in relapsing nephrotic syndrome, Outcome 6: Mean time to remission

Comparison 9: Treatment therapy (various) versus standard therapy in relapsing nephrotic syndrome, Outcome 7: Serious adverse events

Comparison 10: Steroid therapy for relapse: different prednisone doses, Outcome 1: Time to remission with different prednisone doses

Comparison 10: Steroid therapy for relapse: different prednisone doses, Outcome 2: Cumulative prednisone dose to achieve remission

Comparison 10: Steroid therapy for relapse: different prednisone doses, Outcome 3: Number with relapse

Comparison 11: Daily versus alternate‐day prednisone for relapsing nephrotic syndrome, Outcome 1: Number of relapses in 12 months

Comparison 11: Daily versus alternate‐day prednisone for relapsing nephrotic syndrome, Outcome 2: Adverse effects

Comparison 12: Weight‐based versus body surface area (BSA)‐based dosing of prednisolone, Outcome 1: Relapse at 6 months

Comparison 12: Weight‐based versus body surface area (BSA)‐based dosing of prednisolone, Outcome 2: Adverse effects

Comparison 12: Weight‐based versus body surface area (BSA)‐based dosing of prednisolone, Outcome 3: Prednisone dose

Comparison 13: Prolonged steroid therapy (7 months) for relapsing nephrotic syndrome, Outcome 1: Number with relapses

Comparison 13: Prolonged steroid therapy (7 months) for relapsing nephrotic syndrome, Outcome 2: Relapse rate/patient/year

Comparison 13: Prolonged steroid therapy (7 months) for relapsing nephrotic syndrome, Outcome 3: Number with FRNS or SDNS

Comparison 13: Prolonged steroid therapy (7 months) for relapsing nephrotic syndrome, Outcome 4: Cumulative steroid dose

Comparison 13: Prolonged steroid therapy (7 months) for relapsing nephrotic syndrome, Outcome 5: Adverse effects
| Steroid therapy in first episode of nephrotic syndrome: 3 months or more versus 2 months of therapy for nephrotic syndrome in children | |||||
| Patient or population: children with nephrotic syndrome | |||||
| Outcomes | Anticipated absolute effects* (95% CI) | Relative effect | No. of participants | Certainty of the evidence | |
|---|---|---|---|---|---|
| Assumed risk | Corresponding risk | ||||
| Risk with 2 months of therapy | Risk with 3 months or more of therapy | ||||
| Number with frequent relapses by 12 to 24 months | 450 per 1,000 | 387 per 1,000 | RR 0.86 | 976 (8) | ⊕⊕⊕⊝1 |
| Number of children relapsing by 12 to 24 months | 646 per 1,000 | 497 per 1,000 | RR 0.77 | 1309 (12) | ⊕⊕⊝⊝1,2 |
| Number with frequent relapses by 12 to 24 months stratified by risk of selection bias: Low risk of selection bias | 413 per 1,000 | 409 per 1,000 | RR 0.99 | 585 (4) | ⊕⊕⊕⊕ |
| Number with frequent relapses by 12 to 24 months stratified by risk of selection bias: Unclear or high risk of bias for allocation bias | 357 per 1,000 | 161 per 1,000 | RR 0.45 | 220 (3) | ⊕⊕⊝⊝ 1,2 |
| Adverse events: psychological disorders | 470 per 1,000 | 470 per 1,000 | RR 1.00 | 456 (4) | ⊕⊕⊝⊝2,3 |
| Adverse events: hypertension | 50 per 1,000 | 89 per 1,000 | RR 1.78 | 548 (7) | ⊕⊕⊕⊝ 1 |
| Adverse events: Cushing's syndrome | 402 per 1,000 | 450 per 1,000 | RR 1.12 | 547 (5) | ⊕⊕⊕⊝1 |
| *The risk in the intervention group (and its 95% CI) is based on the assumed risk in the comparison group and the relative effect of the intervention (and its 95% CI). | |||||
| GRADE Working Group grades of evidence | |||||
| 1 Significant heterogeneity between studies 2 Some studies at high or unclear risk of bias 3 Few studies included in analyses | |||||
| Steroid therapy in first episode of nephrotic syndrome: 5 to 7 months versus 3 months for nephrotic syndrome in children | |||||
| Patient or population: children with nephrotic syndrome | |||||
| Outcomes | Illustrative comparative risks* (95% CI) | Relative effect | No. of Participants | Quality of the evidence | |
|---|---|---|---|---|---|
| Assumed risk | Corresponding risk | ||||
| Risk with 3 months of therapy | Risk with 5 to 7 months of therapy | ||||
| Number with frequent relapses by 12 to 24 months | 387 per 1000 | 282 per 1000 | RR 0.73 | 706 (6) | ⊕⊕⊕⊝ |
| Number of children relapsing by 12 to 24 months | 696 per 1000 | 432 per 1000 | RR 0.62 | 762 (7) | ⊕⊕⊝⊝ |
| Subgroup analysis by risk of bias for number with frequent relapses: low risk of selection bias | 440 per 1000 | 436 per 1000 | RR 0.99 | 376 (3) | ⊕⊕⊕⊕ |
| Subgroup analysis by risk of bias for number with frequent relapses: Unclear or high risk of selection bias | 327 per 1000 | 157 per 1000 | RR 0.48 | 330 (3) | ⊕⊕⊕⊝ |
| Adverse events: hypertension | 126 per 1000 | 140 per 1000 | RR 1.11 | 752 (6) | ⊕⊕⊕⊝ |
| Adverse events: eye complications | 36 per 1000 | 17 per 1000 | RR 0.46 | 614 | ⊕⊕⊕⊝ |
| Adverse events: Cushingoid appearance | 375 per 1000 | 323 per 1000 | RR 0.86 | 762 (6) | ⊕⊕⊕⊝ |
| Adverse events: psychological disorders | 53 per 1000 | 16 per 1000 | RR 0.30 | 505 (4) | ⊕⊕⊝⊝ |
| *The basis for the assumed risk (e.g. the median control group risk across studies) is provided in footnotes. The corresponding risk (and its 95% CI) is based on the assumed risk in the comparison group and the relative effect of the intervention (and its 95% CI). | |||||
| GRADE Working Group grades of evidence | |||||
| 1 Significant heterogeneity between studies 2 Some studies at high or unclear risk of bias 3 Few studies included in analyses | |||||
| Outcome or subgroup title | No. of studies | No. of participants | Statistical method | Effect size |
| 1.1 Number with frequent relapses by 12 to 24 months Show forest plot | 8 | 976 | Risk Ratio (M‐H, Random, 95% CI) | 0.86 [0.71, 1.06] |
| 1.2 Number of children relapsing by 12 to 24 months Show forest plot | 12 | 1309 | Risk Ratio (M‐H, Random, 95% CI) | 0.77 [0.63, 0.95] |
| 1.3 Number with frequent relapses by 12 to 24 months stratified by risk of bias for selection bias Show forest plot | 7 | 805 | Risk Ratio (M‐H, Random, 95% CI) | 0.79 [0.59, 1.06] |
| 1.3.1 Low risk of selection bias | 4 | 585 | Risk Ratio (M‐H, Random, 95% CI) | 0.99 [0.82, 1.19] |
| 1.3.2 Unclear or high risk of selection bias | 3 | 220 | Risk Ratio (M‐H, Random, 95% CI) | 0.45 [0.26, 0.77] |
| 1.4 Number of children relapsing by 12 to 24 months stratified by risk of selection bias Show forest plot | 11 | 1108 | Risk Ratio (M‐H, Random, 95% CI) | 0.79 [0.65, 0.95] |
| 1.4.1 Low risk of selection bias | 5 | 637 | Risk Ratio (M‐H, Random, 95% CI) | 0.91 [0.78, 1.06] |
| 1.4.2 Unclear or high risk of selection bias | 6 | 471 | Risk Ratio (M‐H, Random, 95% CI) | 0.69 [0.49, 0.98] |
| 1.5 Adverse events Show forest plot | 8 | Risk Ratio (M‐H, Random, 95% CI) | Subtotals only | |
| 1.5.1 Psychological disorders | 4 | 456 | Risk Ratio (M‐H, Random, 95% CI) | 1.00 [0.53, 1.90] |
| 1.5.2 Hypertension | 7 | 548 | Risk Ratio (M‐H, Random, 95% CI) | 1.78 [0.55, 5.73] |
| 1.5.3 Cataracts/eye disorders | 6 | 623 | Risk Ratio (M‐H, Random, 95% CI) | 0.41 [0.11, 1.52] |
| 1.5.4 Retarded growth | 4 | 354 | Risk Ratio (M‐H, Random, 95% CI) | 0.54 [0.25, 1.18] |
| 1.5.5 Cushingoid facies | 5 | 547 | Risk Ratio (M‐H, Random, 95% CI) | 1.12 [0.76, 1.65] |
| 1.5.6 Infections | 2 | 172 | Risk Ratio (M‐H, Random, 95% CI) | 0.79 [0.53, 1.17] |
| 1.5.7 Osteoporosis | 3 | 233 | Risk Ratio (M‐H, Random, 95% CI) | 0.47 [0.06, 3.38] |
| Outcome or subgroup title | No. of studies | No. of participants | Statistical method | Effect size |
| 2.1 Number with frequent relapses by 12 to 24 months Show forest plot | 6 | 706 | Risk Ratio (M‐H, Random, 95% CI) | 0.73 [0.49, 1.09] |
| 2.2 Number of children relapsing by 12 to 24 months Show forest plot | 7 | 762 | Risk Ratio (M‐H, Random, 95% CI) | 0.62 [0.45, 0.85] |
| 2.3 Number with frequent relapses stratified by risk of selection bias Show forest plot | 6 | 706 | Risk Ratio (M‐H, Random, 95% CI) | 0.73 [0.49, 1.09] |
| 2.3.1 Studies at low risk of selection bias | 3 | 376 | Risk Ratio (M‐H, Random, 95% CI) | 0.99 [0.74, 1.33] |
| 2.3.2 Studies at high or unclear risk of selection bias | 3 | 330 | Risk Ratio (M‐H, Random, 95% CI) | 0.48 [0.32, 0.72] |
| 2.4 Number of children relapsing by 12 to 24 months stratified by risk of selection bias Show forest plot | 7 | 762 | Risk Ratio (M‐H, Random, 95% CI) | 0.62 [0.45, 0.85] |
| 2.4.1 Studies at low risk of selection bias | 3 | 376 | Risk Ratio (M‐H, Random, 95% CI) | 0.88 [0.69, 1.11] |
| 2.4.2 Studies at high or unclear risk of selection bias | 4 | 386 | Risk Ratio (M‐H, Random, 95% CI) | 0.47 [0.34, 0.67] |
| 2.5 Adverse events Show forest plot | 6 | Risk Ratio (M‐H, Random, 95% CI) | Subtotals only | |
| 2.5.1 Hypertension | 6 | 752 | Risk Ratio (M‐H, Random, 95% CI) | 1.11 [0.71, 1.74] |
| 2.5.2 Eye complications | 5 | 614 | Risk Ratio (M‐H, Random, 95% CI) | 0.46 [0.18, 1.17] |
| 2.5.3 Infections | 5 | 702 | Risk Ratio (M‐H, Random, 95% CI) | 0.98 [0.65, 1.46] |
| 2.5.4 Cushingoid appearance | 6 | 762 | Risk Ratio (M‐H, Random, 95% CI) | 0.86 [0.60, 1.23] |
| 2.5.5 Gastrointestinal bleeding | 1 | 140 | Risk Ratio (M‐H, Random, 95% CI) | 1.50 [0.26, 8.70] |
| 2.5.6 Addisonian crisis | 1 | 140 | Risk Ratio (M‐H, Random, 95% CI) | 0.50 [0.05, 5.39] |
| 2.5.7 Psychological disorders | 4 | 505 | Risk Ratio (M‐H, Random, 95% CI) | 0.30 [0.05, 1.83] |
| 2.5.8 Growth | 3 | 436 | Risk Ratio (M‐H, Random, 95% CI) | 0.73 [0.36, 1.48] |
| Outcome or subgroup title | No. of studies | No. of participants | Statistical method | Effect size |
| 3.1 Number of children relapsing by 6 to 12 months Show forest plot | 1 | Risk Ratio (M‐H, Random, 95% CI) | Totals not selected | |
| 3.2 Number of children relapsing by 12 to 24 months Show forest plot | 1 | Risk Ratio (M‐H, Random, 95% CI) | Totals not selected | |
| 3.3 Number with frequent relapses Show forest plot | 1 | Risk Ratio (M‐H, Random, 95% CI) | Totals not selected | |
| Outcome or subgroup title | No. of studies | No. of participants | Statistical method | Effect size |
| 4.1 Number with relapse Show forest plot | 1 | Risk Ratio (M‐H, Random, 95% CI) | Totals not selected | |
| Outcome or subgroup title | No. of studies | No. of participants | Statistical method | Effect size |
| 5.1 Relapse at 12 months Show forest plot | 1 | Risk Ratio (M‐H, Random, 95% CI) | Totals not selected | |
| 5.2 Number with FRNS Show forest plot | 1 | Risk Ratio (M‐H, Random, 95% CI) | Totals not selected | |
| 5.3 Adverse effects Show forest plot | 1 | Risk Ratio (M‐H, Random, 95% CI) | Totals not selected | |
| 5.3.1 Hypertension | 1 | Risk Ratio (M‐H, Random, 95% CI) | Totals not selected | |
| 5.3.2 Psychological disorders | 1 | Risk Ratio (M‐H, Random, 95% CI) | Totals not selected | |
| 5.3.3 Cushing's Syndrome | 1 | Risk Ratio (M‐H, Random, 95% CI) | Totals not selected | |
| Outcome or subgroup title | No. of studies | No. of participants | Statistical method | Effect size |
| 6.1 Time to remission Show forest plot | 2 | 38 | Mean Difference (IV, Random, 95% CI) | ‐5.54 [‐8.46, ‐2.61] |
| 6.2 Number with relapse Show forest plot | 1 | Risk Ratio (M‐H, Random, 95% CI) | Totals not selected | |
| Outcome or subgroup title | No. of studies | No. of participants | Statistical method | Effect size |
| 7.1 Number with relapse with infection Show forest plot | 1 | Risk Ratio (M‐H, Random, 95% CI) | Totals not selected | |
| 7.2 Number of relapses/patient Show forest plot | 1 | Mean Difference (IV, Random, 95% CI) | Totals not selected | |
| 7.2.1 Number of infection‐related relapses/patient/year | 1 | Mean Difference (IV, Random, 95% CI) | Totals not selected | |
| 7.2.2 Total relapses (episodes/patient/1 year) | 1 | Mean Difference (IV, Random, 95% CI) | Totals not selected | |
| 7.3 Number of relapses/patient at 2 years Show forest plot | 1 | Mean Difference (IV, Random, 95% CI) | Totals not selected | |
| Outcome or subgroup title | No. of studies | No. of participants | Statistical method | Effect size |
| 8.1 Number with remission Show forest plot | 2 | 67 | Risk Ratio (M‐H, Random, 95% CI) | 1.08 [0.94, 1.24] |
| 8.2 Number of children with relapse by 9 to 12 months Show forest plot | 2 | 63 | Risk Ratio (M‐H, Random, 95% CI) | 0.46 [0.27, 0.78] |
| Outcome or subgroup title | No. of studies | No. of participants | Statistical method | Effect size |
| 9.1 Number of children relapsing during therapy Show forest plot | 2 | Risk Ratio (M‐H, Random, 95% CI) | Totals not selected | |
| 9.1.1 Intermittent dose versus alternate‐day therapy (6 months therapy) | 1 | Risk Ratio (M‐H, Random, 95% CI) | Totals not selected | |
| 9.1.2 Daily versus intermittent therapy (2 months therapy) | 1 | Risk Ratio (M‐H, Random, 95% CI) | Totals not selected | |
| 9.2 Number of children with relapses by 9 to 12 months Show forest plot | 4 | Risk Ratio (M‐H, Random, 95% CI) | Totals not selected | |
| 9.2.1 Intermittent dose versus alternate‐day therapy (6 months therapy) | 1 | Risk Ratio (M‐H, Random, 95% CI) | Totals not selected | |
| 9.2.2 Single versus divided dose therapy (2 months therapy) | 1 | Risk Ratio (M‐H, Random, 95% CI) | Totals not selected | |
| 9.2.3 Intravenous versus oral therapy (6 months therapy) | 1 | Risk Ratio (M‐H, Random, 95% CI) | Totals not selected | |
| 9.2.4 Prolonged oral versus intermittent therapy (2 months therapy) | 1 | Risk Ratio (M‐H, Random, 95% CI) | Totals not selected | |
| 9.3 Mean time to relapse Show forest plot | 2 | Mean Difference (IV, Random, 95% CI) | Totals not selected | |
| 9.3.1 Single versus divided dose therapy (2 months therapy) | 1 | Mean Difference (IV, Random, 95% CI) | Totals not selected | |
| 9.3.2 Daily versus intermittent therapy (2 months therapy) | 1 | Mean Difference (IV, Random, 95% CI) | Totals not selected | |
| 9.4 Mean relapse rate/patient/year Show forest plot | 2 | Mean Difference (IV, Random, 95% CI) | Totals not selected | |
| 9.4.1 Single versus divided dose therapy (2 months therapy) | 1 | Mean Difference (IV, Random, 95% CI) | Totals not selected | |
| 9.4.2 Daily versus intermittent therapy (2 months therapy) | 1 | Mean Difference (IV, Random, 95% CI) | Totals not selected | |
| 9.5 Cumulative steroid dose Show forest plot | 1 | Mean Difference (IV, Random, 95% CI) | Totals not selected | |
| 9.6 Mean time to remission Show forest plot | 2 | 138 | Mean Difference (IV, Random, 95% CI) | 0.04 [‐0.98, 1.06] |
| 9.7 Serious adverse events Show forest plot | 2 | 138 | Risk Ratio (M‐H, Random, 95% CI) | 0.41 [0.18, 0.91] |
| Outcome or subgroup title | No. of studies | No. of participants | Statistical method | Effect size |
| 10.1 Time to remission with different prednisone doses Show forest plot | 2 | 79 | Mean Difference (IV, Random, 95% CI) | 0.71 [‐0.43, 1.86] |
| 10.2 Cumulative prednisone dose to achieve remission Show forest plot | 1 | Mean Difference (IV, Random, 95% CI) | Totals not selected | |
| 10.3 Number with relapse Show forest plot | 2 | 59 | Risk Ratio (M‐H, Random, 95% CI) | 0.66 [0.16, 2.68] |
| Outcome or subgroup title | No. of studies | No. of participants | Statistical method | Effect size |
| 11.1 Number of relapses in 12 months Show forest plot | 1 | Mean Difference (IV, Random, 95% CI) | Totals not selected | |
| 11.2 Adverse effects Show forest plot | 1 | Risk Ratio (M‐H, Random, 95% CI) | Totals not selected | |
| 11.2.1 Cushingoid facies | 1 | Risk Ratio (M‐H, Random, 95% CI) | Totals not selected | |
| 11.2.2 Cataracts | 1 | Risk Ratio (M‐H, Random, 95% CI) | Totals not selected | |
| Outcome or subgroup title | No. of studies | No. of participants | Statistical method | Effect size |
| 12.1 Relapse at 6 months Show forest plot | 2 | 146 | Risk Ratio (M‐H, Random, 95% CI) | 1.03 [0.71, 1.49] |
| 12.2 Adverse effects Show forest plot | 2 | Risk Ratio (M‐H, Random, 95% CI) | Subtotals only | |
| 12.2.1 Cushingoid features | 2 | 144 | Risk Ratio (M‐H, Random, 95% CI) | 1.16 [0.58, 2.32] |
| 12.2.2 Serious infections | 2 | 144 | Risk Ratio (M‐H, Random, 95% CI) | 0.58 [0.20, 1.66] |
| 12.2.3 Eye changes | 1 | 84 | Risk Ratio (M‐H, Random, 95% CI) | 0.52 [0.05, 5.57] |
| 12.2.4 Hypertension | 2 | 144 | Risk Ratio (M‐H, Random, 95% CI) | 0.28 [0.05, 1.73] |
| 12.3 Prednisone dose Show forest plot | 1 | Mean Difference (IV, Random, 95% CI) | Totals not selected | |
| 12.3.1 Induction dose | 1 | Mean Difference (IV, Random, 95% CI) | Totals not selected | |
| 12.3.2 Cumulative dose over 6 months | 1 | Mean Difference (IV, Random, 95% CI) | Totals not selected | |
| Outcome or subgroup title | No. of studies | No. of participants | Statistical method | Effect size |
| 13.1 Number with relapses Show forest plot | 1 | Risk Ratio (M‐H, Random, 95% CI) | Totals not selected | |
| 13.1.1 Relapse by 6 months | 1 | Risk Ratio (M‐H, Random, 95% CI) | Totals not selected | |
| 13.1.2 Relapse by 12 months | 1 | Risk Ratio (M‐H, Random, 95% CI) | Totals not selected | |
| 13.1.3 Relapse by 2 years | 1 | Risk Ratio (M‐H, Random, 95% CI) | Totals not selected | |
| 13.1.4 Relapse by 3 years | 1 | Risk Ratio (M‐H, Random, 95% CI) | Totals not selected | |
| 13.2 Relapse rate/patient/year Show forest plot | 1 | Mean Difference (IV, Random, 95% CI) | Totals not selected | |
| 13.2.1 Relapse rate at 1 year | 1 | Mean Difference (IV, Random, 95% CI) | Totals not selected | |
| 13.2.2 Relapse rate at 2 years | 1 | Mean Difference (IV, Random, 95% CI) | Totals not selected | |
| 13.2.3 Relapse rate at 3 years | 1 | Mean Difference (IV, Random, 95% CI) | Totals not selected | |
| 13.3 Number with FRNS or SDNS Show forest plot | 1 | Risk Ratio (M‐H, Random, 95% CI) | Totals not selected | |
| 13.4 Cumulative steroid dose Show forest plot | 1 | Mean Difference (IV, Random, 95% CI) | Totals not selected | |
| 13.4.1 After 1 year | 1 | Mean Difference (IV, Random, 95% CI) | Totals not selected | |
| 13.4.2 After 2 years | 1 | Mean Difference (IV, Random, 95% CI) | Totals not selected | |
| 13.4.3 After 3 years | 1 | Mean Difference (IV, Random, 95% CI) | Totals not selected | |
| 13.5 Adverse effects Show forest plot | 1 | Risk Ratio (M‐H, Random, 95% CI) | Totals not selected | |
| 13.5.1 Number with hypertension | 1 | Risk Ratio (M‐H, Random, 95% CI) | Totals not selected | |
| 13.5.2 Number with growth failure | 1 | Risk Ratio (M‐H, Random, 95% CI) | Totals not selected | |