Scolaris Content Display Scolaris Content Display

Correlation between relative risk for relapse (Y axis) and duration of therapy (X axis) showing that relative risk for relapse decreases with increase in duration of prednisone therapy.
Figuras y tablas -
Figure 1

Correlation between relative risk for relapse (Y axis) and duration of therapy (X axis) showing that relative risk for relapse decreases with increase in duration of prednisone therapy.

Correlation between relative risk for relapse (Y axis) and total induction dose of prednisone (X axis) showing that the relative risk for relapse falls with increase in dose of prednisone therapy.
Figuras y tablas -
Figure 2

Correlation between relative risk for relapse (Y axis) and total induction dose of prednisone (X axis) showing that the relative risk for relapse falls with increase in dose of prednisone therapy.

Reduction in risk of relapse was primarily associated with an increase in duration not dose since an increase in dose/month appeared to be associated with increased rather than decreased RR for relapse.
Figuras y tablas -
Figure 3

Reduction in risk of relapse was primarily associated with an increase in duration not dose since an increase in dose/month appeared to be associated with increased rather than decreased RR for relapse.

Comparison 1 Steroid therapy in first episode of nephrotic syndrome: comparisons with ISKDC standard therapy, Outcome 1 Number of children relapsing by 6 months.
Figuras y tablas -
Analysis 1.1

Comparison 1 Steroid therapy in first episode of nephrotic syndrome: comparisons with ISKDC standard therapy, Outcome 1 Number of children relapsing by 6 months.

Comparison 1 Steroid therapy in first episode of nephrotic syndrome: comparisons with ISKDC standard therapy, Outcome 2 Number of children relapsing by 12‐24 months.
Figuras y tablas -
Analysis 1.2

Comparison 1 Steroid therapy in first episode of nephrotic syndrome: comparisons with ISKDC standard therapy, Outcome 2 Number of children relapsing by 12‐24 months.

Comparison 1 Steroid therapy in first episode of nephrotic syndrome: comparisons with ISKDC standard therapy, Outcome 3 Mean relapse rate/patient/year.
Figuras y tablas -
Analysis 1.3

Comparison 1 Steroid therapy in first episode of nephrotic syndrome: comparisons with ISKDC standard therapy, Outcome 3 Mean relapse rate/patient/year.

Comparison 1 Steroid therapy in first episode of nephrotic syndrome: comparisons with ISKDC standard therapy, Outcome 4 Number with frequent relapses.
Figuras y tablas -
Analysis 1.4

Comparison 1 Steroid therapy in first episode of nephrotic syndrome: comparisons with ISKDC standard therapy, Outcome 4 Number with frequent relapses.

Comparison 1 Steroid therapy in first episode of nephrotic syndrome: comparisons with ISKDC standard therapy, Outcome 5 Cumulative steroid dose in g/m².
Figuras y tablas -
Analysis 1.5

Comparison 1 Steroid therapy in first episode of nephrotic syndrome: comparisons with ISKDC standard therapy, Outcome 5 Cumulative steroid dose in g/m².

Comparison 1 Steroid therapy in first episode of nephrotic syndrome: comparisons with ISKDC standard therapy, Outcome 6 Adverse events: increased prednisone dose versus standard duration.
Figuras y tablas -
Analysis 1.6

Comparison 1 Steroid therapy in first episode of nephrotic syndrome: comparisons with ISKDC standard therapy, Outcome 6 Adverse events: increased prednisone dose versus standard duration.

Comparison 1 Steroid therapy in first episode of nephrotic syndrome: comparisons with ISKDC standard therapy, Outcome 7 Subgroup analysis: Relapse at 12‐24 months according to adequacy of allocation concealment.
Figuras y tablas -
Analysis 1.7

Comparison 1 Steroid therapy in first episode of nephrotic syndrome: comparisons with ISKDC standard therapy, Outcome 7 Subgroup analysis: Relapse at 12‐24 months according to adequacy of allocation concealment.

Comparison 2 Steroid therapy in first episode of nephrotic syndrome: comparisons of 3 months or more of steroids, Outcome 1 Number of children relapsing by 6 months.
Figuras y tablas -
Analysis 2.1

Comparison 2 Steroid therapy in first episode of nephrotic syndrome: comparisons of 3 months or more of steroids, Outcome 1 Number of children relapsing by 6 months.

Comparison 2 Steroid therapy in first episode of nephrotic syndrome: comparisons of 3 months or more of steroids, Outcome 2 Number of children relapsing by 12‐24 months.
Figuras y tablas -
Analysis 2.2

Comparison 2 Steroid therapy in first episode of nephrotic syndrome: comparisons of 3 months or more of steroids, Outcome 2 Number of children relapsing by 12‐24 months.

Comparison 2 Steroid therapy in first episode of nephrotic syndrome: comparisons of 3 months or more of steroids, Outcome 3 Mean relapse rate/patient/year.
Figuras y tablas -
Analysis 2.3

Comparison 2 Steroid therapy in first episode of nephrotic syndrome: comparisons of 3 months or more of steroids, Outcome 3 Mean relapse rate/patient/year.

Comparison 2 Steroid therapy in first episode of nephrotic syndrome: comparisons of 3 months or more of steroids, Outcome 4 Number with frequent relapses.
Figuras y tablas -
Analysis 2.4

Comparison 2 Steroid therapy in first episode of nephrotic syndrome: comparisons of 3 months or more of steroids, Outcome 4 Number with frequent relapses.

Comparison 2 Steroid therapy in first episode of nephrotic syndrome: comparisons of 3 months or more of steroids, Outcome 5 Cumulative steroid dose in g/m².
Figuras y tablas -
Analysis 2.5

Comparison 2 Steroid therapy in first episode of nephrotic syndrome: comparisons of 3 months or more of steroids, Outcome 5 Cumulative steroid dose in g/m².

Comparison 2 Steroid therapy in first episode of nephrotic syndrome: comparisons of 3 months or more of steroids, Outcome 6 Adverse events: 6 months versus 3 months duration.
Figuras y tablas -
Analysis 2.6

Comparison 2 Steroid therapy in first episode of nephrotic syndrome: comparisons of 3 months or more of steroids, Outcome 6 Adverse events: 6 months versus 3 months duration.

Comparison 3 Steroid therapy and Sairei‐to in first episode of nephrotic syndrome, Outcome 1 Long prednisone & Sairei‐to versus standard prednisone & Sairei‐to.
Figuras y tablas -
Analysis 3.1

Comparison 3 Steroid therapy and Sairei‐to in first episode of nephrotic syndrome, Outcome 1 Long prednisone & Sairei‐to versus standard prednisone & Sairei‐to.

Comparison 4 Cyclosporin and steroid therapy in first episode of childhood nephrotic syndrome, Outcome 1 Relapse by 6 months.
Figuras y tablas -
Analysis 4.1

Comparison 4 Cyclosporin and steroid therapy in first episode of childhood nephrotic syndrome, Outcome 1 Relapse by 6 months.

Comparison 4 Cyclosporin and steroid therapy in first episode of childhood nephrotic syndrome, Outcome 2 Relapse by 12 months.
Figuras y tablas -
Analysis 4.2

Comparison 4 Cyclosporin and steroid therapy in first episode of childhood nephrotic syndrome, Outcome 2 Relapse by 12 months.

Comparison 4 Cyclosporin and steroid therapy in first episode of childhood nephrotic syndrome, Outcome 3 Number needing cytotoxic agents.
Figuras y tablas -
Analysis 4.3

Comparison 4 Cyclosporin and steroid therapy in first episode of childhood nephrotic syndrome, Outcome 3 Number needing cytotoxic agents.

Comparison 4 Cyclosporin and steroid therapy in first episode of childhood nephrotic syndrome, Outcome 4 Serum creatinine at end of study.
Figuras y tablas -
Analysis 4.4

Comparison 4 Cyclosporin and steroid therapy in first episode of childhood nephrotic syndrome, Outcome 4 Serum creatinine at end of study.

Comparison 5 Steroid therapy in relapse of nephrotic syndrome, Outcome 1 Number of children with further relapses by 9‐12 months.
Figuras y tablas -
Analysis 5.1

Comparison 5 Steroid therapy in relapse of nephrotic syndrome, Outcome 1 Number of children with further relapses by 9‐12 months.

Comparison 5 Steroid therapy in relapse of nephrotic syndrome, Outcome 2 Number of children relapsing during therapy.
Figuras y tablas -
Analysis 5.2

Comparison 5 Steroid therapy in relapse of nephrotic syndrome, Outcome 2 Number of children relapsing during therapy.

Comparison 5 Steroid therapy in relapse of nephrotic syndrome, Outcome 3 Mean relapse rate/patient/year.
Figuras y tablas -
Analysis 5.3

Comparison 5 Steroid therapy in relapse of nephrotic syndrome, Outcome 3 Mean relapse rate/patient/year.

Comparison 5 Steroid therapy in relapse of nephrotic syndrome, Outcome 4 Mean time to relapse.
Figuras y tablas -
Analysis 5.4

Comparison 5 Steroid therapy in relapse of nephrotic syndrome, Outcome 4 Mean time to relapse.

Comparison 5 Steroid therapy in relapse of nephrotic syndrome, Outcome 5 Cumulative steroid dose in g/m².
Figuras y tablas -
Analysis 5.5

Comparison 5 Steroid therapy in relapse of nephrotic syndrome, Outcome 5 Cumulative steroid dose in g/m².

Comparison 5 Steroid therapy in relapse of nephrotic syndrome, Outcome 6 Serious adverse events.
Figuras y tablas -
Analysis 5.6

Comparison 5 Steroid therapy in relapse of nephrotic syndrome, Outcome 6 Serious adverse events.

Comparison 5 Steroid therapy in relapse of nephrotic syndrome, Outcome 7 Mean time to remission.
Figuras y tablas -
Analysis 5.7

Comparison 5 Steroid therapy in relapse of nephrotic syndrome, Outcome 7 Mean time to remission.

Comparison 6 Prolonged steroid therapy (7 months) for relapsing nephrotic syndrome, Outcome 1 Number with relapses.
Figuras y tablas -
Analysis 6.1

Comparison 6 Prolonged steroid therapy (7 months) for relapsing nephrotic syndrome, Outcome 1 Number with relapses.

Comparison 6 Prolonged steroid therapy (7 months) for relapsing nephrotic syndrome, Outcome 2 Number with frequently relapsing or steroid dependent nephrotic syndrome.
Figuras y tablas -
Analysis 6.2

Comparison 6 Prolonged steroid therapy (7 months) for relapsing nephrotic syndrome, Outcome 2 Number with frequently relapsing or steroid dependent nephrotic syndrome.

Comparison 6 Prolonged steroid therapy (7 months) for relapsing nephrotic syndrome, Outcome 3 Relapse rate/patient/year.
Figuras y tablas -
Analysis 6.3

Comparison 6 Prolonged steroid therapy (7 months) for relapsing nephrotic syndrome, Outcome 3 Relapse rate/patient/year.

Comparison 6 Prolonged steroid therapy (7 months) for relapsing nephrotic syndrome, Outcome 4 Cumulative steroid dose in g/kg.
Figuras y tablas -
Analysis 6.4

Comparison 6 Prolonged steroid therapy (7 months) for relapsing nephrotic syndrome, Outcome 4 Cumulative steroid dose in g/kg.

Comparison 6 Prolonged steroid therapy (7 months) for relapsing nephrotic syndrome, Outcome 5 Adverse effects.
Figuras y tablas -
Analysis 6.5

Comparison 6 Prolonged steroid therapy (7 months) for relapsing nephrotic syndrome, Outcome 5 Adverse effects.

Comparison 7 Steroid therapy in first episode of childhood nephrotic syndrome, Outcome 1 Number of children relapsing by 12‐24 months after 3 months or more of prednisone versus 2 months.
Figuras y tablas -
Analysis 7.1

Comparison 7 Steroid therapy in first episode of childhood nephrotic syndrome, Outcome 1 Number of children relapsing by 12‐24 months after 3 months or more of prednisone versus 2 months.

Comparison 7 Steroid therapy in first episode of childhood nephrotic syndrome, Outcome 2 Number of children relapsing after 6 months of predisone therapy versus 3 months.
Figuras y tablas -
Analysis 7.2

Comparison 7 Steroid therapy in first episode of childhood nephrotic syndrome, Outcome 2 Number of children relapsing after 6 months of predisone therapy versus 3 months.

Table 1. Electronic search strategies

Database

Search terms

CENTRAL

#1 (Nephrotic and syndrome)
#2 Child
#3 Nephrosis*.ME
#4 Nephrosis‐Lipoid*.ME
#5 Nephrotic ‐ Syndrome*.ME
#6 #1 or #3 or #4 or #5
#7 #2 and #6

MEDLINE

1. exp nephrotic syndrome/ or nephrotic syndrome.tw.
2. exp nephrosis, lipoid/ or lipoid nephrosis.tw.
3. 1 or 2
4. exp child/ or child$.tw.
5. 3 and 4

EMBASE

1. exp nephrotic syndrome/ or nephrotic syndrome.tw.
2. exp steroid/ or steroids.tw
3. 1 and 2

Figuras y tablas -
Table 1. Electronic search strategies
Table 2. Assessment of study quality in trials of steroid therapy in nephrotic syndrome

Diagnosis

Study ID

Allocation concealed

Intention‐to‐treat

Follow‐up complete

Investigator/patient

Outcome assessors

Initial episode of nephrotic syndrome

Kleinknecht 1982

Adequate

Unclear

0% lost to follow‐up at 1 year

No blinding

Not stated

APN 1988

Adequate

No; 11.6% of 69 with SSNS withdrawn after randomisation

1.6% lost to follow‐up at 1 year

No blinding

Not stated

Ueda 1988

Inadequate

Unclear

0% lost to follow‐up at 1 year

No blinding

Not stated

APN 1993

adequate

No; 7.8% of 61 with SSNS withdrawn after randomisation

0% lost to follow‐up at 2 year

No blinding

Not stated

Ksiazek 1995

Inadequate

Yes

0% lost to follow‐up at 1 year

No blinding

Not stated

Norero 1996

Inadequate

No; 26% of 82 with SSNS withdrawn after randomisation excluded

0% lost to follow‐up at 1.5 years

No blinding

Not stated

Bagga 1999

Adequate

No: 4% of 47 with SSNS withdrawn after randomisation

0% lost to follow‐up at 1 year

No blinding

Not stated

Relapse of nephrotic syndrome

ISKDC 1979

Unclear

No; 17% of 64 withdrawn after randomisation

5.5% lost to follow‐up at 6‐9 months

No blinding

Not stated

APN 1981

Inadequate

No; 25% of 64 withdrawn after randomisation

0% lost to follow‐up at 1 year excluded

No blinding

Not stated

Imbasciali 1985

Adequate

Yes

0% lost to follow‐up at 12‐24 months

No blinding

Not stated

Ekka 1997

Unclear

Unclear

10% lost to follow‐up at 9 months

No blinding

Not stated

Broyer 1997

Adequate

No; 2.5% withdrawn after randomisation

2.5% lost to follow‐up at 1 year

Both

Not stated

Additional studies (2002)

Hiraoka 2000

Unclear

Yes

1.6% lost to follow‐up at 2 years

No blinding

Not stated

Jayantha 2002a

Adequate

No

11% lost to follow‐up in initial 3‐6 months & excluded from analysis

No blinding

No blinding

Leisti 1978

Unclear

Unclear

0% lost to follow‐up

Both

Not stated

Mattoo 2000

Inadequate

No

Children lost to follow‐up were excluded from analysis

No blinding

Not stated

Yoshikawa 1998

Adequate

Unclear

7.7% of 196 did not complete 2 year follow‐up & excluded from analysis

No blinding

Not stated

Jayantha 2002b

Adequate

No

20% of 95 lost to follow‐up at 1 year

No blinding

Not stated

Sharma 2002

Adequate

No

4% of 156 lost to follow‐up

No blinding

Not stated

Additional studies (2004)

Hiraoka 2003

Adequate

Yes

3% of 70 SSNS lost to follow‐up

No blinding

Not stated

APN VIII 1999

Adequate

No; 25% of 138 with SSNS withdrawn after randomisation

16% did not complete follow‐up

No blinding

Not stated

Pecoraro 2003

Inadequate

No

Unclear

No blinding

Not stated

Satomura 2001

Unclear

No

Unclear

No blinding

Not stated

Additional studies (2006)

Li 1994

Inadequate

Unclear

Unclear

No blinding

Not stated

Figuras y tablas -
Table 2. Assessment of study quality in trials of steroid therapy in nephrotic syndrome
Table 3. Outcomes of trials in children with relapsing nephrotic syndrome

Study ID

Relapse on therapy

Relapse by 9 months

Relapse by 12 months

Mean relapse rate

Steroid therapy

RR (95% CI)

RR (95% CI)

RR (95% CI)

MD (95% CI)

APN 1981

0.60 (0.36 to 1.02)

1.20 (0.93 to 1.55)

‐0.20 (‐0.65 to 0.25)

Alternate day versus intermittent

Broyer 1997

0.44 (0.25 to 0.78)

‐1.90 (‐2.77 to ‐1.03)

Deflazacort versus prednisone

Ekka 1997

1.07 (0.77 to 1.50)

Daily versus divided dose

Imbasciali 1985

1.06 (0.75 to 1.52)

IV and oral versus oral

ISKDC 1979

0.20 (0.05 to 0.82)

1.00 (0.89 to 1.12)

0.54 (‐0.50 to 1.58)

Daily versus intermittent

Jayantha 2002b

0.43 (0.29 to 0.65)

‐1.78 (‐2.30 to ‐1.26)

7 months therapy versus standard ISKDC regimen for relapse

Mattoo 2000

‐3.30 (‐4.03 to ‐2.57)

Daily versus alternate‐day in URTI

Figuras y tablas -
Table 3. Outcomes of trials in children with relapsing nephrotic syndrome
Table 4. Expected relapse rates in groups of children with different control event rates

Treated for 2 months

Additional 1 month

Additional 5 months

Relapse rate when treated for 2 months

Reduction in relapse rate for each additional 1 month of therapy above 2 months

Relapse rate if treated for an additional 5 months (total 7 months)

80%

9%

35%

60%

7%

25%

40%

4%

20%

20%

2%

10%

10%

1%

5%

Figuras y tablas -
Table 4. Expected relapse rates in groups of children with different control event rates
Comparison 1. Steroid therapy in first episode of nephrotic syndrome: comparisons with ISKDC standard therapy

Outcome or subgroup title

No. of studies

No. of participants

Statistical method

Effect size

1 Number of children relapsing by 6 months Show forest plot

7

Risk Ratio (M‐H, Random, 95% CI)

Subtotals only

1.1 Duration: 1 month versus 2 months (standard)

1

61

Risk Ratio (M‐H, Random, 95% CI)

1.60 [1.01, 2.54]

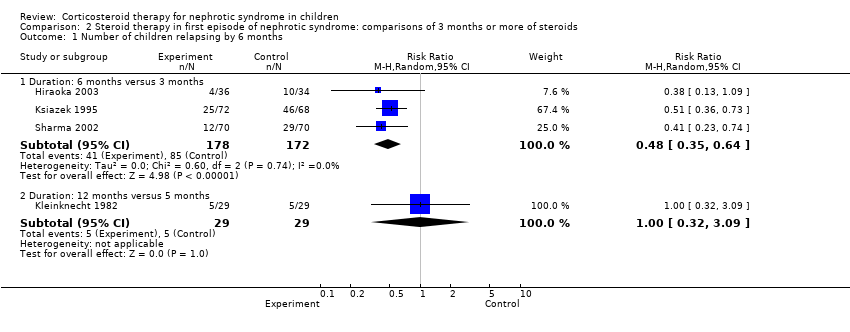
1.2 Duration: 3 months or more versus 2 months (standard)

5

400

Risk Ratio (M‐H, Random, 95% CI)

0.45 [0.28, 0.75]

1.3 Increased dose of prednisone versus standard dose

6

460

Risk Ratio (M‐H, Random, 95% CI)

0.48 [0.32, 0.71]

2 Number of children relapsing by 12‐24 months Show forest plot

9

Risk Ratio (M‐H, Random, 95% CI)

Subtotals only

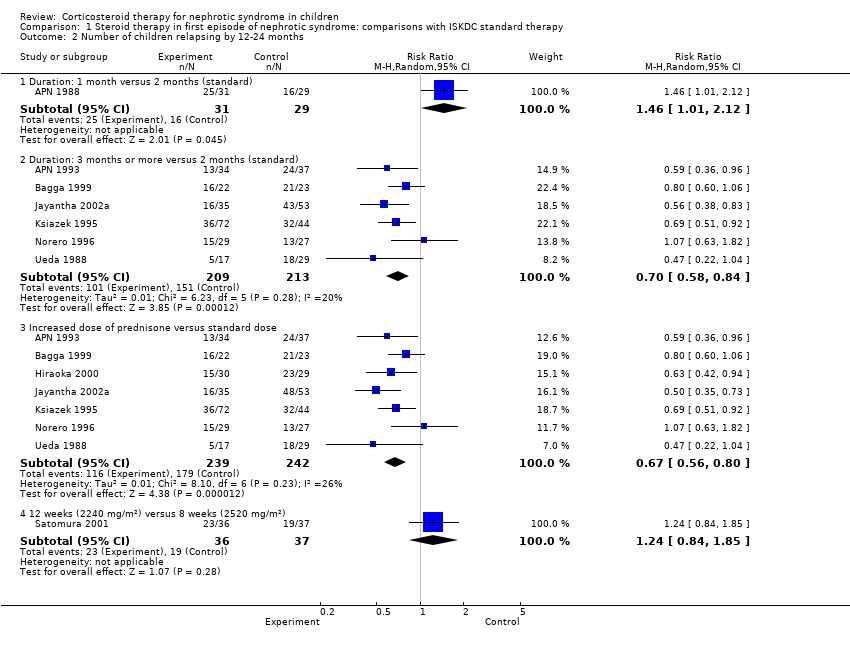
2.1 Duration: 1 month versus 2 months (standard)

1

60

Risk Ratio (M‐H, Random, 95% CI)

1.46 [1.01, 2.12]

2.2 Duration: 3 months or more versus 2 months (standard)

6

422

Risk Ratio (M‐H, Random, 95% CI)

0.70 [0.58, 0.84]

2.3 Increased dose of prednisone versus standard dose

7

481

Risk Ratio (M‐H, Random, 95% CI)

0.67 [0.56, 0.80]

2.4 12 weeks (2240 mg/m²) versus 8 weeks (2520 mg/m²)

1

73

Risk Ratio (M‐H, Random, 95% CI)

1.24 [0.84, 1.85]

3 Mean relapse rate/patient/year Show forest plot

4

Mean Difference (IV, Random, 95% CI)

Subtotals only

3.1 Duration: 3 months or more versus 2 months (standard)

4

295

Mean Difference (IV, Random, 95% CI)

‐0.65 [‐1.29, ‐0.00]

4 Number with frequent relapses Show forest plot

8

Risk Ratio (M‐H, Random, 95% CI)

Subtotals only

4.1 Duration: 1 month versus 2 months (standard)

1

61

Risk Ratio (M‐H, Random, 95% CI)

1.48 [0.85, 2.59]

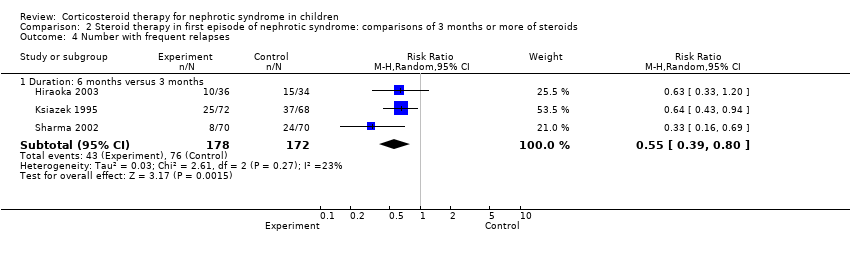
4.2 Duration: 3 months or more versus 2 months (standard)

6

452

Risk Ratio (M‐H, Random, 95% CI)

0.63 [0.46, 0.84]

4.3 Increased dose of prednisone versus standard dose (2240 mg/m²)

7

512

Risk Ratio (M‐H, Random, 95% CI)

0.64 [0.48, 0.84]

5 Cumulative steroid dose in g/m² Show forest plot

4

Mean Difference (IV, Random, 95% CI)

Subtotals only

5.1 Duration: 1 month versus 2 months (standard)

1

61

Mean Difference (IV, Random, 95% CI)

‐0.98 [‐1.28, ‐0.68]

5.2 Duration: 3 months or more versus 2 months (standard)

3

245

Mean Difference (IV, Random, 95% CI)

0.71 [‐0.67, 2.09]

6 Adverse events: increased prednisone dose versus standard duration Show forest plot

7

Risk Ratio (M‐H, Random, 95% CI)

Subtotals only

6.1 Psychological disorders

4

293

Risk Ratio (M‐H, Random, 95% CI)

2.44 [0.66, 9.06]

6.2 Hypertension

7

526

Risk Ratio (M‐H, Random, 95% CI)

1.60 [0.60, 4.28]

6.3 Opthalmological disorders

6

460

Risk Ratio (M‐H, Random, 95% CI)

0.82 [0.15, 4.42]

6.4 Retarded growth

4

354

Risk Ratio (M‐H, Random, 95% CI)

0.54 [0.25, 1.18]

6.5 Cushing's syndrome

4

292

Risk Ratio (M‐H, Random, 95% CI)

1.23 [0.78, 1.96]

6.6 Infections

2

172

Risk Ratio (M‐H, Random, 95% CI)

0.79 [0.53, 1.17]

6.7 Osteoporosis

3

233

Risk Ratio (M‐H, Random, 95% CI)

0.47 [0.06, 3.38]

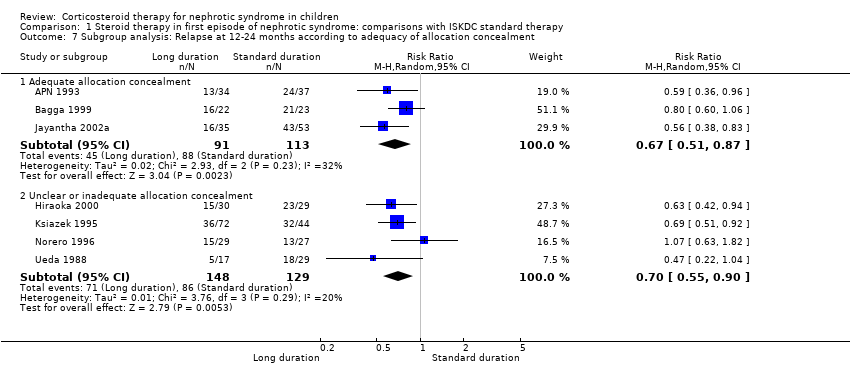
7 Subgroup analysis: Relapse at 12‐24 months according to adequacy of allocation concealment Show forest plot

7

Risk Ratio (M‐H, Random, 95% CI)

Subtotals only

7.1 Adequate allocation concealment

3

204

Risk Ratio (M‐H, Random, 95% CI)

0.67 [0.51, 0.87]

7.2 Unclear or inadequate allocation concealment

4

277

Risk Ratio (M‐H, Random, 95% CI)

0.70 [0.55, 0.90]

Figuras y tablas -
Comparison 1. Steroid therapy in first episode of nephrotic syndrome: comparisons with ISKDC standard therapy
Comparison 2. Steroid therapy in first episode of nephrotic syndrome: comparisons of 3 months or more of steroids

Outcome or subgroup title

No. of studies

No. of participants

Statistical method

Effect size

1 Number of children relapsing by 6 months Show forest plot

4

Risk Ratio (M‐H, Random, 95% CI)

Subtotals only

1.1 Duration: 6 months versus 3 months

3

350

Risk Ratio (M‐H, Random, 95% CI)

0.48 [0.35, 0.64]

1.2 Duration: 12 months versus 5 months

1

58

Risk Ratio (M‐H, Random, 95% CI)

1.0 [0.32, 3.09]

2 Number of children relapsing by 12‐24 months Show forest plot

6

Risk Ratio (M‐H, Random, 95% CI)

Subtotals only

2.1 Duration: 6 months versus 3 months

4

382

Risk Ratio (M‐H, Random, 95% CI)

0.57 [0.45, 0.71]

2.2 Duration: 12 months versus 5 months

1

58

Risk Ratio (M‐H, Random, 95% CI)

0.76 [0.51, 1.13]

2.3 High dose versus low dose given for same duration

2

91

Risk Ratio (M‐H, Random, 95% CI)

0.59 [0.42, 0.84]

3 Mean relapse rate/patient/year Show forest plot

2

Mean Difference (IV, Random, 95% CI)

Subtotals only

3.1 Duration: 6 months versus 3 months

2

280

Mean Difference (IV, Random, 95% CI)

‐0.44 [‐0.82, ‐0.07]

4 Number with frequent relapses Show forest plot

3

Risk Ratio (M‐H, Random, 95% CI)

Subtotals only

4.1 Duration: 6 months versus 3 months

3

350

Risk Ratio (M‐H, Random, 95% CI)

0.55 [0.39, 0.80]

5 Cumulative steroid dose in g/m² Show forest plot

2

Mean Difference (IV, Random, 95% CI)

Subtotals only

5.1 Duration: 6 months versus 3 months

2

280

Mean Difference (IV, Random, 95% CI)

‐1.55 [‐3.00, 1.90]

6 Adverse events: 6 months versus 3 months duration Show forest plot

3

Risk Ratio (M‐H, Random, 95% CI)

Subtotals only

6.1 Hypertension

3

349

Risk Ratio (M‐H, Random, 95% CI)

1.18 [0.65, 2.16]

6.2 Opthalmological

3

335

Risk Ratio (M‐H, Random, 95% CI)

0.39 [0.14, 1.08]

6.3 Infections

2

280

Risk Ratio (M‐H, Random, 95% CI)

1.09 [0.73, 1.62]

6.4 Cushing's syndrome

3

349

Risk Ratio (M‐H, Random, 95% CI)

0.78 [0.39, 1.59]

6.5 Gastrointestinal bleeding

1

140

Risk Ratio (M‐H, Random, 95% CI)

1.5 [0.26, 8.70]

6.6 Addisonian crisis

1

140

Risk Ratio (M‐H, Random, 95% CI)

0.5 [0.05, 5.39]

6.7 Psychological disorders

2

209

Risk Ratio (M‐H, Random, 95% CI)

0.08 [0.00, 1.45]

6.8 Growth

1

140

Risk Ratio (M‐H, Random, 95% CI)

1.26 [0.29, 5.42]

6.9 Osteoporosis

1

140

Risk Ratio (M‐H, Random, 95% CI)

0.0 [0.0, 0.0]

Figuras y tablas -
Comparison 2. Steroid therapy in first episode of nephrotic syndrome: comparisons of 3 months or more of steroids
Comparison 3. Steroid therapy and Sairei‐to in first episode of nephrotic syndrome

Outcome or subgroup title

No. of studies

No. of participants

Statistical method

Effect size

1 Long prednisone & Sairei‐to versus standard prednisone & Sairei‐to Show forest plot

1

Risk Ratio (M‐H, Random, 95% CI)

Totals not selected

1.1 Relapse at 2 years

1

Risk Ratio (M‐H, Random, 95% CI)

0.0 [0.0, 0.0]

1.2 Number with frequent relapses at 2 years

1

Risk Ratio (M‐H, Random, 95% CI)

0.0 [0.0, 0.0]

Figuras y tablas -
Comparison 3. Steroid therapy and Sairei‐to in first episode of nephrotic syndrome
Comparison 4. Cyclosporin and steroid therapy in first episode of childhood nephrotic syndrome

Outcome or subgroup title

No. of studies

No. of participants

Statistical method

Effect size

1 Relapse by 6 months Show forest plot

1

Risk Ratio (M‐H, Random, 95% CI)

Totals not selected

2 Relapse by 12 months Show forest plot

1

Risk Ratio (M‐H, Random, 95% CI)

Totals not selected

3 Number needing cytotoxic agents Show forest plot

1

Risk Ratio (M‐H, Random, 95% CI)

Totals not selected

4 Serum creatinine at end of study Show forest plot

1

Mean Difference (IV, Random, 95% CI)

Totals not selected

Figuras y tablas -
Comparison 4. Cyclosporin and steroid therapy in first episode of childhood nephrotic syndrome
Comparison 5. Steroid therapy in relapse of nephrotic syndrome

Outcome or subgroup title

No. of studies

No. of participants

Statistical method

Effect size

1 Number of children with further relapses by 9‐12 months Show forest plot

5

Risk Ratio (M‐H, Random, 95% CI)

Totals not selected

1.1 Single versus divided dose therapy (2 months therapy)

1

Risk Ratio (M‐H, Random, 95% CI)

0.0 [0.0, 0.0]

1.2 Intermittent dose versus alternate‐day therapy (6 months therapy)

1

Risk Ratio (M‐H, Random, 95% CI)

0.0 [0.0, 0.0]

1.3 Intravenous versus oral therapy (6 months therapy)

1

Risk Ratio (M‐H, Random, 95% CI)

0.0 [0.0, 0.0]

1.4 Deflazacort versus prednisone (12 months therapy)

1

Risk Ratio (M‐H, Random, 95% CI)

0.0 [0.0, 0.0]

1.5 Prolonged oral versus intermittent therapy (2 months therapy )

1

Risk Ratio (M‐H, Random, 95% CI)

0.0 [0.0, 0.0]

2 Number of children relapsing during therapy Show forest plot

2

Risk Ratio (M‐H, Random, 95% CI)

Totals not selected

2.1 Intermittent dose versus alternate‐day therapy (6 months therapy)

1

Risk Ratio (M‐H, Random, 95% CI)

0.0 [0.0, 0.0]

2.2 Daily versus intermittent therapy (2 months therapy)

1

Risk Ratio (M‐H, Random, 95% CI)

0.0 [0.0, 0.0]

3 Mean relapse rate/patient/year Show forest plot

4

Mean Difference (IV, Random, 95% CI)

Totals not selected

3.1 Single versus divided dose therapy (2 months therapy)

1

Mean Difference (IV, Random, 95% CI)

0.0 [0.0, 0.0]

3.2 Daily versus intermittent therapy (2 months therapy)

1

Mean Difference (IV, Random, 95% CI)

0.0 [0.0, 0.0]

3.3 Deflazacort versus prednisone (12 months therapy)

1

Mean Difference (IV, Random, 95% CI)

0.0 [0.0, 0.0]

3.4 Increased prednisone for URTI

1

Mean Difference (IV, Random, 95% CI)

0.0 [0.0, 0.0]

4 Mean time to relapse Show forest plot

2

Mean Difference (IV, Random, 95% CI)

Totals not selected

4.1 Single versus divided dose therapy (2 months therapy)

1

Mean Difference (IV, Random, 95% CI)

0.0 [0.0, 0.0]

4.2 Daily versus intermittent therapy (2 months therapy)

1

Mean Difference (IV, Random, 95% CI)

0.0 [0.0, 0.0]

5 Cumulative steroid dose in g/m² Show forest plot

1

Mean Difference (IV, Random, 95% CI)

Totals not selected

5.1 Single versus divided dose therapy (2 months therapy)

1

Mean Difference (IV, Random, 95% CI)

0.0 [0.0, 0.0]

6 Serious adverse events Show forest plot

2

Risk Ratio (M‐H, Random, 95% CI)

Subtotals only

6.1 Single versus divided dose therapy (2 months duration)

2

138

Risk Ratio (M‐H, Random, 95% CI)

0.41 [0.18, 0.91]

7 Mean time to remission Show forest plot

2

138

Mean Difference (IV, Random, 95% CI)

0.04 [‐0.98, 1.06]

Figuras y tablas -
Comparison 5. Steroid therapy in relapse of nephrotic syndrome
Comparison 6. Prolonged steroid therapy (7 months) for relapsing nephrotic syndrome

Outcome or subgroup title

No. of studies

No. of participants

Statistical method

Effect size

1 Number with relapses Show forest plot

1

Risk Ratio (M‐H, Random, 95% CI)

Totals not selected

1.1 Relapse by 6 months

1

Risk Ratio (M‐H, Random, 95% CI)

0.0 [0.0, 0.0]

1.2 Relapse by 12 months

1

Risk Ratio (M‐H, Random, 95% CI)

0.0 [0.0, 0.0]

1.3 Relapse by 2 years

1

Risk Ratio (M‐H, Random, 95% CI)

0.0 [0.0, 0.0]

1.4 Relapse by 3 years

1

Risk Ratio (M‐H, Random, 95% CI)

0.0 [0.0, 0.0]

2 Number with frequently relapsing or steroid dependent nephrotic syndrome Show forest plot

1

Risk Ratio (M‐H, Random, 95% CI)

Totals not selected

3 Relapse rate/patient/year Show forest plot

1

Mean Difference (IV, Random, 95% CI)

Totals not selected

3.1 Relapse rate at 1 year

1

Mean Difference (IV, Random, 95% CI)

0.0 [0.0, 0.0]

3.2 Relapse rate at 2 years

1

Mean Difference (IV, Random, 95% CI)

0.0 [0.0, 0.0]

3.3 Relapse rate at 3 years

1

Mean Difference (IV, Random, 95% CI)

0.0 [0.0, 0.0]

4 Cumulative steroid dose in g/kg Show forest plot

1

Mean Difference (IV, Random, 95% CI)

Totals not selected

4.1 After one year

1

Mean Difference (IV, Random, 95% CI)

0.0 [0.0, 0.0]

4.2 After two years

1

Mean Difference (IV, Random, 95% CI)

0.0 [0.0, 0.0]

4.3 After three years

1

Mean Difference (IV, Random, 95% CI)

0.0 [0.0, 0.0]

5 Adverse effects Show forest plot

1

Risk Ratio (M‐H, Random, 95% CI)

Totals not selected

5.1 Number with hypertension

1

Risk Ratio (M‐H, Random, 95% CI)

0.0 [0.0, 0.0]

5.2 Number with growth failure

1

Risk Ratio (M‐H, Random, 95% CI)

0.0 [0.0, 0.0]

Figuras y tablas -
Comparison 6. Prolonged steroid therapy (7 months) for relapsing nephrotic syndrome
Comparison 7. Steroid therapy in first episode of childhood nephrotic syndrome

Outcome or subgroup title

No. of studies

No. of participants

Statistical method

Effect size

1 Number of children relapsing by 12‐24 months after 3 months or more of prednisone versus 2 months Show forest plot

6

422

Risk Ratio (M‐H, Random, 95% CI)

0.70 [0.58, 0.84]

2 Number of children relapsing after 6 months of predisone therapy versus 3 months Show forest plot

4

382

Risk Ratio (M‐H, Random, 95% CI)

0.57 [0.45, 0.71]

Figuras y tablas -
Comparison 7. Steroid therapy in first episode of childhood nephrotic syndrome