Oral non‐steroidal anti‐inflammatory drug therapy for lung disease in cystic fibrosis
Información
- DOI:
- https://doi.org/10.1002/14651858.CD001505.pub5Copiar DOI

- Base de datos:
-
- Cochrane Database of Systematic Reviews
- Versión publicada:
-
- 09 septiembre 2019see what's new
- Tipo:
-
- Intervention
- Etapa:
-
- Review
- Grupo Editorial Cochrane:
-
Grupo Cochrane de Fibrosis quística y enfermedades genéticas
- Copyright:
-
- Copyright © 2019 The Cochrane Collaboration. Published by John Wiley & Sons, Ltd.
Cifras del artículo
Altmetric:
Citado por:
Autores
Contributions of authors
Anna Crighton had the original idea for the review, drafted the protocol, extracted data and co‐authored the review. Carol Dezateux drafted the protocol and data extraction forms, extracted and analyzed data and was responsible for writing the review.
Anna Crighton and Carol Dezateux stepped down from the review as from February 2006.
Larry Lands took over as lead reviewer in May 2004. He led on the update of the review and acts as guarantor of the review.
Sanja Stanojevic joined the review in June 2006. She extracted and analyzed data for the subsequent updates and co‐authored the review.
Sources of support
Internal sources
-
Institute of Child Health, Ninewells Hospital and Medical School, Dundee DD1 9SY, UK.
External sources
-
Tenovus, Scotland, UK.
-
National Institute for Health Research, UK.
This systematic review was supported by the National Institute for Health Research, via Cochrane Infrastructure funding to the Cochrane Cystic Fibrosis and Genetic Disorders Group.
Declarations of interest
Dr Larry Lands was the lead investigator in the Trans‐Canadian Trial (Lands 2007). He is also the chief medical advisor for a phase II trial currently underway of fenretinide for CF adults as an anti‐inflammatory therapy; this drug is not eligible for inclusion in this review.
Dr Sanja Stanojevic declares no known conflict of interest.
Acknowledgements
We are grateful to Professor Rosalind Smyth, Jill Motley, Nikki Jahnke and the Cochrane Cystic Fibrosis and Genetic Disorders Editorial Group for their invaluable support; to Professor Carol Dezateux and Anna Crighton for their input into previous versions of this review; to Dr Michael Konstan for his helpful comments on an earlier draft of the original review; and to Dr Somnath Mukhopadhyay for his encouragement.
This project was supported by the National Institute for Health Research, via Cochrane Infrastructure funding to the Cochrane Cystic Fibrosis and Genetic Disorders Group. The views and opinions expressed therein are those of the authors and do not necessarily reflect those of the Systematic Reviews Programme, NIHR, NHS or the Department of Health.
Version history
| Published | Title | Stage | Authors | Version |
| 2019 Sep 09 | Oral non‐steroidal anti‐inflammatory drug therapy for lung disease in cystic fibrosis | Review | Larry C Lands, Sanja Stanojevic | |
| 2016 Apr 07 | Oral non‐steroidal anti‐inflammatory drug therapy for lung disease in cystic fibrosis | Review | Larry C Lands, Sanja Stanojevic | |
| 2013 Jun 13 | Oral non‐steroidal anti‐inflammatory drug therapy for lung disease in cystic fibrosis | Review | Larry C Lands, Sanja Stanojevic | |
| 2007 Oct 17 | Oral non‐steroidal anti‐inflammatory drug therapy for lung disease in cystic fibrosis | Review | Larry C Lands, Sanja Stanojevic | |
| 1999 Apr 26 | Oral non‐steroidal anti‐inflammatory drug therapy for cystic fibrosis | Review | Larry C Lands, Carol Dezateux, A Crighton, Sanja Stanojevic | |
Differences between protocol and review
There was a post hoc subgroup analysis of the lung function data split by age (two groups: 'under 13 years at randomisation' and '13 years and over at randomisation').
Keywords
MeSH
Medical Subject Headings (MeSH) Keywords
Medical Subject Headings Check Words
Adolescent; Adult; Child; Female; Humans; Male; Young Adult;
PICO

Comparison 1 Oral nonsteroidal anti‐inflammatory drug versus placebo, Outcome 1 Annual rate of change in % predicted FEV1.

Comparison 1 Oral nonsteroidal anti‐inflammatory drug versus placebo, Outcome 2 Annual rate of change in % predicted FEV1 (split by age).
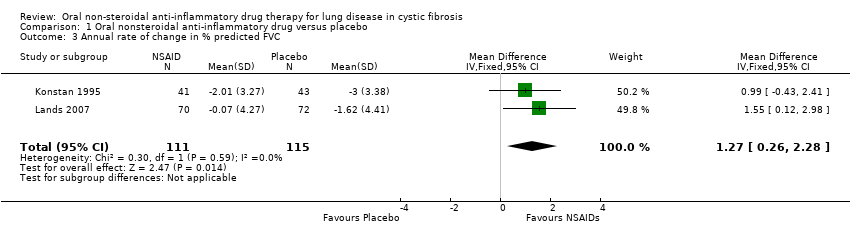
Comparison 1 Oral nonsteroidal anti‐inflammatory drug versus placebo, Outcome 3 Annual rate of change in % predicted FVC.

Comparison 1 Oral nonsteroidal anti‐inflammatory drug versus placebo, Outcome 4 Annual rate of change in % predicted FVC (split by age).
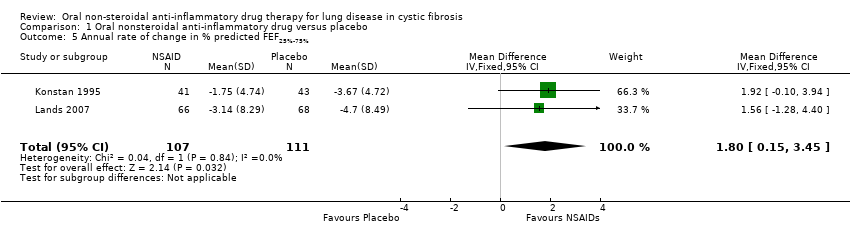
Comparison 1 Oral nonsteroidal anti‐inflammatory drug versus placebo, Outcome 5 Annual rate of change in % predicted FEF25%‐75%.

Comparison 1 Oral nonsteroidal anti‐inflammatory drug versus placebo, Outcome 6 Annual rate of change in % predicted FEF25%‐75% (split by age).
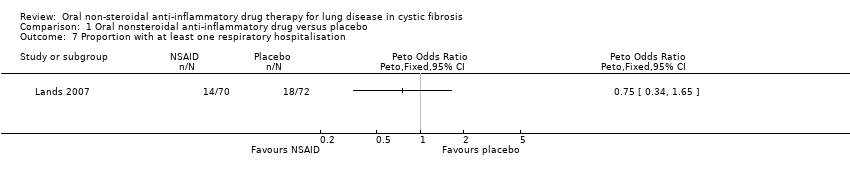
Comparison 1 Oral nonsteroidal anti‐inflammatory drug versus placebo, Outcome 7 Proportion with at least one respiratory hospitalisation.
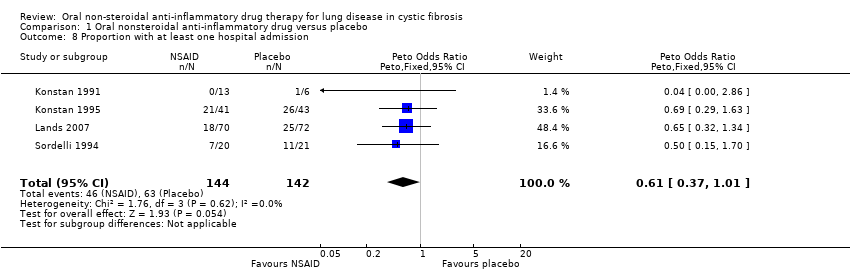
Comparison 1 Oral nonsteroidal anti‐inflammatory drug versus placebo, Outcome 8 Proportion with at least one hospital admission.

Comparison 1 Oral nonsteroidal anti‐inflammatory drug versus placebo, Outcome 9 Number of deaths.
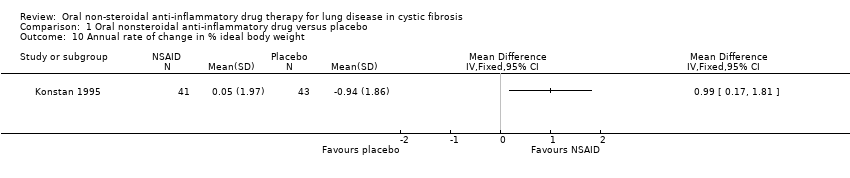
Comparison 1 Oral nonsteroidal anti‐inflammatory drug versus placebo, Outcome 10 Annual rate of change in % ideal body weight.

Comparison 1 Oral nonsteroidal anti‐inflammatory drug versus placebo, Outcome 11 Annual rate of change in % ideal body weight (split by age).
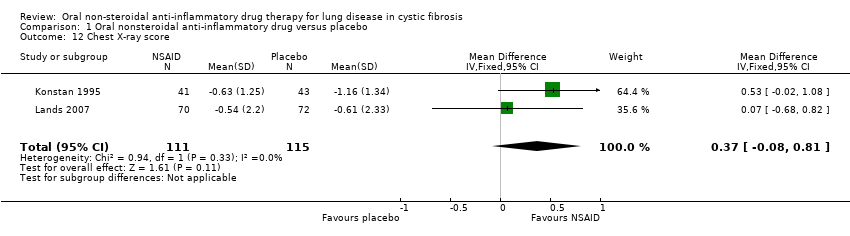
Comparison 1 Oral nonsteroidal anti‐inflammatory drug versus placebo, Outcome 12 Chest X‐ray score.

Comparison 1 Oral nonsteroidal anti‐inflammatory drug versus placebo, Outcome 13 Chest X‐ray score (split by age).

Comparison 1 Oral nonsteroidal anti‐inflammatory drug versus placebo, Outcome 14 Increase in abdominal pain.

Comparison 1 Oral nonsteroidal anti‐inflammatory drug versus placebo, Outcome 15 Decrease in abdominal pain.
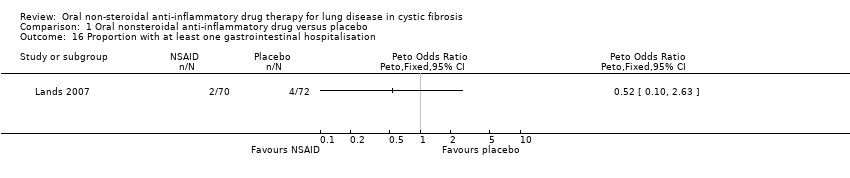
Comparison 1 Oral nonsteroidal anti‐inflammatory drug versus placebo, Outcome 16 Proportion with at least one gastrointestinal hospitalisation.

Comparison 1 Oral nonsteroidal anti‐inflammatory drug versus placebo, Outcome 17 Stool frequency.
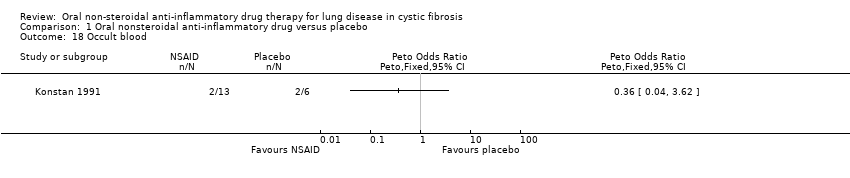
Comparison 1 Oral nonsteroidal anti‐inflammatory drug versus placebo, Outcome 18 Occult blood.
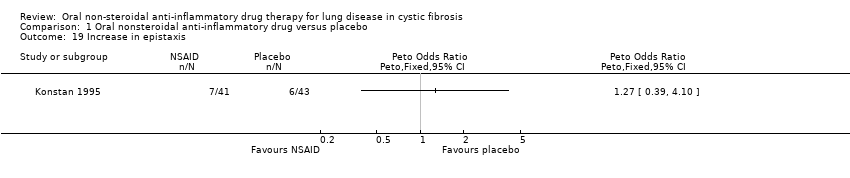
Comparison 1 Oral nonsteroidal anti‐inflammatory drug versus placebo, Outcome 19 Increase in epistaxis.
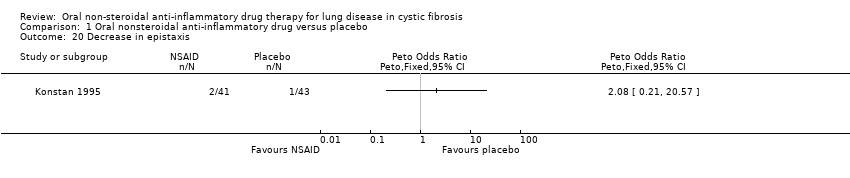
Comparison 1 Oral nonsteroidal anti‐inflammatory drug versus placebo, Outcome 20 Decrease in epistaxis.
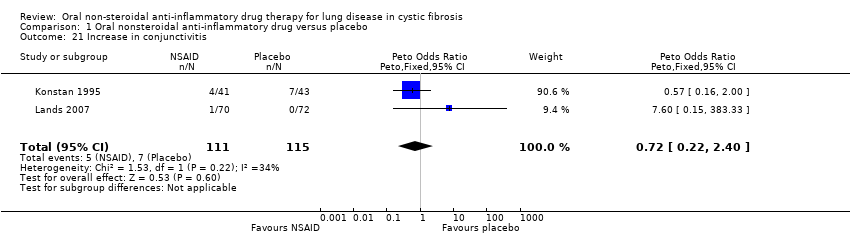
Comparison 1 Oral nonsteroidal anti‐inflammatory drug versus placebo, Outcome 21 Increase in conjunctivitis.

Comparison 1 Oral nonsteroidal anti‐inflammatory drug versus placebo, Outcome 22 Decrease in conjunctivitis.

Comparison 1 Oral nonsteroidal anti‐inflammatory drug versus placebo, Outcome 23 Increase in nausea.
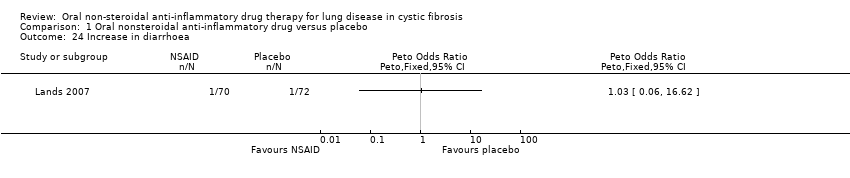
Comparison 1 Oral nonsteroidal anti‐inflammatory drug versus placebo, Outcome 24 Increase in diarrhoea.
| Non‐steroidal anti‐inflammatory drugs compared with placebo for lung disease in cystic fibrosis | ||||||
| Patients or population: adults and children with cystic fibrosis Settings: outpatient Intervention: NSAIDs Comparison: placebo | ||||||
| Outcomes | Illustrative comparative risks* (95% CI) | Relative effect | No of participants | Quality of the evidence | Comments | |
| Assumed risk | Corresponding risk | |||||
| Placebo | NSAIDs | |||||
| Annual rate of change in % predicted FEV1 All participants | The mean annual rate of change in FEV1 % predicted in the placebo group was ‐3.15%. | The mean annual rate of change in FEV1 % predicted in the NSAIDs group was 1.32% higher (0.21 higher to 2.42 higher). | NA | 226 (2 studies) | ⊕⊕⊕⊝ | |
| Annual rate of change in % predicted FEV1 Subgroup: under 13 years of age | The mean annual rate of change in FEV1 % predicted in the placebo group was ‐3.32%. | The mean annual rate of change in FEV1 % predicted for under 13 year olds in the NSAIDs group was 1.41% higher (0.03 higher to 2.80 higher). | NA | 147 (2 studies) | ⊕⊕⊕⊝ | |
| Annual rate of change in % predicted FEV1 Subgroup: over 13 years of age | The mean annual rate of change in FEV1 % predicted in the placebo group was ‐3.18%. | The mean annual rate of change in FEV1 % predicted for over 13 year olds in the NSAIDs group was 0.75% higher (1.02 lower to 2.52 higher). | NA | 79 (2 studies) | ⊕⊕⊕⊝ | |
| Annual rate of change in % predicted FVC All participants | The mean annual rate of change in FVC % predicted in the placebo group was ‐2.31%. | The mean annual rate of change in FVC % predicted in the NSAIDs group was 1.27% higher (0.26 higher to 2.28 higher). | NA | 226 (2 studies) | ⊕⊕⊕⊝ | |
| Annual rate of change in % predicted FVC Subgroup: Under 13 years of age | The mean annual rate of change in FVC % predicted in the placebo group was ‐2.65%. | The mean annual rate of change in FVC % predicted for under 13 year olds in the NSAIDs group was 1.32% higher (0.04 higher to 2.60 higher). | 147 (2 studies) | ⊕⊕⊕⊝ | ||
| Annual rate of change in % predicted FVC Subgroup: Over 13 years of age | The mean annual rate of change in FVC % predicted in the placebo group was ‐2.03%. | The mean annual rate of change in FVC % predicted for over 13 year olds in the NSAIDs group was 0.78% higher (0.71 lower to 2.27 higher). | 79 (2 studies) | ⊕⊕⊕⊝ | ||
| Proportion with at least 1 hospital admission | 440 per 1000 | 268 per 1000 (163 to 444) | OR 0.61 (0.37 to 1.01) | 286 (4 studies) | ⊕⊕⊕⊝ | |
| *The basis for the assumed risk (e.g. the median control group risk across studies) is provided in footnotes. The corresponding risk (and its 95% confidence interval) is based on the assumed risk in the comparison group and the relative effect of the intervention (and its 95% CI). | ||||||
| GRADE Working Group grades of evidence | ||||||
| 1. Downgraded once due to high risk of bias due to selective reporting. | ||||||
| Outcome or subgroup title | No. of studies | No. of participants | Statistical method | Effect size |
| 1 Annual rate of change in % predicted FEV1 Show forest plot | 2 | 226 | Mean Difference (IV, Fixed, 95% CI) | 1.32 [0.21, 2.42] |
| 2 Annual rate of change in % predicted FEV1 (split by age) Show forest plot | 2 | 226 | Mean Difference (IV, Fixed, 95% CI) | 1.16 [0.07, 2.25] |
| 2.1 Under 13 years at randomisation | 2 | 147 | Mean Difference (IV, Fixed, 95% CI) | 1.41 [0.03, 2.80] |
| 2.2 13 years or over at randomisation | 2 | 79 | Mean Difference (IV, Fixed, 95% CI) | 0.75 [‐1.02, 2.52] |
| 3 Annual rate of change in % predicted FVC Show forest plot | 2 | 226 | Mean Difference (IV, Fixed, 95% CI) | 1.27 [0.26, 2.28] |
| 4 Annual rate of change in % predicted FVC (split by age) Show forest plot | 2 | 226 | Mean Difference (IV, Fixed, 95% CI) | 1.09 [0.12, 2.06] |
| 4.1 Under 13 years at randomisation | 2 | 147 | Mean Difference (IV, Fixed, 95% CI) | 1.32 [0.04, 2.60] |
| 4.2 13 years and over at randomisation | 2 | 79 | Mean Difference (IV, Fixed, 95% CI) | 0.78 [‐0.71, 2.27] |
| 5 Annual rate of change in % predicted FEF25%‐75% Show forest plot | 2 | 218 | Mean Difference (IV, Fixed, 95% CI) | 1.80 [0.15, 3.45] |
| 6 Annual rate of change in % predicted FEF25%‐75% (split by age) Show forest plot | 2 | 214 | Mean Difference (IV, Fixed, 95% CI) | 1.72 [0.10, 3.34] |
| 6.1 Under 13 years at randomisation | 2 | 138 | Mean Difference (IV, Fixed, 95% CI) | 2.03 [‐0.09, 4.16] |
| 6.2 13 years or older at randomisation | 2 | 76 | Mean Difference (IV, Fixed, 95% CI) | 1.28 [‐1.22, 3.79] |
| 7 Proportion with at least one respiratory hospitalisation Show forest plot | 1 | Peto Odds Ratio (Peto, Fixed, 95% CI) | Totals not selected | |
| 8 Proportion with at least one hospital admission Show forest plot | 4 | 286 | Peto Odds Ratio (Peto, Fixed, 95% CI) | 0.61 [0.37, 1.01] |
| 9 Number of deaths Show forest plot | 3 | 245 | Peto Odds Ratio (Peto, Fixed, 95% CI) | 0.0 [0.0, 0.0] |
| 10 Annual rate of change in % ideal body weight Show forest plot | 1 | Mean Difference (IV, Fixed, 95% CI) | Totals not selected | |
| 11 Annual rate of change in % ideal body weight (split by age) Show forest plot | 1 | 84 | Mean Difference (IV, Fixed, 95% CI) | 0.81 [0.08, 1.53] |
| 11.1 Under 13 years at randomisation | 1 | 49 | Mean Difference (IV, Fixed, 95% CI) | 1.45 [0.33, 2.57] |
| 11.2 13 years or older at randomisation | 1 | 35 | Mean Difference (IV, Fixed, 95% CI) | 0.34 [‐0.61, 1.29] |
| 12 Chest X‐ray score Show forest plot | 2 | 226 | Mean Difference (IV, Fixed, 95% CI) | 0.37 [‐0.08, 0.81] |
| 13 Chest X‐ray score (split by age) Show forest plot | 1 | 84 | Mean Difference (IV, Fixed, 95% CI) | 0.51 [‐0.04, 1.07] |
| 13.1 Under 13 years at randomisation | 1 | 49 | Mean Difference (IV, Fixed, 95% CI) | 0.45 [‐0.24, 1.14] |
| 13.2 13 years or older at randomisation | 1 | 35 | Mean Difference (IV, Fixed, 95% CI) | 0.63 [‐0.30, 1.56] |
| 14 Increase in abdominal pain Show forest plot | 2 | 226 | Peto Odds Ratio (Peto, Fixed, 95% CI) | 0.54 [0.20, 1.48] |
| 15 Decrease in abdominal pain Show forest plot | 1 | Peto Odds Ratio (Peto, Fixed, 95% CI) | Totals not selected | |
| 16 Proportion with at least one gastrointestinal hospitalisation Show forest plot | 1 | Peto Odds Ratio (Peto, Fixed, 95% CI) | Totals not selected | |
| 17 Stool frequency Show forest plot | 1 | Peto Odds Ratio (Peto, Fixed, 95% CI) | Totals not selected | |
| 18 Occult blood Show forest plot | 1 | Peto Odds Ratio (Peto, Fixed, 95% CI) | Totals not selected | |
| 19 Increase in epistaxis Show forest plot | 1 | Peto Odds Ratio (Peto, Fixed, 95% CI) | Totals not selected | |
| 20 Decrease in epistaxis Show forest plot | 1 | Peto Odds Ratio (Peto, Fixed, 95% CI) | Totals not selected | |
| 21 Increase in conjunctivitis Show forest plot | 2 | 226 | Peto Odds Ratio (Peto, Fixed, 95% CI) | 0.72 [0.22, 2.40] |
| 22 Decrease in conjunctivitis Show forest plot | 1 | Peto Odds Ratio (Peto, Fixed, 95% CI) | Totals not selected | |
| 23 Increase in nausea Show forest plot | 1 | Peto Odds Ratio (Peto, Fixed, 95% CI) | Totals not selected | |
| 24 Increase in diarrhoea Show forest plot | 1 | Peto Odds Ratio (Peto, Fixed, 95% CI) | Totals not selected | |