درمان بیماری ریوی در فیبروز سیستیک با استفاده از داروهای غیراستروئیدی ضدالتهابی خوراکی
Appendices
Appendix 1. Additional electronic searches
| Database | Search terms |
| clinicaltrials.gov | cystic fibrosis AND inflammatory |
| WHO ICTRP | cystic fibrosis AND NSAID OR cystic fibrosis AND ibuprofen |

Comparison 1 Oral nonsteroidal anti‐inflammatory drug versus placebo, Outcome 1 Annual rate of change in % predicted FEV1.

Comparison 1 Oral nonsteroidal anti‐inflammatory drug versus placebo, Outcome 2 Annual rate of change in % predicted FEV1 (split by age).
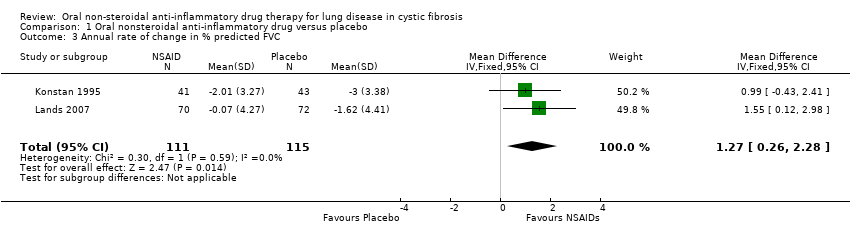
Comparison 1 Oral nonsteroidal anti‐inflammatory drug versus placebo, Outcome 3 Annual rate of change in % predicted FVC.

Comparison 1 Oral nonsteroidal anti‐inflammatory drug versus placebo, Outcome 4 Annual rate of change in % predicted FVC (split by age).
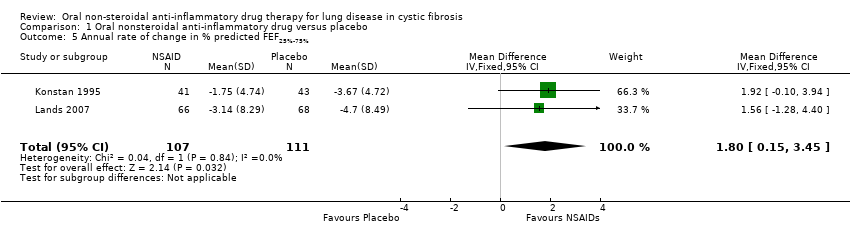
Comparison 1 Oral nonsteroidal anti‐inflammatory drug versus placebo, Outcome 5 Annual rate of change in % predicted FEF25%‐75%.

Comparison 1 Oral nonsteroidal anti‐inflammatory drug versus placebo, Outcome 6 Annual rate of change in % predicted FEF25%‐75% (split by age).
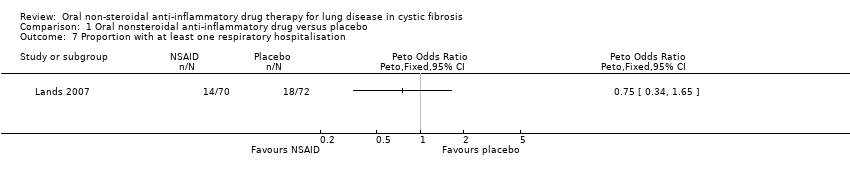
Comparison 1 Oral nonsteroidal anti‐inflammatory drug versus placebo, Outcome 7 Proportion with at least one respiratory hospitalisation.
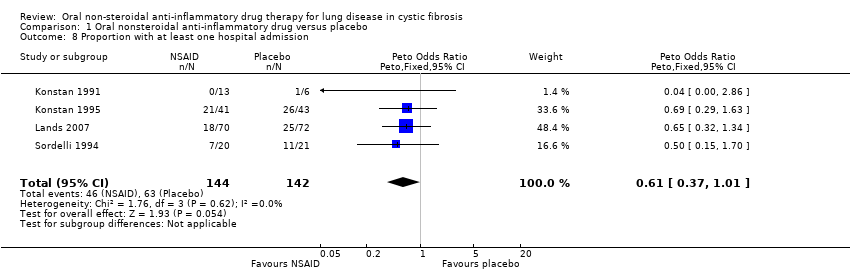
Comparison 1 Oral nonsteroidal anti‐inflammatory drug versus placebo, Outcome 8 Proportion with at least one hospital admission.

Comparison 1 Oral nonsteroidal anti‐inflammatory drug versus placebo, Outcome 9 Number of deaths.
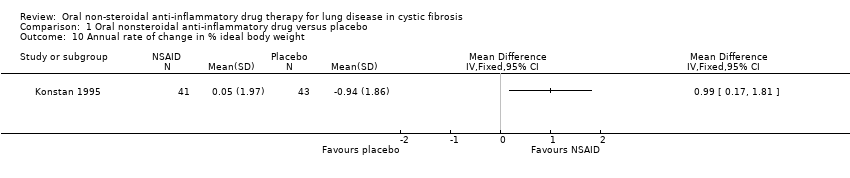
Comparison 1 Oral nonsteroidal anti‐inflammatory drug versus placebo, Outcome 10 Annual rate of change in % ideal body weight.

Comparison 1 Oral nonsteroidal anti‐inflammatory drug versus placebo, Outcome 11 Annual rate of change in % ideal body weight (split by age).
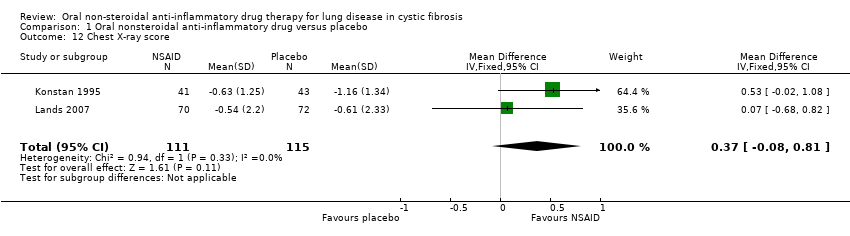
Comparison 1 Oral nonsteroidal anti‐inflammatory drug versus placebo, Outcome 12 Chest X‐ray score.

Comparison 1 Oral nonsteroidal anti‐inflammatory drug versus placebo, Outcome 13 Chest X‐ray score (split by age).

Comparison 1 Oral nonsteroidal anti‐inflammatory drug versus placebo, Outcome 14 Increase in abdominal pain.

Comparison 1 Oral nonsteroidal anti‐inflammatory drug versus placebo, Outcome 15 Decrease in abdominal pain.
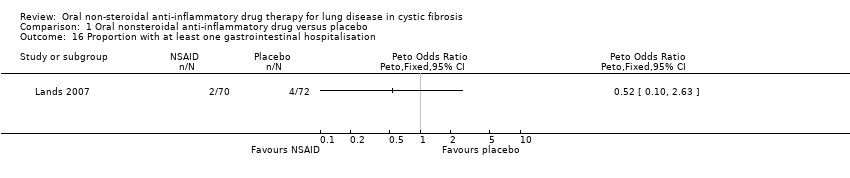
Comparison 1 Oral nonsteroidal anti‐inflammatory drug versus placebo, Outcome 16 Proportion with at least one gastrointestinal hospitalisation.

Comparison 1 Oral nonsteroidal anti‐inflammatory drug versus placebo, Outcome 17 Stool frequency.
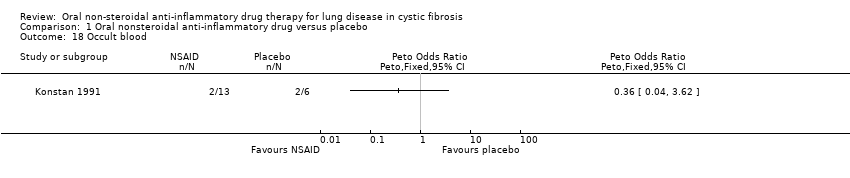
Comparison 1 Oral nonsteroidal anti‐inflammatory drug versus placebo, Outcome 18 Occult blood.
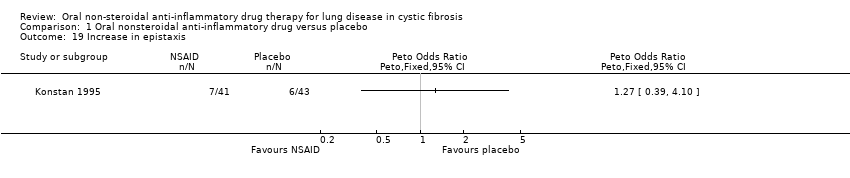
Comparison 1 Oral nonsteroidal anti‐inflammatory drug versus placebo, Outcome 19 Increase in epistaxis.
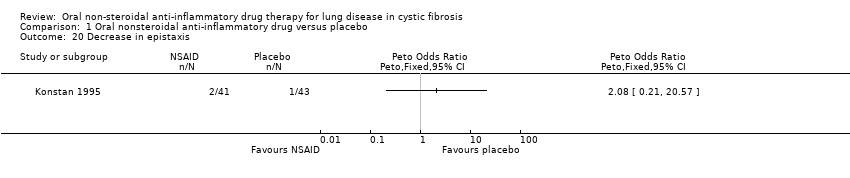
Comparison 1 Oral nonsteroidal anti‐inflammatory drug versus placebo, Outcome 20 Decrease in epistaxis.
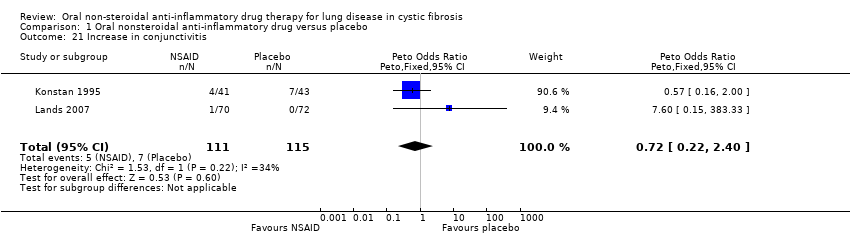
Comparison 1 Oral nonsteroidal anti‐inflammatory drug versus placebo, Outcome 21 Increase in conjunctivitis.

Comparison 1 Oral nonsteroidal anti‐inflammatory drug versus placebo, Outcome 22 Decrease in conjunctivitis.

Comparison 1 Oral nonsteroidal anti‐inflammatory drug versus placebo, Outcome 23 Increase in nausea.
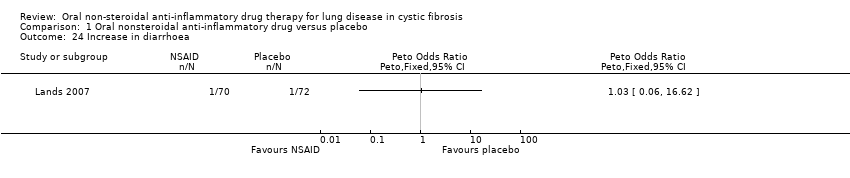
Comparison 1 Oral nonsteroidal anti‐inflammatory drug versus placebo, Outcome 24 Increase in diarrhoea.
| Non‐steroidal anti‐inflammatory drugs compared with placebo for lung disease in cystic fibrosis | ||||||
| Patients or population: adults and children with cystic fibrosis Settings: outpatient Intervention: NSAIDs Comparison: placebo | ||||||
| Outcomes | Illustrative comparative risks* (95% CI) | Relative effect | No of participants | Quality of the evidence | Comments | |
| Assumed risk | Corresponding risk | |||||
| Placebo | NSAIDs | |||||
| Annual rate of change in % predicted FEV1 All participants | The mean annual rate of change in FEV1 % predicted in the placebo group was ‐3.15%. | The mean annual rate of change in FEV1 % predicted in the NSAIDs group was 1.32% higher (0.21 higher to 2.42 higher). | NA | 226 (2 studies) | ⊕⊕⊕⊝ | |
| Annual rate of change in % predicted FEV1 Subgroup: under 13 years of age | The mean annual rate of change in FEV1 % predicted in the placebo group was ‐3.32%. | The mean annual rate of change in FEV1 % predicted for under 13 year olds in the NSAIDs group was 1.41% higher (0.03 higher to 2.80 higher). | NA | 147 (2 studies) | ⊕⊕⊕⊝ | |
| Annual rate of change in % predicted FEV1 Subgroup: over 13 years of age | The mean annual rate of change in FEV1 % predicted in the placebo group was ‐3.18%. | The mean annual rate of change in FEV1 % predicted for over 13 year olds in the NSAIDs group was 0.75% higher (1.02 lower to 2.52 higher). | NA | 79 (2 studies) | ⊕⊕⊕⊝ | |
| Annual rate of change in % predicted FVC All participants | The mean annual rate of change in FVC % predicted in the placebo group was ‐2.31%. | The mean annual rate of change in FVC % predicted in the NSAIDs group was 1.27% higher (0.26 higher to 2.28 higher). | NA | 226 (2 studies) | ⊕⊕⊕⊝ | |
| Annual rate of change in % predicted FVC Subgroup: Under 13 years of age | The mean annual rate of change in FVC % predicted in the placebo group was ‐2.65%. | The mean annual rate of change in FVC % predicted for under 13 year olds in the NSAIDs group was 1.32% higher (0.04 higher to 2.60 higher). | 147 (2 studies) | ⊕⊕⊕⊝ | ||
| Annual rate of change in % predicted FVC Subgroup: Over 13 years of age | The mean annual rate of change in FVC % predicted in the placebo group was ‐2.03%. | The mean annual rate of change in FVC % predicted for over 13 year olds in the NSAIDs group was 0.78% higher (0.71 lower to 2.27 higher). | 79 (2 studies) | ⊕⊕⊕⊝ | ||
| Proportion with at least 1 hospital admission | 440 per 1000 | 268 per 1000 (163 to 444) | OR 0.61 (0.37 to 1.01) | 286 (4 studies) | ⊕⊕⊕⊝ | |
| *The basis for the assumed risk (e.g. the median control group risk across studies) is provided in footnotes. The corresponding risk (and its 95% confidence interval) is based on the assumed risk in the comparison group and the relative effect of the intervention (and its 95% CI). | ||||||
| GRADE Working Group grades of evidence | ||||||
| 1. Downgraded once due to high risk of bias due to selective reporting. | ||||||
| Outcome or subgroup title | No. of studies | No. of participants | Statistical method | Effect size |
| 1 Annual rate of change in % predicted FEV1 Show forest plot | 2 | 226 | Mean Difference (IV, Fixed, 95% CI) | 1.32 [0.21, 2.42] |
| 2 Annual rate of change in % predicted FEV1 (split by age) Show forest plot | 2 | 226 | Mean Difference (IV, Fixed, 95% CI) | 1.16 [0.07, 2.25] |
| 2.1 Under 13 years at randomisation | 2 | 147 | Mean Difference (IV, Fixed, 95% CI) | 1.41 [0.03, 2.80] |
| 2.2 13 years or over at randomisation | 2 | 79 | Mean Difference (IV, Fixed, 95% CI) | 0.75 [‐1.02, 2.52] |
| 3 Annual rate of change in % predicted FVC Show forest plot | 2 | 226 | Mean Difference (IV, Fixed, 95% CI) | 1.27 [0.26, 2.28] |
| 4 Annual rate of change in % predicted FVC (split by age) Show forest plot | 2 | 226 | Mean Difference (IV, Fixed, 95% CI) | 1.09 [0.12, 2.06] |
| 4.1 Under 13 years at randomisation | 2 | 147 | Mean Difference (IV, Fixed, 95% CI) | 1.32 [0.04, 2.60] |
| 4.2 13 years and over at randomisation | 2 | 79 | Mean Difference (IV, Fixed, 95% CI) | 0.78 [‐0.71, 2.27] |
| 5 Annual rate of change in % predicted FEF25%‐75% Show forest plot | 2 | 218 | Mean Difference (IV, Fixed, 95% CI) | 1.80 [0.15, 3.45] |
| 6 Annual rate of change in % predicted FEF25%‐75% (split by age) Show forest plot | 2 | 214 | Mean Difference (IV, Fixed, 95% CI) | 1.72 [0.10, 3.34] |
| 6.1 Under 13 years at randomisation | 2 | 138 | Mean Difference (IV, Fixed, 95% CI) | 2.03 [‐0.09, 4.16] |
| 6.2 13 years or older at randomisation | 2 | 76 | Mean Difference (IV, Fixed, 95% CI) | 1.28 [‐1.22, 3.79] |
| 7 Proportion with at least one respiratory hospitalisation Show forest plot | 1 | Peto Odds Ratio (Peto, Fixed, 95% CI) | Totals not selected | |
| 8 Proportion with at least one hospital admission Show forest plot | 4 | 286 | Peto Odds Ratio (Peto, Fixed, 95% CI) | 0.61 [0.37, 1.01] |
| 9 Number of deaths Show forest plot | 3 | 245 | Peto Odds Ratio (Peto, Fixed, 95% CI) | 0.0 [0.0, 0.0] |
| 10 Annual rate of change in % ideal body weight Show forest plot | 1 | Mean Difference (IV, Fixed, 95% CI) | Totals not selected | |
| 11 Annual rate of change in % ideal body weight (split by age) Show forest plot | 1 | 84 | Mean Difference (IV, Fixed, 95% CI) | 0.81 [0.08, 1.53] |
| 11.1 Under 13 years at randomisation | 1 | 49 | Mean Difference (IV, Fixed, 95% CI) | 1.45 [0.33, 2.57] |
| 11.2 13 years or older at randomisation | 1 | 35 | Mean Difference (IV, Fixed, 95% CI) | 0.34 [‐0.61, 1.29] |
| 12 Chest X‐ray score Show forest plot | 2 | 226 | Mean Difference (IV, Fixed, 95% CI) | 0.37 [‐0.08, 0.81] |
| 13 Chest X‐ray score (split by age) Show forest plot | 1 | 84 | Mean Difference (IV, Fixed, 95% CI) | 0.51 [‐0.04, 1.07] |
| 13.1 Under 13 years at randomisation | 1 | 49 | Mean Difference (IV, Fixed, 95% CI) | 0.45 [‐0.24, 1.14] |
| 13.2 13 years or older at randomisation | 1 | 35 | Mean Difference (IV, Fixed, 95% CI) | 0.63 [‐0.30, 1.56] |
| 14 Increase in abdominal pain Show forest plot | 2 | 226 | Peto Odds Ratio (Peto, Fixed, 95% CI) | 0.54 [0.20, 1.48] |
| 15 Decrease in abdominal pain Show forest plot | 1 | Peto Odds Ratio (Peto, Fixed, 95% CI) | Totals not selected | |
| 16 Proportion with at least one gastrointestinal hospitalisation Show forest plot | 1 | Peto Odds Ratio (Peto, Fixed, 95% CI) | Totals not selected | |
| 17 Stool frequency Show forest plot | 1 | Peto Odds Ratio (Peto, Fixed, 95% CI) | Totals not selected | |
| 18 Occult blood Show forest plot | 1 | Peto Odds Ratio (Peto, Fixed, 95% CI) | Totals not selected | |
| 19 Increase in epistaxis Show forest plot | 1 | Peto Odds Ratio (Peto, Fixed, 95% CI) | Totals not selected | |
| 20 Decrease in epistaxis Show forest plot | 1 | Peto Odds Ratio (Peto, Fixed, 95% CI) | Totals not selected | |
| 21 Increase in conjunctivitis Show forest plot | 2 | 226 | Peto Odds Ratio (Peto, Fixed, 95% CI) | 0.72 [0.22, 2.40] |
| 22 Decrease in conjunctivitis Show forest plot | 1 | Peto Odds Ratio (Peto, Fixed, 95% CI) | Totals not selected | |
| 23 Increase in nausea Show forest plot | 1 | Peto Odds Ratio (Peto, Fixed, 95% CI) | Totals not selected | |
| 24 Increase in diarrhoea Show forest plot | 1 | Peto Odds Ratio (Peto, Fixed, 95% CI) | Totals not selected | |