Inseminación intrauterina versus perfusión de esperma en la trompa de Falopio para la esterilidad no tubaria
Información
- DOI:
- https://doi.org/10.1002/14651858.CD001502.pub4Copiar DOI

- Base de datos:
-
- Cochrane Database of Systematic Reviews
- Versión publicada:
-
- 30 octubre 2013see what's new
- Tipo:
-
- Intervention
- Etapa:
-
- Review
- Grupo Editorial Cochrane:
-
Grupo Cochrane de Ginecología y fertilidad
- Copyright:
-
- Copyright © 2013 The Cochrane Collaboration. Published by John Wiley & Sons, Ltd.
Cifras del artículo
Altmetric:
Citado por:
Autores
Contributions of authors
AEP Cantineau did the literature search and selected relevant trials for inclusion in the review. She also performed the statistical analyses and wrote the bulk of the results and discussion section. She analysed articles for the update of the review, updated the review in 2008 and advised on the structure, text and interpretation of the 2013 draft of the review.
MJ Heineman was the second review author for selection of relevant trials for inclusion. For the update, he analysed the selected articles. He also contributed to drafts of the review.
BJ Cohlen together with JH Evers and H Al‐Inany took the lead in writing the original protocol for this review, was the third review author and resolved any disagreements between the first two review authors. He also contributed to drafts of the review and contributed to the update of the review.
C Farquhar selected the studies, extracted the data and advised on the structure, text and interpretation of the 2013 draft of the review.
J Marjoribanks selected the studies, extracted the data and drafted the 2013 update of the review.
Sources of support
Internal sources
-
Isala Clinics, Zwolle, Netherlands.
Visit congress meetings to present results of review
-
The Cochrane Collaboration, New Zealand.
Technical support
-
University Medical Centre, Groningen, Netherlands.
Technical support
External sources
-
No sources of support supplied
Declarations of interest
Cindy Farquar is principal investigator of one of the included studies (Farquhar 2013).
Acknowledgements
The authors wish to thank Marian Showell (Menstrual Disorders and Subfertility Group Trials Search Co‐ordinator) for help with the literature search and the following authors for providing additional data about their studies: Dr Jain, Dr Biacchiardi, Dr Gregoriou, Dr Papier, Dr Ciftci and Dr El‐Khayat.
Version history
| Published | Title | Stage | Authors | Version |
| 2013 Oct 30 | Intrauterine insemination versus fallopian tube sperm perfusion for non‐tubal infertility | Review | Astrid EP Cantineau, Ben J Cohlen, Maas Jan Heineman, Jane Marjoribanks, Cindy Farquhar | |
| 2009 Apr 15 | Intra‐uterine insemination versus fallopian tube sperm perfusion for non‐tubal infertility | Review | Astrid EP Cantineau, Ben J Cohlen, Maas Jan Heineman | |
| 2004 Jul 19 | Intrauterine insemination versus fallopian tube sperm perfusion for non tubal infertility | Review | Astrid EP Cantineau, Ben J Cohlen, Maas Jan Heineman | |
| 2003 Jul 21 | Intra‐uterine insemination versus fallopian tube sperm perfusion for non tubal infertility | Protocol | Astrid EP Cantineau, Maas Jan Heineman, Ben J Cohlen, Hesham Al‐Inany, Johannes LH Evers | |
Differences between protocol and review
2013 update.
-
Methods were updated in accordance with current Cochrane methodological standards.
-
Participant inclusion criteria were widened to "non‐tubal infertility".
-
OHSS was deleted as an outcome.
-
Sensitivity analysis was conducted for clinical pregnancy rather than live birth because only three studies reported live birth.
-
Both per‐couple (main analysis) and per‐pregnancy (sensitivity analysis) analyses were conducted for multiple pregnancy, miscarriage and ectopic pregnancy.
-
A random‐effects model was used if substantial heterogeneity was detected (I2 > 50%).
Keywords
MeSH
Medical Subject Headings (MeSH) Keywords
Medical Subject Headings Check Words
Female; Humans; Pregnancy;
PICO
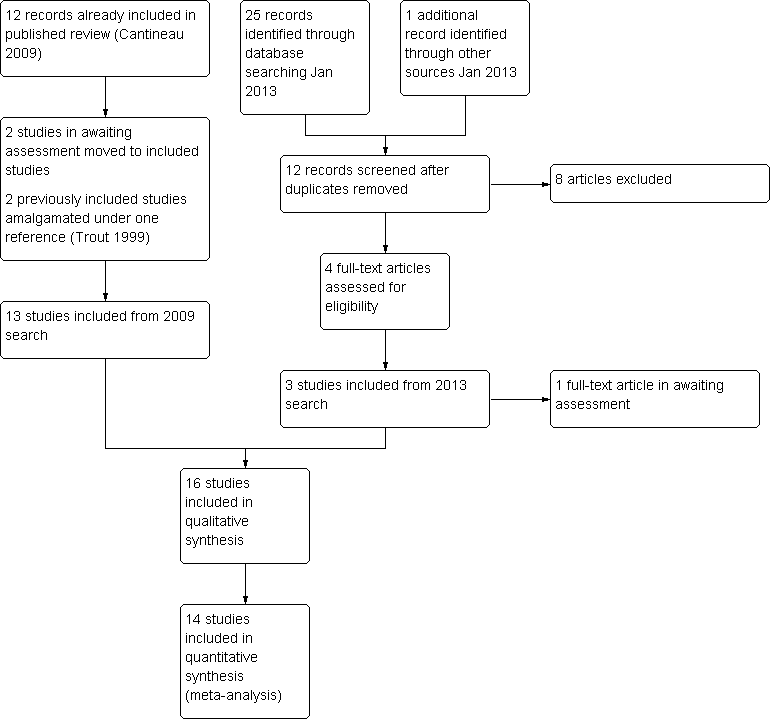
Study flow diagram.
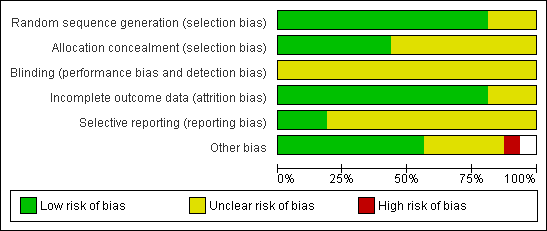
Methodological quality graph: review authors' judgements about all methodological quality items presented as percentages across all included studies.
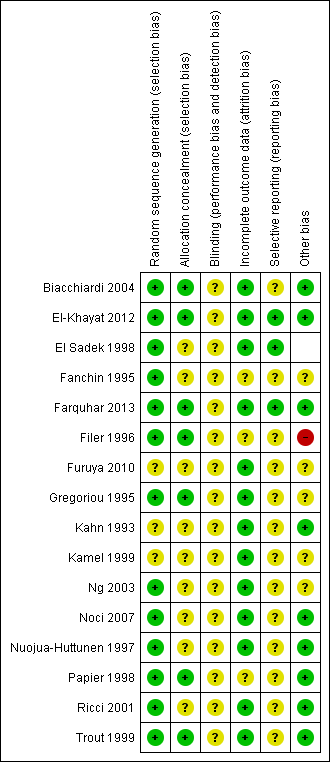
Methodological quality summary: review authors' judgements about all methodological quality items for each included study.

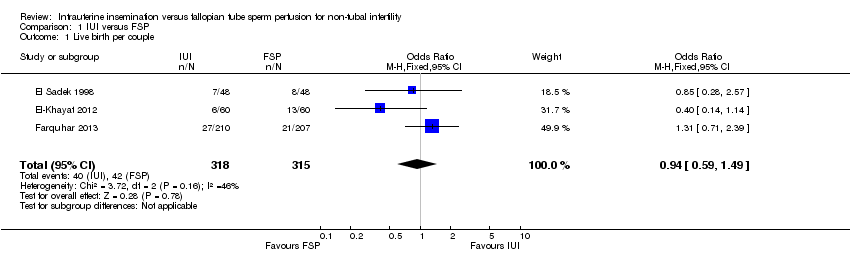
Forest plot of comparison: 1 NEW Intrauterine insemination versus fallopian tube sperm perfusion, outcome: 1.1 Live birth per couple.
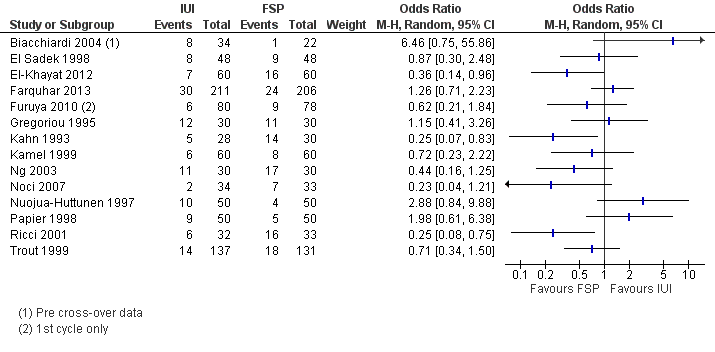
Forest plot of comparison: 1 IUI vs FSP: unexplained or mixed (non‐tubal) causes, outcome: 1.2 Clinical pregnancy per couple (unexplained and mixed causes).

Funnel plot of comparison: 1 IUI versus FSP, outcome: 1.2 Clinical pregnancy per couple.
Comparison 1 IUI versus FSP, Outcome 1 Live birth per couple.

Comparison 1 IUI versus FSP, Outcome 2 Clinical pregnancy per couple.
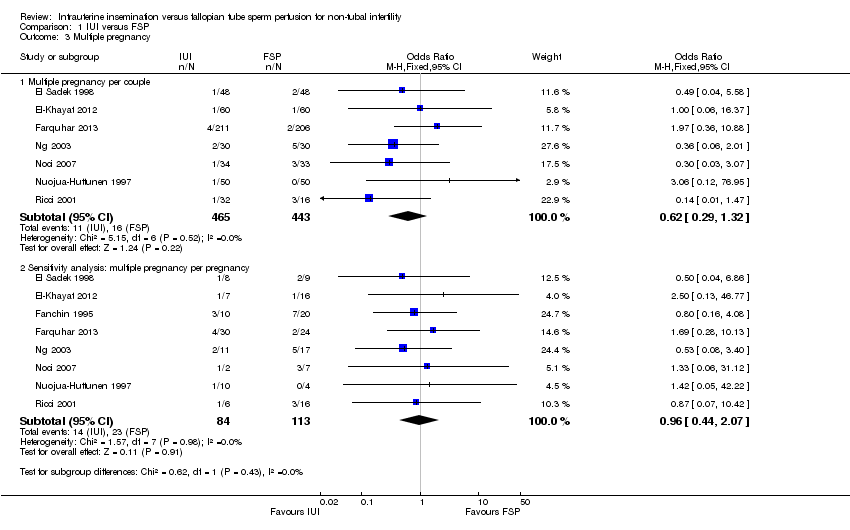
Comparison 1 IUI versus FSP, Outcome 3 Multiple pregnancy.
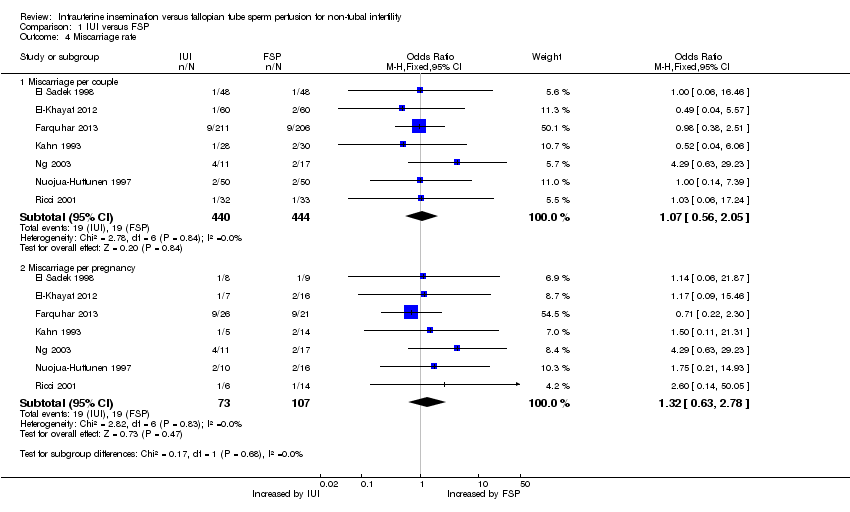
Comparison 1 IUI versus FSP, Outcome 4 Miscarriage rate.

Comparison 1 IUI versus FSP, Outcome 5 Ectopic pregnancy.
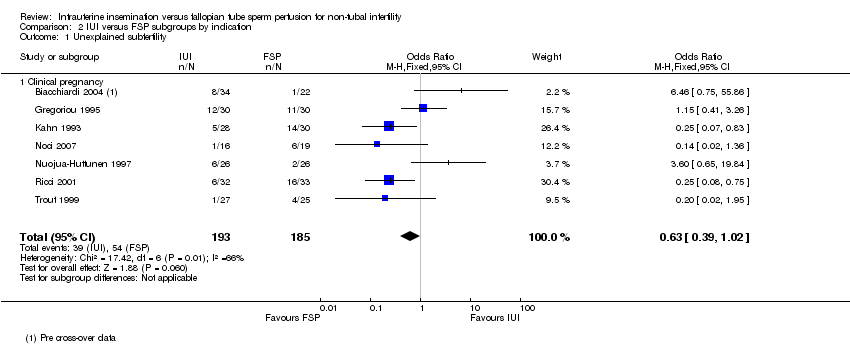
Comparison 2 IUI versus FSP subgroups by indication, Outcome 1 Unexplained subfertility.

Comparison 2 IUI versus FSP subgroups by indication, Outcome 2 Mild to moderate male factor subfertility.
| IUI compared with FSP for non‐tubal infertility | ||||||
| Patient or population: women with non‐tubal infertility | ||||||
| Outcomes | Illustrative comparative risks* (95% CI) | Relative effect | No of participants | Quality of the evidence | Comments | |
| Assumed risk | Corresponding risk | |||||
| FSP | IUI | |||||
| Live birth per couple | 133 per 1000 | 126 per 1000 | OR 0.94 | 633 | ⊕⊕⊝⊝ | |
| Clinical pregnancy per couple | 185 per 1000 | 145 per 1000 | OR 0.75 | 1745 | ⊕⊕⊝⊝ | |
| Multiple pregnancy per couple | 70 per 1000 | 55 per 1000 | OR 0.62 | 908 | ⊕⊕⊝⊝ | |
| Miscarriage per couple | 43 per 1000 | 46 per 1000 | OR 1.07 | 884 | ⊕⊕⊝⊝ | |
| Ectopic pregnancy per couple | 10 per 1000 | 8 per 1000 | OR 0.88 | 643 | ⊕⊝⊝⊝ | |
| *The basis for the assumed risk (the median control group risk across studies) is provided in footnotes. The corresponding risk (and its 95% confidence interval) is based on the assumed risk in the comparison group and the relative effect of the intervention (and its 95% CI). | ||||||
| GRADE Working Group grades of evidence. | ||||||
| 1One of the three studies did not describe method of allocation concealment and 19% of women in this study had mild tubal damage. | ||||||
| Study | Clinical pregnancy per cycle | ||
| IUI | FSP | P value | |
| 10/50 (20%) | 20/50 (40%) | P < 0.04 | |
| 12/59 (20%) | 5/47 (11%) | P > 0.05 | |
| Outcome or subgroup title | No. of studies | No. of participants | Statistical method | Effect size |
| 1 Live birth per couple Show forest plot | 3 | 633 | Odds Ratio (M‐H, Fixed, 95% CI) | 0.94 [0.59, 1.49] |
| 2 Clinical pregnancy per couple Show forest plot | 14 | Odds Ratio (M‐H, Random, 95% CI) | Subtotals only | |
| 3 Multiple pregnancy Show forest plot | 8 | Odds Ratio (M‐H, Fixed, 95% CI) | Subtotals only | |
| 3.1 Multiple pregnancy per couple | 7 | 908 | Odds Ratio (M‐H, Fixed, 95% CI) | 0.62 [0.29, 1.32] |
| 3.2 Sensitivity analysis: multiple pregnancy per pregnancy | 8 | 197 | Odds Ratio (M‐H, Fixed, 95% CI) | 0.96 [0.44, 2.07] |
| 4 Miscarriage rate Show forest plot | 7 | Odds Ratio (M‐H, Fixed, 95% CI) | Subtotals only | |
| 4.1 Miscarriage per couple | 7 | 884 | Odds Ratio (M‐H, Fixed, 95% CI) | 1.07 [0.56, 2.05] |
| 4.2 Miscarriage per pregnancy | 7 | 180 | Odds Ratio (M‐H, Fixed, 95% CI) | 1.32 [0.63, 2.78] |
| 5 Ectopic pregnancy Show forest plot | 4 | Odds Ratio (M‐H, Fixed, 95% CI) | Subtotals only | |
| 5.1 Ectopic pregnancy per couple | 4 | 643 | Odds Ratio (M‐H, Fixed, 95% CI) | 0.88 [0.24, 3.19] |
| 5.2 Ectopic pregnancy per pregnancy | 4 | 111 | Odds Ratio (M‐H, Fixed, 95% CI) | 1.71 [0.42, 6.88] |
| Outcome or subgroup title | No. of studies | No. of participants | Statistical method | Effect size |
| 1 Unexplained subfertility Show forest plot | 7 | 378 | Odds Ratio (M‐H, Fixed, 95% CI) | 0.63 [0.39, 1.02] |
| 1.1 Clinical pregnancy | 7 | 378 | Odds Ratio (M‐H, Fixed, 95% CI) | 0.63 [0.39, 1.02] |
| 2 Mild to moderate male factor subfertility Show forest plot | 5 | Odds Ratio (M‐H, Fixed, 95% CI) | Subtotals only | |
| 2.1 Live birth | 1 | 120 | Odds Ratio (M‐H, Fixed, 95% CI) | 0.40 [0.14, 1.14] |
| 2.2 Clinical pregnancy | 5 | 303 | Odds Ratio (M‐H, Fixed, 95% CI) | 0.53 [0.28, 1.01] |