L'insémination intra‐utérine versus l’injection de spermatozoïdes dans les trompes de Fallope pour l'infertilité non‐tubaire
Appendices
Appendix 1. MEDLINE
1 Insemination, Artificial/ (6821)
2 (intrauter$ adj5 inseminat$).tw. (1194)
3 (intra‐uter$ adj5 inseminat$).tw. (131)
4 IUI.tw. (703)
5 or/1‐4 (7614)
6 fallopian tube sperm perfusion.tw. (19)
7 FSP.tw. (446)
8 (Fallopian adj5 sperm$).tw. (97)
9 (tub$ adj5 sperm$).tw. (1868)
10 sperm$ flush$.tw. (7)
11 or/6‐10 (2326)
12 5 and 11 (80)
13 randomised controlled trial.pt. (234274)
14 controlled clinical trial.pt. (74820)
15 Randomized Controlled Trials/ (48327)
16 Random allocation/ (57750)
17 Double‐blind method/ (91028)
18 Single‐blind method/ (10880)
19 or/13‐18 (397294)
20 clinical trial.pt. (435392)
21 exp clinical trials/ (190560)
22 (clin$ adj25 trial$).ti,ab,sh. (129372)
23 ((singl$ or doubl$ or tripl$ or trebl$) adj25 (blind$ or mask$)).ti,ab,sh. (90362)
24 Placebos/ (26128)
25 placebo$.ti,ab,sh. (114490)
26 random$.ti,ab,sh. (490003)
27 Research design/ (47276)
28 or/20‐27 (866440)
29 animal/ not (human/ and animal/) (3095759)
30 19 or 28 (873731)
31 30 not 29 (800552)
32 12 and 31 (23)
33 (2003$ or 2004$ or 2005$ or 2006$ or 2007$).ed. (3111083)
34 32 and 33 (5)
35 from 34 keep 1‐5 (5)
Appendix 2. CENTRAL
1 Insemination, Artificial/ (112)
2 (intrauter$ adj5 inseminat$).tw. (290)
3 (intra‐uter$ adj5 inseminat$).tw. (22)
4 IUI.tw. (206)
5 or/1‐4 (378)
6 fallopian tube sperm perfusion.tw. (21)
7 FSP.tw. (30)
8 (Fallopian adj5 sperm$).tw. (29)
9 (tub$ adj5 sperm$).tw. (47)
10 sperm$ flush$.tw. (0)
11 or/6‐10 (70)
12 5 and 11 (30)
13 from 12 keep 1‐30 (30)
Appendix 3. CINAHL
1 Insemination, Artificial/ (163)
2 (intrauter$ adj5 inseminat$).tw. (30)
3 (intra‐uter$ adj5 inseminat$).tw. (4)
4 IUI.tw. (16)
5 or/1‐4 (178)
6 fallopian tube sperm perfusion.tw. (2)
7 FSP.tw. (17)
8 (Fallopian adj5 sperm$).tw. (2)
9 (tub$ adj5 sperm$).tw. (7)
10 sperm$ flush$.tw. (0)
11 or/6‐10 (22)
12 5 and 11 (2)
13 exp clinical trials/ (43714)
14 Clinical trial.pt. (20712)
15 (clinic$ adj trial$1).tw. (10227)
16 ((singl$ or doubl$ or trebl$ or tripl$) adj (blind$3 or mask$3)).tw. (6114)
17 Randomi?ed control$ trial$.tw. (8946)
18 Random assignment/ (15159)
19 Random$ allocat$.tw. (1023)
20 Placebo$.tw. (8559)
21 Placebos/ (3489)
22 Quantitative studies/ (3196)
23 Allocat$ random$.tw. (60)
24 or/13‐23 (61301)
25 12 and 24 (2)
26 from 25 keep 1‐2 (2)
Appendix 4. EMBASE
1 fallopian tube sperm perfusion.tw. (22)
2 FSP.tw. (345)
3 (Fallopian adj5 sperm$).tw. (80)
4 (tub$ adj5 sperm$).tw. (1383)
5 sperm$ flush$.tw. (5)
6 or/1‐5 (1737)
7 exp Artificial Insemination/ (3671)
8 (intrauter$ adj5 inseminat$).tw. (1172)
9 (intra‐uter$ adj5 inseminat$).tw. (129)
10 IUI.tw. (737)
11 or/7‐10 (4753)
12 6 and 11 (74)
13 Controlled study/ or randomised controlled trial/ (2405316)
14 double blind procedure/ (63789)
15 single blind procedure/ (6559)
16 crossover procedure/ (18585)
17 drug comparison/ (81250)
18 placebo/ (97915)
19 random$.ti,ab,hw,tn,mf. (367123)
20 latin square.ti,ab,hw,tn,mf. (1064)
21 crossover.ti,ab,hw,tn,mf. (32554)
22 cross‐over.ti,ab,hw,tn,mf. (11275)
23 placebo$.ti,ab,hw,tn,mf. (146355)
24 ((doubl$ or singl$ or tripl$ or trebl$) adj5 (blind$ or mask$)).ti,ab,hw,tn,mf. (106285)
25 (comparative adj5 trial$).ti,ab,hw,tn,mf. (5769)
26 (clinical adj5 trial$).ti,ab,hw,tn,mf. (483066)
27 or/13‐26 (2886258)
28 nonhuman/ (2878264)
29 animal/ not (human/ and animal/) (12847)
30 or/28‐29 (2881866)
31 27 not 30 (1695407)
32 12 and 31 (28)
33 (2003$ or 2004$ or 2005$ or 2006$ or 2007$).em. (2449289)
34 32 and 33 (6)
35 from 34 keep 1‐6 (6)
Appendix 5. Data collected
Types of participant
-
What was the duration of subfertility?
-
Were prognostic factors such as the age of the woman and the duration of subfertility considered?
-
Were female factors excluded or corrected? All women had to have regular menstrual cycles with biphasic body temperature charts or normal luteal progesterone; patent tubes on hysterosalpingography (HSG) or laparoscopy; no cervical factors, thus a positive post‐coital test or normal cervical mucus with pH > 6.3 and Insler score > 11.
-
Had treatments been applied previously? Was it tubal surgery, controlled ovarian hyperstimulation without insemination, or other?
Types of intervention
-
What method of controlled ovarian hyperstimulation (COH) was used?
-
Were criteria to cancel the insemination because of the risk of multiple pregnancies or ovarian hyperstimulation syndrome (cancellation criteria) described?
-
Duration of treatment: How many treatment cycles were offered?
-
How many inseminations were performed per cycle?
-
What timing method was used in natural cycles: with luteinising hormone (LH) in blood or urine?
-
What timing method was used in cycles with COH. When no GnRHa was used: Was LH also measured in cycles with COH?
-
What was the actual timing of IUI or FSP? Was IUI or FSP in natural cycles performed 20 to 40 hours after the onset of the LH surge was detected, and in cycles with COH 35 to 45 hours after hCG?
-
Which semen was inseminated (donor semen or partner semen)?
-
What method of semen preparation was applied?
-
What were the semen characteristics before and after sperm processing (especially the number of motile spermatozoa that were inseminated)?
Types of outcome measure
· Primary outcome
-
Number of live births
· Secondary outcomes
-
Number of clinical pregnancies
-
Number of multiple pregnancies
-
Spontaneous abortion rate
-
Number of tubal pregnancies
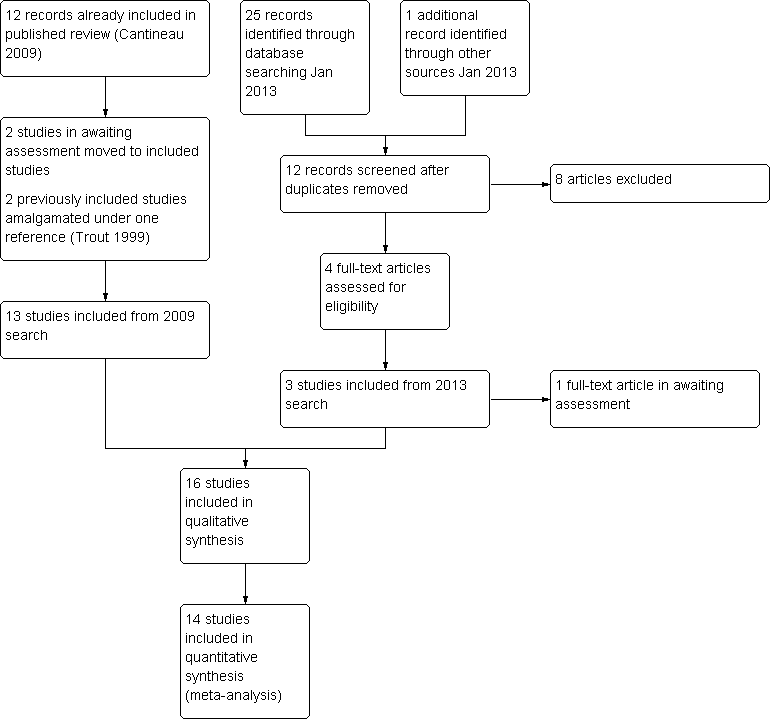
Study flow diagram.
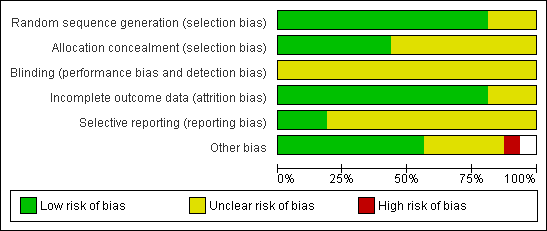
Methodological quality graph: review authors' judgements about all methodological quality items presented as percentages across all included studies.
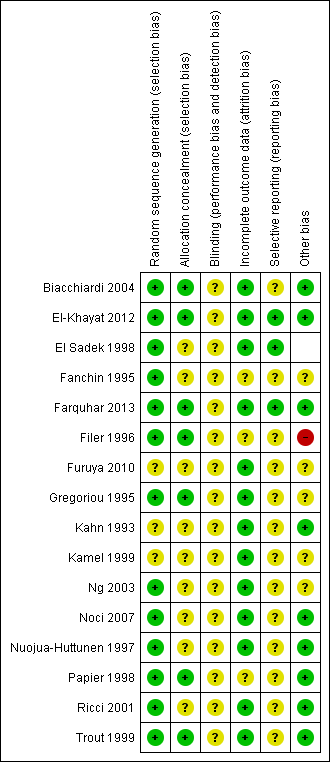
Methodological quality summary: review authors' judgements about all methodological quality items for each included study.

Forest plot of comparison: 1 NEW Intrauterine insemination versus fallopian tube sperm perfusion, outcome: 1.1 Live birth per couple.
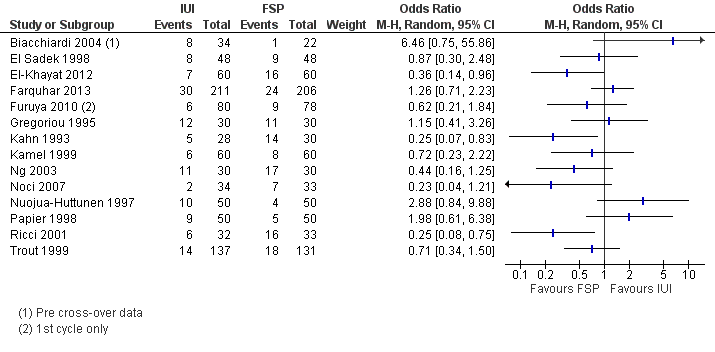
Forest plot of comparison: 1 IUI vs FSP: unexplained or mixed (non‐tubal) causes, outcome: 1.2 Clinical pregnancy per couple (unexplained and mixed causes).

Funnel plot of comparison: 1 IUI versus FSP, outcome: 1.2 Clinical pregnancy per couple.
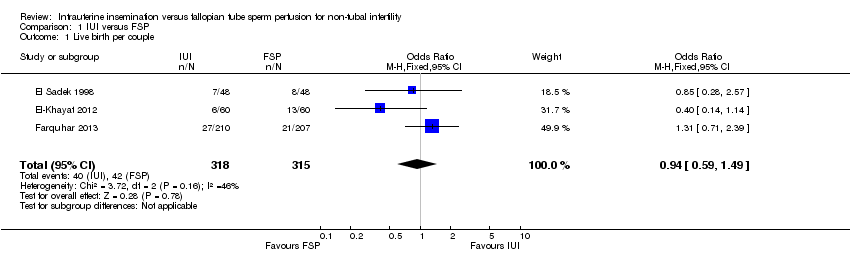
Comparison 1 IUI versus FSP, Outcome 1 Live birth per couple.

Comparison 1 IUI versus FSP, Outcome 2 Clinical pregnancy per couple.
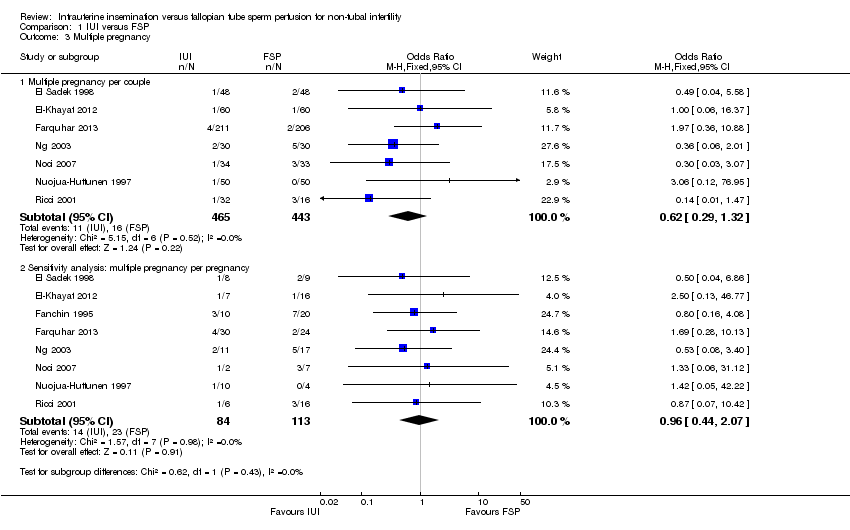
Comparison 1 IUI versus FSP, Outcome 3 Multiple pregnancy.
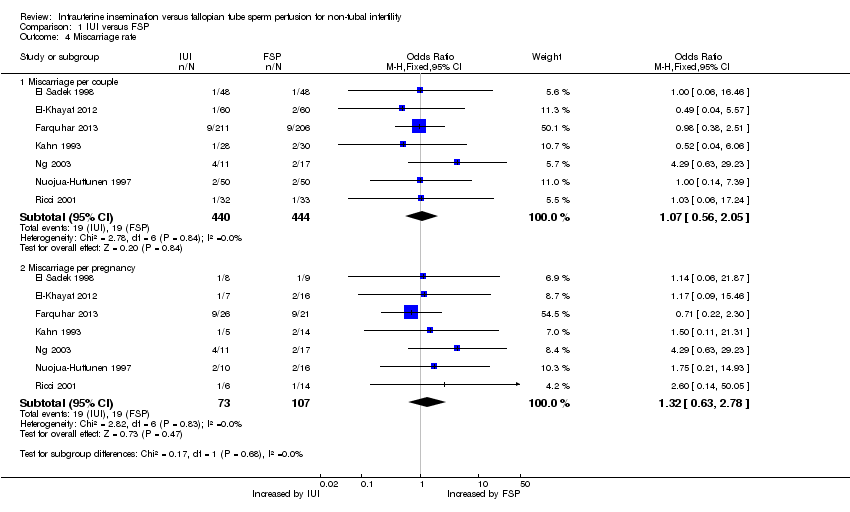
Comparison 1 IUI versus FSP, Outcome 4 Miscarriage rate.

Comparison 1 IUI versus FSP, Outcome 5 Ectopic pregnancy.
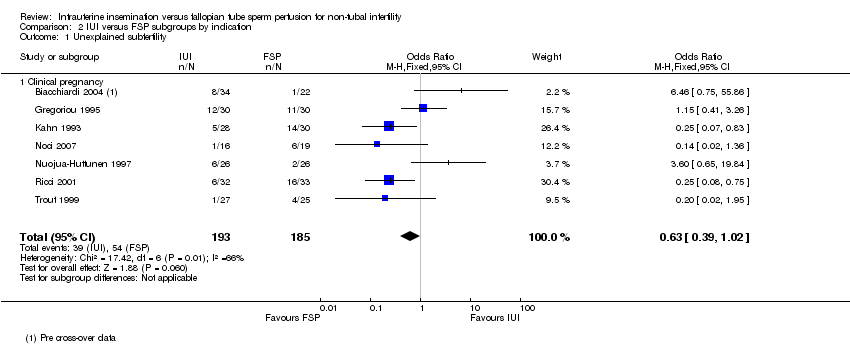
Comparison 2 IUI versus FSP subgroups by indication, Outcome 1 Unexplained subfertility.

Comparison 2 IUI versus FSP subgroups by indication, Outcome 2 Mild to moderate male factor subfertility.
| IUI compared with FSP for non‐tubal infertility | ||||||
| Patient or population: women with non‐tubal infertility | ||||||
| Outcomes | Illustrative comparative risks* (95% CI) | Relative effect | No of participants | Quality of the evidence | Comments | |
| Assumed risk | Corresponding risk | |||||
| FSP | IUI | |||||
| Live birth per couple | 133 per 1000 | 126 per 1000 | OR 0.94 | 633 | ⊕⊕⊝⊝ | |
| Clinical pregnancy per couple | 185 per 1000 | 145 per 1000 | OR 0.75 | 1745 | ⊕⊕⊝⊝ | |
| Multiple pregnancy per couple | 70 per 1000 | 55 per 1000 | OR 0.62 | 908 | ⊕⊕⊝⊝ | |
| Miscarriage per couple | 43 per 1000 | 46 per 1000 | OR 1.07 | 884 | ⊕⊕⊝⊝ | |
| Ectopic pregnancy per couple | 10 per 1000 | 8 per 1000 | OR 0.88 | 643 | ⊕⊝⊝⊝ | |
| *The basis for the assumed risk (the median control group risk across studies) is provided in footnotes. The corresponding risk (and its 95% confidence interval) is based on the assumed risk in the comparison group and the relative effect of the intervention (and its 95% CI). | ||||||
| GRADE Working Group grades of evidence. | ||||||
| 1One of the three studies did not describe method of allocation concealment and 19% of women in this study had mild tubal damage. | ||||||
| Study | Clinical pregnancy per cycle | ||
| IUI | FSP | P value | |
| 10/50 (20%) | 20/50 (40%) | P < 0.04 | |
| 12/59 (20%) | 5/47 (11%) | P > 0.05 | |
| Outcome or subgroup title | No. of studies | No. of participants | Statistical method | Effect size |
| 1 Live birth per couple Show forest plot | 3 | 633 | Odds Ratio (M‐H, Fixed, 95% CI) | 0.94 [0.59, 1.49] |
| 2 Clinical pregnancy per couple Show forest plot | 14 | Odds Ratio (M‐H, Random, 95% CI) | Subtotals only | |
| 3 Multiple pregnancy Show forest plot | 8 | Odds Ratio (M‐H, Fixed, 95% CI) | Subtotals only | |
| 3.1 Multiple pregnancy per couple | 7 | 908 | Odds Ratio (M‐H, Fixed, 95% CI) | 0.62 [0.29, 1.32] |
| 3.2 Sensitivity analysis: multiple pregnancy per pregnancy | 8 | 197 | Odds Ratio (M‐H, Fixed, 95% CI) | 0.96 [0.44, 2.07] |
| 4 Miscarriage rate Show forest plot | 7 | Odds Ratio (M‐H, Fixed, 95% CI) | Subtotals only | |
| 4.1 Miscarriage per couple | 7 | 884 | Odds Ratio (M‐H, Fixed, 95% CI) | 1.07 [0.56, 2.05] |
| 4.2 Miscarriage per pregnancy | 7 | 180 | Odds Ratio (M‐H, Fixed, 95% CI) | 1.32 [0.63, 2.78] |
| 5 Ectopic pregnancy Show forest plot | 4 | Odds Ratio (M‐H, Fixed, 95% CI) | Subtotals only | |
| 5.1 Ectopic pregnancy per couple | 4 | 643 | Odds Ratio (M‐H, Fixed, 95% CI) | 0.88 [0.24, 3.19] |
| 5.2 Ectopic pregnancy per pregnancy | 4 | 111 | Odds Ratio (M‐H, Fixed, 95% CI) | 1.71 [0.42, 6.88] |
| Outcome or subgroup title | No. of studies | No. of participants | Statistical method | Effect size |
| 1 Unexplained subfertility Show forest plot | 7 | 378 | Odds Ratio (M‐H, Fixed, 95% CI) | 0.63 [0.39, 1.02] |
| 1.1 Clinical pregnancy | 7 | 378 | Odds Ratio (M‐H, Fixed, 95% CI) | 0.63 [0.39, 1.02] |
| 2 Mild to moderate male factor subfertility Show forest plot | 5 | Odds Ratio (M‐H, Fixed, 95% CI) | Subtotals only | |
| 2.1 Live birth | 1 | 120 | Odds Ratio (M‐H, Fixed, 95% CI) | 0.40 [0.14, 1.14] |
| 2.2 Clinical pregnancy | 5 | 303 | Odds Ratio (M‐H, Fixed, 95% CI) | 0.53 [0.28, 1.01] |