Local oestrogen for vaginal atrophy in postmenopausal women
Abstract
Background
Vaginal atrophy is a frequent complaint of postmenopausal women; symptoms include vaginal dryness, itching, discomfort and painful intercourse. Systemic treatment for these symptoms in the form of oral hormone replacement therapy is not always necessary. An alternative choice is oestrogenic preparations administered vaginally (in the form of creams, pessaries, tablets and the oestradiol‐releasing ring). This is an update of a Chochrane systematic review; the original version was first published in October 2006.
Objectives
The objective of this review was to compare the efficacy and safety of intra‐vaginal oestrogenic preparations in relieving the symptoms of vaginal atrophy in postmenopausal women.
Search methods
We searched the following databases and trials registers to April 2016: Cochrane Gynaecology and Fertility Group Register of trials, The Cochrane Central Register of Controlled Trials (CENTRAL; 2016 issue 4), MEDLINE, Embase, PsycINFO, DARE, the Web of Knowledge, OpenGrey, LILACS, PubMed and reference lists of articles. We also contacted experts and researchers in the field.
Selection criteria
The inclusion criteria were randomised comparisons of oestrogenic preparations administered intravaginally in postmenopausal women for at least 12 weeks for the treatment of symptoms resulting from vaginal atrophy or vaginitis.
Data collection and analysis
Two review authors independently assessed trial eligibility and risk of bias and extracted the data. The primary review outcomes were improvement in symptoms (participant‐assessed), and the adverse event endometrial thickness. Secondary outcomes were improvement in symptoms (clinician‐assessed), other adverse events (breast disorders e.g. breast pain, enlargement or engorgement, total adverse events, excluding breast disorders) and adherence to treatment. We combined data to calculate pooled risk ratios (RRs) (dichotomous outcomes) and mean differences (MDs) (continuous outcomes) and 95% confidence intervals (CIs). Statistical heterogeneity was assessed using the I2 statistic. We assessed the overall quality of the evidence for the main comparisons using GRADE methods.
Main results
We included 30 RCTs (6235 women) comparing different intra‐vaginal oestrogenic preparations with each other and with placebo. The evidence was low to moderate quality; limitations were poor reporting of study methods and serious imprecision (effect estimates with wide confidence intervals)
1. Oestrogen ring versus other regimens
Other regimens included oestrogen cream, oestrogen tablets and placebo. There was no evidence of a difference in improvement in symptoms (participant assessment) either between oestrogen ring and oestrogen cream (odds ratio (OR) 1.33, 95% CI 0.80 to 2.19, two RCTs, n = 341, I2 = 0%, low‐quality evidence) or between oestrogen ring and oestrogen tablets (OR 0.78, 95% CI 0.53 to 1.15, three RCTs, n = 567, I2 = 0%, low‐quality evidence). However, a higher proportion of women reported improvement in symptoms following treatment with oestrogen ring compared with placebo (OR 12.67, 95% CI 3.23 to 49.66, one RCT, n = 67). With respect to endometrial thickness, a higher proportion of women who received oestrogen cream showed evidence of increase in endometrial thickness compared to those who were treated with oestrogen ring (OR 0.36, 95% CI 0.14 to 0.94, two RCTs, n = 273; I2 = 0%, low‐quality evidence). This may have been due to the higher doses of cream used.
2. Oestrogen tablets versus other regimens
Other regimens in this comparison included oestrogen cream, and placebo. There was no evidence of a difference in the proportions of women who reported improvement in symptoms between oestrogen tablets and oestrogen cream (OR 1.06, 95% CI 0.55 to 2.01, two RCTs, n = 208, I2 = 0% low‐quality evidence). A higher proportion of women who were treated with oestrogen tablets reported improvement in symptoms compared to those who received placebo using a fixed‐effect model (OR 12.47, 95% CI 9.81 to 15.84, two RCTs, n = 1638, I2 = 83%, low‐quality evidence); however, using a random‐effect model did not demonstrate any evidence of a difference in the proportions of women who reported improvement between the two treatment groups (OR 5.80, 95% CI 0.88 to 38.29). There was no evidence of a difference in the proportions of women with increase in endometrial thickness between oestrogen tablets and oestrogen cream (OR 0.31, 95% CI 0.06 to 1.60, two RCTs, n = 151, I2 = 0%, low‐quality evidence).
3. Oestrogen cream versus other regimens
Other regimens identified in this comparison included isoflavone gel and placebo. There was no evidence of a difference in the proportions of women with improvement in symptoms between oestrogen cream and isoflavone gel (OR 2.08, 95% CI 0.08 to 53.76, one RCT, n = 50, low‐quality evidence). However, there was evidence of a difference in the proportions of women with improvement in symptoms between oestrogen cream and placebo with more women who received oestrogen cream reporting improvement in symptoms compared to those who were treated with placebo (OR 4.10, 95% CI 1.88 to 8.93, two RCTs, n = 198, I2 = 50%, low‐quality evidence). None of the included studies in this comparison reported data on endometrial thickness.
Authors' conclusions
There was no evidence of a difference in efficacy between the various intravaginal oestrogenic preparations when compared with each other. However, there was low‐quality evidence that intra‐vaginal oestrogenic preparations improve the symptoms of vaginal atrophy in postmenopausal women when compared to placebo. There was low‐quality evidence that oestrogen cream may be associated with an increase in endometrial thickness compared to oestrogen ring; this may have been due to the higher doses of cream used. However there was no evidence of a difference in the overall body of evidence in adverse events between the various oestrogenic preparations compared with each other or with placebo.
PICO
Plain language summary
Use by postmenopausal women of creams, pessaries or a vaginal ring to apply oestrogen vaginally for symptoms of vaginal dryness
Review question
Cochrane researchers reviewed the evidence about the efficacy and safety of intravaginal oestrogenic preparations compared with each other or placebo (inactive or sham treatment) in women undergoing treatment for the symptoms of vaginal atrophy.
Background
Vaginal atrophy is a common condition in women after menopause. It causes vaginal dryness and itching and can make intercourse painful. The female hormone oestrogen is a treatment option for vaginal atrophy, but can cause adverse effects such as increased thickness in the lining of the womb (endometrium) which could be due to endometrial hyperplasia or cancer (resulting in vaginal bleeding) and breast tenderness. Oestrogen is available as an oral tablet, skin patch or implant under the skin. Alternatively, women can apply the hormone locally using creams, pessaries (tablets placed in the vagina) or a hormone‐releasing ring placed in the vagina. There is, therefore, the need to evaluate the efficacy and safety of these locally‐administered oestrogenic preparations.
Study characteristics
We found 30 randomised controlled trials comparing intravaginal oestrogenic preparations with one another or with placebo in a total of 6235 postmenopausal women undergoing treatment for the symptoms of vaginal atrophy. The evidence is current to April 2016.
Key results
There was no evidence of a difference in the proportions of women who reported improvement in symptoms of vaginal atrophy between the following treatment comparisons: oestrogen ring and oestrogen cream, oestrogen ring and oestrogen tablets, oestrogen tablets and oestrogen cream, oestrogen cream and isoflavone gel. However, a higher proportion of women reported improvement in symptoms in the following active treatments compared with placebo: oestrogen ring versus placebo, oestrogen tablets versus placebo and oestrogen cream versus placebo. In the case of oestrogen tablets versus placebo and using a random‐effect model for analysis of the data because of substantial heterogeneity, there was no longer evidence of a difference in effect on improvement in symptoms.
With respect to safety, a higher proportion of women who received oestrogen cream showed evidence of increase in endometrial thickness compared to those who were treated with oestrogen ring, which may have been due to the higher doses of cream used. However, there was no evidence of a difference in the proportions of women with increase in thickness of the lining of the womb between oestrogen tablets and oestrogen cream.
Quality of the evidence:
The evidence was of low quality for both improvement in symptoms as reported by women and increase in endometrial thickness. The main limitations of the evidence were poor reporting of study methods, and lack of precision (i.e. effect estimates with wide confidence intervals) in the findings for both outcomes.
Authors' conclusions
Summary of findings
| Oestrogen ring compared to other regimens for vaginal atrophy in postmenopausal women | ||||||
| Patient or population: postmenopausal women with vaginal atrophy | ||||||
| Outcomes | Illustrative comparative risks* (95% CI) | Relative effect | No of Participants | Quality of the evidence | Comments | |
| Assumed risk | Corresponding risk | |||||
| Other regimen | Oestrogen ring | |||||
| Improvement in symptoms (participant‐assessed) (oestrogen ring vs oestrogen cream) | 717 per 1000 | 771 per 1000 | OR 1.33 | 341 | ⊕⊕⊝⊝ | |
| Improvement in symptoms (participant‐assessed) (oestrogen ring vs oestrogen tablets) | 582 per 1000 | 521 per 1000 | OR 0.78 | 567 | ⊕⊕⊝⊝ | |
| Endometrial thickness (oestrogen ring vs oestrogen cream) | 117 per 1000 | 46 per 1000 | OR 0.36 | 273 | ⊕⊕⊝⊝ | |
| Improvement in symptoms (clinician‐assessed) (oestrogen ring vs oestrogen cream) | 706 per 1000 | 714 per 1000 | OR 1.04 | 533 | ⊕⊕⊝⊝ | |
| Improvement in symptoms (clinician‐assessed) (oestrogen ring vs oestrogen tablets) | 636 per 1000 | 717 per 1000 | OR 1.45 | 397 | ⊕⊕⊝⊝ | |
| Adverse events (total adverse events) (oestrogen ring vs oestrogen cream) | 364 per 1000 | 335 per 1000 | OR 0.88 | 192 | ⊕⊕⊝⊝ | |
| Adverse events (total adverse events) (oestrogen ring vs placebo) | 444 per 1000 | 264 per 1000 | OR 0.45 | 37 | ⊕⊕⊕⊝ | |
| *The basis for the assumed risk is the median control group risk across studies. The corresponding risk (and its 95% confidence interval) is based on the assumed risk in the comparison group and the relative effect of the intervention (and its 95% CI). | ||||||
| GRADE Working Group grades of evidence | ||||||
| 1 Downgraded by 1 level as most risk of bias domains were rated either as unclear or high | ||||||
| Oestrogen tablets compared to other regimens for vaginal atrophy in postmenopausal women | ||||||
| Patient or population: postmenopausal women with vaginal atrophy | ||||||
| Outcomes | Illustrative comparative risks* (95% CI) | Relative effect | No of Participants | Quality of the evidence | Comments | |
| Assumed risk | Corresponding risk | |||||
| Other regimen | Oestrogen tablets | |||||
| Improvement in symptoms (participant‐assessed) (oestrogen tablets vs oestrogen cream) | 683 per 1000 | 695 per 1000 | OR 1.06 | 208 | ⊕⊕⊝⊝ | |
| Improvement in symptoms (participant‐assessed) (oestrogen tablets vs placebo) | 294 per 1000 | 839 per 1000 | OR 12.47 | 1638 | ⊕⊕⊝⊝ | Using a random effects model, there was no evidence of a difference in effect: OR 5.80, 95% CI 0.88 to 38.29 |
| Endometrial thickness (oestrogen tablets vs oestrogen cream) | 80 per 1000 | 26 per 1000 | OR 0.31 | 151 | ⊕⊕⊝⊝ | |
| Improvement in symptoms (clinician‐assessed) (oestrogen tablets vs oestrogen cream) | 697 per 1000 | 699 per 1000 | OR 1.03 | 528 | ⊕⊕⊝⊝ | |
| Improvement in symptoms (clinician‐assessed) (oestrogen tablets vs placebo) | 262 per 1000 | 820 per 1000 | OR 12.85 | 2078 | ⊕⊕⊝⊝ | |
| Adverse events (total adverse events) (oestrogen tablets vs placebo) | 19 per 1000 | 24 per 1000 | OR 1.27 | 309 | ⊕⊕⊕⊝ | |
| *The basis for the assumed risk is the median control group risk across studies. The corresponding risk (and its 95% confidence interval) is based on the assumed risk in the comparison group and the relative effect of the intervention (and its 95% CI). | ||||||
| GRADE Working Group grades of evidence | ||||||
| 1 Downgraded by 1 level as most risk of bias domains were assessed either as unclear or high | ||||||
| Oestrogen cream compared to other regimens for vaginal atrophy in postmenopausal women | ||||||
| Patient or population: postmenopausal women with vaginal atrophy | ||||||
| Outcomes | Illustrative comparative risks* (95% CI) | Relative effect | No of Participants | Quality of the evidence | Comments | |
| Assumed risk | Corresponding risk | |||||
| Other regimen | Oestrogen cream | |||||
| Improvement in symptoms (participant‐assessed) (oestrogen cream vs isoflavone gel) | 967 per 1000 | 984 per 1000 | OR 2.08 | 50 | ⊕⊕⊝⊝ | |
| Improvement in symptoms (participant‐assessed) oestrogen cream vs placebo) | 685 per 1000 | 899 per 1000 | OR 4.10 | 198 | ⊕⊕⊝⊝ | |
| Endometrial thickness not reported | ‐ | ‐ | Not estimable | ‐ | ‐ | |
| Improvement in symptoms (clinician‐assessed) (oestrogen cream vs placebo) | 646 per 1000 | 857 per 1000 | OR 3.29 | 153 | ⊕⊕⊝⊝ | |
| Adverse events (total adverse events) (oestrogen cream vs non‐hormonal lubricant gel) | ‐ | ‐ | OR 10.67 | 50 | ⊕⊕⊝⊝ | |
| *The basis for the assumed risk is the median control group risk across studies. The corresponding risk (and its 95% confidence interval) is based on the assumed risk in the comparison group and the relative effect of the intervention (and its 95% CI). | ||||||
| GRADE Working Group grades of evidence | ||||||
| 1 Downgraded by 1 level as most risk of bias domains were assessed either as unclear or high | ||||||
Background
Description of the condition
The ovaries produce a large proportion of circulating oestrogen in women of reproductive age. Before menopause the vagina is made up of thick layers of healthy cells. Oestrogen encourages growth and development of these cells so the vaginal epithelium remains thick and moist and the vagina supple and elastic. However, a dramatic reduction in circulating oestrogen occurs following the loss of ovarian function at the menopause. This oestrogen deficiency induces metabolic and trophic changes. Initially, these may include hot flushes and sweating, mood and sleep disturbances and fatigue. Skin begins to loose its elasticity and bone its strength. Changes occur in the vagina and other genital tissues. These tissues become thinner, drier and less elastic. Low oestrogen levels result in genital areas becoming dry, itchy and more easily irritated. A decrease in blood flow leads to fewer secretions and more dryness and intercourse can become uncomfortable or painful.
Falling oestrogen levels also cause changes in the lower urinary tract: for example the urinary bladder and urethra may display symptoms of urge incontinence, urgency, and frequency. A deterioration in vaginal and urethral tissues is called genitourinary syndrome (Roberts 2016) with a low oestrogen level being the primary cause.
Assessment of vaginal pH is a method for establishing vaginal atrophy (Nilsson 1992). At menopause decreased oestrogen levels cause the vaginal pH to rise to between 6.0 and 7.5 (Caillouette 1997; Crandall 2002). A low premenopausal vaginal pH of 3.5 to 4.5 helps to prevent colonisation with uropathogens. Colonisation can lead to vaginal infection. Therefore, restoration of vaginal pH reflects a clinically important achievement in maintaining the body's natural protection against vaginal infection (Henriksson 1994).
It has been suggested that about 50% of otherwise healthy women over 60 years of age have symptoms related to vaginal atrophy (Iosif 1984). In about 45% of menopausal women vaginal atrophy can be clinically manifest as a syndrome of vaginal dryness, itching, irritation and dyspareunia (painful intercourse) (Bygdeman 1996).
Description of the intervention
Oestrogen‐based hormone therapy (HT) is effective in treating symptoms of vaginal atrophy in postmenopausal women (Campbell 1977). However, only a small percentage (10%) of those who would benefit from oestrogen therapy actually receive it (Berg 1988), since women are often reluctant to volunteer that they have significant vaginal symptoms because of embarrassment (Notelovitz 1997: SOGC 2005). Several forms of HT are available, systemic dosage forms include oral, transdermal preparations, nasal sprays, and injectable (not commonly used), as well as local dosage forms using the vaginal route. Local dosage can be administered in the form of the oestradiol‐releasing vaginal ring, oestrogen‐based vaginal creams, pessaries containing oestriol and a slow‐release 17β‐oestradiol tablet. The harmful effects of HT have resulted in considerable caution in the manner it is currently used (Manson 2016). Current guidelines advise local oestrogen administration over systemic HT if vaginal atrophy is the only indication for treatment ( ACOG 2014; NAMS 2013).
How the intervention might work
Locally administered oestrogenic preparations work directly on the oestrogen‐sensitive tissues of the lower genito‐urinary tract, relieving the symptoms of vaginal atrophy. Local treatment does not induce altered liver metabolism and this makes it possible to use lower doses of oestrogen compared with oral therapy (Heimer 1984). This mechanism of action of local oestrogen results in reduction of systemic adverse effects associated with systemic oestrogen such as bleeding, breast tenderness, and endometrial stimulation (Gerbaldo 1991; Kivovic 1980; Mattson 1989; Mettler 1991). Although local treatment appears to have fewer adverse effects many women consider creams and pessaries to be messy and application times difficult to remember. An alternative treatment is a silicone ring with an oestradiol‐loaded core which can be inserted and left within the vagina to provide a relatively low and constant release of hormone.
Why it is important to do this review
This review evaluated the efficacy and safety of intra‐vaginal oestrogenic preparations for the treatment of vaginal atrophy in postmenopausal women to inform patient‐centred decision making. Different local oestrogenic preparations are currently available for the treatment of vaginal atrophy in postmenopausal women. However, uncertainty still exists as to the efficacy and safety of these various preparations. It has, therefore become imperative to critically appraise the existing empirical evidence related to the efficacy and safety of the various local oestrogenic therapies relative to each other.
This is an update of a Cochrane review first published in 2003 (Suckling 2003), and previously updated in 2006 (Suckling 2006). In the 2006 version,there was evidence that creams, tablets and the oestradiol vaginal ring appeared to be equally effective but more potent than placebo for the symptoms of vaginal atrophy. With respect to safety, there was evidence that the use of conjugated equine oestrogen cream resulted in more incidents of vaginal bleeding than oestrogen ring, as reported by two trials in 274 participants.
Objectives
The objective of this review was to compare the efficacy and safety of intra‐vaginal oestrogenic preparations in relieving the symptoms of vaginal atrophy in postmenopausal women.
Methods
Criteria for considering studies for this review
Types of studies
Published and unpublished randomised controlled trials (RCTs) comparing oestrogenic preparations administered intra‐vaginally for a duration of at least three months in postmenopausal women for the treatment of symptoms resulting from vaginal atrophy or vaginitis were eligible for inclusion. We excluded non‐randomised studies (e.g. studies with evidence of inadequate sequence generation such as alternate days, patient numbers) as they are associated with a high risk of bias.
Types of participants
Postmenopausal women, who had not menstruated for more than 12 months or who had a serum follicle stimulating hormone (FSH) level >= 40 IU/L were eligible for inclusion. Women who had undergone bilateral oophorectomy (removal of both ovaries) were also eligible for inclusion. Women with intercurrent major disease or who had had previous hormone therapy (HT) within three months of commencement of the study were excluded.
Types of interventions
Trials comparing oestrogen supplementation administered intra‐vaginally versus any other active intervention or placebo were eligible for inclusion. These included creams or gels, tablets, vagitories, ovules, pessaries, and an oestradiol‐releasing ring. Duration of treatment must have been at least three months, as this treatment duration should be sufficient to improve vaginal symptoms. For the purpose of the review vagitories, ovules and pessaries were termed as vaginal tablets.
Types of outcome measures
Primary outcomes
1. Improvement in symptoms as assessed by participants
Proportion of women showing cure or improvement (mild symptoms) in most bothersome symptoms relating to atrophy such as dryness, dyspareunia, itching, burning sensation and discomfort at end point (immediately following treatment), assessed using standardised instruments. We grouped symptoms and analysed them as a composite i.e. aggregate symptoms.
2. Endometrial thickness
This is a surrogate for adverse events such as endometrial hyperplasia/dysplasia or cancer. It was assessed as the proportion of women showing evidence of increase in endometrial thickness evaluated through assessment of endometrial stimulation (measured by the progestogen challenge test with withdrawal bleeding, ultrasound measurement of endometrial thickness, assessed at end point.
Secondary outcomes
3. Improvement in symptoms as assessed visually by clinicians
Proportion of women showing cure or improvement (mild symptoms) from clinician evaluation of the appearance of the vagina including vaginal mucosal pallor (pale appearance), petechiae (small red spots on the skin), friability (fragile and delicate tissue) and dryness at end point (immediately after treatment). We grouped symptoms and analysed them as a composite i.e. aggregate symptoms.
4. Improvement in symptoms as assessed by clinicians using laboratory parameters
Measurement of decrease in vaginal pH and assessment of increase in maturation indices, that is cytological assessment for parabasal, intermediate and superficial cells at end points (immediately after treatment). We analysed vaginal pH and maturation indices separately.
5. Other adverse events
Proportion of women with adverse events at end point from treatment, including breast disorders (e.g. breast pain, enlargement or engorgement which may be considered a surrogate marker (indirect indicator) for systemic absorption, and blood oestradiol levels), and total adverse events (excluding breast disorders).
6. Adherence to treatment
Proportion of women adhering to treatment regimen assessed immediately after treatment using participants who completed treatment adherence sheets.
Search methods for identification of studies
We searched for all published and unpublished RCTs of studies comparing intra‐vaginal oestrogen supplementation with any other active intervention or placebo, without language restriction and in consultation with the Gynaecology and Fertility Group Information Specialist.
Electronic searches
-
We searched the following electronic databases, trials registers and websites.
-
Cochrane Gynaecology and Fertility Specialised Register of Controlled Trials (searched 12 April 2016) (see Appendix 1 for search strategy)
-
the Cochrane Central Register of Controlled Trials (CENTRAL; The Cochrane Library 2016, Issue 4 (searched 12 April 2016) (see Appendix 2 for search strategy)
-
MEDLINE via Ovid (from 1966 to 12 April 2016) (see Appendix 3 for search strategy)
-
Embase via Ovid (1980 to 12 April 2016) (see Appendix 4 for search strategy)
-
PsycINFO via Ovid (1972 to 12 April 2016) (see Appendix 5 for search strategy
-
-
We combined the MEDLINE search with the Cochrane highly sensitive search strategy for identifying randomised trials in MEDLINE (Lefebvre 2011). We combined the Embase and PsycINFO searches with trial filters developed by the Scottish Intercollegiate Guidelines Network (SIGN) sign.ac.uk/methodology/filters.html#random.
-
Other electronic sources of trials included:
-
trials registers for ongoing and registered trials:
-
clinicaltrials.gov (a service of the US National Institutes of Health) (date of last search 12 April 2016);
-
who.int/ictrp/search/en/ (The World Health Organisation International Trials Registry Platform search portal) (date of last search 12 April 2016);
-
-
DARE (Database of Abstracts of Reviews of Effects) in the Cochrane Library at onlinelibrary.wiley.com/o/cochrane/cochrane_cldare_articles_fs.html (for reference lists from relevant non‐Cochrane reviews) (date of last search April 2016);
-
the Web of Knowledge wokinfo.com/ (another source of trials and conference abstracts) (date of last search 12 April 2016);
-
OpenGrey opengrey.eu/ for unpublished literature from Europe (date of last search 12 April 2016);
-
LILACS database lilacs.bvsalud.org/en/ (for trials from the Portuguese and Spanish speaking world) (date of last search 12 April 2016);
-
PubMed and Google Scholar (for recent trials not yet indexed in MEDLINE) (date of last search 12 April 2016).
-
-
There were no restrictions based on language, date of publication or study setting.
Searching other resources
We handsearched reference lists of articles retrieved by the search and contacted experts in the field to obtain additional data. We also handsearched relevant journals and conference abstracts that are not covered in the Cochrane Gynaecology and Fertility Specialised Register, in liaison with the Information Specialist.
Data collection and analysis
Selection of studies
After an initial screen of titles and abstracts retrieved by the search, conducted by ROA and AL, we retrieved the full texts of all potentially eligible studies. Two review authors (ROA and AL) independently examined these full‐text articles for compliance with the inclusion criteria and selected studies eligible for inclusion in the review. We contacted study investigators as required, to clarify study eligibility. We resolved disagreements as to study eligibility by discussion or by consulting a third review author. We documented the selection process with a PRISMA flow diagram (Moher 2009).
Data extraction and management
Two review authors (ROA and AL) independently extracted data from eligible studies using a data extraction form designed and pilot‐tested by the authors. We resolved any disagreements by discussion or by consulting a third review author. Data extracted included study characteristics and outcome data (see data extraction table for details, Appendix 6). We contacted study investigators for further data on methods or results, or both, as required.
Assessment of risk of bias in included studies
Two review authors (ROA and AL) independently assessed the included studies for risk of bias using the Cochrane risk of bias assessment tool to assess: selection (random sequence generation and allocation concealment); performance (blinding of participants and personnel); detection (blinding of outcome assessors); attrition (incomplete outcome data); reporting (selective reporting); and other bias such as imbalance in the numbers of participants randomised at baseline between treatment groups, and differences in demographic characteristics of participants between treatment groups (Higgins 2011). We took care to search for within‐trial selective reporting, such as trials failing to report obvious outcomes, or reporting them in insufficient detail to allow inclusion. We sought published protocols where possible and compared the outcomes between the protocol and the final published study. We resolved disagreements were resolved by discussion or by consulting a third review author. We described all judgements fully and presented the conclusions in the 'Risk of bias' table, which was incorporated into the interpretation of review findings.
Measures of treatment effect
For dichotomous data (e.g. proportion of participants showing improvement in symptoms), we used the numbers of events in the control and intervention groups of each study to calculate Mantel‐Haenszel odds ratios (ORs). For continuous data (e.g. endometrial thickness), we calculated mean differences (MDs) between treatment groups. We reversed the direction of effect of individual studies, if required, to ensure consistency across trials. We presented 95% confidence intervals (CI) for all outcomes. Where data to calculate ORs or MDs were not available, we utilised the most detailed numerical data available that facilitated similar analyses of included studies (e.g. test statistics, P values). We assessed whether the estimates calculated in the review for individual studies were compatible in each case with the estimates reported in the study publications.
Unit of analysis issues
The primary analysis was per woman randomised. If studies reported data that did not allow valid analysis, we contacted study authors for further details; if we could not obtain appropriate data, such data were not included in meta‐analyses.
Dealing with missing data
We analysed the data on an intention‐to‐treat (ITT) basis as far as possible and attempts were made to obtain missing data from the original trialists. Where these were unobtainable, we analysed only the available data.
Assessment of heterogeneity
We considered whether the clinical and methodological characteristics of the included studies were sufficiently similar for meta‐analysis to provide a clinically meaningful summary. We assessed statistical heterogeneity by the measure of the I2 statistic (Higgins 2003). An I2 measurement greater than 50% was taken to indicate substantial heterogeneity (Deeks 2011)
Assessment of reporting biases
In view of the difficulty of detecting and correcting for publication bias and other reporting biases, we minimised their potential impact by ensuring a comprehensive search for eligible studies and by being alert for duplication of data. Where there were 10 or more studies in an analysis, we planned to use a funnel plot to explore the possibility of small study effects (a tendency for estimates of the intervention effect to be more beneficial in smaller studies) (Sterne 2011). However, this was not undertaken because none of the analyses included 10 or more studies.
Data synthesis
Where studies were considered sufficiently similar, we combined the data using a fixed‐effect model in the following comparisons.
-
Oestrogen ring versus other regimens
-
Oestrogen tablets versus other regimens
-
Oestrogen cream or gel versus other regimens
We stratified all comparisons by other regimens.
An increase in the odds of a particular outcome, which may be beneficial (e.g. improvement in symptoms) or detrimental (e.g. adverse events), was displayed graphically in the meta‐analyses to the right of the centre‐line, and a decrease in the odds of an outcome to the left of the centre‐line.
Subgroup analysis and investigation of heterogeneity
We planned to conduct subgroup analyses to determine the separate evidence within the following subgroups.
-
Duration of symptoms of vaginal atrophy
-
Severity of symptoms of vaginal atrophy
We could not conduct subgroup analyses, however, due to insufficient data.
Where substantial heterogeneity was detected, we explored possible explanations in sensitivity analyses. We took any statistical heterogeneity into account when interpreting the results, especially where there was any variation in the direction of effect.
Sensitivity analysis
We conducted sensitivity analyses for the primary outcomes (improvement in symptoms as assessed by the women, and endometrial thickness) to determine whether the conclusions were robust to arbitrary decisions made regarding the eligibility and analysis. These analyses included consideration of whether the review conclusions would have differed if:
-
the summary effect measure was relative risk rather than odds ratio; and
-
we had adopted a random‐effects model.
Overall quality of the body of evidence: 'Summary of findings' table
We prepared 'Summary of findings' tables using GRADEpro GDT (GRADEpro GDT 2015). These tables evaluated the overall quality of the body of evidence for the main review outcomes (improvement in symptoms as assessed by the women, endometrial thickness, improvement in symptoms as assessed by clinicians and total adverse events), using GRADE criteria (study limitations (i.e. risk of bias), consistency of effect, imprecision, indirectness and publication bias) (Schünemann 2011). Judgements about evidence quality (high, moderate or low) were justified, documented, and incorporated into reporting of results for each outcome.
Results
Description of studies
Results of the search
The searches retrieved a total of 645 articles after removal of duplicates. Fifty‐eight studies (59 references) were potentially eligible and were retrieved in full text. We included 30 studies (31 references) that met our inclusion criteria; we excluded 26 studies, while one study (two references) was classified as 'awaiting classification'. See study tables: Characteristics of included studies, Characteristics of excluded studies, Characteristics of studies awaiting classification.
We have illustrated the process involved in the inclusion and exclusion of studies in a PRISMA flow diagram (Figure 1).

Study flow diagram
Included studies
Study design and setting
We included 30 parallel‐design randomised controlled trials (RCTs). Single centre trials took place in Brazil (Fernandes 2014; Lima 2013), India (Raghunandan 2010), Iran (Hosseinzadeh 2015), Italy (Sardinia) (Dessole 2004), Mexico (Garcia Lara 1993), Sweden (Bygdeman 1996), Thailand (Manonai 2001) and USA (Karp 2012). Multicentre trials took place in Australia (Ayton 1996; Weisberg 2000); Austria, Switzerland and Germany (Casper 1999 study 1); Belgium (Foidart 1991); Canada (Rioux 2000); Canada and USA (Bachmann 2009; Simon 2008); Croatia (Simunic 2003); Denmark (Eriksen 1992; Lose 2000); Germany (Casper 1999 study 2; Griesser 2012); Netherlands (Barentsen 1997); Norway (Dugal 2000); Spain (Cano 2012); Sweden, Finland and Denmark (Henriksson 1994); and USA (Bachmann 2008; Nachtigall 1995; Speroff 2003). Two trials did not state their location (Mac Bride 2014; Nachtigall 1994).
Participants
The studies included 6235 postmenopausal women with symptoms of vaginal atrophy. The mean age across studies ranged from 45 to 66 years. Most of the included trials required that women had any, or all symptoms of urogenital atrophy: vaginal dryness with or without dyspareunia, pruritus, dysuria and or urgency; and signs of atrophic vaginitis, including: pallor (pale appearance to skin), petechiae, friability (fragile and delicate skin) and dryness. Other inclusion criteria included being naturally menopausal for at least one year, or surgically menopausal (bilateral oophorectomy) for at least one year. Exclusion criteria for most studies included: known to have hormone‐dependent neoplasia and women who had taken systemic or vaginal oestrogens within three to six months of commencement of the study. Full details of the inclusion and exclusion criteria are found in the Characteristics of included studies.
Interventions
The trials included a wide variety of interventions under three broad comparisons:
-
Oestrogen ring versus other regimens:
-
oestrogen ring versus oestrogen cream (Ayton 1996; Barentsen 1997; Nachtigall 1995);
-
oestrogen ring versus oestrogen tablets (Casper 1999 study 1; Henriksson 1994; Lose 2000; Weisberg 2000);
-
oestrogen ring versus placebo ring (Casper 1999 study 2; Karp 2012; Speroff 2003).
-
-
Oestrogen tablets versus other regimens:
-
oestrogen tablets versus oestrogen cream (Ayton 1996; Hosseinzadeh 2015; Manonai 2001; Rioux 2000);
-
oestrogen tablets versus placebo tablets (Bachmann 2008; Dessole 2004; Eriksen 1992; Foidart 1991; Garcia Lara 1993; Griesser 2012); Simon 2008; Simunic 2003);
-
oestradiol tablets versus oestriol tablets: (Dugal 2000).
-
-
Oestrogen cream versus other regimens:
-
oestrogen cream versus non‐hormonal local bio adhesive vaginal moisturising gel (Bygdeman 1996; Nachtigall 1994);
-
oestrogen cream versus isoflavone gel (Lima 2013);
-
oestrogen cream versus non‐hormonal lubricant gel (Raghunandan 2010);
-
oestrogen cream versus placebo cream (Bachmann 2009; Cano 2012).
-
The duration of intervention was 12 weeks in most of the included studies. In other studies, the duration varied between 13 weeks (Speroff 2003), 15 weeks (Nachtigall 1995), four months (Garcia Lara 1993), six months (Dessole 2004; Dugal 2000; Foidart 1991; Lose 2000; Rioux 2000) and 12 months (Simunic 2003).
Outcomes
In the previous update, the review authors excluded one study on the basis of not reporting outcomes relevant to the review, and we did not include this study in the current update either (Tolino 1990). In the current update, we did not exclude any studies for not reporting the review's relevant outcomes. Symptoms reported by the included studies were many and disparate, therefore we grouped symptoms found to be consistent across studies as composites, where appropriate. For participant‐assessed improvement, the symptoms found to be consistent across studies were dryness, itching, dysuria and dyspareunia. For clinician‐assessed improvement, the components of composite were vaginal mucosal pallor (pale appearance), petechiae (small red spots on the skin), friability (fragile and delicate tissue) and dryness. The components of breast disorders were: breast pain, enlargement and engorgement. We considered consistency in directions of effect estimates of individual components before we reported them as composites. Thus all symptoms grouped as composites have similar directions in effect estimates.
Primary outcomes
The primary outcomes for this review are improvement in symptoms as assessed by the women, and endometrial thickness (adverse event).
Twelve of the included studies measured improvement in symptoms, defined as the proportion of women showing cure or improvement (mild symptoms) in most bothersome symptoms relating to atrophy (participant‐assessed at end point i.e. immediately after treatment) (Ayton 1996; Barentsen 1997; Cano 2012; Casper 1999 study 2; Garcia Lara 1993; Henriksson 1994; Hosseinzadeh 2015; Lima 2013; Lose 2000; Manonai 2001; Simunic 2003; Weisberg 2000). We assessed the severity of symptoms relating to atrophy at end point using the visual analogue scale (VAS) (or its modified form) in all the studies that reported this outcome. The VAS is a psychometric response scale for subjective assessment of certain attributes such as pain, which cannot be measured directly; it has been found to be sufficiently reliable and valid as a measuring instrument.
Four of the included studies assessed endometrial thickness (Ayton 1996; Manonai 2001; Nachtigall 1995; Rioux 2000).
Secondary outcomes
The review's secondary outcome measures are improvement in symptoms as assessed by clinicians through physical examination of the vagina, improvement in symptoms as assessed by clinicians using laboratory parameters (decrease in vaginal pH and increase in maturation indices), other adverse events (breast disorders and total adverse events) and adherence to treatment.
Eleven of the included studies measured improvement in symptoms (clinician‐assessed) (Ayton 1996; Barentsen 1997; Cano 2012; Casper 1999 study 2; Garcia Lara 1993; Griesser 2012; Henriksson 1994; Hosseinzadeh 2015; Lose 2000; Nachtigall 1995; Simunic 2003).
Eleven of the included studies assessed improvement in symptoms (decrease in vaginal pH) (Bachmann 2009; Barentsen 1997; Bygdeman 1996; Henriksson 1994; Cano 2012; Casper 1999 study 2; Dessole 2004; Griesser 2012; Karp 2012; Manonai 2001; Nachtigall 1994).
Eight of the included studies measured improvement in symptoms (increase in maturation indices) (Ayton 1996; Barentsen 1997; Cano 2012; Casper 1999 study 2; Griesser 2012; Karp 2012; Manonai 2001; Speroff 2003).
Five of the included studies measured adverse events (breast disorders) (Casper 1999 study 1; Dugal 2000; Henriksson 1994; Lose 2000; Nachtigall 1995) while four included studies measured total adverse events (Karp 2012; Nachtigall 1995; Raghunandan 2010; Simon 2008).
Five of the included studies assessed adherence to treatment (Ayton 1996; Dugal 2000; Henriksson 1994; Manonai 2001; Nachtigall 1995).
Six of the included studies either did not report any of the review's outcomes (Fernandes 2014) or measured them in non‐usable forms such as median (range), mean (SE) or mean without SD, dichotomous as against continuous data, reporting of only the level of statistical significance (P values), etc (Bachmann 2008; Mac Bride 2014; Casper 1999 study 2; Eriksen 1992; Foidart 1991;). We did not, therefore, include these studies in quantitative synthesis (meta‐analyses). We included Fernandes 2014 in the review, although it did not report any of the review's outcomes; the study focused mainly on sexual function‐related outcomes such as arousal, lubrication, satisfaction and orgasm.
Excluded studies
We excluded 26 studies from the review for the following reasons:
-
seven studies were not RCTs;
-
10 studies did not administer treatment for up to 12 weeks;
-
five studies did not make use of relevant interventions;
-
three studies did not include relevant participants;
-
one study did not report relevant outcomes (this was used as an exclusion criterion in the last update; studies were, however, not excluded on the basis of not reporting relevant outcomes in the current update).
Risk of bias in included studies
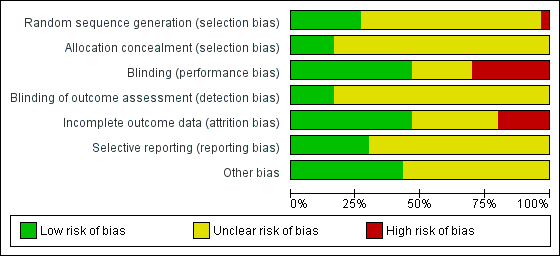
Risk of bias graph: review authors' judgements about each risk of bias item presented as percentages across all included studies

Risk of bias summary: review authors' judgements about each risk of bias item for each included study
Allocation
Sequence generation
Eight studies were at low risk of selection bias related to sequence generation, as they used computer randomisation or a random numbers table (Ayton 1996; Karp 2012; Nachtigall 1995; Rioux 2000; Simon 2008; Simunic 2003; Speroff 2003; Weisberg 2000). Twenty‐one studies did not describe the method used and were at unclear risk of this bias (Bachmann 2008; Bachmann 2009; Barentsen 1997; Mac Bride 2014; Bygdeman 1996; Cano 2012; Casper 1999 study 1; Casper 1999 study 2; Dessole 2004; Dugal 2000; Eriksen 1992; Foidart 1991; Garcia Lara 1993; Griesser 2012; Henriksson 1994; Hosseinzadeh 2015; Lima 2013; Lose 2000; Manonai 2001; Nachtigall 1994; Raghunandan 2010). We rated the remaining study as being at high risk of bias because the study authors stated that participants were given a number according to their order of inclusion in the study (Fernandes 2014).
Allocation concealment
Five studies were at low risk of selection bias related to allocation concealment, as they used sequentially‐numbered sealed opaque envelopes (Ayton 1996; Bachmann 2008; Karp 2012; Simon 2008; Weisberg 2000). The remaining 25 studies failed to describe methods of allocation concealment and we rated these as at unclear risk of bias for this domain (Bachmann 2009; Barentsen 1997; Mac Bride 2014; Bygdeman 1996; Cano 2012; Casper 1999 study 1; Casper 1999 study 2; Dessole 2004; Dugal 2000; Eriksen 1992; Fernandes 2014; Foidart 1991; Garcia Lara 1993; Griesser 2012; Henriksson 1994; Hosseinzadeh 2015; Lima 2013; Lose 2000; Manonai 2001; Nachtigall 1994; Nachtigall 1995; Raghunandan 2010; Rioux 2000; Simunic 2003; Speroff 2003).
Blinding
We considered that blinding might influence both the primary and secondary outcomes as some of them were subjectively assessed either by participants or personnel. Most of the included studies reported at least one of both primary and secondary outcomes. Fourteen studies were at low risk of performance bias because both participants and personnel were blinded (double‐blinded trials) (Bachmann 2008; Bachmann 2009; Cano 2012; Casper 1999 study 2; Dessole 2004; Eriksen 1992; Fernandes 2014; Foidart 1991; Garcia Lara 1993; Griesser 2012; Lima 2013; Simon 2008; Simunic 2003; Speroff 2003); seven studies did not report whether or not participants or personnel, or both, were blinded and we, therefore, rated them as unclear (Ayton 1996; Barentsen 1997; Mac Bride 2014; Dugal 2000; Hosseinzadeh 2015; Karp 2012; Raghunandan 2010). The remaining nine studies were open‐label trials and we, therefore, assessed them as being at high risk of performance bias (Bygdeman 1996; Casper 1999 study 1; Henriksson 1994; Lose 2000; Manonai 2001; Nachtigall 1994; Nachtigall 1995; Rioux 2000; Weisberg 2000).
In the domain of detection bias, we assessed five studies as being at low risk of bias because the outcome assessors were blinded as well as participants and personnel (some of the outcomes were assessed by participants and personnel) (Bachmann 2008; Bachmann 2009; Cano 2012; Griesser 2012; Lima 2013). In the remaining 25 studies, outcome assessment by participants, clinicians and assessors was not completely blinded and we, therefore, assessed them as unclear with respect to blinding of outcome assessment (detection bias) (Ayton 1996; Barentsen 1997; Mac Bride 2014; Bygdeman 1996; Casper 1999 study 1; Casper 1999 study 2; Dessole 2004; Dugal 2000; Eriksen 1992; Fernandes 2014; Foidart 1991; Garcia Lara 1993; Henriksson 1994; Hosseinzadeh 2015; Karp 2012; Lose 2000; Manonai 2001; Nachtigall 1994; Nachtigall 1995; Raghunandan 2010; Rioux 2000; Simon 2008; Simunic 2003; Speroff 2003; Weisberg 2000).
Incomplete outcome data
We rated 14 trials at low risk of bias with respect to attrition bias either because there were no withdrawals or losses to follow‐up or because they analysed all or most (> 95%) of the women randomised (Ayton 1996; Bachmann 2008; Bachmann 2009; Barentsen 1997; Bygdeman 1996; Dessole 2004; Dugal 2000; Fernandes 2014; Griesser 2012; Hosseinzadeh 2015; Lose 2000; Nachtigall 1994; Raghunandan 2010; Simon 2008). In 10 studies, there was insufficient evidence to make a conclusive judgement in relation to attrition bias and we, therefore, assessed them as unclear (Mac Bride 2014; Cano 2012; Casper 1999 study 2; Foidart 1991; Garcia Lara 1993; Henriksson 1994; Karp 2012; Manonai 2001; Nachtigall 1995; Speroff 2003). In the remaining six studies, the proportions of withdrawals, or reasons for withdrawals or losses to follow‐up differed substantially between the treatment groups and we did not analyse the data on the basis of ITT. We therefore rated these studies as being at high risk with respect to attrition bias (Casper 1999 study 1; Eriksen 1992; Lima 2013; Rioux 2000; Simunic 2003; Weisberg 2000).
Selective reporting
No protocol of any included study was available for assessment in relation to pre‐specified outcome measures. We therefore assessed this domain of bias using the information available in the methods sections of the published papers. We rated nine studies as being at low risk of selective reporting bias, as they reported all outcomes pre‐specified in the methods section (Bachmann 2008; Bachmann 2009; Cano 2012; Fernandes 2014; Griesser 2012; Hosseinzadeh 2015; Karp 2012; Raghunandan 2010; Simon 2008). The remaining 21 studies we rated at unclear risk of selective reporting bias, as there was insufficient information to make a conclusive judgement (Ayton 1996; Barentsen 1997; Mac Bride 2014; Bygdeman 1996; Casper 1999 study 1; Casper 1999 study 2; Dessole 2004; Dugal 2000; Eriksen 1992; Foidart 1991; Garcia Lara 1993; Henriksson 1994; Lima 2013; Lose 2000; Manonai 2001; Nachtigall 1994; Nachtigall 1995; Rioux 2000; Simunic 2003; Speroff 2003; Weisberg 2000).
Other potential sources of bias
We assessed 13 studies as being at low risk of within‐study bias as baseline demographic characteristics such as age and BMI were similar or the numbers of participants randomised to treatment groups were balanced at baseline (Ayton 1996; Bachmann 2008; Bachmann 2009; Dugal 2000; Griesser 2012; Hosseinzadeh 2015; Karp 2012; Lima 2013; Lose 2000; Nachtigall 1995; Raghunandan 2010; Rioux 2000; Simon 2008) The remaining 17 studies did not report sufficient information to make a conclusive judgement in relation to within‐study bias (Barentsen 1997; Mac Bride 2014; Bygdeman 1996; Cano 2012; Casper 1999 study 1; Casper 1999 study 2; Dessole 2004; Eriksen 1992; Fernandes 2014; Foidart 1991; Garcia Lara 1993; Henriksson 1994; Manonai 2001; Nachtigall 1994; Simunic 2003; Speroff 2003; Weisberg 2000).
Effects of interventions
See: Summary of findings for the main comparison Oestrogen ring compared to other regimens for vaginal atrophy in postmenopausal women; Summary of findings 2 Oestrogen tablets compared to other regimens for vaginal atrophy in postmenopausal women; Summary of findings 3 Oestrogen cream compared to other regimens for vaginal atrophy in postmenopausal women
1. Oestrogen ring versus other regimens
Primary outcomes
1.1 Improvement in symptoms (participant‐assessed at end point)

Forest plot of comparison: 1 Oestrogen ring versus placebo or other regimens, outcome: 1.1 Improvement in symptoms (participant‐assessed at end point).
1.1.1 Oestrogen ring versus oestrogen cream
There was no evidence of a difference in the proportions of women who reported improvement in symptoms between women who were treated with oestrogen ring and those who received oestrogen cream (OR 1.33, 95% CI 0.80 to 2.19, two RCTs, n = 341, I2 = 0%, low‐quality evidence). The evidence suggests that if the chance of improvement in symptoms following treatment with oestrogen cream is assumed to be 72%, the chance following treatment with oestrogen ring would be between 67% and 85%. On sensitivity analysis using risk ratio (RR) (RR 1.08, 95% CI 0.94 to 1.23) or a random‐effects model (OR 1.33, 95% CI 0.81 to 2.19), there was no change in the direction of the effect estimate or the evidence.
1.1.2 Oestrogen ring versus oestrogen tablets
Similarly, there was no evidence of a difference in the proportions of women who reported improvement in symptoms between women who received oestrogen ring and those who were treated with oestrogen tablets (OR 0.78, 95% CI 0.53 to 1.15, three RCTs, n = 567, I2 = 0%, low‐quality evidence). The evidence suggests that if the chance of improvement in symptoms following treatment with oestrogen tablets is assumed to be 58%, the chance following treatment with oestrogen ring would be between 43% and 62%. A similar pattern was observed in the direction of the effect estimate with no change in the evidence on sensitivity analysis using RR (RR 0.92, 95% CI 0.81 to 1.05) or a random‐effects model (OR 0.78, 95% CI 0.53 to 1.15).
1.1.3 Oestrogen ring versus placebo
A higher proportion of women reported improvement in symptoms following treatment with oestrogen ring compared with placebo (OR 12.67, 95% CI 3.23 to 49.66, one RCT, n = 67). On sensitivity analysis, there was no difference in the direction of the effect estimate or the evidence using RR (RR 2.06, 95% CI 1.39 to 3.05) or a random‐effects model (OR 12.67, 95% CI 3.23 to 49.66).
1.2. Endometrial thickness
1.2.1. Oestrogen ring versus oestrogen cream
A higher proportion of women who received oestrogen cream showed evidence of increase in endometrial thickness compared to those who were treated with oestrogen ring (OR 0.36, 95% CI 0.14 to 0.94, two RCTs, n = 273; I2 = 0%, low‐quality evidence). The evidence suggests that if the risk of increase in endometrial thickness following treatment with oestrogen cream is assumed to be 12%, the risk following treatment with oestrogen ring would be between 2% and 11%. Both studies used higher doses of cream than is currently recommended in clinical practice, which may have caused systemic absorption and increase in endometrial thickness. In one trial, 1 g of oestrogen cream was administered as a preparation containing 0.625 mg of conjugated equine oestrogen every night for 12 weeks (Ayton 1996). In the other trial, 2 g of the preparation was administered three times weekly for 12 weeks (Nachtigall 1995).
There was no change to the direction of the effect estimate or the evidence on sensitivity analysis using RR (RR 0.39, 95% CI 0.16 to 0.95) or a random‐effects model (OR 0.37, 95% CI 0.14 to 0.96).
Secondary outcomes
1.3. Improvement in symptoms (clinician‐assessed at end point)
1.3.1. Oestrogen ring versus oestrogen cream
There was no evidence of a difference in improvement in symptoms as assessed by clinicians at 12 weeks between women who received oestrogen ring and those who were treated with oestrogen cream (OR 1.04, 95% CI 0.70 to 1.53, three RCTs, n = 533, I2 = 0%, low‐quality evidence). The evidence suggests that if the chance of improvement in symptoms following treatment with oestrogen cream is assumed to be 71%, the chance following treatment with oestrogen ring would be between 63% and 79%.
1.3.2. Oestrogen ring versus oestrogen tablets
Similarly, there was no evidence of a difference in improvement in symptoms between women who received oestrogen ring and those who were treated with oestrogen tablets, (OR 1.45, 95% CI 0.90 to 2.32, two RCTs, n = 397, I2 = 0%, low‐quality evidence). The evidence suggests that if the chance of improvement in symptoms following treatment with oestrogen tablets is assumed to be 64%, the chance following treatment with oestrogen ring would be between 61% and 80%.
1.3.3. Oestrogen ring versus placebo
There was no difference in improvement in symptoms between women who received oestrogen ring and those who received placebo ring (OR 2.00, 95% CI 0.55 to 7.31, one RCT, n = 49).
1.4. Improvement in symptoms (decrease in vaginal pH at end point)
1.4.1. Oestrogen ring versus oestrogen cream
There was no evidence of a difference in improvement in symptoms as assessed using decrease in values of vaginal pH (difference in values at baseline and at 12 weeks) between women who were treated with oestrogen ring and those who received oestrogen cream (MD 0.10, 95% CI ‐0.19 to 0.39, one RCT, n = 165).
1.4.2. Oestrogen ring versus oestrogen tablets
Women who were treated with oestrogen ring demonstrated evidence of improvement in symptoms with a lower mean difference (MD) in vaginal pH (better outcome) compared with those who received oestrogen tablets (MD ‐0.20, 95% CI ‐0.38 to ‐0.02, one RCT, n = 146).
1.4.3. Oestrogen ring versus placebo
There was evidence of a difference in improvement in symptoms between women who received oestrogen ring and those who were treated with placebo, with women on oestrogen ring recording a lower MD in vaginal pH (better outcome) compared with women on placebo (MD ‐1.31, 95% CI ‐1.82 to ‐0.80, one RCT, n = 37). A second study reported this outcome but not in a form that allowed inclusion in meta‐analysis.
1.5. Improvement in symptoms (increase in maturation indices at end point)
1.5.1. Oestrogen ring versus oestrogen cream
There was no evidence of a difference in improvement in symptoms as assessed using increase in values of vaginal maturation indices at end point between women who received oestrogen ring and those who were treated with oestrogen cream (MD 0.79, 95% CI ‐1.52 to 3.09, two RCTs, n = 341, I2 = 0%).
1.5.2. Oestrogen ring (7.5 µg) versus oestrogen tablets
Result of analysis not estimable: no usable data were available.
1.5.3. Oestrogen ring (100 µg) versus placebo
Result of analysis not estimable: no usable data were available.
1.5.4. Oestrogen ring (50 µg) versus placebo
Result of analysis not estimable: no usable data were available.
1.5.5. Oestrogen ring (unspecified dose) versus placebo
Women who received oestrogen ring demonstrated evidence of a higher MD in maturation indices (better outcome) compared with those who were treated with placebo (MD 24.40, 95% CI 15.25 to 33.55, one RCT, n = 37).
1.6. Adverse events (breast disorders)
1.6.1. Oestrogen ring versus oestrogen cream
There was no evidence of a difference in the proportions of women with breast disorders between the two treatment groups (OR 0.12, 95% CI 0.01 to 1.13, one RCT, n = 192).
1.6.2. Oestrogen ring versus tablets
There was no evidence of a difference in the proportions of women with breast disorders between women who received oestrogen ring and those who were treated with oestrogen tablets (OR 0.42, 95% CI 0.12 to 1.52, three RCTs, n = 587, I2 = 0%).
1.7. Adverse events (total adverse events)
1.7.1. Oestrogen ring versus oestrogen cream
There was no evidence of a difference in the proportions of women with total adverse events between the two treatment groups (OR 0.88, 95% CI 0.47 to 1.63, one RCT, n = 192, low‐quality evidence). The evidence suggests that if the risk of total adverse events following treatment with oestrogen cream is assumed to be 36%, the risk following treatment with oestrogen ring would be between 21% and 48%.
1.7.2. Oestrogen ring versus placebo
There was no evidence of a difference in the proportions of women with total adverse events between the two treatment groups (OR 0.45, 95% CI 0.11 to 1.78, one RCT, n = 37, moderate‐quality evidence). The evidence suggests that if the risk of total adverse events following treatment with placebo is assumed to be 44%, the risk following treatment with oestrogen ring would be between 8% and 59%.
1.8. Adherence to treatment
1.8.1. Oestrogen ring versus oestrogen cream
There was evidence of a higher proportion of adherence to treatment among women who were treated with oestrogen ring compared with those who received oestrogen cream (OR 2.23, 95% CI 1.31 to 3.80, two RCTs, n = 350, I2 = 70%) The presence of substantial heterogeneity was explored in a sensitivity analysis: there was no change in the evidence on sensitivity analysis using RR (RR 1.19, 95% CI 1.05 to 1.35) or a random‐effects model (OR 2.24, 95% CI 0.83 to 6.05). There were no variations in the directions of effect estimates of individual trials included in the meta analysis.
1.8.2. Oestrogen ring versus oestrogen tablets
There was no evidence of a difference in the proportions of women who adhered to the treatment regimen between the two treatment groups (OR 1.69, 95% CI 0.66 to 4.31, one RCT, n = 146).
2. Oestrogen tablets versus other regimens
Primary outcomes
2.1. Improvement in symptoms (participant‐assessed at end point)

Forest plot of comparison: 2 Oestrogen tablets versus placebo or other regimens, outcome: 2.1 Improvement in symptoms (participant‐assessed at end point).
2.1.1. Oestrogen tablets versus oestrogen cream
There was no evidence of a difference in the proportions of women who reported improvement in symptoms between the two treatment groups (OR 1.06, 95% CI 0.55 to 2.01, two RCTs, n = 208, I2 = 0% low‐quality evidence). The evidence suggests that if the chance of improvement in symptoms following oestrogen tablets is assumed to be 68%, the chance following oestrogen cream would be between 54% and 81%. There was no difference in the above evidence on sensitivity analysis using RR (RR 1.01, 95% CI 0.86 to 1.20) or a random‐effects model (OR 1.06, 95% CI 0.55 to 2.01).
2.1.2. Oestrogen tablets versus placebo
There was evidence of a difference in the proportions of women who reported improvement in symptoms between the two treatment groups with a higher proportion reporting improvement in the oestrogen tablet group (OR 12.47, 95% CI 9.81 to 15.84, two RCTs, n = 1638, I2 = 83%, low‐quality evidence). The evidence suggests that if the chance of improvement following placebo is assumed to be 29%, the chance following oestrogen tablets would be between 80% and 87%. We explored the presence of substantial heterogeneity between the two studies that contributed data to the meta analysis using sensitivity analysis. The results on using RR were similar to the results above, showing evidence of a difference in improvement in symptoms between the two treatment groups; however, a random‐effects model showed no evidence of a difference in the proportions of women who reported improvement in symptoms between the two treatment groups (OR 5.80, 95% CI 0.88 to 38.29). In addition, although there were no variations in the directions of the effect estimates between the two studies, one of the studies demonstrated a substantial difference in symptom improvement between the two treatment groups while the other showed no evidence of a difference. A close look at the two studies showed some differences with respect to participants and doses of interventions. One of the studies (Garcia Lara 1993 included women aged 43 to 45 years and treated them with vaginal ovules of oestradiol 3.5 mg, two per week in the first three weeks and one per week for the remaining weeks over a period of four months. The second study (Simunic 2003) included women between 51 and 66 years who were treated with 25 µg of micronised 17β‐oestradiol vaginal tablet once a day over a period of two weeks and then twice a week for the remaining 12 months. This study was assessed as at high risk of attrition bias as the proportions of withdrawals differed between the two treatment groups and data were not analysed on the basis of ITT.
2.2. Endometrial thickness
2.2.1. Oestrogen tablets versus oestrogen cream
There was no evidence of a difference in the proportions of women with increase in endometrial thickness between the two treatment groups (OR 0.31, 95% CI 0.06 to 1.60, two RCTs, n = 151, I2 = 0%, low‐quality evidence). This suggests that if the risk of increase in endometrial thickness following oestrogen cream is assumed to be 8%, the risk following oestrogen tablets would be between 5% and 12%. On sensitivity analysis, the evidence was the same using either RR (RR 0.33, 95% CI 0.07 to 1.59) or a random‐effects model (OR 0.34, 95% CI 0.06 to 1.92).
Secondary outcomes
2.3. Improvement in symptoms (clinician‐assessed at end point)
2.3.1. Oestrogen tablets versus oestrogen cream
There was no evidence of a difference in the proportions of women with improvement in symptoms between the two treatment groups as assessed by the clinicians (OR 1.03, 95% CI 0.70 to 1.52, three RCTs, n = 528, I2 = 0%, low‐quality evidence). The evidence suggests that if the chance of improvement following oestrogen cream is assumed to be 70%, the chance following oestrogen tablets would be between 61% and 77%.
2.3.2. Oestrogen tablets versus placebo
A higher proportion of women who were treated with oestrogen tablets showed evidence of improvement in symptoms when compared to those who received placebo (OR 12.85, 95% CI 10.39 to 15.89, four RCTs, n = 2078, I2 = 93%, low‐quality evidence). The evidence suggests that if the chance of improvement following placebo is assumed to be 26%, the chance following oestrogen tablets would be between 79% and 85%. There was no change in the evidence on sensitivity analysis using RR (RR 3.10, 95% CI 2.78 to 3.46) or a random‐effects model (OR 6.07, 95% CI 2.07 to 17.85). A further sensitivity analysis removing Simunic 2003 which was at high risk of attrition bias eliminated the heterogeneity and the benefit of the intervention remained. We suggest that the magnitude of the effect seen should be interpreted with caution.
2.4. Improvement in symptoms (decrease in vaginal pH at end point)
2.4.1. Oestrogen tablets versus oestrogen cream
There was no evidence of a difference in improvement in symptoms between the two treatment groups as assessed using the values of vaginal pH (MD 0.20, 95% CI ‐0.12 to 0.52, one RCT, n = 48).
2.4.2. Oestrogen tablets versus placebo
Women who were treated with oestrogen tablets demonstrated evidence of improvement in symptoms with a lower mean difference (MD) in vaginal pH (better outcome) compared with those who received placebo (MD ‐0.95, 95% CI ‐1.10 to ‐0.80, three RCTs, n = 524, I2 = 40%).
2.5. Improvement in symptoms (increase in maturation indices at end point)
2.5.1. Oestrogen tablets versus oestrogen cream
There was no evidence of a difference in improvement in symptoms between the two treatment groups as assessed using the values of vaginal maturation indices (MD ‐4.69, 95% CI ‐13.58 to 4.20, one RCT, n = 48).
2.5.2. Oestrogen tablets versus placebo
Women who were treated with oestrogen tablets demonstrated evidence of improvement in symptoms with a higher mean difference in maturation indices (better outcome) compared with those who received placebo (MD 18.63, 95% CI 14.57 to 22.69, two RCTs, n = 436, I2 = 72%). The evidence did not differ on sensitivity analysis using a random‐effects model (MD 18.50, 95% CI 10.76 to 26.24). In addition, there were no variations in the directions of the effect estimates of individual studies.
2.6. Adverse events (breast disorders)
2.6.1. Oestradiol tablets versus oestriol tablets
There was no evidence of a difference in the proportions of women with breast disorders between the two treatment groups (OR 3.06, 95% CI 0.12 to 77.09, one RCT, n = 96).
2.7. Adverse events (total adverse events)
2.7.1. Oestrogen tablets versus placebo
There was no evidence of a difference in the proportions of women with total adverse events between the two treatment groups (OR 1.27, 95% CI 0.24 to 6.69, one RCT, n = 309, moderate‐quality evidence). The evidence suggests that if the risk of adverse events following placebo is assumed to be 2%, the risk following oestrogen tablets would be between 1% and 12%.
2.8. Adherence to treatment
2.8.1. Oestrogen tablets versus oestrogen cream
There was no evidence of a difference in the proportions of women who adhered to the treatment protocol between the two treatment groups (OR 1.90, 95% CI 0.41 to 8.94, one RCT, n = 53).
2.8.2. Oestradiol tablets versus oestriol tablets
A higher proportion of women who were treated with oestradiol tablets adhered to the treatment protocol when compared with those who received oestriol tablets (OR 2.69, 95% CI 1.15 to 6.31, one RCT, n = 96).
3. Oestrogen cream versus other regimens
Primary outcomes
3.1. Improvement in symptoms (participant‐assessed at end point)

Forest plot of comparison: 3 Oestrogen cream versus placebo or other regimens, outcome: 3.1 Improvement in symptoms (participant‐assessed at end point).
3.1.1. Oestrogen cream versus isoflavone gel
There was no evidence of a difference in the proportions of women with improvement in symptoms between the two treatment groups (OR 2.08, 95% CI 0.08 to 53.76, one RCT, n = 50, low‐quality evidence). The evidence suggests that if the chance of improvement following isoflavone gel is assumed to be 97%, the chance following oestrogen cream would be between 70% and 100%. This evidence did not change on sensitivity analysis using RR (RR 1.03, 95% CI 0.92 to 1.14) or a random‐effects model (OR 2.08, 95% CI 0.08 to 53.76).
3.1.2. Oestrogen cream versus placebo
There was evidence of a difference in the proportions of women with improvement in symptoms between the two treatment groups with more women in the oestrogen cream group reporting improvement in symptoms compared to those in the placebo group (OR 4.10, 95% CI 1.88 to 8.93, two RCTs, n = 198, I2 = 50%, low‐quality evidence). The evidence suggests that if the chance of improvement following placebo is assumed to be 69%, the chance following oestrogen cream would be between 80% and 95%. There was no change in the evidence on sensitivity analysis using RR (RR 1.31, 95% CI 1.11 to 1.54). However, a random‐effects model did not show any evidence of a difference in symptom improvement between the two treatment groups (OR 5.34, 95% CI 0.76 to 37.49) although there were no variations in the direction of the effect estimates of individual studies.
3.2. Endometrial thickness
This outcome was not reported by any of the included studies.
Secondary outcomes
3.3. Improvement in symptoms (clinician‐assessed at end point)
3.3.1. Oestrogen cream versus placebo
A higher proportion of women who were treated with oestrogen cream demonstrated improvement in symptoms as assessed by the clinicians, compared to those who received placebo (OR 3.29, 95% CI 1.47 to 7.36, one RCT, n = 153, low‐quality evidence). The evidence suggests that if the chance of improvement following placebo is assumed to be 65%, the chance following oestrogen cream would be between 73% and 93%.
3.4. Improvement in symptoms (decrease in vaginal pH at end point)
3.4.1. Oestrogen cream versus non‐hormonal local bio adhesive vaginal moisturising gel
There was evidence of a lower mean difference value (better outcome) in women who received oestrogen cream compared with those who were treated with non‐hormonal local bio adhesive vaginal moisturising gel (MD ‐0.36, 95% CI ‐0.52 to ‐0.21, two RCTS, n = 62, I2 = 72%). The presence of substantial heterogeneity was explored in a sensitivity analysis using a random effects model and there was no evidence of a difference in improvement in symptoms (decrease in vaginal pH) between the two treatment groups (MD ‐0.16, 95% CI ‐0.77 to 0.45). However, there were no variations in the direction of the effect estimate of individual studies. The standard deviations reported in Nachtigall 1994 appear unusually small. When this study was removed from the analysis there was no evidence of a difference between the groups using either analysis model.
3.4.2. Oestrogen cream (21 days) versus placebo (21 days)
Women who were treated with oestrogen cream daily for 21 days demonstrated evidence of improvement in symptoms with a lower mean difference in vaginal pH (better outcome) compared with those who received placebo for the same number of days (MD ‐1.20, 95% CI ‐1.47 to ‐0.93, one RCT, n = 215).
3.4.3. Oestrogen cream (twice weekly) versus placebo (twice weekly)
There was evidence of a lower mean difference value (better outcome) in women who received oestrogen cream twice weekly compared with those who were treated with placebo twice weekly (MD ‐1.30, 95% CI ‐1.58 to ‐1.02, one RCT, n = 208).
3.4.4. Oestriol gel (50 ug) versus placebo
Women who were treated with oestriol gel (50 ug) demonstrated evidence of improvement in symptoms with a lower mean difference in vaginal pH (better outcome) compared with those who received an equivalent dose of placebo (MD ‐0.80, 95% CI ‐1.23 to ‐0.37, one RCT, n = 153).
3.5. Improvement in symptoms (increase in maturation indices at end point)
3.5.1. Oestrogen cream versus placebo
Women who were treated with oestrogen cream demonstrated evidence of improvement in symptoms with a higher mean difference in maturation indices (better outcome) compared to those who received placebo (MD 23.70, 95% CI 17.25 to 30.15, one RCT, n = 153).
3.6. Adverse events (breast disorders
None of the included studies reported this outcome.
3.7. Adverse events (total adverse events)
3.7.1. Oestrogen cream versus non‐hormonal lubricant gel
There was no evidence of a difference in the proportions of women with total adverse events between the two treatment groups (OR 10.67, 95% CI 0.54 to 209.64, one RCT, n = 50).
3.8. Adherence to treatment
This outcome was not reported by any of the included studies.
No subgroup analysis was undertaken for any outcomes as there were insufficient data in the included studies.
Discussion
Summary of main results
This review assessed the efficacy and safety of available intra‐vaginal oestrogenic preparations, in particular the oestradiol‐releasing ring versus oestrogen creams, tablets or placebo, oestrogen tablets versus oestrogen cream, placebo or oestriol tablets and oestrogen cream versus isoflavone gel, non‐hormonal local bio adhesive vaginal moisturising gel, non‐hormonal lubricant gel or placebo.
We assessed efficacy using participant‐reported improvement in symptoms, clinician‐assessed improvement in symptoms, and laboratory as well as cytological evidence of improvement in symptoms; decrease in vaginal pH; and increase in vaginal maturation indices. We assessed safety using evidence of increase in endometrial thickness; incidents of breast disorders, such as breast pain and engorgement; and total adverse events associated with the treatment.
From the overall body of the findings, there was no conclusive evidence of a difference in efficacy between the various oestrogenic preparations compared with each other. However, findings from the review showed that oestrogenic preparations were associated with better efficacy in terms of improvement in symptoms compared with sham treatment or placebo. With respect to safety, there was no conclusive evidence of a difference in the main adverse events (endometrial thickness, breast disorders and total adverse events) between oestrogenic preparations versus each other or placebo. Although two small trials (Ayton 1996; Nachtigall 1995; n = 273) reported an increase in endometrial thickness in women who were treated with oestrogen cream compared to those who received oestrogen ring, the evidence was of low quality due to a high level of uncertainty associated with the effect estimate. In addition the studies used higher doses of cream than now recommended in clinical practice. In one trial, 1 g of oestrogen cream was administered as a preparation containing 0.625 mg of conjugated equine oestrogen every night for 12 weeks (Ayton 1996). In the other trial, 2 g of the preparation was administered three times weekly for 12 weeks (Nachtigall 1995). The recommended dose of conjugated equine oestrogen administered vaginally is 0.625 mg daily for one to two weeks as an induction therapy, followed by low doses for maintenance therapy (ACOG 2014). Typically this would be twice weekly in a clinical setting. Both studies thus used higher doses of cream than currently recommended in clinical practice which may have caused systemic absorption and increase in endometrial thickness. Further research using recommended doses of vaginal cream would be useful to confirm or refute this finding.
Effect estimates for both efficacy and safety measures were small with wide confidence intervals. The quality of the evidence for the GRADE‐specific outcomes (participant‐assessed improvement in symptoms, endometrial thickness, clinician‐assessed improvement in symptoms and total adverse events) was either low (for most of the outcomes) or moderate, indicating a high level of uncertainty in the effect estimates which may change with further research.
Overall completeness and applicability of evidence
This review set out to examine the evidence in respect of the efficacy and safety associated with intra‐vaginal oestrogenic preparations in relieving the symptoms of vaginal atrophy in postmenopausal women. All the included studies investigated postmenopausal women with symptoms of vaginal atrophy in a broad range of comparisons, including oestrogenic preparations compared with each other, placebo or non oestrogenic preparations. Although diverse outcome measures were investigated by the included studies, a number of them were relevant to the review's main objectives. However, most of the comparisons were investigated in small trials which were not adequately powered to detect effect estimates with low levels of uncertainty. In addition, the disparate nature of the treatment regimens made it difficult to combine data in meta analyses. Similarly, six of the included studies could not be included in quantitative synthesis because either they did not report outcome measures relevant to the review or reported them in non usable form. Thus the evidence was largely based on a small number of underpowered trials resulting in effect estimates with wide confidence intervals. Most of the included studies did not investigate endometrial thickness, which was one of the review's primary outcomes. Similarly, few included studies investigated other adverse events (breast disorders and total adverse events). In all the included studies, data were either not reported on long‐term outcomes or reported in non usable forms. We could not investigate the separate evidence of the effect of symptom duration and severity on the efficacy and safety of the various oestrogenic preparations due to insufficient data. This review excluded women with a history of severe atrophy and breast or endometrial cancer. Thus the efficacy and safety of local vaginal oestrogen were not assessed in this group of women. From a clinical point of view, it would be useful to consider these women in a future update of the review.
Quality of the evidence
All the identified interventions were subsumed under three main comparisons: oestrogen ring versus other regimens, oestrogen tablets versus other regimens and oestrogen cream versus other regimens. Four outcome measures were included in the 'Summary of findings' tables: improvement in symptoms (participant‐assessed), endometrial thickness, improvement in symptoms (clinician‐assessment) and adverse events (total adverse events). In oestrogen ring versus other regimens, data were available on all the GRADE‐specific outcomes. The quality of the evidence was low for all the outcomes except total adverse events, with moderate‐quality evidence. In the second comparison, oestrogen tablets versus other regimens, all the GRADE‐specific outcomes were assessed. A similar pattern of findings were observed as in the first comparison. In the third and final comparison, oestrogen cream versus other regimens, findings on one of the GRADE‐specific outcomes (endometrial thickness) were not incorporated into the table. The remaining outcomes were all of low quality.
Low‐quality evidence implies that further research is very likely to have an important impact on our confidence in the estimate of effect and is likely to change the estimate while moderate quality evidence while moderate‐quality evidence means that further research is likely to have an important impact on our confidence in the estimate of effect and may change the estimate.
The main limitations of the evidence were poor reporting (a majority of the included studies had most risk of bias domains assessed as unclear due to insufficient information) and imprecision due to small sample sizes or effect estimates with wide confidence intervals, or both.
Potential biases in the review process
We searched all the important databases and imposed no language restriction in the course of the search. However, we were mindful of the fact that these database searches might not have identified all the potentially eligible trials.
Agreements and disagreements with other studies or reviews
We found one systematic review which examined the efficacy and safety of vaginal oestrogen for genitourinary syndrome of menopause (Rahn 2014). In the review, 14 studies (n = 4232) compared vaginal oestrogen with placebo while 18 studies (n = 2236) compared one type of vaginal oestrogen preparation with another. In the first comparison (vaginal oestrogen versus placebo), women who were treated with vaginal oestrogen at the recommended doses consistently demonstrated evidence of more benefits with improvement in both genital and urinary symptoms compared to those who received placebo. The review, however, found no conclusive evidence of a difference in endometrial safety between the two treatment groups. In the second comparison (one vaginal oestrogen versus another), the review did not find evidence of differences in efficacy and safety between the different vaginal oestrogen preparations administered at the recommended doses and frequencies. These findings are consistent with those of this review.
In the 2013 position statement of the North American Menopause Society (NAMS), which is based on cumulative evidence from many studies, intra‐vaginal oestrogenic preparations (oestrogen vaginal ring, oestrogen tablets and oestrogen cream) are considered to be equally effective and well tolerated in the management of postmenopausal women with symptoms of vulvovaginal atrophy (Lindah 2014; NAMS 2013). The UK National Institute for Health and Care Excellence (NICE), in its 2015 guidance for the management of menopause, recommends the use of vaginal oestrogen for the treatment of postmenopausal women with symptoms of urogenital atrophy without any preference for any oestrogenic preparations with respect to efficacy and safety (NICE 2015). Similarly, the Society of Obstetricians and Gynaecologists of Canada states in its clinical practice guideline: "Conjugated estrogen cream, an intravaginal sustained‐release oestradiol ring, and low‐dose oestradiol vaginal tablets are recommended as effective treatment for vaginal atrophy." (SOGC 2014). These findings are in agreement with those of this review which did not find evidence of a difference in efficacy and safety between the various oestrogenic preparations when compared with each other.
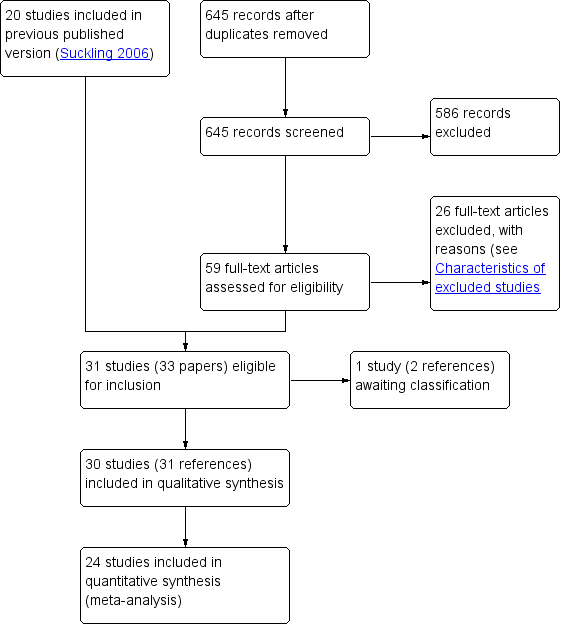
Study flow diagram

Risk of bias graph: review authors' judgements about each risk of bias item presented as percentages across all included studies
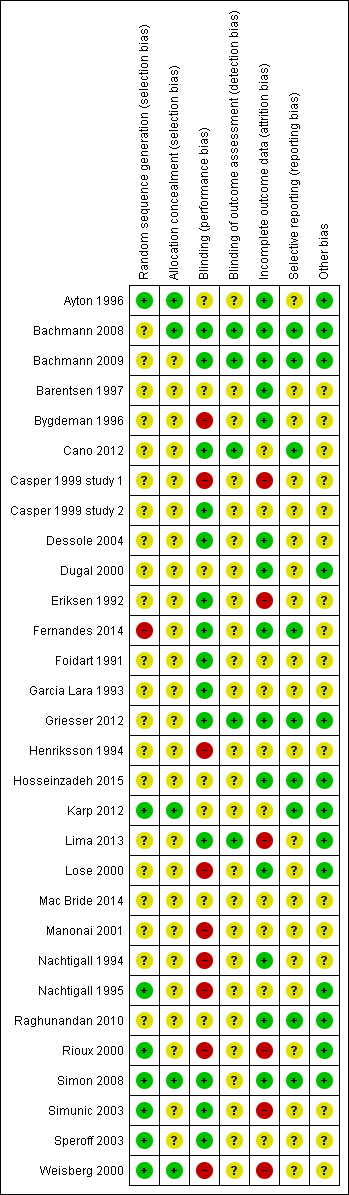
Risk of bias summary: review authors' judgements about each risk of bias item for each included study

Forest plot of comparison: 1 Oestrogen ring versus placebo or other regimens, outcome: 1.1 Improvement in symptoms (participant‐assessed at end point).

Forest plot of comparison: 2 Oestrogen tablets versus placebo or other regimens, outcome: 2.1 Improvement in symptoms (participant‐assessed at end point).

Forest plot of comparison: 3 Oestrogen cream versus placebo or other regimens, outcome: 3.1 Improvement in symptoms (participant‐assessed at end point).

Comparison 1 Oestrogen ring versus placebo or other regimens, Outcome 1 Improvement in symptoms (participant‐assessed at end point).
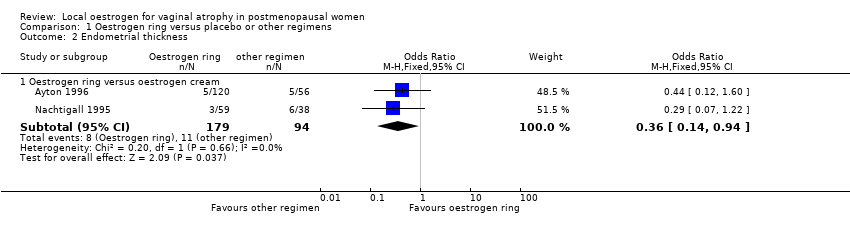
Comparison 1 Oestrogen ring versus placebo or other regimens, Outcome 2 Endometrial thickness.

Comparison 1 Oestrogen ring versus placebo or other regimens, Outcome 3 Improvement in symptoms (clinician‐assessed at end point).
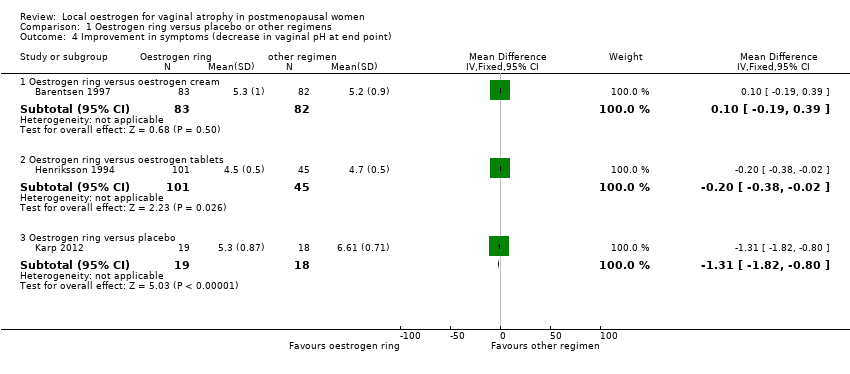
Comparison 1 Oestrogen ring versus placebo or other regimens, Outcome 4 Improvement in symptoms (decrease in vaginal pH at end point).

Comparison 1 Oestrogen ring versus placebo or other regimens, Outcome 5 Improvement in symptoms (increase in maturation indices at end point).
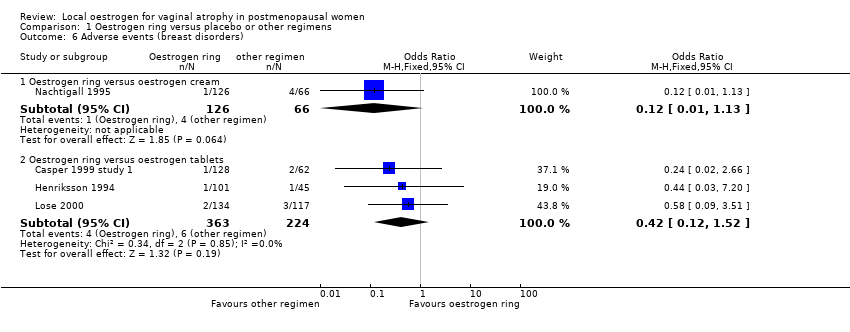
Comparison 1 Oestrogen ring versus placebo or other regimens, Outcome 6 Adverse events (breast disorders).
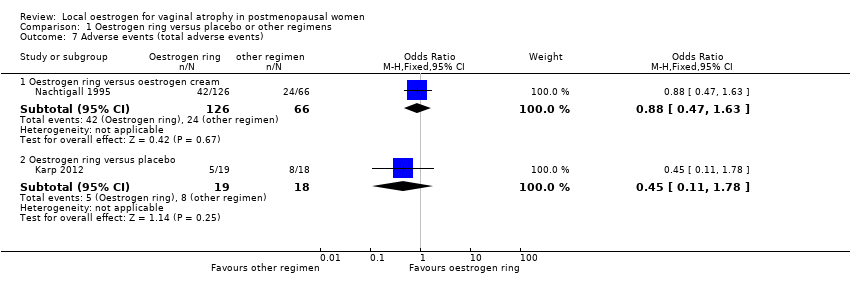
Comparison 1 Oestrogen ring versus placebo or other regimens, Outcome 7 Adverse events (total adverse events).

Comparison 1 Oestrogen ring versus placebo or other regimens, Outcome 8 Adherence to treatment.
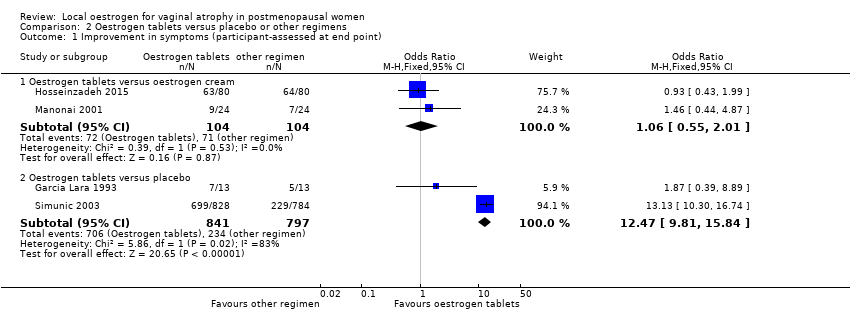
Comparison 2 Oestrogen tablets versus placebo or other regimens, Outcome 1 Improvement in symptoms (participant‐assessed at end point).

Comparison 2 Oestrogen tablets versus placebo or other regimens, Outcome 2 Endometrial thickness.

Comparison 2 Oestrogen tablets versus placebo or other regimens, Outcome 3 Improvement in symptoms (clinician‐assessed at end point).

Comparison 2 Oestrogen tablets versus placebo or other regimens, Outcome 4 Improvement in symptoms (decrease in vaginal pH at end point).

Comparison 2 Oestrogen tablets versus placebo or other regimens, Outcome 5 Improvement in symptoms (increase in maturation indices at end point).

Comparison 2 Oestrogen tablets versus placebo or other regimens, Outcome 6 Adverse events (breast disorders).
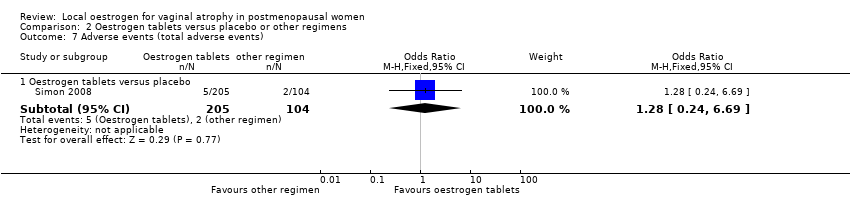
Comparison 2 Oestrogen tablets versus placebo or other regimens, Outcome 7 Adverse events (total adverse events).

Comparison 2 Oestrogen tablets versus placebo or other regimens, Outcome 8 Adherence to treatment.

Comparison 3 Oestrogen cream versus placebo or other regimens, Outcome 1 Improvement in symptoms (participant‐assessed at end point).
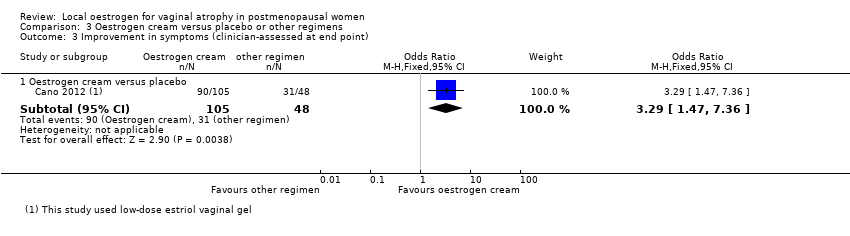
Comparison 3 Oestrogen cream versus placebo or other regimens, Outcome 3 Improvement in symptoms (clinician‐assessed at end point).
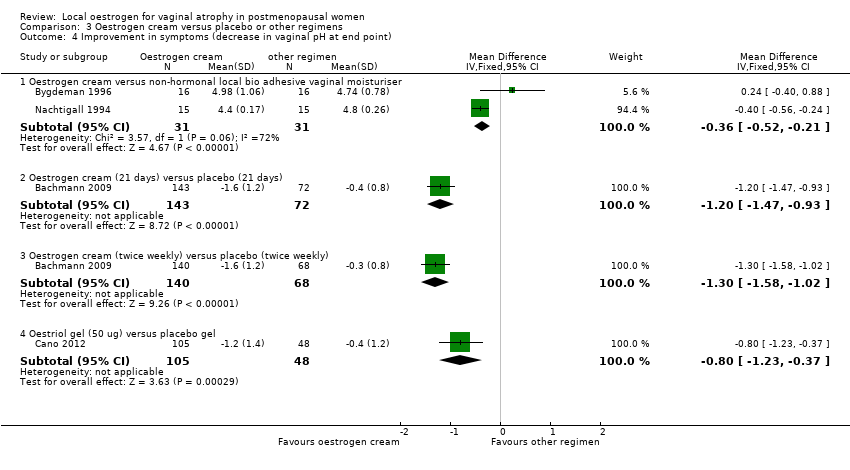
Comparison 3 Oestrogen cream versus placebo or other regimens, Outcome 4 Improvement in symptoms (decrease in vaginal pH at end point).

Comparison 3 Oestrogen cream versus placebo or other regimens, Outcome 5 Improvement in symptoms (increase in maturation indices at end point).
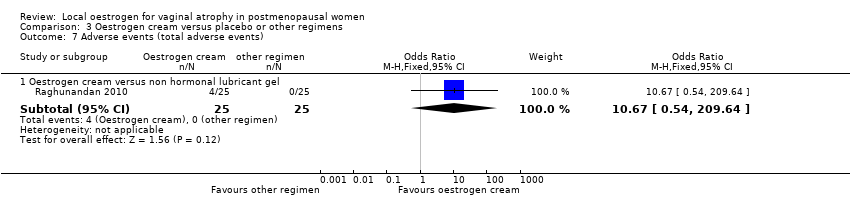
Comparison 3 Oestrogen cream versus placebo or other regimens, Outcome 7 Adverse events (total adverse events).
| Oestrogen ring compared to other regimens for vaginal atrophy in postmenopausal women | ||||||
| Patient or population: postmenopausal women with vaginal atrophy | ||||||
| Outcomes | Illustrative comparative risks* (95% CI) | Relative effect | No of Participants | Quality of the evidence | Comments | |
| Assumed risk | Corresponding risk | |||||
| Other regimen | Oestrogen ring | |||||
| Improvement in symptoms (participant‐assessed) (oestrogen ring vs oestrogen cream) | 717 per 1000 | 771 per 1000 | OR 1.33 | 341 | ⊕⊕⊝⊝ | |
| Improvement in symptoms (participant‐assessed) (oestrogen ring vs oestrogen tablets) | 582 per 1000 | 521 per 1000 | OR 0.78 | 567 | ⊕⊕⊝⊝ | |
| Endometrial thickness (oestrogen ring vs oestrogen cream) | 117 per 1000 | 46 per 1000 | OR 0.36 | 273 | ⊕⊕⊝⊝ | |
| Improvement in symptoms (clinician‐assessed) (oestrogen ring vs oestrogen cream) | 706 per 1000 | 714 per 1000 | OR 1.04 | 533 | ⊕⊕⊝⊝ | |
| Improvement in symptoms (clinician‐assessed) (oestrogen ring vs oestrogen tablets) | 636 per 1000 | 717 per 1000 | OR 1.45 | 397 | ⊕⊕⊝⊝ | |
| Adverse events (total adverse events) (oestrogen ring vs oestrogen cream) | 364 per 1000 | 335 per 1000 | OR 0.88 | 192 | ⊕⊕⊝⊝ | |
| Adverse events (total adverse events) (oestrogen ring vs placebo) | 444 per 1000 | 264 per 1000 | OR 0.45 | 37 | ⊕⊕⊕⊝ | |
| *The basis for the assumed risk is the median control group risk across studies. The corresponding risk (and its 95% confidence interval) is based on the assumed risk in the comparison group and the relative effect of the intervention (and its 95% CI). | ||||||
| GRADE Working Group grades of evidence | ||||||
| 1 Downgraded by 1 level as most risk of bias domains were rated either as unclear or high | ||||||
| Oestrogen tablets compared to other regimens for vaginal atrophy in postmenopausal women | ||||||
| Patient or population: postmenopausal women with vaginal atrophy | ||||||
| Outcomes | Illustrative comparative risks* (95% CI) | Relative effect | No of Participants | Quality of the evidence | Comments | |
| Assumed risk | Corresponding risk | |||||
| Other regimen | Oestrogen tablets | |||||
| Improvement in symptoms (participant‐assessed) (oestrogen tablets vs oestrogen cream) | 683 per 1000 | 695 per 1000 | OR 1.06 | 208 | ⊕⊕⊝⊝ | |
| Improvement in symptoms (participant‐assessed) (oestrogen tablets vs placebo) | 294 per 1000 | 839 per 1000 | OR 12.47 | 1638 | ⊕⊕⊝⊝ | Using a random effects model, there was no evidence of a difference in effect: OR 5.80, 95% CI 0.88 to 38.29 |
| Endometrial thickness (oestrogen tablets vs oestrogen cream) | 80 per 1000 | 26 per 1000 | OR 0.31 | 151 | ⊕⊕⊝⊝ | |
| Improvement in symptoms (clinician‐assessed) (oestrogen tablets vs oestrogen cream) | 697 per 1000 | 699 per 1000 | OR 1.03 | 528 | ⊕⊕⊝⊝ | |
| Improvement in symptoms (clinician‐assessed) (oestrogen tablets vs placebo) | 262 per 1000 | 820 per 1000 | OR 12.85 | 2078 | ⊕⊕⊝⊝ | |
| Adverse events (total adverse events) (oestrogen tablets vs placebo) | 19 per 1000 | 24 per 1000 | OR 1.27 | 309 | ⊕⊕⊕⊝ | |
| *The basis for the assumed risk is the median control group risk across studies. The corresponding risk (and its 95% confidence interval) is based on the assumed risk in the comparison group and the relative effect of the intervention (and its 95% CI). | ||||||
| GRADE Working Group grades of evidence | ||||||
| 1 Downgraded by 1 level as most risk of bias domains were assessed either as unclear or high | ||||||
| Oestrogen cream compared to other regimens for vaginal atrophy in postmenopausal women | ||||||
| Patient or population: postmenopausal women with vaginal atrophy | ||||||
| Outcomes | Illustrative comparative risks* (95% CI) | Relative effect | No of Participants | Quality of the evidence | Comments | |
| Assumed risk | Corresponding risk | |||||
| Other regimen | Oestrogen cream | |||||
| Improvement in symptoms (participant‐assessed) (oestrogen cream vs isoflavone gel) | 967 per 1000 | 984 per 1000 | OR 2.08 | 50 | ⊕⊕⊝⊝ | |
| Improvement in symptoms (participant‐assessed) oestrogen cream vs placebo) | 685 per 1000 | 899 per 1000 | OR 4.10 | 198 | ⊕⊕⊝⊝ | |
| Endometrial thickness not reported | ‐ | ‐ | Not estimable | ‐ | ‐ | |
| Improvement in symptoms (clinician‐assessed) (oestrogen cream vs placebo) | 646 per 1000 | 857 per 1000 | OR 3.29 | 153 | ⊕⊕⊝⊝ | |
| Adverse events (total adverse events) (oestrogen cream vs non‐hormonal lubricant gel) | ‐ | ‐ | OR 10.67 | 50 | ⊕⊕⊝⊝ | |
| *The basis for the assumed risk is the median control group risk across studies. The corresponding risk (and its 95% confidence interval) is based on the assumed risk in the comparison group and the relative effect of the intervention (and its 95% CI). | ||||||
| GRADE Working Group grades of evidence | ||||||
| 1 Downgraded by 1 level as most risk of bias domains were assessed either as unclear or high | ||||||
| Outcome or subgroup title | No. of studies | No. of participants | Statistical method | Effect size |
| 1 Improvement in symptoms (participant‐assessed at end point) Show forest plot | 6 | Odds Ratio (M‐H, Fixed, 95% CI) | Subtotals only | |
| 1.1 Oestrogen ring versus oestrogen cream | 2 | 341 | Odds Ratio (M‐H, Fixed, 95% CI) | 1.33 [0.80, 2.19] |
| 1.2 Oestrogen ring versus oestrogen tablets | 3 | 567 | Odds Ratio (M‐H, Fixed, 95% CI) | 0.78 [0.53, 1.15] |
| 1.3 Oestrogen ring versus placebo | 1 | 67 | Odds Ratio (M‐H, Fixed, 95% CI) | 12.67 [3.23, 49.66] |
| 2 Endometrial thickness Show forest plot | 2 | Odds Ratio (M‐H, Fixed, 95% CI) | Subtotals only | |
| 2.1 Oestrogen ring versus oestrogen cream | 2 | 273 | Odds Ratio (M‐H, Fixed, 95% CI) | 0.36 [0.14, 0.94] |
| 3 Improvement in symptoms (clinician‐assessed at end point) Show forest plot | 6 | Odds Ratio (M‐H, Fixed, 95% CI) | Subtotals only | |
| 3.1 Oestrogen ring versus oestrogen cream | 3 | 533 | Odds Ratio (M‐H, Fixed, 95% CI) | 1.04 [0.70, 1.53] |
| 3.2 Oestrogen ring versus oestrogen tablets | 2 | 397 | Odds Ratio (M‐H, Fixed, 95% CI) | 1.45 [0.90, 2.32] |
| 3.3 Oestrogen ring versus placebo | 1 | 49 | Odds Ratio (M‐H, Fixed, 95% CI) | 2.0 [0.55, 7.31] |
| 4 Improvement in symptoms (decrease in vaginal pH at end point) Show forest plot | 3 | Mean Difference (IV, Fixed, 95% CI) | Subtotals only | |
| 4.1 Oestrogen ring versus oestrogen cream | 1 | 165 | Mean Difference (IV, Fixed, 95% CI) | 0.10 [‐0.19, 0.39] |
| 4.2 Oestrogen ring versus oestrogen tablets | 1 | 146 | Mean Difference (IV, Fixed, 95% CI) | ‐0.20 [‐0.38, ‐0.02] |
| 4.3 Oestrogen ring versus placebo | 1 | 37 | Mean Difference (IV, Fixed, 95% CI) | ‐1.31 [‐1.82, ‐0.80] |
| 5 Improvement in symptoms (increase in maturation indices at end point) Show forest plot | 3 | Mean Difference (IV, Fixed, 95% CI) | Subtotals only | |
| 5.1 Oestrogen ring versus oestrogen cream | 2 | 341 | Mean Difference (IV, Fixed, 95% CI) | 0.79 [‐1.52, 3.09] |
| 5.2 Oestrogen ring (7.5 ug) versus placebo | 0 | 0 | Mean Difference (IV, Fixed, 95% CI) | 0.0 [0.0, 0.0] |
| 5.3 Oestrogen ring (100 ug) versus placebo | 0 | 0 | Mean Difference (IV, Fixed, 95% CI) | 0.0 [0.0, 0.0] |
| 5.4 Oestrogen ring (50 ug) versus placebo | 0 | 0 | Mean Difference (IV, Fixed, 95% CI) | 0.0 [0.0, 0.0] |
| 5.5 Oestrogen ring (unspecified dose) versus placebo | 1 | 37 | Mean Difference (IV, Fixed, 95% CI) | 24.4 [15.25, 33.55] |
| 6 Adverse events (breast disorders) Show forest plot | 4 | Odds Ratio (M‐H, Fixed, 95% CI) | Subtotals only | |
| 6.1 Oestrogen ring versus oestrogen cream | 1 | 192 | Odds Ratio (M‐H, Fixed, 95% CI) | 0.12 [0.01, 1.13] |
| 6.2 Oestrogen ring versus oestrogen tablets | 3 | 587 | Odds Ratio (M‐H, Fixed, 95% CI) | 0.42 [0.12, 1.52] |
| 7 Adverse events (total adverse events) Show forest plot | 2 | Odds Ratio (M‐H, Fixed, 95% CI) | Subtotals only | |
| 7.1 Oestrogen ring versus oestrogen cream | 1 | 192 | Odds Ratio (M‐H, Fixed, 95% CI) | 0.88 [0.47, 1.63] |
| 7.2 Oestrogen ring versus placebo | 1 | 37 | Odds Ratio (M‐H, Fixed, 95% CI) | 0.45 [0.11, 1.78] |
| 8 Adherence to treatment Show forest plot | 3 | Odds Ratio (M‐H, Fixed, 95% CI) | Subtotals only | |
| 8.1 Oestrogen ring versus oestrogen cream | 2 | 350 | Odds Ratio (M‐H, Fixed, 95% CI) | 2.23 [1.31, 3.80] |
| 8.2 Oestrogen ring versus oestrogen tablets | 1 | 146 | Odds Ratio (M‐H, Fixed, 95% CI) | 1.69 [0.66, 4.31] |
| Outcome or subgroup title | No. of studies | No. of participants | Statistical method | Effect size |
| 1 Improvement in symptoms (participant‐assessed at end point) Show forest plot | 4 | Odds Ratio (M‐H, Fixed, 95% CI) | Subtotals only | |
| 1.1 Oestrogen tablets versus oestrogen cream | 2 | 208 | Odds Ratio (M‐H, Fixed, 95% CI) | 1.06 [0.55, 2.01] |
| 1.2 Oestrogen tablets versus placebo | 2 | 1638 | Odds Ratio (M‐H, Fixed, 95% CI) | 12.47 [9.81, 15.84] |
| 2 Endometrial thickness Show forest plot | 2 | Odds Ratio (M‐H, Fixed, 95% CI) | Subtotals only | |
| 2.1 Oestrogen tablets versus oestrogen cream | 2 | 151 | Odds Ratio (M‐H, Fixed, 95% CI) | 0.31 [0.06, 1.60] |
| 3 Improvement in symptoms (clinician‐assessed at end point) Show forest plot | 6 | Odds Ratio (M‐H, Fixed, 95% CI) | Subtotals only | |
| 3.1 Oestrogen tablets versus oestrogen cream | 3 | 528 | Odds Ratio (M‐H, Fixed, 95% CI) | 1.03 [0.70, 1.52] |
| 3.2 Oestrogen tablets versus placebo | 3 | 2078 | Odds Ratio (M‐H, Fixed, 95% CI) | 12.85 [10.39, 15.89] |
| 4 Improvement in symptoms (decrease in vaginal pH at end point) Show forest plot | 3 | Mean Difference (IV, Fixed, 95% CI) | Subtotals only | |
| 4.1 Oestrogen tablets versus oestrogen cream | 1 | 48 | Mean Difference (IV, Fixed, 95% CI) | 0.20 [‐0.12, 0.52] |
| 4.2 Oestrogen tablets versus placebo | 2 | 524 | Mean Difference (IV, Fixed, 95% CI) | ‐0.95 [‐1.10, ‐0.80] |
| 5 Improvement in symptoms (increase in maturation indices at end point) Show forest plot | 2 | Mean Difference (IV, Fixed, 95% CI) | Subtotals only | |
| 5.1 Oestrogen tablets versus oestrogen cream | 1 | 48 | Mean Difference (IV, Fixed, 95% CI) | ‐4.69 [‐13.58, 4.20] |
| 5.2 Oestrogen tablets versus placebo | 1 | 436 | Mean Difference (IV, Fixed, 95% CI) | 18.63 [14.57, 22.69] |
| 6 Adverse events (breast disorders) Show forest plot | 1 | Odds Ratio (M‐H, Fixed, 95% CI) | Subtotals only | |
| 6.1 Oestradiol tablets versus oestriol tablets | 1 | 96 | Odds Ratio (M‐H, Fixed, 95% CI) | 3.06 [0.12, 77.09] |
| 7 Adverse events (total adverse events) Show forest plot | 1 | Odds Ratio (M‐H, Fixed, 95% CI) | Subtotals only | |
| 7.1 Oestrogen tablets versus placebo | 1 | 309 | Odds Ratio (M‐H, Fixed, 95% CI) | 1.28 [0.24, 6.69] |
| 8 Adherence to treatment Show forest plot | 2 | Odds Ratio (M‐H, Fixed, 95% CI) | Subtotals only | |
| 8.1 Oestrogen tablets versus oestrogen cream | 1 | 53 | Odds Ratio (M‐H, Fixed, 95% CI) | 1.90 [0.41, 8.94] |
| 8.2 Oestradiol tablets versus oestriol tablets | 1 | 96 | Odds Ratio (M‐H, Fixed, 95% CI) | 2.69 [1.15, 6.31] |
| Outcome or subgroup title | No. of studies | No. of participants | Statistical method | Effect size |
| 1 Improvement in symptoms (participant‐assessed at end point) Show forest plot | 2 | Odds Ratio (M‐H, Fixed, 95% CI) | Subtotals only | |
| 1.1 Oestrogen cream versus isoflavone gel | 1 | 50 | Odds Ratio (M‐H, Fixed, 95% CI) | 2.08 [0.08, 53.76] |
| 1.2 Oestrogen cream versus placebo | 2 | 198 | Odds Ratio (M‐H, Fixed, 95% CI) | 4.10 [1.88, 8.93] |
| 2 Endometrial thickness | 0 | Odds Ratio (M‐H, Fixed, 95% CI) | Subtotals only | |
| 3 Improvement in symptoms (clinician‐assessed at end point) Show forest plot | 1 | Odds Ratio (M‐H, Fixed, 95% CI) | Subtotals only | |
| 3.1 Oestrogen cream versus placebo | 1 | 153 | Odds Ratio (M‐H, Fixed, 95% CI) | 3.29 [1.47, 7.36] |
| 4 Improvement in symptoms (decrease in vaginal pH at end point) Show forest plot | 4 | Mean Difference (IV, Fixed, 95% CI) | Subtotals only | |
| 4.1 Oestrogen cream versus non‐hormonal local bio adhesive vaginal moisturiser | 2 | 62 | Mean Difference (IV, Fixed, 95% CI) | ‐0.36 [‐0.52, ‐0.21] |
| 4.2 Oestrogen cream (21 days) versus placebo (21 days) | 1 | 215 | Mean Difference (IV, Fixed, 95% CI) | ‐1.20 [‐1.47, ‐0.93] |
| 4.3 Oestrogen cream (twice weekly) versus placebo (twice weekly) | 1 | 208 | Mean Difference (IV, Fixed, 95% CI) | ‐1.30 [‐1.58, ‐1.02] |
| 4.4 Oestriol gel (50 ug) versus placebo gel | 1 | 153 | Mean Difference (IV, Fixed, 95% CI) | ‐0.8 [‐1.23, ‐0.37] |
| 5 Improvement in symptoms (increase in maturation indices at end point) Show forest plot | 1 | Mean Difference (IV, Fixed, 95% CI) | Subtotals only | |
| 5.1 Oestrogen cream versus placebo | 1 | 153 | Mean Difference (IV, Fixed, 95% CI) | 23.7 [17.25, 30.15] |
| 6 Adverse events (breast disorders) | 0 | Odds Ratio (M‐H, Fixed, 95% CI) | Subtotals only | |
| 7 Adverse events (total adverse events) Show forest plot | 1 | Odds Ratio (M‐H, Fixed, 95% CI) | Subtotals only | |
| 7.1 Oestrogen cream versus non hormonal lubricant gel | 1 | 50 | Odds Ratio (M‐H, Fixed, 95% CI) | 10.67 [0.54, 209.64] |
| 8 Adherence to treatment | 0 | Odds Ratio (M‐H, Fixed, 95% CI) | Subtotals only | |