| 1 Mortality Show forest plot | 8 | | Risk Ratio (M‐H, Random, 95% CI) | Subtotals only |
|
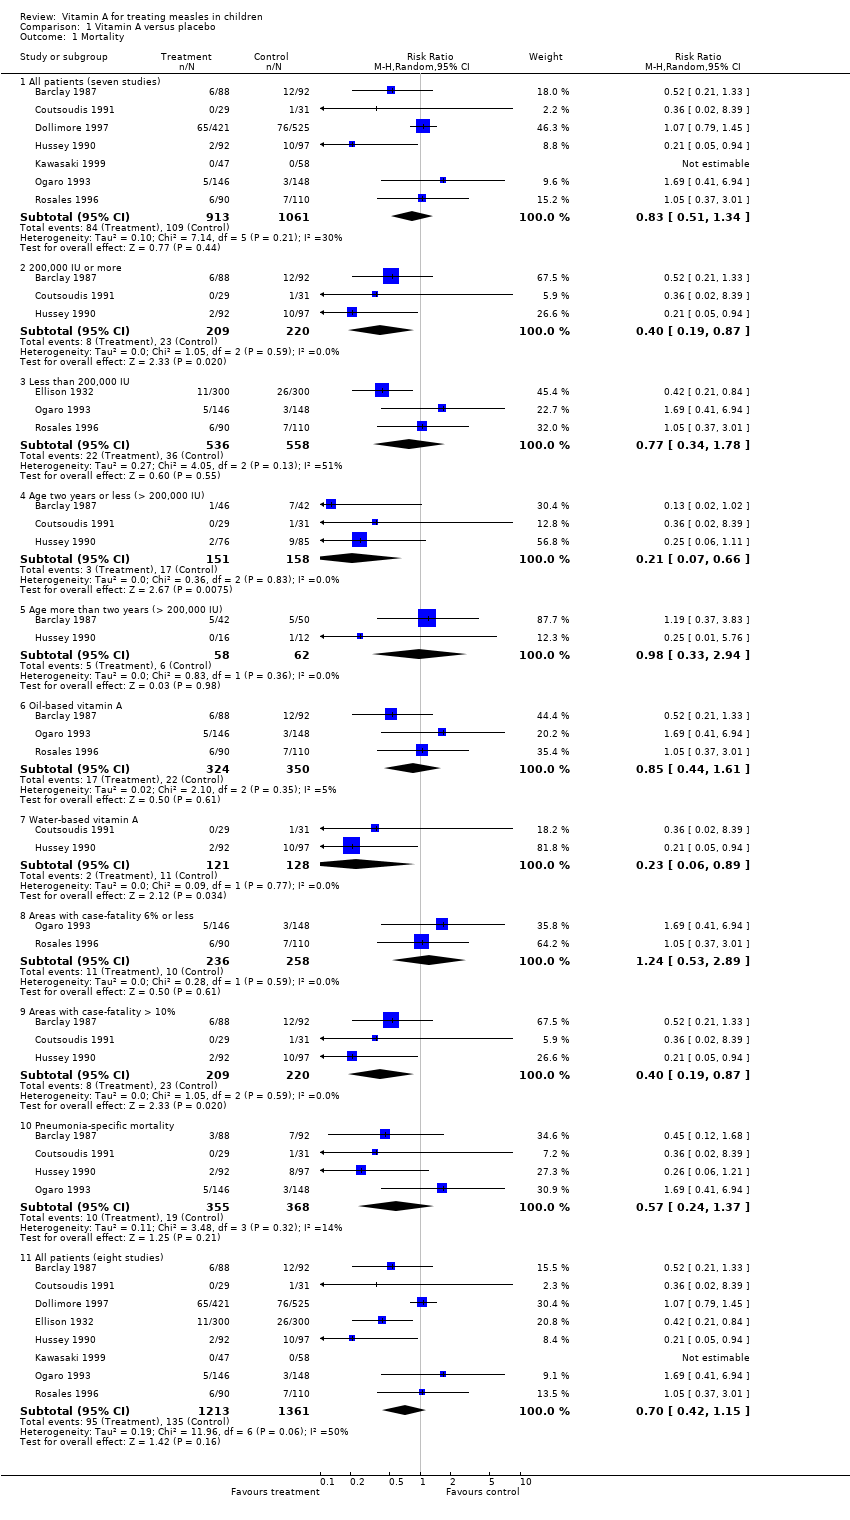
| 1.1 All patients (seven studies) | 7 | 1974 | Risk Ratio (M‐H, Random, 95% CI) | 0.83 [0.51, 1.34] |
| 1.2 200,000 IU or more | 3 | 429 | Risk Ratio (M‐H, Random, 95% CI) | 0.40 [0.19, 0.87] |
| 1.3 Less than 200,000 IU | 3 | 1094 | Risk Ratio (M‐H, Random, 95% CI) | 0.77 [0.34, 1.78] |
| 1.4 Age two years or less (> 200,000 IU) | 3 | 309 | Risk Ratio (M‐H, Random, 95% CI) | 0.21 [0.07, 0.66] |
| 1.5 Age more than two years (> 200,000 IU) | 2 | 120 | Risk Ratio (M‐H, Random, 95% CI) | 0.98 [0.33, 2.94] |
| 1.6 Oil‐based vitamin A | 3 | 674 | Risk Ratio (M‐H, Random, 95% CI) | 0.85 [0.44, 1.61] |
| 1.7 Water‐based vitamin A | 2 | 249 | Risk Ratio (M‐H, Random, 95% CI) | 0.23 [0.06, 0.89] |
| 1.8 Areas with case‐fatality 6% or less | 2 | 494 | Risk Ratio (M‐H, Random, 95% CI) | 1.24 [0.53, 2.89] |
| 1.9 Areas with case‐fatality > 10% | 3 | 429 | Risk Ratio (M‐H, Random, 95% CI) | 0.40 [0.19, 0.87] |
| 1.10 Pneumonia‐specific mortality | 4 | 723 | Risk Ratio (M‐H, Random, 95% CI) | 0.57 [0.24, 1.37] |
| 1.11 All patients (eight studies) | 8 | 2574 | Risk Ratio (M‐H, Random, 95% CI) | 0.70 [0.42, 1.15] |
| 2 Morbidity (dichotomous data) Show forest plot | 5 | | Risk Ratio (M‐H, Random, 95% CI) | Totals not selected |
|
| 2.1 Post‐measles croup | 4 | | Risk Ratio (M‐H, Random, 95% CI) | 0.0 [0.0, 0.0] |
| 2.2 Development of pneumonia | 2 | | Risk Ratio (M‐H, Random, 95% CI) | 0.0 [0.0, 0.0] |
| 2.3 Development of diarrhea | 2 | | Risk Ratio (M‐H, Random, 95% CI) | 0.0 [0.0, 0.0] |
| 2.4 Herpes stomatitis | 2 | | Risk Ratio (M‐H, Random, 95% CI) | 0.0 [0.0, 0.0] |
| 3 Morbidity (continuous data) Show forest plot | 3 | | Mean Difference (IV, Random, 95% CI) | Subtotals only |
|
| 3.1 Duration of pneumonia | 2 | 249 | Mean Difference (IV, Random, 95% CI) | ‐3.69 [‐7.53, 0.16] |
| 3.2 Duration of diarrhea in days | 2 | 249 | Mean Difference (IV, Random, 95% CI) | ‐1.92 [‐3.40, ‐0.44] |
| 3.3 Duration of fever in days | 2 | 149 | Mean Difference (IV, Random, 95% CI) | ‐1.01 [‐1.89, ‐0.13] |
| 3.4 Hospital stay in days | 2 | 278 | Mean Difference (IV, Random, 95% CI) | ‐2.39 [‐6.60, 1.83] |
| 3.5 Days of cough | 1 | 89 | Mean Difference (IV, Random, 95% CI) | 0.00 [‐2.71, ‐1.29] |
| 3.6 Integrated morbidity score | 1 | 60 | Mean Difference (IV, Random, 95% CI) | ‐1.13 [‐1.28, ‐0.98] |
| 4 Morbidity (single‐study outcomes) Show forest plot | 5 | | Risk Ratio (M‐H, Fixed, 95% CI) | Totals not selected |
|
| 4.1 Development of otitis media | 1 | | Risk Ratio (M‐H, Fixed, 95% CI) | 0.0 [0.0, 0.0] |
| 4.2 Recovery from diarrhea in < five days | 1 | | Risk Ratio (M‐H, Fixed, 95% CI) | 0.0 [0.0, 0.0] |
| 4.3 Development of acute laryngitis | 1 | | Risk Ratio (M‐H, Fixed, 95% CI) | 0.0 [0.0, 0.0] |
| 4.4 Cough in week two | 1 | | Risk Ratio (M‐H, Fixed, 95% CI) | 0.0 [0.0, 0.0] |
| 4.5 Compete clinical recovery in < eight days | 1 | | Risk Ratio (M‐H, Fixed, 95% CI) | 0.0 [0.0, 0.0] |
| 4.6 Asymptomatic in week two | 1 | | Risk Ratio (M‐H, Fixed, 95% CI) | 0.0 [0.0, 0.0] |
| 4.7 Transferred to intensive care | 1 | | Risk Ratio (M‐H, Fixed, 95% CI) | 0.0 [0.0, 0.0] |
| 4.8 Diarrhea for more than 10 days | 1 | | Risk Ratio (M‐H, Fixed, 95% CI) | 0.0 [0.0, 0.0] |
| 4.9 Diarrhea for 14 days | 1 | | Risk Ratio (M‐H, Fixed, 95% CI) | 0.0 [0.0, 0.0] |
| 4.10 Pneumonia for more than 10 days | 1 | | Risk Ratio (M‐H, Fixed, 95% CI) | 0.0 [0.0, 0.0] |
| 4.11 Pneumonia for 14 days | 1 | | Risk Ratio (M‐H, Fixed, 95% CI) | 0.0 [0.0, 0.0] |
| 4.12 Recovery from pneumonia in < eight days | 1 | | Risk Ratio (M‐H, Fixed, 95% CI) | 0.0 [0.0, 0.0] |