Ecografía sistemática en la última etapa del embarazo (después de 24 semanas de gestación)
Referencias
References to studies included in this review
References to studies excluded from this review
References to ongoing studies
Additional references
References to other published versions of this review
Characteristics of studies
Characteristics of included studies [ordered by study ID]
| Methods | Randomisation by sealed envelopes. | |
| Participants | Nearly all women in that geographical area, including those with 'high‐risk' pregnancies. Recruitment 1979‐1981. 1628 women. | |
| Interventions | Routine ultrasound examination at 18 weeks (biparietal diameter measured) and 32 weeks (biparietal diameter and mean abdominal diameter) with additional examination at 36 weeks' gestation if fetus SGA and/or presenting by breech ‐ versus selective examination for clinical indications only. | |
| Outcomes | Obstetric interventions (antepartum and intrapartum) for singleton pregnancies only. Perinatal outcome indices for all pregnancies (including multiple pregnancies). | |
| Notes | This trial was reported in letter form only in 1984. It subsequently became clear that there were inconsistencies in results, and the data were subsequently re‐analysed. The data entered in this review are derived from more recent unpublished and published reports. | |
| Risk of bias | ||
| Bias | Authors' judgement | Support for judgement |
| Random sequence generation (selection bias) | Unclear risk | Not stated. |
| Allocation concealment (selection bias) | Low risk | Described as "sealed envelope". |
| Blinding of participants and personnel (performance bias) | High risk | Not feasible. |
| Blinding of outcome assessment (detection bias) | High risk | Not feasible. |
| Incomplete outcome data (attrition bias) | Low risk | The data could be re‐included. |
| Selective reporting (reporting bias) | Low risk | Selective outcome reporting bias not apparent. |
| Other bias | High risk | More smokers in screened group; historical study. |
| Methods | Randomised controlled trial. Does not describe method of randomisation. | |
| Participants | Total number of women randomised not stated. Follow‐up data for 286 singleton infants born to mothers. | |
| Interventions | Intervention group: ultrasound at 16 to 20 weeks and 30 to 36 weeks, comparison group: scans only when clinically indicated. | |
| Outcomes | Bayley evaluations – Mental Development Index (MDI) and Psychomotor Developmental (PDI). | |
| Notes | Brief abstract, lacks full details for inclusions, data available not relevant. | |
| Risk of bias | ||
| Bias | Authors' judgement | Support for judgement |
| Random sequence generation (selection bias) | Unclear risk | Does not give sufficient detail; study described only as randomised. |
| Allocation concealment (selection bias) | Unclear risk | Allocation concealment is not described. |
| Blinding of participants and personnel (performance bias) | High risk | Not feasible. |
| Blinding of outcome assessment (detection bias) | High risk | Does not give sufficient detail. Outcomes were collected at 6 and 18 months, with blinding not stated. |
| Incomplete outcome data (attrition bias) | High risk | Authors do not state the size of the full sample. Data here represent a subset. |
| Selective reporting (reporting bias) | Unclear risk | Data for 2 pre‐specified neurological development outcomes were collected for this subset of infants. It is unclear whether additional outcomes for the full sample were collected. |
| Other bias | Unclear risk | Bias assessment significantly compromised by lack of detail. |
| Methods | Randomised controlled trial. Randomisation by sealed, numbered envelopes. | |
| Participants | Women recruited at 30 weeks' gestation assessed as low risk with singleton pregnancy and dates confirmed by 18‐20 weeks' anomaly scan. Exclusion criteria: known medical or obstetric problems or known fetal anomaly. 1998 women recruited over a 21‐month period. | |
| Interventions | Assessment 30 to 32 weeks and at 36 to 37 weeks by a midwife as part of routine care with midwife estimate of fetal size, presentation, position and amniotic fluid volume. In addition, the study group had ultrasound examinations by the specially trained midwife to assess liquor volume, fetal weight and placental maturity. The comparison group had selective ultrasound examinations if indicated. | |
| Outcomes | SGA at birth, admission to special care and antenatal interventions. | |
| Notes | ||
| Risk of bias | ||
| Bias | Authors' judgement | Support for judgement |
| Random sequence generation (selection bias) | Low risk | Computer‐generated (restricted to achieve group balance). |
| Allocation concealment (selection bias) | Low risk | Sealed, numbered envelopes. |
| Blinding of participants and personnel (performance bias) | High risk | Not feasible. |
| Blinding of outcome assessment (detection bias) | High risk | Not feasible. |
| Incomplete outcome data (attrition bias) | Low risk | Good follow‐up for most outcomes. |
| Selective reporting (reporting bias) | Unclear risk | Difficult to interpret the results relating to the main outcome. |
| Other bias | Low risk | None detected. |
| Methods | Randomised controlled trial. | |
| Participants | Pregnant women < 20 weeks' gestation, recruited at booking visit to antenatal clinic. Women must have no pre‐existing medical conditions and in first ongoing pregnancy (1 first trimester loss allowed). 364 women recruited; interim report of data for 145 women. | |
| Interventions | Intervention group: routine 18 to 20‐week scan, followed by uterine artery Doppler at 24 to 26 weeks; transvaginal assessment of cervix 24 to 26 weeks; growth and amniotic fluid index at 38 weeks. Comparison group: routine 18 to 20‐week scan and any others clinically indicated. | |
| Outcomes | Gestation age at delivery, preterm delivery, unplanned admissions for pre‐eclampsia or intrauterine growth restriction and length of maternal stay, Apgar < 7 at 5 minutes, neonatal intensive care unit admissions and length of neonatal intensive care unit stay. | |
| Notes | ||
| Risk of bias | ||
| Bias | Authors' judgement | Support for judgement |
| Random sequence generation (selection bias) | Unclear risk | Sequence generation not described. |
| Allocation concealment (selection bias) | Low risk | Quote: "Randomisation carried out using the sealed envelope technique". |
| Blinding of participants and personnel (performance bias) | High risk | Not feasible. |
| Blinding of outcome assessment (detection bias) | High risk | Not feasible. |
| Incomplete outcome data (attrition bias) | Unclear risk | 364 women recruited; interim report of data for 145 women. 2 women miscarried, 3 withdrew and 1 lost to follow‐up. |
| Selective reporting (reporting bias) | Low risk | Prespecified outcomes have been reported. |
| Other bias | Low risk | None detected. |
| Methods | Pseudo‐randomisation according to last digit in hospital number. | |
| Participants | 877 women attending the hospital antenatal clinic between 34 to 36.5 weeks' gestation with uncomplicated singleton pregnancies, i.e. low‐risk pregnancies. | |
| Interventions | All women had an ultrasound examination < 24 weeks' gestation for gestational dating. All had further ultrasound scan at 34 to 36.5 weeks' gestation to measure crown rump length and trunk area, but in the study group the 2 measurements were multiplied and the results plotted and reported in the case notes (i.e. revealed). Further management was the responsibility of the clinical staff. No requests for control group measurements to be revealed occurred, but this option was available to clinicians. | |
| Outcomes | Obstetric interventions (antepartum and intrapartum) and perinatal outcome indices. | |
| Notes | This study addressed ultrasound screening for small for dates. | |
| Risk of bias | ||
| Bias | Authors' judgement | Support for judgement |
| Random sequence generation (selection bias) | High risk | Described as allocated "from their hospital index numbers". |
| Allocation concealment (selection bias) | High risk | See above. |
| Blinding of participants and personnel (performance bias) | High risk | Not feasible. |
| Blinding of outcome assessment (detection bias) | High risk | Not feasible. |
| Incomplete outcome data (attrition bias) | Unclear risk | Small loss to follow‐up. |
| Selective reporting (reporting bias) | Low risk | Selective outcome reporting not detected. |
| Other bias | Unclear risk | There were more participants from social class V in the reported group. |
| Methods | Randomised by women selecting 1 of a number of envelopes (< 6) containing a computer‐generated random 1 or 2 and a study number. | |
| Participants | All pregnant women who attended antenatal clinic < 24 weeks' gestation, i.e. unselected population. Multiple pregnancies excluded once diagnosed (and study numbers reused). 1527 women. | |
| Interventions | All women had a dating scan 16 to 24 weeks' gestation. Study group had a further scan at 32 to 36 weeks' gestation (ideally 34 weeks' gestation) that aimed to detect SGA fetuses, and if estimated fetal weight fell below the 20th centile for gestation, this was reported and additional scans recommended but not arranged. Clinicians were able to order further scans for the control group if clinically indicated. | |
| Outcomes | Mainly perinatal outcome indices. Number of further ultrasound scans. | |
| Notes | Scan to detect SGA. | |
| Risk of bias | ||
| Bias | Authors' judgement | Support for judgement |
| Random sequence generation (selection bias) | Low risk | Sequence computer‐generated. |
| Allocation concealment (selection bias) | Low risk | Randomised by women selecting 1 of a number of envelopes (< 6) containing a computer‐generated random 1 or 2 and a study number. |
| Blinding of participants and personnel (performance bias) | High risk | Not feasible. |
| Blinding of outcome assessment (detection bias) | High risk | Not feasible. |
| Incomplete outcome data (attrition bias) | Unclear risk | Not stated. |
| Selective reporting (reporting bias) | Unclear risk | No information provided. |
| Other bias | Unclear risk | No information provided. |
| Methods | Combined findings from the Tronheim and Alesund trials for childhood developmental outcomes. | |
| Participants | Alesund ‐ nearly all women in that geographical area, including those with 'high‐risk' pregnancies. Recruitment 1979‐1981. 1628 women. Trondheim ‐ 1009 pregnant women in Trondheim attending for antenatal care between 1979‐1980. | |
| Interventions | Alesund ‐ routine ultrasound examination at 18 weeks (biparietal diameter measured) and 32 weeks (biparietal diameter and mean abdominal diameter) with additional examination at 36 weeks' gestation if fetus SGA and/or presenting by breech ‐ versus selective examination for clinical indications only. Trondheim ‐ study group offered ultrasound examinations at 19 weeks' and 32 weeks' gestation. | |
| Outcomes | Follow‐up of singletons at 8 to 9 years including teacher assessed school performance, along with assessments of reading, speech and intelligence scores. | |
| Notes | This is not strictly a separate study, but findings from the Alesund and Trondheim trials were combined for long‐term follow‐up. | |
| Risk of bias | ||
| Bias | Authors' judgement | Support for judgement |
| Random sequence generation (selection bias) | Unclear risk | Not stated (both studies). |
| Allocation concealment (selection bias) | Low risk | Sealed envelopes. |
| Blinding of participants and personnel (performance bias) | High risk | Not feasible. |
| Blinding of outcome assessment (detection bias) | Unclear risk | Not stated. |
| Incomplete outcome data (attrition bias) | Unclear risk | 2011 of 2824 eligible followed up. |
| Selective reporting (reporting bias) | Unclear risk | Outcome data collected are reported. |
| Other bias | Unclear risk | These data are for long‐term follow‐up. |
| Methods | Sealed envelopes. | |
| Participants | 2834 singleton pregnancies. Criteria for recruitment were gestational age 16 to 20 weeks, sufficient proficiency in English, expected to deliver at the hospital and an intention to remain in Western Australia so that childhood follow‐up would be feasible. | |
| Interventions | The 'regular' group had an ultrasound examination at 18 weeks for fetal biometry, subjective amniotic fluid assessment and placental morphology and location, and any further scans in pregnancy were conducted on clinicians request. The 'intensive group' had the aforementioned ultrasound examination, plus an amniotic fluid index and continuous wave Doppler ultrasound of the umbilical artery and an arcuate artery within the placental vascular bed at 18, 24, 28, 34 and 38 weeks' gestation. The Doppler ultrasound parameter reported was systolic/diastolic ratio. Results of these examinations were recorded in the hospital chart, but no clinical management guidance was given. | |
| Outcomes | Obstetric interventions (antepartum and intrapartum) and perinatal outcome indices. | |
| Notes | The published study reports the results overall, but little data are available for extraction. The authors were contacted and provided unpublished data. | |
| Risk of bias | ||
| Bias | Authors' judgement | Support for judgement |
| Random sequence generation (selection bias) | Low risk | Described as "computer‐generated random numbers". |
| Allocation concealment (selection bias) | Low risk | Described as "sealed envelopes". |
| Blinding of participants and personnel (performance bias) | High risk | Not feasible. |
| Blinding of outcome assessment (detection bias) | High risk | Not feasible. |
| Incomplete outcome data (attrition bias) | Unclear risk | Some loss to follow‐up in both groups. "13 were lost to follow up in the intensive group of the trial and 20 in the regular" care group. |
| Selective reporting (reporting bias) | Low risk | Selective outcome reporting bias not detected. |
| Other bias | Low risk | Other bias not detected. |
| Methods | Randomisation by opaque sealed envelopes. | |
| Participants | 2000 pregnant women attending the ultrasound department for routine third trimester scans, including multiple pregnancies. | |
| Interventions | All women were offered routine early pregnancy ultrasound and 2 routine scans in the third trimester. Placental grading was performed at the routine third trimester scan. The results of placental grading in the study group were revealed, and the control group concealed. Clinical management in both groups was left entirely to the clinician responsible for care. | |
| Outcomes | Obstetric interventions (antepartum and intrapartum) and perinatal outcome indices. | |
| Notes | This study addresses the value of placental grading at routine third trimester ultrasound. | |
| Risk of bias | ||
| Bias | Authors' judgement | Support for judgement |
| Random sequence generation (selection bias) | Unclear risk | Described as "randomly allocated to 1 of 2 groups". |
| Allocation concealment (selection bias) | Low risk | Described as "a correspondingly numbered, sealed, opaque envelope". |
| Blinding of participants and personnel (performance bias) | High risk | Not feasible. |
| Blinding of outcome assessment (detection bias) | High risk | Not feasible. |
| Incomplete outcome data (attrition bias) | Low risk | No losses to follow‐up. |
| Selective reporting (reporting bias) | Low risk | Selective outcome reporting not detected. |
| Other bias | Low risk | No other bias apparent. |
| Methods | Randomisation by microcomputer after stratification by practice site. 109 participating practice sites recruited low‐risk women. Ultrasounds took place in 1 of 28 participating sites. Intention‐to‐treat. | |
| Participants | 15151 pregnant women who did not have "an indication for ultrasonography" based on uncertain gestational age, previous or index pregnancy complication, medical disorder. Therefore, those eligible were at low risk of adverse pregnancy outcome, and comprised 40% of the total population. | |
| Interventions | Ultrasound screen at 18 to 20 weeks' and 31 to 33 weeks' gestation, versus selective ultrasonography only. | |
| Outcomes | Perinatal outcome indices. The primary outcomes were perinatal mortality and moderate/severe neonatal morbidity. | |
| Notes | ||
| Risk of bias | ||
| Bias | Authors' judgement | Support for judgement |
| Random sequence generation (selection bias) | Low risk | Described as "computer‐generated randomisation sequence". |
| Allocation concealment (selection bias) | Low risk | Central randomisation performed after stratification by practice site. |
| Blinding of participants and personnel (performance bias) | High risk | Not feasible. |
| Blinding of outcome assessment (detection bias) | High risk | Not feasible. |
| Incomplete outcome data (attrition bias) | Low risk | 15,530 women recruited. Data for 15,151; 252 women (1.6%) lost to follow‐up and 127 women (0.8%) had spontaneous miscarriage. Reasons for loss similar for 2 groups. |
| Selective reporting (reporting bias) | Low risk | Selective outcome reporting bias not detected. |
| Other bias | Low risk | No other bias detected. |
| Methods | Randomised controlled trial. | |
| Participants | All pregnant women attending routine prenatal care living in 9 municipalities including and surrounding Trondheim, Norway. Data were collected between November 1989 and August 1992. The trial was not previously published "because the initial principal investigator left the department in the 1990s". | |
| Interventions | Routine ultrasound at 18 and 33 weeks versus routine ultrasound at 18 weeks and on clinical indication only. | |
| Outcomes | Detection rates of SGA and LGA babies, congenital anomalies, other adverse perinatal outcomes including caesarean section and ELCS, induction of labour, operative delivery, birthweight, perinatal death (stillbirth, neonatal death, perinatal death with no anomalies), Apgar < 7 at 5 minutes, meconium‐stained fluid, resuscitation, and admission to neonatal intensive care unit. | |
| Notes | ||
| Risk of bias | ||
| Bias | Authors' judgement | Support for judgement |
| Random sequence generation (selection bias) | Unclear risk | Sequence generation not described. Study described as randomised. |
| Allocation concealment (selection bias) | Low risk | Sealed envelope method used. |
| Blinding of participants and personnel (performance bias) | High risk | Not feasible. |
| Blinding of outcome assessment (detection bias) | High risk | Not feasible. |
| Incomplete outcome data (attrition bias) | Low risk | 42 women for whom estimated date of delivery was not available were excluded from the contributing data for the outcomes of SGA and LGA; these women were included in other outcomes. Study flowchart published with clear reasons for attrition. Loss to follow‐up 3.5% in study arm and 4.25% in control arm. Intention‐to‐treat analysis otherwise undertaken. |
| Selective reporting (reporting bias) | Low risk | Prespecified outcomes are reported. |
| Other bias | Low risk | None found. |
| Methods | Randomised by sealed‐envelope method. | |
| Participants | 1009 pregnant women in Trondheim attending for antenatal care between 1979‐1980. | |
| Interventions | Study group offered ultrasound examinations at 19 weeks' and 32 weeks' gestation. | |
| Outcomes | Obstetric interventions (antepartum and intrapartum) and perinatal outcome indices. | |
| Notes | Some data only presented for singletons (mean birthweight, birthweight < 10th centile, low birthweight, neonatal resuscitation, admission to special care, Apgar scores). | |
| Risk of bias | ||
| Bias | Authors' judgement | Support for judgement |
| Random sequence generation (selection bias) | Unclear risk | Not stated. |
| Allocation concealment (selection bias) | Low risk | Described as sealed envelopes. |
| Blinding of participants and personnel (performance bias) | High risk | Not feasible. |
| Blinding of outcome assessment (detection bias) | Low risk | Neonatal outcome assessment blinding ‐ yes. Pregnancy outcome assessment blinding ‐ no. |
| Incomplete outcome data (attrition bias) | Unclear risk | Small loss to follow‐up. |
| Selective reporting (reporting bias) | Low risk | Selective outcome reporting bias not detected. |
| Other bias | Low risk | Other bias not apparent. |
| Methods | Randomised by booking number (even numbers to group A, odd numbers to group B). | |
| Participants | 745 women enrolled during first antenatal care visit. | |
| Interventions | Single fetal chest area measurement via ultrasound between 32 to 36 weeks versus no ultrasound. | |
| Outcomes | Fetal chest area. | |
| Notes | The primary aim of this study was to assess the ability of third trimester ultrasound in detecting small‐ and large‐for‐dates infants, and no clinical outcomes were evaluated. | |
| Risk of bias | ||
| Bias | Authors' judgement | Support for judgement |
| Random sequence generation (selection bias) | High risk | Randomised based on booking number. |
| Allocation concealment (selection bias) | High risk | All research staff would have known woman’s status based on hospital record number. |
| Blinding of participants and personnel (performance bias) | High risk | Unfeasible. |
| Blinding of outcome assessment (detection bias) | High risk | Quote: ‘the medical staff were informed of the ultrasonic data obtained’ [where there were discrepancies in fundal height or any other abnormal antenatal finding]. |
| Incomplete outcome data (attrition bias) | Low risk | Small loss to follow‐up. |
| Selective reporting (reporting bias) | Low risk | Selective outcome reporting bias not detected. |
| Other bias | Low risk | None found. |
ELCS: elective caesarean section
LGA: large‐for‐gestational age
SGA: small‐for‐gestational age
Characteristics of excluded studies [ordered by study ID]
| Study | Reason for exclusion |
| Does not perform standard antenatal ultrasound, does not look at the effects of having an ultrasound > 24 weeks or not. This trial was simply trying to generate a model to predict gastric volume in non‐fasted women based on ultrasound; outcome data not stated clearly but unlikely to be relevant. | |
| Compared clinical versus ultrasound estimates of birthweight in terms of accuracy. Did not include review outcomes. | |
| Brief abstract. No usable data. Unclear whether this trial was completed. | |
| Study not undertaken. | |
| Brief abstract. No usable data. Unclear if non‐randomised women were included in the analysis. Women also considered to be 'at risk' rather than unselected or low risk. | |
| The methodology is unclear as all suspected LGA fetuses were to be referred to an obstetrician for further evaluation. However, suspected LGA in 26 such fetuses included in the final analysis was not reported to clinicians primarily because they were part of another randomised study. The other randomised trial (Secher 1987) was also not included ‐ see reasons in this table. | |
| In this study, third trimester ultrasound was used to identify a group of uncomplicated pregnancies where there was ultrasound suspicion of poor intrauterine growth, but no clinical suspicion of poor growth. Only these pregnancies were randomised. The revealed group underwent serial tests of fetal well being (non‐stress CTG and serum oestriol and placental lactogen) and fetal growth and management was planned depending on the results of the tests. Therefore, the study assessed the value of various tests of fetal well being if fetal growth retardation was suspected, rather than the value of routine third trimester ultrasound alone. |
CTG: cardiotocograph
LGA: large‐for‐gestational age
Characteristics of ongoing studies [ordered by study ID]
| Trial name or title | First Look: a cluster‐randomised trial of ultrasound to improve pregnancy outcomes in low‐income country settings. |
| Methods | Randomised controlled trial, ongoing. |
| Participants | All pregnant women presenting for routine antenatal care, ≥ 18 weeks and not in labour. |
| Interventions | Antenatal routine ultrasound 18‐22 weeks' gestation and 32‐36 weeks' gestation versus routine antenatal care. |
| Outcomes | Maternal and fetal mortality and morbidity, healthcare utilisation. |
| Starting date | Protocol publication: 5 February 2014. |
| Contact information | Elizabeth McClure [email protected] |
| Notes |
| Trial name or title | RECRET: Routine ultrasound screening in the third trimester. |
| Methods | Randomised controlled trial, ongoing. |
| Participants | Pregnant women at low‐risk of complications, singleton only. |
| Interventions | Ultrasound between 34‐35 weeks versus ultrasound between 30‐31 weeks. |
| Outcomes | Small‐for‐gestational age, intrauterine growth restriction, healthcare utilisation outcomes, maternal and neonatal outcomes. |
| Starting date | May 2012. |
| Contact information | Eric Verspyck eric.verspyck@chu‐rouen.fr |
| Notes |
Data and analyses
| Outcome or subgroup title | No. of studies | No. of participants | Statistical method | Effect size |
| 1 Induction of labour Show forest plot | 6 | 22663 | Risk Ratio (M‐H, Random, 95% CI) | 0.93 [0.81, 1.07] |
| Analysis 1.1  Comparison 1 Routine ultrasound > 24 weeks versus no/concealed/selective ultrasound > 24 weeks, Outcome 1 Induction of labour. | ||||
| 2 Caesarean section Show forest plot | 6 | 27461 | Risk Ratio (M‐H, Random, 95% CI) | 1.03 [0.92, 1.15] |
| Analysis 1.2  Comparison 1 Routine ultrasound > 24 weeks versus no/concealed/selective ultrasound > 24 weeks, Outcome 2 Caesarean section. | ||||
| 3 Perinatal mortality Show forest plot | 8 | 30675 | Risk Ratio (M‐H, Random, 95% CI) | 1.01 [0.67, 1.54] |
| Analysis 1.3  Comparison 1 Routine ultrasound > 24 weeks versus no/concealed/selective ultrasound > 24 weeks, Outcome 3 Perinatal mortality. | ||||
| 4 Preterm delivery < 37 weeks' gestation Show forest plot | 2 | 17151 | Risk Ratio (M‐H, Fixed, 95% CI) | 0.96 [0.85, 1.08] |
| Analysis 1.4  Comparison 1 Routine ultrasound > 24 weeks versus no/concealed/selective ultrasound > 24 weeks, Outcome 4 Preterm delivery < 37 weeks' gestation. | ||||
| 5 Antenatal admission Show forest plot | 4 | 5396 | Risk Ratio (M‐H, Random, 95% CI) | 1.07 [0.80, 1.43] |
| Analysis 1.5  Comparison 1 Routine ultrasound > 24 weeks versus no/concealed/selective ultrasound > 24 weeks, Outcome 5 Antenatal admission. | ||||
| 6 Number of days in hospital (mean, standard deviation (SD)) (non‐prespecified) Show forest plot | 1 | 877 | Mean Difference (IV, Fixed, 95% CI) | 0.10 [0.07, 0.13] |
| Analysis 1.6  Comparison 1 Routine ultrasound > 24 weeks versus no/concealed/selective ultrasound > 24 weeks, Outcome 6 Number of days in hospital (mean, standard deviation (SD)) (non‐prespecified). | ||||
| 7 CTG (cardiotocograph) Show forest plot | 1 | 2000 | Risk Ratio (M‐H, Fixed, 95% CI) | 1.02 [0.97, 1.06] |
| Analysis 1.7  Comparison 1 Routine ultrasound > 24 weeks versus no/concealed/selective ultrasound > 24 weeks, Outcome 7 CTG (cardiotocograph). | ||||
| 8 Further ultrasound scan/s Show forest plot | 2 | Risk Ratio (M‐H, Random, 95% CI) | Totals not selected | |
| Analysis 1.8  Comparison 1 Routine ultrasound > 24 weeks versus no/concealed/selective ultrasound > 24 weeks, Outcome 8 Further ultrasound scan/s. | ||||
| 9 Instrumental delivery Show forest plot | 5 | 12310 | Risk Ratio (M‐H, Fixed, 95% CI) | 1.05 [0.95, 1.16] |
| Analysis 1.9  Comparison 1 Routine ultrasound > 24 weeks versus no/concealed/selective ultrasound > 24 weeks, Outcome 9 Instrumental delivery. | ||||
| 10 Elective caesarean section Show forest plot | 4 | 5884 | Risk Ratio (M‐H, Fixed, 95% CI) | 1.09 [0.89, 1.34] |
| Analysis 1.10  Comparison 1 Routine ultrasound > 24 weeks versus no/concealed/selective ultrasound > 24 weeks, Outcome 10 Elective caesarean section. | ||||
| 11 Emergency caesarean section Show forest plot | 5 | 12310 | Risk Ratio (M‐H, Fixed, 95% CI) | 1.03 [0.89, 1.20] |
| Analysis 1.11  Comparison 1 Routine ultrasound > 24 weeks versus no/concealed/selective ultrasound > 24 weeks, Outcome 11 Emergency caesarean section. | ||||
| 12 Gestation at birth (mean, SD) Show forest plot | 3 | 9303 | Mean Difference (IV, Random, 95% CI) | ‐0.10 [‐0.22, 0.02] |
| Analysis 1.12  Comparison 1 Routine ultrasound > 24 weeks versus no/concealed/selective ultrasound > 24 weeks, Outcome 12 Gestation at birth (mean, SD). | ||||
| 13 Birthweight (mean, SD) Show forest plot | 5 | 26136 | Mean Difference (IV, Fixed, 95% CI) | 4.40 [‐8.89, 17.69] |
| Analysis 1.13  Comparison 1 Routine ultrasound > 24 weeks versus no/concealed/selective ultrasound > 24 weeks, Outcome 13 Birthweight (mean, SD). | ||||
| 14 Birthweight < 10th centile Show forest plot | 4 | 20293 | Risk Ratio (M‐H, Random, 95% CI) | 0.98 [0.74, 1.28] |
| Analysis 1.14  Comparison 1 Routine ultrasound > 24 weeks versus no/concealed/selective ultrasound > 24 weeks, Outcome 14 Birthweight < 10th centile. | ||||
| 15 Low birthweight < 2.5 kg Show forest plot | 3 | 4510 | Risk Ratio (M‐H, Fixed, 95% CI) | 0.92 [0.71, 1.18] |
| Analysis 1.15  Comparison 1 Routine ultrasound > 24 weeks versus no/concealed/selective ultrasound > 24 weeks, Outcome 15 Low birthweight < 2.5 kg. | ||||
| 16 Neonatal resuscitation Show forest plot | 5 | 12909 | Risk Ratio (M‐H, Fixed, 95% CI) | 0.95 [0.84, 1.08] |
| Analysis 1.16  Comparison 1 Routine ultrasound > 24 weeks versus no/concealed/selective ultrasound > 24 weeks, Outcome 16 Neonatal resuscitation. | ||||
| 17 Neonatal ventilation Show forest plot | 2 | 3004 | Risk Ratio (M‐H, Random, 95% CI) | 0.64 [0.23, 1.77] |
| Analysis 1.17  Comparison 1 Routine ultrasound > 24 weeks versus no/concealed/selective ultrasound > 24 weeks, Outcome 17 Neonatal ventilation. | ||||
| 18 Admission to special care baby unit Show forest plot | 5 | 12915 | Risk Ratio (M‐H, Fixed, 95% CI) | 1.01 [0.91, 1.14] |
| Analysis 1.18  Comparison 1 Routine ultrasound > 24 weeks versus no/concealed/selective ultrasound > 24 weeks, Outcome 18 Admission to special care baby unit. | ||||
| 19 Apgar score < 7 at 5 minutes Show forest plot | 4 | 5889 | Risk Ratio (M‐H, Random, 95% CI) | 0.89 [0.41, 1.93] |
| Analysis 1.19  Comparison 1 Routine ultrasound > 24 weeks versus no/concealed/selective ultrasound > 24 weeks, Outcome 19 Apgar score < 7 at 5 minutes. | ||||
| 20 Stillbirths (non‐prespecified) Show forest plot | 6 | 28107 | Risk Ratio (M‐H, Random, 95% CI) | 1.18 [0.51, 2.70] |
| Analysis 1.20  Comparison 1 Routine ultrasound > 24 weeks versus no/concealed/selective ultrasound > 24 weeks, Outcome 20 Stillbirths (non‐prespecified). | ||||
| 21 Neonatal deaths Show forest plot | 5 | 21708 | Risk Ratio (M‐H, Fixed, 95% CI) | 1.04 [0.58, 1.85] |
| Analysis 1.21  Comparison 1 Routine ultrasound > 24 weeks versus no/concealed/selective ultrasound > 24 weeks, Outcome 21 Neonatal deaths. | ||||
| 22 Perinatal mortality (excluding congenital abnormalities) (non‐prespecified) Show forest plot | 6 | 28133 | Risk Ratio (M‐H, Random, 95% CI) | 1.13 [0.58, 2.19] |
| Analysis 1.22  Comparison 1 Routine ultrasound > 24 weeks versus no/concealed/selective ultrasound > 24 weeks, Outcome 22 Perinatal mortality (excluding congenital abnormalities) (non‐prespecified). | ||||
| 23 Stillbirths (excluding congenital abnormalities) (non‐prespecified) Show forest plot | 2 | 2902 | Risk Ratio (M‐H, Fixed, 95% CI) | 0.05 [0.00, 0.90] |
| Analysis 1.23  Comparison 1 Routine ultrasound > 24 weeks versus no/concealed/selective ultrasound > 24 weeks, Outcome 23 Stillbirths (excluding congenital abnormalities) (non‐prespecified). | ||||
| 24 Neonatal deaths (excluding congenital abnormalities) Show forest plot | 2 | 2902 | Risk Ratio (M‐H, Fixed, 95% CI) | 1.99 [0.18, 21.96] |
| Analysis 1.24  Comparison 1 Routine ultrasound > 24 weeks versus no/concealed/selective ultrasound > 24 weeks, Outcome 24 Neonatal deaths (excluding congenital abnormalities). | ||||
| 25 Post‐term delivery > 42 weeks' gestation (non‐prespecified) Show forest plot | 2 | 17151 | Risk Ratio (M‐H, Fixed, 95% CI) | 0.69 [0.59, 0.81] |
| Analysis 1.25  Comparison 1 Routine ultrasound > 24 weeks versus no/concealed/selective ultrasound > 24 weeks, Outcome 25 Post‐term delivery > 42 weeks' gestation (non‐prespecified). | ||||
| 26 Birthweight < 5th centile (non‐prespecified) Show forest plot | 2 | 2404 | Risk Ratio (M‐H, Fixed, 95% CI) | 1.18 [0.81, 1.74] |
| Analysis 1.26  Comparison 1 Routine ultrasound > 24 weeks versus no/concealed/selective ultrasound > 24 weeks, Outcome 26 Birthweight < 5th centile (non‐prespecified). | ||||
| 27 Moderate neonatal morbidity (non‐prespecified) Show forest plot | 1 | 15281 | Risk Ratio (M‐H, Fixed, 95% CI) | 0.97 [0.81, 1.16] |
| Analysis 1.27  Comparison 1 Routine ultrasound > 24 weeks versus no/concealed/selective ultrasound > 24 weeks, Outcome 27 Moderate neonatal morbidity (non‐prespecified). | ||||
| 28 Severe neonatal morbidity (non‐prespecified) Show forest plot | 1 | 15281 | Risk Ratio (M‐H, Fixed, 95% CI) | 1.03 [0.78, 1.36] |
| Analysis 1.28  Comparison 1 Routine ultrasound > 24 weeks versus no/concealed/selective ultrasound > 24 weeks, Outcome 28 Severe neonatal morbidity (non‐prespecified). | ||||
| 29 Perinatal mortality (twins) (non‐prespecified) Show forest plot | 3 | 314 | Risk Ratio (M‐H, Fixed, 95% CI) | 0.63 [0.24, 1.66] |
| Analysis 1.29  Comparison 1 Routine ultrasound > 24 weeks versus no/concealed/selective ultrasound > 24 weeks, Outcome 29 Perinatal mortality (twins) (non‐prespecified). | ||||
| Outcome or subgroup title | No. of studies | No. of participants | Statistical method | Effect size |
| 1 Induction of labour Show forest plot | 1 | 2834 | Risk Ratio (M‐H, Fixed, 95% CI) | 1.02 [0.92, 1.14] |
| Analysis 2.1  Comparison 2 Serial ultrasound and Doppler ultrasound versus selective ultrasound, Outcome 1 Induction of labour. | ||||
| 2 Caesarean section Show forest plot | 1 | 2834 | Risk Ratio (M‐H, Fixed, 95% CI) | 0.89 [0.76, 1.03] |
| Analysis 2.2  Comparison 2 Serial ultrasound and Doppler ultrasound versus selective ultrasound, Outcome 2 Caesarean section. | ||||
| 3 Perinatal mortality Show forest plot | 1 | 2834 | Risk Ratio (M‐H, Fixed, 95% CI) | 0.59 [0.30, 1.17] |
| Analysis 2.3  Comparison 2 Serial ultrasound and Doppler ultrasound versus selective ultrasound, Outcome 3 Perinatal mortality. | ||||
| 4 CTG (cardiograph) Show forest plot | 1 | 2834 | Risk Ratio (M‐H, Fixed, 95% CI) | 1.01 [0.93, 1.09] |
| Analysis 2.4  Comparison 2 Serial ultrasound and Doppler ultrasound versus selective ultrasound, Outcome 4 CTG (cardiograph). | ||||
| 5 Elective caesarean section Show forest plot | 1 | 2834 | Risk Ratio (M‐H, Fixed, 95% CI) | 0.95 [0.77, 1.17] |
| Analysis 2.5  Comparison 2 Serial ultrasound and Doppler ultrasound versus selective ultrasound, Outcome 5 Elective caesarean section. | ||||
| 6 Emergency caesarean section Show forest plot | 1 | 2834 | Risk Ratio (M‐H, Fixed, 95% CI) | 0.82 [0.64, 1.05] |
| Analysis 2.6  Comparison 2 Serial ultrasound and Doppler ultrasound versus selective ultrasound, Outcome 6 Emergency caesarean section. | ||||
| 7 Gestation at birth (mean, SD) Show forest plot | 1 | 2834 | Mean Difference (IV, Fixed, 95% CI) | ‐0.10 [‐1.21, 1.01] |
| Analysis 2.7  Comparison 2 Serial ultrasound and Doppler ultrasound versus selective ultrasound, Outcome 7 Gestation at birth (mean, SD). | ||||
| 8 Birthweight (mean, SD) Show forest plot | 1 | 2834 | Mean Difference (IV, Fixed, 95% CI) | ‐25.0 [‐67.53, 17.53] |
| Analysis 2.8  Comparison 2 Serial ultrasound and Doppler ultrasound versus selective ultrasound, Outcome 8 Birthweight (mean, SD). | ||||
| 9 Birthweight < 10th centile Show forest plot | 1 | 2834 | Risk Ratio (M‐H, Fixed, 95% CI) | 1.36 [1.10, 1.68] |
| Analysis 2.9  Comparison 2 Serial ultrasound and Doppler ultrasound versus selective ultrasound, Outcome 9 Birthweight < 10th centile. | ||||
| 10 Birthweight < 3rd centile Show forest plot | 1 | 2834 | Risk Ratio (M‐H, Fixed, 95% CI) | 1.66 [1.10, 2.51] |
| Analysis 2.10  Comparison 2 Serial ultrasound and Doppler ultrasound versus selective ultrasound, Outcome 10 Birthweight < 3rd centile. | ||||
| 11 Low birthweight (< 2.5 kg) Show forest plot | 1 | 2834 | Risk Ratio (M‐H, Fixed, 95% CI) | 1.14 [0.85, 1.52] |
| Analysis 2.11  Comparison 2 Serial ultrasound and Doppler ultrasound versus selective ultrasound, Outcome 11 Low birthweight (< 2.5 kg). | ||||
| 12 Very low birthweight (< 1.5 kg) Show forest plot | 1 | 2834 | Risk Ratio (M‐H, Fixed, 95% CI) | 1.27 [0.65, 2.49] |
| Analysis 2.12  Comparison 2 Serial ultrasound and Doppler ultrasound versus selective ultrasound, Outcome 12 Very low birthweight (< 1.5 kg). | ||||
| 13 Need for resuscitation Show forest plot | 1 | 2834 | Risk Ratio (M‐H, Fixed, 95% CI) | 0.98 [0.92, 1.05] |
| Analysis 2.13  Comparison 2 Serial ultrasound and Doppler ultrasound versus selective ultrasound, Outcome 13 Need for resuscitation. | ||||
| 14 Need for ventilation Show forest plot | 1 | 2834 | Risk Ratio (M‐H, Fixed, 95% CI) | 0.67 [0.41, 1.09] |
| Analysis 2.14  Comparison 2 Serial ultrasound and Doppler ultrasound versus selective ultrasound, Outcome 14 Need for ventilation. | ||||
| 15 Admission to special care baby unit Show forest plot | 2 | 2979 | Risk Ratio (M‐H, Fixed, 95% CI) | 0.95 [0.69, 1.30] |
| Analysis 2.15  Comparison 2 Serial ultrasound and Doppler ultrasound versus selective ultrasound, Outcome 15 Admission to special care baby unit. | ||||
| 16 Apgar score < 7 at 5 minutes Show forest plot | 1 | 2834 | Risk Ratio (M‐H, Fixed, 95% CI) | 0.77 [0.46, 1.27] |
| Analysis 2.16  Comparison 2 Serial ultrasound and Doppler ultrasound versus selective ultrasound, Outcome 16 Apgar score < 7 at 5 minutes. | ||||
| 17 Neonatal intraventricular haemorrhage Show forest plot | 1 | 2834 | Risk Ratio (M‐H, Fixed, 95% CI) | 0.80 [0.22, 2.98] |
| Analysis 2.17  Comparison 2 Serial ultrasound and Doppler ultrasound versus selective ultrasound, Outcome 17 Neonatal intraventricular haemorrhage. | ||||
| 18 Stillbirths Show forest plot | 1 | 2834 | Risk Ratio (M‐H, Fixed, 95% CI) | 0.84 [0.36, 1.93] |
| Analysis 2.18  Comparison 2 Serial ultrasound and Doppler ultrasound versus selective ultrasound, Outcome 18 Stillbirths. | ||||
| 19 Neonatal deaths (non‐prespecified) Show forest plot | 1 | 2834 | Risk Ratio (M‐H, Fixed, 95% CI) | 0.30 [0.08, 1.09] |
| Analysis 2.19  Comparison 2 Serial ultrasound and Doppler ultrasound versus selective ultrasound, Outcome 19 Neonatal deaths (non‐prespecified). | ||||
| 20 Neonatal deaths (excluding congenital abnormalities) (non‐prespecified) Show forest plot | 1 | 2834 | Risk Ratio (M‐H, Fixed, 95% CI) | 0.40 [0.08, 2.06] |
| Analysis 2.20  Comparison 2 Serial ultrasound and Doppler ultrasound versus selective ultrasound, Outcome 20 Neonatal deaths (excluding congenital abnormalities) (non‐prespecified). | ||||

'Risk of bias' graph: review authors' judgements about each risk of bias item presented as percentages across all included studies.

'Risk of bias' summary: review authors' judgements about each risk of bias item for each included study.

Comparison 1 Routine ultrasound > 24 weeks versus no/concealed/selective ultrasound > 24 weeks, Outcome 1 Induction of labour.

Comparison 1 Routine ultrasound > 24 weeks versus no/concealed/selective ultrasound > 24 weeks, Outcome 2 Caesarean section.

Comparison 1 Routine ultrasound > 24 weeks versus no/concealed/selective ultrasound > 24 weeks, Outcome 3 Perinatal mortality.

Comparison 1 Routine ultrasound > 24 weeks versus no/concealed/selective ultrasound > 24 weeks, Outcome 4 Preterm delivery < 37 weeks' gestation.

Comparison 1 Routine ultrasound > 24 weeks versus no/concealed/selective ultrasound > 24 weeks, Outcome 5 Antenatal admission.

Comparison 1 Routine ultrasound > 24 weeks versus no/concealed/selective ultrasound > 24 weeks, Outcome 6 Number of days in hospital (mean, standard deviation (SD)) (non‐prespecified).

Comparison 1 Routine ultrasound > 24 weeks versus no/concealed/selective ultrasound > 24 weeks, Outcome 7 CTG (cardiotocograph).

Comparison 1 Routine ultrasound > 24 weeks versus no/concealed/selective ultrasound > 24 weeks, Outcome 8 Further ultrasound scan/s.

Comparison 1 Routine ultrasound > 24 weeks versus no/concealed/selective ultrasound > 24 weeks, Outcome 9 Instrumental delivery.

Comparison 1 Routine ultrasound > 24 weeks versus no/concealed/selective ultrasound > 24 weeks, Outcome 10 Elective caesarean section.

Comparison 1 Routine ultrasound > 24 weeks versus no/concealed/selective ultrasound > 24 weeks, Outcome 11 Emergency caesarean section.

Comparison 1 Routine ultrasound > 24 weeks versus no/concealed/selective ultrasound > 24 weeks, Outcome 12 Gestation at birth (mean, SD).

Comparison 1 Routine ultrasound > 24 weeks versus no/concealed/selective ultrasound > 24 weeks, Outcome 13 Birthweight (mean, SD).

Comparison 1 Routine ultrasound > 24 weeks versus no/concealed/selective ultrasound > 24 weeks, Outcome 14 Birthweight < 10th centile.

Comparison 1 Routine ultrasound > 24 weeks versus no/concealed/selective ultrasound > 24 weeks, Outcome 15 Low birthweight < 2.5 kg.

Comparison 1 Routine ultrasound > 24 weeks versus no/concealed/selective ultrasound > 24 weeks, Outcome 16 Neonatal resuscitation.

Comparison 1 Routine ultrasound > 24 weeks versus no/concealed/selective ultrasound > 24 weeks, Outcome 17 Neonatal ventilation.

Comparison 1 Routine ultrasound > 24 weeks versus no/concealed/selective ultrasound > 24 weeks, Outcome 18 Admission to special care baby unit.

Comparison 1 Routine ultrasound > 24 weeks versus no/concealed/selective ultrasound > 24 weeks, Outcome 19 Apgar score < 7 at 5 minutes.

Comparison 1 Routine ultrasound > 24 weeks versus no/concealed/selective ultrasound > 24 weeks, Outcome 20 Stillbirths (non‐prespecified).

Comparison 1 Routine ultrasound > 24 weeks versus no/concealed/selective ultrasound > 24 weeks, Outcome 21 Neonatal deaths.

Comparison 1 Routine ultrasound > 24 weeks versus no/concealed/selective ultrasound > 24 weeks, Outcome 22 Perinatal mortality (excluding congenital abnormalities) (non‐prespecified).

Comparison 1 Routine ultrasound > 24 weeks versus no/concealed/selective ultrasound > 24 weeks, Outcome 23 Stillbirths (excluding congenital abnormalities) (non‐prespecified).

Comparison 1 Routine ultrasound > 24 weeks versus no/concealed/selective ultrasound > 24 weeks, Outcome 24 Neonatal deaths (excluding congenital abnormalities).

Comparison 1 Routine ultrasound > 24 weeks versus no/concealed/selective ultrasound > 24 weeks, Outcome 25 Post‐term delivery > 42 weeks' gestation (non‐prespecified).

Comparison 1 Routine ultrasound > 24 weeks versus no/concealed/selective ultrasound > 24 weeks, Outcome 26 Birthweight < 5th centile (non‐prespecified).
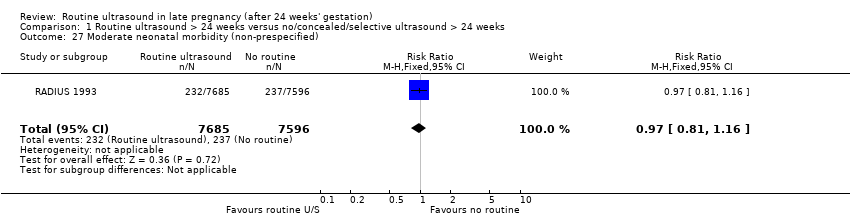
Comparison 1 Routine ultrasound > 24 weeks versus no/concealed/selective ultrasound > 24 weeks, Outcome 27 Moderate neonatal morbidity (non‐prespecified).

Comparison 1 Routine ultrasound > 24 weeks versus no/concealed/selective ultrasound > 24 weeks, Outcome 28 Severe neonatal morbidity (non‐prespecified).

Comparison 1 Routine ultrasound > 24 weeks versus no/concealed/selective ultrasound > 24 weeks, Outcome 29 Perinatal mortality (twins) (non‐prespecified).

Comparison 2 Serial ultrasound and Doppler ultrasound versus selective ultrasound, Outcome 1 Induction of labour.

Comparison 2 Serial ultrasound and Doppler ultrasound versus selective ultrasound, Outcome 2 Caesarean section.

Comparison 2 Serial ultrasound and Doppler ultrasound versus selective ultrasound, Outcome 3 Perinatal mortality.

Comparison 2 Serial ultrasound and Doppler ultrasound versus selective ultrasound, Outcome 4 CTG (cardiograph).

Comparison 2 Serial ultrasound and Doppler ultrasound versus selective ultrasound, Outcome 5 Elective caesarean section.

Comparison 2 Serial ultrasound and Doppler ultrasound versus selective ultrasound, Outcome 6 Emergency caesarean section.

Comparison 2 Serial ultrasound and Doppler ultrasound versus selective ultrasound, Outcome 7 Gestation at birth (mean, SD).

Comparison 2 Serial ultrasound and Doppler ultrasound versus selective ultrasound, Outcome 8 Birthweight (mean, SD).

Comparison 2 Serial ultrasound and Doppler ultrasound versus selective ultrasound, Outcome 9 Birthweight < 10th centile.

Comparison 2 Serial ultrasound and Doppler ultrasound versus selective ultrasound, Outcome 10 Birthweight < 3rd centile.

Comparison 2 Serial ultrasound and Doppler ultrasound versus selective ultrasound, Outcome 11 Low birthweight (< 2.5 kg).

Comparison 2 Serial ultrasound and Doppler ultrasound versus selective ultrasound, Outcome 12 Very low birthweight (< 1.5 kg).

Comparison 2 Serial ultrasound and Doppler ultrasound versus selective ultrasound, Outcome 13 Need for resuscitation.

Comparison 2 Serial ultrasound and Doppler ultrasound versus selective ultrasound, Outcome 14 Need for ventilation.

Comparison 2 Serial ultrasound and Doppler ultrasound versus selective ultrasound, Outcome 15 Admission to special care baby unit.

Comparison 2 Serial ultrasound and Doppler ultrasound versus selective ultrasound, Outcome 16 Apgar score < 7 at 5 minutes.

Comparison 2 Serial ultrasound and Doppler ultrasound versus selective ultrasound, Outcome 17 Neonatal intraventricular haemorrhage.

Comparison 2 Serial ultrasound and Doppler ultrasound versus selective ultrasound, Outcome 18 Stillbirths.

Comparison 2 Serial ultrasound and Doppler ultrasound versus selective ultrasound, Outcome 19 Neonatal deaths (non‐prespecified).

Comparison 2 Serial ultrasound and Doppler ultrasound versus selective ultrasound, Outcome 20 Neonatal deaths (excluding congenital abnormalities) (non‐prespecified).
| Routine ultrasound > 24 weeks for pregnant women | ||||||
| Patient or population: women in late pregnancy (after 24 weeks' gestation) in both unselected populations and designated low‐risk populations | ||||||
| Outcomes | Illustrative comparative risks* (95% CI) | Relative effect | No of participants | Quality of the evidence | Comments | |
| Assumed risk | Corresponding risk | |||||
| Control | Routine ultrasound > 24 weeks | |||||
| Perinatal mortality | Study population | RR 1.01 | 30675 | ⊕⊕⊕⊝ | ||
| 6 per 1000 | 6 per 1000 | |||||
| Moderate | ||||||
| 5 per 1000 | 5 per 1000 | |||||
| Preterm delivery < 37 weeks' gestation | Study population | RR 0.96 | 17151 | ⊕⊕⊕⊕ | ||
| 59 per 1000 | 57 per 1000 | |||||
| Moderate | ||||||
| 60 per 1000 | 58 per 1000 | |||||
| Induction of labour | Study population | RR 0.93 | 22663 | ⊕⊕⊕⊝ | ||
| 238 per 1000 | 222 per 1000 | |||||
| Moderate | ||||||
| 242 per 1000 | 225 per 1000 | |||||
| Caesarean section | Study population | RR 1.02 | 27461 | ⊕⊕⊕⊕ | ||
| 139 per 1000 | 142 per 1000 | |||||
| Moderate | ||||||
| 133 per 1000 | 136 per 1000 | |||||
| Preterm delivery less than 34 weeks | Study population | Not estimable | 0 | Not estimable | None of the included trials in this review collected data for this outcome. | |
| See comment | ||||||
| Maternal psychological effects | Study population | Not estimable | 0 | Not estimable | None of the included trials in this review collected data for this outcome. | |
| See comment | ||||||
| Neurodevelopment at age 2 | Study population | Not estimable | 0 | Not estimable | None of the included trials in this review collected data for this outcome. | |
| See comment | ||||||
| *The basis for the assumed risk (e.g. the median control group risk across studies) is provided in footnotes. The corresponding risk (and its 95% confidence interval) is based on the assumed risk in the comparison group and the relative effect of the intervention (and its 95% CI). | ||||||
| GRADE Working Group grades of evidence | ||||||
| 1 Wide confidence interval crossing the line of no effect. RR 1.01 (0.67 to 1.54) | ||||||
| Outcome or subgroup title | No. of studies | No. of participants | Statistical method | Effect size |
| 1 Induction of labour Show forest plot | 6 | 22663 | Risk Ratio (M‐H, Random, 95% CI) | 0.93 [0.81, 1.07] |
| 2 Caesarean section Show forest plot | 6 | 27461 | Risk Ratio (M‐H, Random, 95% CI) | 1.03 [0.92, 1.15] |
| 3 Perinatal mortality Show forest plot | 8 | 30675 | Risk Ratio (M‐H, Random, 95% CI) | 1.01 [0.67, 1.54] |
| 4 Preterm delivery < 37 weeks' gestation Show forest plot | 2 | 17151 | Risk Ratio (M‐H, Fixed, 95% CI) | 0.96 [0.85, 1.08] |
| 5 Antenatal admission Show forest plot | 4 | 5396 | Risk Ratio (M‐H, Random, 95% CI) | 1.07 [0.80, 1.43] |
| 6 Number of days in hospital (mean, standard deviation (SD)) (non‐prespecified) Show forest plot | 1 | 877 | Mean Difference (IV, Fixed, 95% CI) | 0.10 [0.07, 0.13] |
| 7 CTG (cardiotocograph) Show forest plot | 1 | 2000 | Risk Ratio (M‐H, Fixed, 95% CI) | 1.02 [0.97, 1.06] |
| 8 Further ultrasound scan/s Show forest plot | 2 | Risk Ratio (M‐H, Random, 95% CI) | Totals not selected | |
| 9 Instrumental delivery Show forest plot | 5 | 12310 | Risk Ratio (M‐H, Fixed, 95% CI) | 1.05 [0.95, 1.16] |
| 10 Elective caesarean section Show forest plot | 4 | 5884 | Risk Ratio (M‐H, Fixed, 95% CI) | 1.09 [0.89, 1.34] |
| 11 Emergency caesarean section Show forest plot | 5 | 12310 | Risk Ratio (M‐H, Fixed, 95% CI) | 1.03 [0.89, 1.20] |
| 12 Gestation at birth (mean, SD) Show forest plot | 3 | 9303 | Mean Difference (IV, Random, 95% CI) | ‐0.10 [‐0.22, 0.02] |
| 13 Birthweight (mean, SD) Show forest plot | 5 | 26136 | Mean Difference (IV, Fixed, 95% CI) | 4.40 [‐8.89, 17.69] |
| 14 Birthweight < 10th centile Show forest plot | 4 | 20293 | Risk Ratio (M‐H, Random, 95% CI) | 0.98 [0.74, 1.28] |
| 15 Low birthweight < 2.5 kg Show forest plot | 3 | 4510 | Risk Ratio (M‐H, Fixed, 95% CI) | 0.92 [0.71, 1.18] |
| 16 Neonatal resuscitation Show forest plot | 5 | 12909 | Risk Ratio (M‐H, Fixed, 95% CI) | 0.95 [0.84, 1.08] |
| 17 Neonatal ventilation Show forest plot | 2 | 3004 | Risk Ratio (M‐H, Random, 95% CI) | 0.64 [0.23, 1.77] |
| 18 Admission to special care baby unit Show forest plot | 5 | 12915 | Risk Ratio (M‐H, Fixed, 95% CI) | 1.01 [0.91, 1.14] |
| 19 Apgar score < 7 at 5 minutes Show forest plot | 4 | 5889 | Risk Ratio (M‐H, Random, 95% CI) | 0.89 [0.41, 1.93] |
| 20 Stillbirths (non‐prespecified) Show forest plot | 6 | 28107 | Risk Ratio (M‐H, Random, 95% CI) | 1.18 [0.51, 2.70] |
| 21 Neonatal deaths Show forest plot | 5 | 21708 | Risk Ratio (M‐H, Fixed, 95% CI) | 1.04 [0.58, 1.85] |
| 22 Perinatal mortality (excluding congenital abnormalities) (non‐prespecified) Show forest plot | 6 | 28133 | Risk Ratio (M‐H, Random, 95% CI) | 1.13 [0.58, 2.19] |
| 23 Stillbirths (excluding congenital abnormalities) (non‐prespecified) Show forest plot | 2 | 2902 | Risk Ratio (M‐H, Fixed, 95% CI) | 0.05 [0.00, 0.90] |
| 24 Neonatal deaths (excluding congenital abnormalities) Show forest plot | 2 | 2902 | Risk Ratio (M‐H, Fixed, 95% CI) | 1.99 [0.18, 21.96] |
| 25 Post‐term delivery > 42 weeks' gestation (non‐prespecified) Show forest plot | 2 | 17151 | Risk Ratio (M‐H, Fixed, 95% CI) | 0.69 [0.59, 0.81] |
| 26 Birthweight < 5th centile (non‐prespecified) Show forest plot | 2 | 2404 | Risk Ratio (M‐H, Fixed, 95% CI) | 1.18 [0.81, 1.74] |
| 27 Moderate neonatal morbidity (non‐prespecified) Show forest plot | 1 | 15281 | Risk Ratio (M‐H, Fixed, 95% CI) | 0.97 [0.81, 1.16] |
| 28 Severe neonatal morbidity (non‐prespecified) Show forest plot | 1 | 15281 | Risk Ratio (M‐H, Fixed, 95% CI) | 1.03 [0.78, 1.36] |
| 29 Perinatal mortality (twins) (non‐prespecified) Show forest plot | 3 | 314 | Risk Ratio (M‐H, Fixed, 95% CI) | 0.63 [0.24, 1.66] |
| Outcome or subgroup title | No. of studies | No. of participants | Statistical method | Effect size |
| 1 Induction of labour Show forest plot | 1 | 2834 | Risk Ratio (M‐H, Fixed, 95% CI) | 1.02 [0.92, 1.14] |
| 2 Caesarean section Show forest plot | 1 | 2834 | Risk Ratio (M‐H, Fixed, 95% CI) | 0.89 [0.76, 1.03] |
| 3 Perinatal mortality Show forest plot | 1 | 2834 | Risk Ratio (M‐H, Fixed, 95% CI) | 0.59 [0.30, 1.17] |
| 4 CTG (cardiograph) Show forest plot | 1 | 2834 | Risk Ratio (M‐H, Fixed, 95% CI) | 1.01 [0.93, 1.09] |
| 5 Elective caesarean section Show forest plot | 1 | 2834 | Risk Ratio (M‐H, Fixed, 95% CI) | 0.95 [0.77, 1.17] |
| 6 Emergency caesarean section Show forest plot | 1 | 2834 | Risk Ratio (M‐H, Fixed, 95% CI) | 0.82 [0.64, 1.05] |
| 7 Gestation at birth (mean, SD) Show forest plot | 1 | 2834 | Mean Difference (IV, Fixed, 95% CI) | ‐0.10 [‐1.21, 1.01] |
| 8 Birthweight (mean, SD) Show forest plot | 1 | 2834 | Mean Difference (IV, Fixed, 95% CI) | ‐25.0 [‐67.53, 17.53] |
| 9 Birthweight < 10th centile Show forest plot | 1 | 2834 | Risk Ratio (M‐H, Fixed, 95% CI) | 1.36 [1.10, 1.68] |
| 10 Birthweight < 3rd centile Show forest plot | 1 | 2834 | Risk Ratio (M‐H, Fixed, 95% CI) | 1.66 [1.10, 2.51] |
| 11 Low birthweight (< 2.5 kg) Show forest plot | 1 | 2834 | Risk Ratio (M‐H, Fixed, 95% CI) | 1.14 [0.85, 1.52] |
| 12 Very low birthweight (< 1.5 kg) Show forest plot | 1 | 2834 | Risk Ratio (M‐H, Fixed, 95% CI) | 1.27 [0.65, 2.49] |
| 13 Need for resuscitation Show forest plot | 1 | 2834 | Risk Ratio (M‐H, Fixed, 95% CI) | 0.98 [0.92, 1.05] |
| 14 Need for ventilation Show forest plot | 1 | 2834 | Risk Ratio (M‐H, Fixed, 95% CI) | 0.67 [0.41, 1.09] |
| 15 Admission to special care baby unit Show forest plot | 2 | 2979 | Risk Ratio (M‐H, Fixed, 95% CI) | 0.95 [0.69, 1.30] |
| 16 Apgar score < 7 at 5 minutes Show forest plot | 1 | 2834 | Risk Ratio (M‐H, Fixed, 95% CI) | 0.77 [0.46, 1.27] |
| 17 Neonatal intraventricular haemorrhage Show forest plot | 1 | 2834 | Risk Ratio (M‐H, Fixed, 95% CI) | 0.80 [0.22, 2.98] |
| 18 Stillbirths Show forest plot | 1 | 2834 | Risk Ratio (M‐H, Fixed, 95% CI) | 0.84 [0.36, 1.93] |
| 19 Neonatal deaths (non‐prespecified) Show forest plot | 1 | 2834 | Risk Ratio (M‐H, Fixed, 95% CI) | 0.30 [0.08, 1.09] |
| 20 Neonatal deaths (excluding congenital abnormalities) (non‐prespecified) Show forest plot | 1 | 2834 | Risk Ratio (M‐H, Fixed, 95% CI) | 0.40 [0.08, 2.06] |