Zinc for the common cold
Información
- DOI:
- https://doi.org/10.1002/14651858.CD001364.pub4Copiar DOI

- Base de datos:
-
- Cochrane Database of Systematic Reviews
- Versión publicada:
-
- 18 junio 2013see what's new
- Tipo:
-
- Intervention
- Etapa:
-
- Review
- Grupo Editorial Cochrane:
-
Grupo Cochrane de Infecciones respiratorias agudas
- Copyright:
-
- Copyright © 2014 The Cochrane Collaboration. Published by John Wiley & Sons, Ltd.
Cifras del artículo
Altmetric:
Citado por:
Autores
Contributions of authors
Dr Meenu Singh (MS) and Dr Rashmi Ranjan Das (RRD) jointly prepared and edited the review.
Sources of support
Internal sources
-
Post Graduate Institute of Medical Education and Research (PGIMER), Chandigarh, India.
-
All India Institute of Medical Sciences (AIIMS), New Delhi, India.
External sources
-
No sources of support supplied
Declarations of interest
None known.
Acknowledgements
We wish to thank Ian IR Marshall, the previous author of this review. We acknowledge all the help and infrastructure provided by the Post Graduate Institute of Medical Education and Research (PGIMER), Chandigarh and All India Institute of Medical Sciences (AIIMS), New Delhi. We acknowledge the help provided by Elizabeth Dooley, Managing Editor and Sarah Thorning, Trials Search Co‐ordinator of the Cochrane Acute Respiratory Infections Group, for the EMBASE search and obtaining full‐text articles of studies. We are very grateful to the following referees who commented on drafts of this review: Durhane Wong‐Rieger, Ann Fonfa, Anna Joseph, Craig Mellis, Robert Black, Conor Teljeur, Mark Jones and Paul Little.
Version history
| Published | Title | Stage | Authors | Version |
| 2015 Apr 30 | Zinc for the common cold | Review | Meenu Singh, Rashmi R Das | |
| 2013 Jun 18 | Zinc for the common cold | Review | Meenu Singh, Rashmi R Das | |
| 2011 Feb 16 | Zinc for the common cold | Review | Meenu Singh, Rashmi R Das | |
| 2006 Jul 19 | Zinc for the common cold | Review | Ian IR Marshall | |
| 1999 Apr 26 | Zinc for the common cold | Review | Ian IR Marshall | |
Notes
There was a change in authorship between the first published version of the review and this updated version. Ian IR Marshall was the review author of both the protocol and review published in The Cochrane Library in 1999. The review was withdrawn and taken over by the current review authors (Meenu Singh and Rashmi Ranjan Das) for updating.
Keywords
MeSH
Medical Subject Headings (MeSH) Keywords
- Common Cold [*drug therapy, prevention & control];
- Dosage Forms;
- Gluconates [adverse effects, therapeutic use];
- Randomized Controlled Trials as Topic;
- Severity of Illness Index;
- Zinc [adverse effects, therapeutic use];
- Zinc Acetate [adverse effects, therapeutic use];
- Zinc Compounds [adverse effects, *therapeutic use];
- Zinc Sulfate [adverse effects, therapeutic use];
Medical Subject Headings Check Words
Humans;
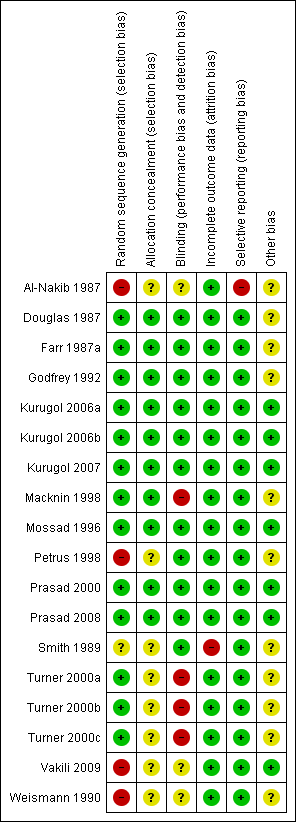
Methodological quality summary: review authors' judgements about each methodological quality item for each included study.
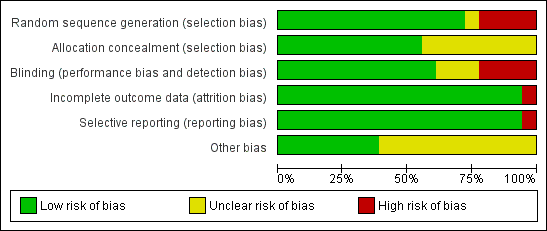
Methodological quality graph: review authors' judgements about each methodological quality item presented as percentages across all included studies.
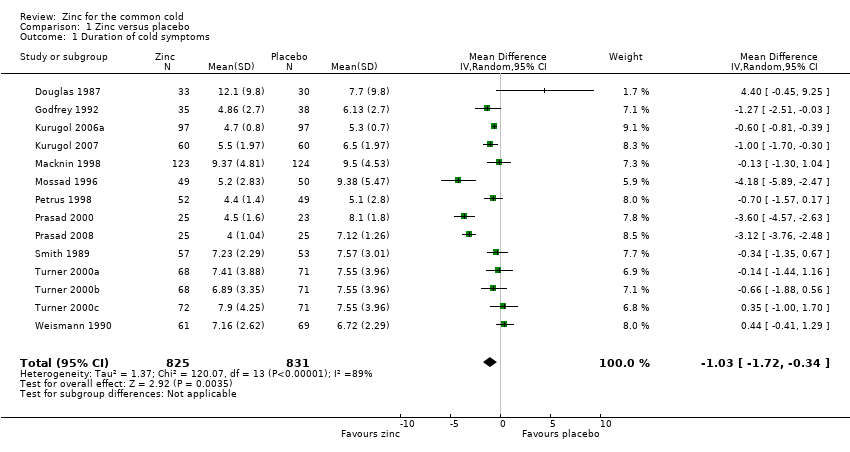
Forest plot of comparison: 1 Zinc versus placebo, outcome: 1.1 Duration of cold symptoms (in days).
Forest plot of comparison: 1 Zinc versus placebo, outcome: 1.1 Duration of cold symptoms (in days).
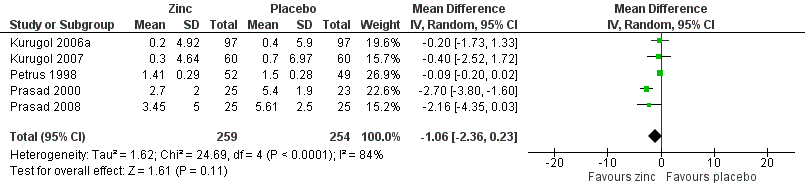
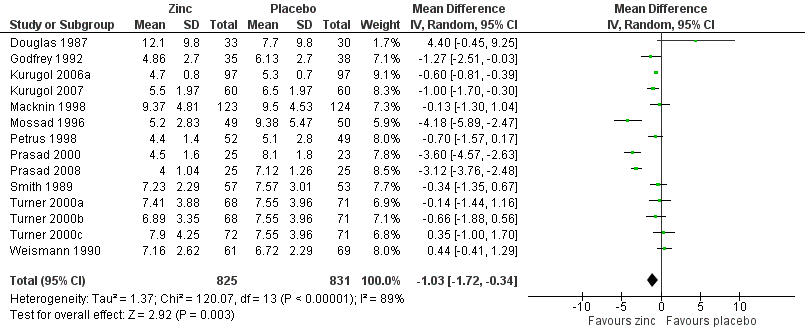
Forest plot of comparison: 1 Zinc versus placebo, outcome: 1.2 Severity of symptoms (score).
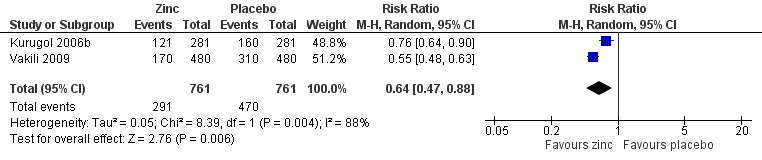
Forest plot of comparison: 1 Zinc versus placebo, outcome: 1.3 Incidence of common cold (IRR).
Comparison 1 Zinc versus placebo, Outcome 1 Duration of cold symptoms.
Comparison 1 Zinc versus placebo, Outcome 2 Subgroup analysis (duration of cold symptoms).
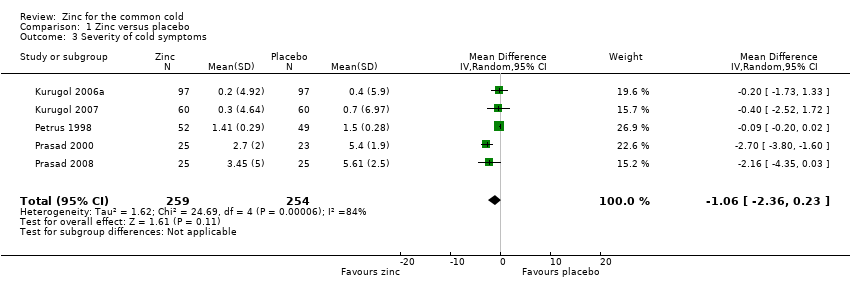
Comparison 1 Zinc versus placebo, Outcome 3 Severity of cold symptoms.
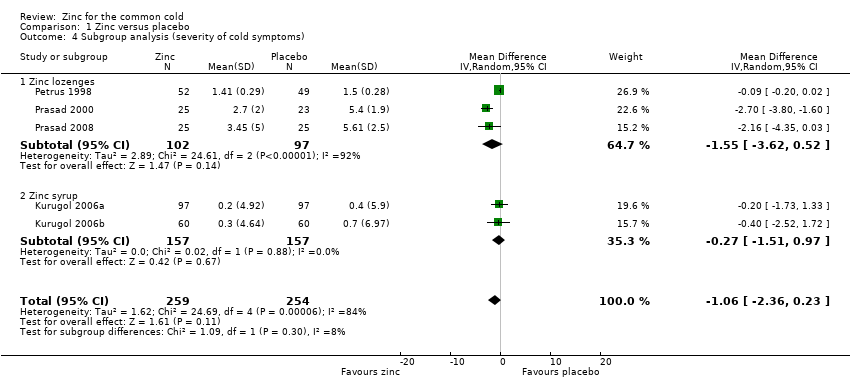
Comparison 1 Zinc versus placebo, Outcome 4 Subgroup analysis (severity of cold symptoms).
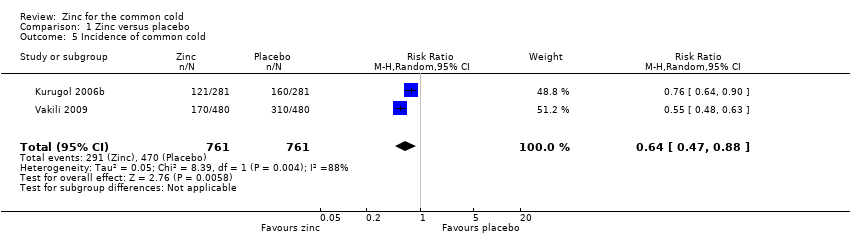
Comparison 1 Zinc versus placebo, Outcome 5 Incidence of common cold.
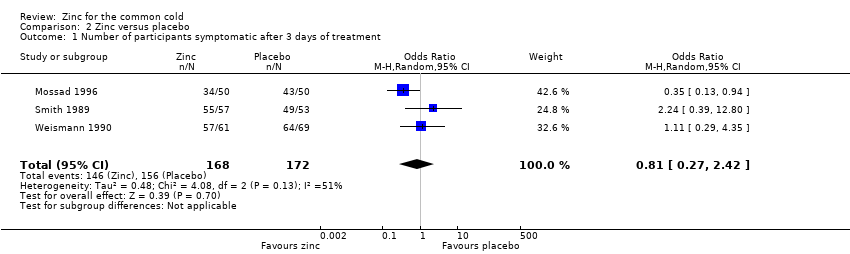
Comparison 2 Zinc versus placebo, Outcome 1 Number of participants symptomatic after 3 days of treatment.
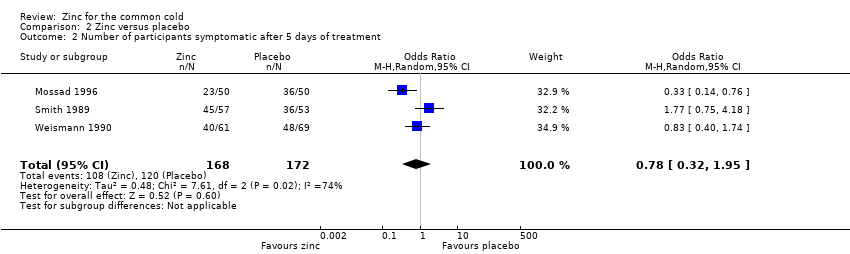
Comparison 2 Zinc versus placebo, Outcome 2 Number of participants symptomatic after 5 days of treatment.
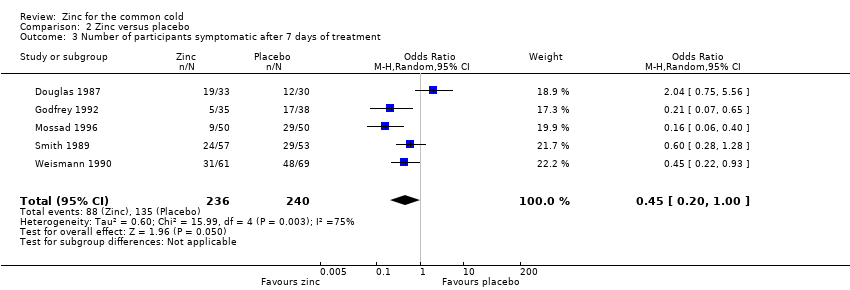
Comparison 2 Zinc versus placebo, Outcome 3 Number of participants symptomatic after 7 days of treatment.
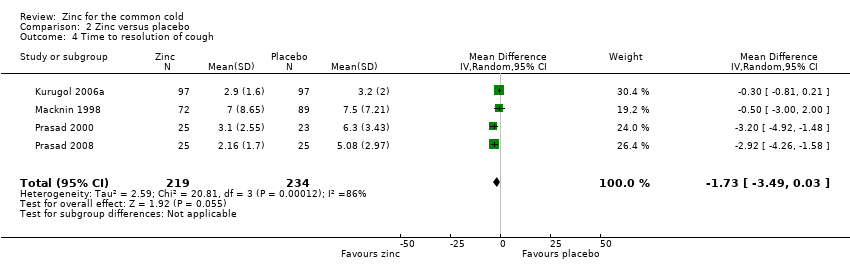
Comparison 2 Zinc versus placebo, Outcome 4 Time to resolution of cough.
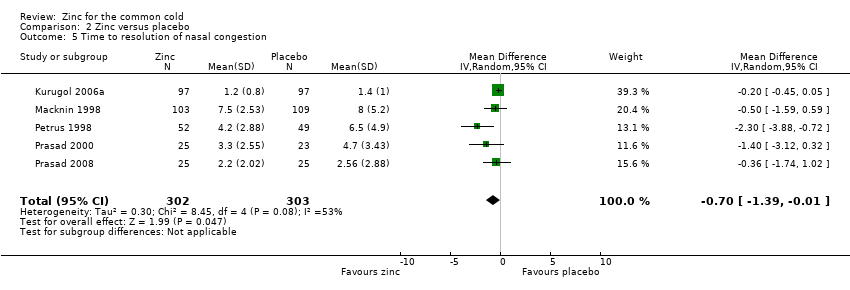
Comparison 2 Zinc versus placebo, Outcome 5 Time to resolution of nasal congestion.
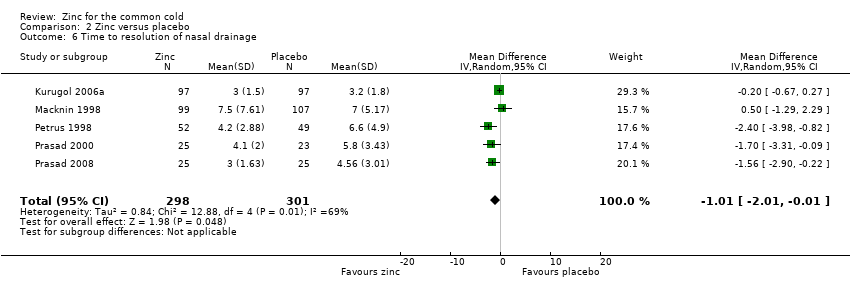
Comparison 2 Zinc versus placebo, Outcome 6 Time to resolution of nasal drainage.
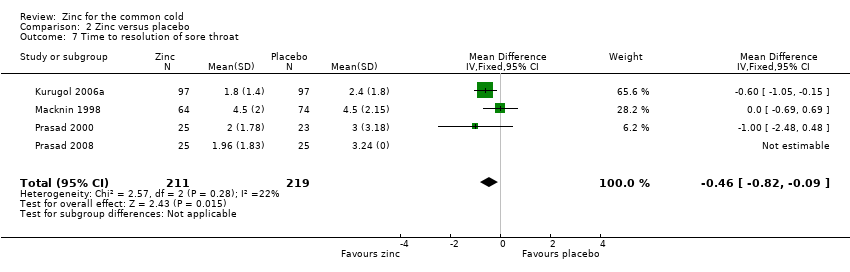
Comparison 2 Zinc versus placebo, Outcome 7 Time to resolution of sore throat.
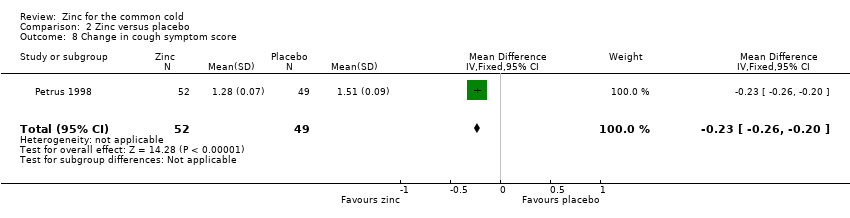
Comparison 2 Zinc versus placebo, Outcome 8 Change in cough symptom score.
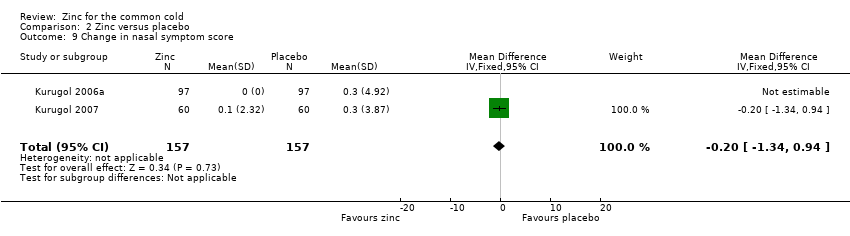
Comparison 2 Zinc versus placebo, Outcome 9 Change in nasal symptom score.
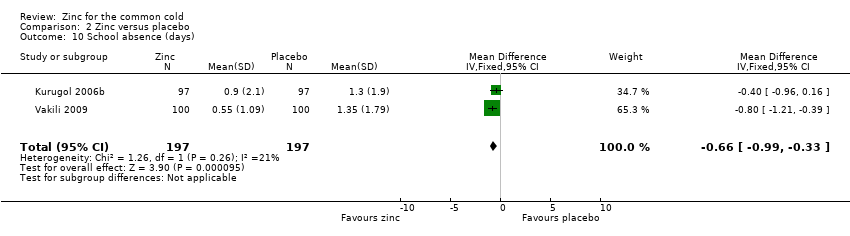
Comparison 2 Zinc versus placebo, Outcome 10 School absence (days).
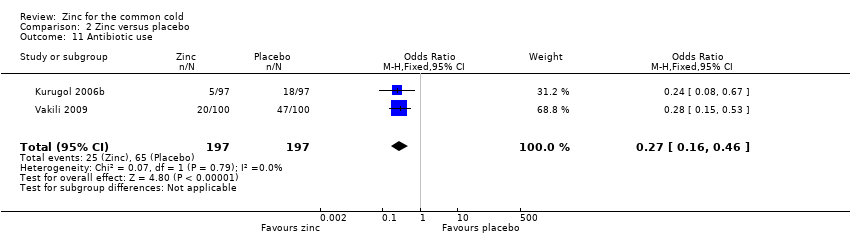
Comparison 2 Zinc versus placebo, Outcome 11 Antibiotic use.
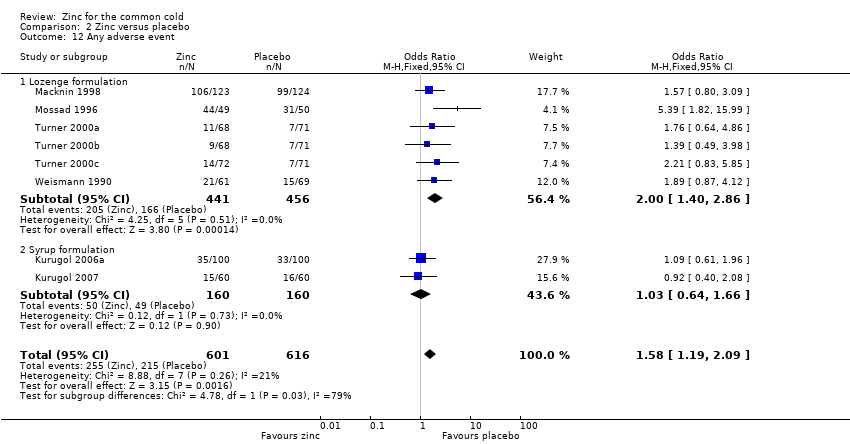
Comparison 2 Zinc versus placebo, Outcome 12 Any adverse event.
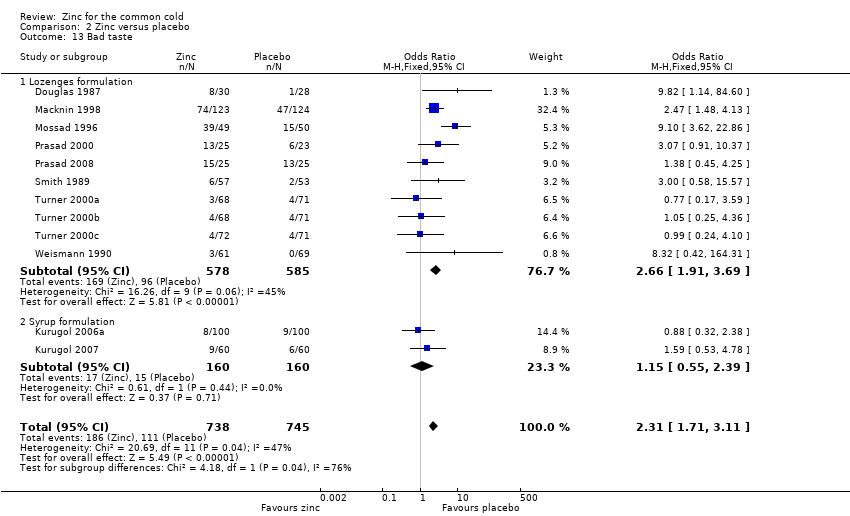
Comparison 2 Zinc versus placebo, Outcome 13 Bad taste.
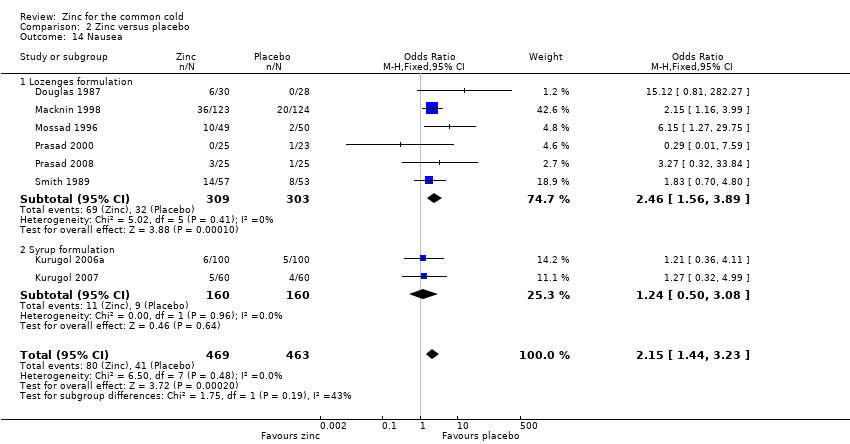
Comparison 2 Zinc versus placebo, Outcome 14 Nausea.
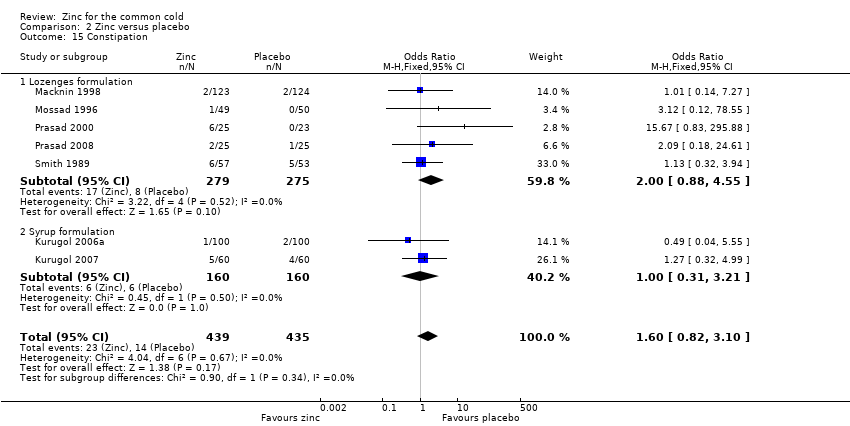
Comparison 2 Zinc versus placebo, Outcome 15 Constipation.
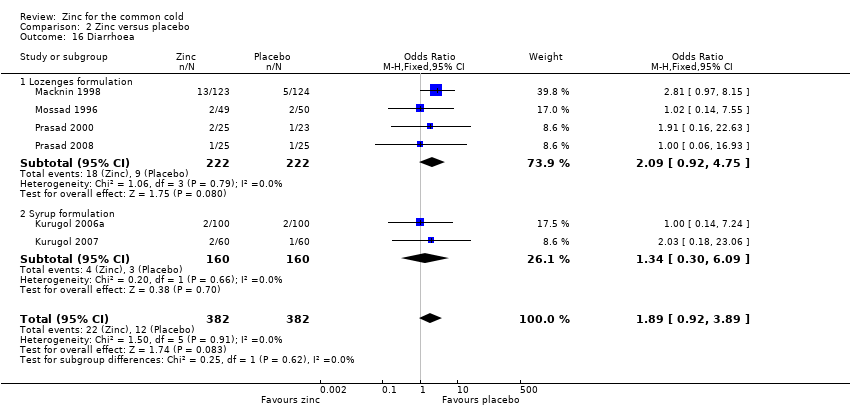
Comparison 2 Zinc versus placebo, Outcome 16 Diarrhoea.
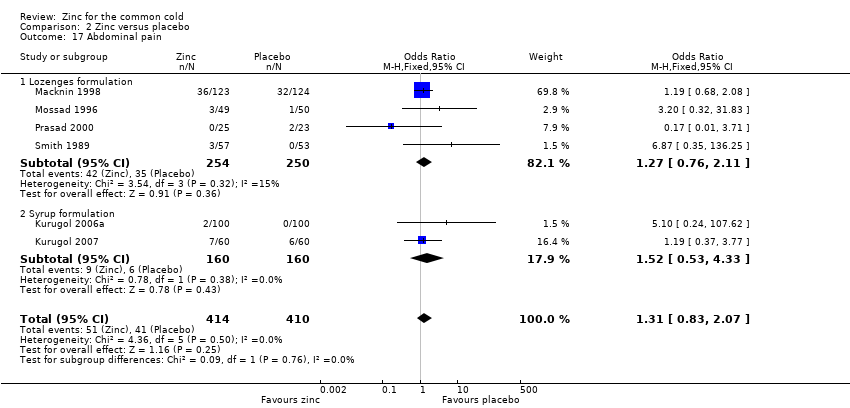
Comparison 2 Zinc versus placebo, Outcome 17 Abdominal pain.
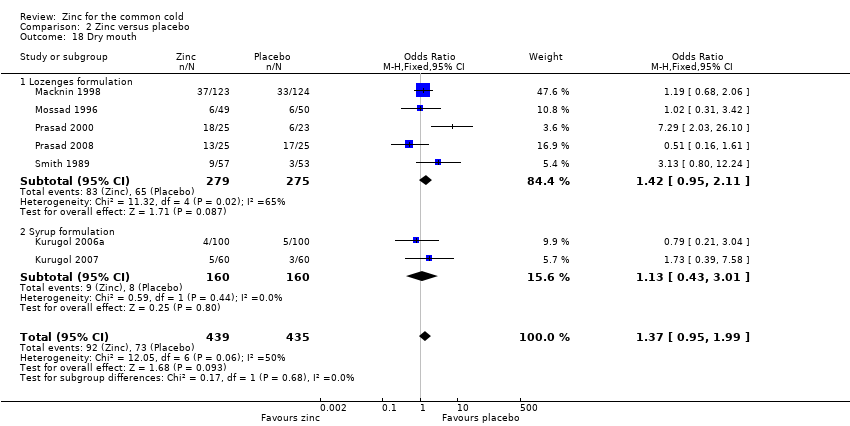
Comparison 2 Zinc versus placebo, Outcome 18 Dry mouth.
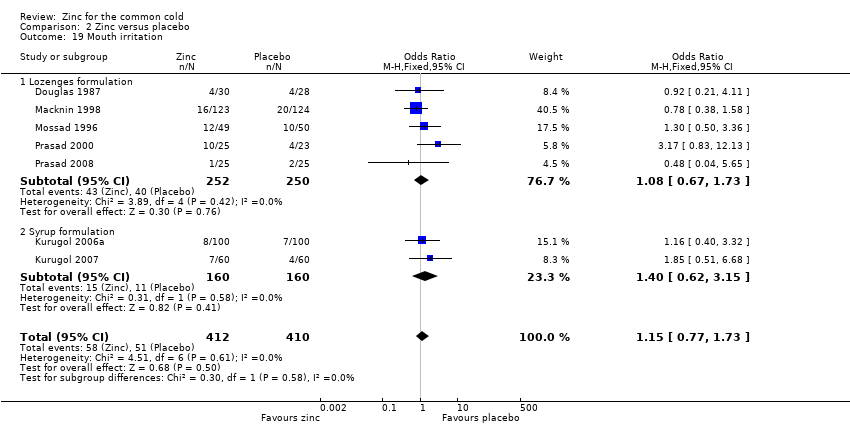
Comparison 2 Zinc versus placebo, Outcome 19 Mouth irritation.
| Zinc compared with placebo for the common cold | ||||||
| Patient or population: patients with common cold Settings: outpatient Intervention: zinc lozenges or syrup Comparison: usual care | ||||||
| Outcomes | Illustrative comparative risks* (95% CI) | Relative effect | No. of participants | Quality of the evidence | Comments | |
| Assumed risk | Corresponding risk | |||||
| Placebo | Zinc | |||||
| Duration of cold symptoms (days) | The mean duration of cold symptoms ranged across control groups from 5.1 to 9.38 days | The mean duration of cold symptoms ranged across control groups from 4 to 12.1 days | 1656 | ++O | ||
| Severity of symptom score | The mean severity of symptom score ranged across control groups from 0.4 to 5.61 | The mean severity of symptom score ranged across control groups from 0.2 to 3.45 | 513 | ++O | ||
| Incidence of common cold | 618 per 1000 | 382 per 1000 (354 to 431) | RR 0.64 (0.47 to 0.88) | 394 | +OO | |
| Number of participants symptomatic after 7 days of treatment | 563 per 1000 | 373 per 1000 (143 to 508) | OR 0.45 (0.2 to 1.0) | 476 | ++OO | |
| School absence (number of days) | The mean days of school absence ranged across control groups from 1.3 to 1.35 days | The mean days of school absence in the intervention groups was 0.37 lower (0.7 to 0.04 lower) | 394 | +OO | ||
| Antibiotic use | 330 per 1000 | 127 per 1000 (52 to 200) | OR 0.27 (0.16 to 0.46) | 394 | ++OO | |
| Any adverse event | 349 per 1000 | 424 per 1000 (132 to 898) | OR 1.58 (1.19 to 2.09) | 1217 | +++O | |
| *The basis for the assumed risk (e.g. the median control group risk across studies) is provided in footnotes. The corresponding risk (and its 95% CI) is based on the assumed risk in the comparison group and the relative effect of the intervention (and its 95% CI). | ||||||
| GRADE Working Group grades of evidence | ||||||
| 1No serious study limitations: all the studies had adequately concealed allocation and blinded both participants and study staff to be considered at low risk of bias. Whether free of other bias was unclear in Macknin 1998; Petrus 1998; Turner 2000a; Turner 2000b; Turner 2000c. Petrus 1998 did not adequately describe the sequence generation. Blinding was inadequate in Turner 2000a; Turner 2000b; Turner 2000c. 2Serious inconsistency: there was high statistical heterogeneity. I2 statistic = 89%. The heterogeneity was due to differences in the nature of the different interventions (zinc gluconate versus acetate lozenges, zinc lozenges versus zinc syrup), wide dose ranges, varied duration of symptoms prior to administration of zinc (varying from 24 to 48 hours) and characteristics of the study population (children versus adults). 3No serious indirectness: studies both from low‐income and high‐income regions have assessed this comparison. Therefore, the result can be confidently generalised to all situations. 4No serious imprecision: though the 95% CI around the pooled effect is narrow, the lower limit does not suggest a clinically important reduction in the duration of cold (a decrease in duration of ≤ 1 day is not shown to be important to patients). 5Publication bias cannot be ruled out. 6No serious study limitation: all the studies had adequately concealed allocation and blinded both participants and study staff to be considered at low risk of bias. Whether free of other bias was unclear and adequate sequence was not generated in one study (Petrus 1998). 7Serious imprecision: the 95% CI around the pooled effect is wide, the lower limit is crossing the point of no effect. 8Serious inconsistency: there was high statistical heterogeneity. I2 statistic = 84%. The heterogeneity may be due to differences in the nature of the different interventions (zinc gluconate or acetate lozenges, zinc sulphate syrup) and dose range (30 to 160 mg/day) as well as mean duration of symptoms prior to administration of zinc (varying from 24 to 48 hours), as well as the characteristics of the study population (children versus adults). However, subgroup analysis was not possible as there were not enough studies for each variable. 9Kurugol 2006b is a community‐based intervention including 200 healthy school children and studying the effect of daily administration of 15 mg zinc sulphate syrup over a period of seven months. Vakili 2009 is also a community‐based intervention including 200 healthy school children and studying the effect of daily administration of 10 mg zinc sulfate tablets over a period of seven months. 10Serious study limitation: though the study by Kurugol 2006b was of high quality, that by Vakili 2009 was of poor methodological quality. 11Serious inconsistency: there is substantial heterogeneity between the two trials: I2 statistic for heterogeneity = 88%. Both trials showed a benefit with zinc, however the size of this effect was much larger in Vakili 2009. The heterogeneity was due to differences in the trial methodology and the nature of the interventions. 12No serious imprecision: the 95% CI around the pooled effect is narrow. Even the lower limit suggests a clinically important reduction in the incidence rate ratio of cold which is shown to be important to patients. 13No serious study limitations: allocation concealment was unclear in two studies, i.e. Smith 1989 and Weismann 1990, though both the studies blinded both participants and study staff. 14Serious inconsistency: there was high statistical heterogeneity. I2 statistic = 75%. The heterogeneity may be due to differences in the nature of the different interventions (zinc gluconate or acetate lozenges) and dose range (30 to 160 mg/day) as well as mean duration of symptoms prior to administration of zinc (varying from 24 to 48 hours, as well as the characteristics of the study population (children versus adults). However, subgroup analysis was not possible as there were not enough studies for each variable. 15Serious indirectness: only studies from high‐income regions have assessed this comparison. Therefore, the result cannot be generalised to all situations. 16No serious imprecision: both limits of the 95% CI suggest a clinically important reduction in proportion of participants given the intervention symptomatic after seven days of treatment. 17Serious inconsistency: there is substantial heterogeneity between the two trials: I2 statistic test for heterogeneity = 64%. Both trials showed reduced days of school absence with intervention, however, the size of this effect was much larger in Kurugol 2006b. The heterogeneity was due to differences in the trial methodology and the nature of the interventions. 18No serious imprecision: though the 95% CI around the pooled effect is narrow, the lower limit does not suggests a clinically important reduction in the duration of school absence (a decrease in duration of ≤ 1 day is not shown to be important to patients). 19No serious inconsistency: there was no statistical heterogeneity. I2 statistic = 0%. 20No serious imprecision: both limits of the 95% CI suggest a clinically important reduction in the rate of antibiotic use with intervention. 21No serious study limitations: all the studies had adequately concealed allocation (except Weismann 1990, in which allocation concealment is unclear) and blinded both participants and study staff to be considered at low risk of bias. Whether free of other bias was unclear in Macknin 1998 and Weismann 1990. Weismann 1990 did not adequately describe the sequence generation. 22No serious inconsistency: there is no statistical heterogeneity. I2 statistic = 21%. Both the lozenges and syrup preparation trials were pooled. 23No serious imprecision: the 95% CI around the pooled effect is narrow. The resulting adverse events from use of zinc are higher and this is significant. | ||||||
| Outcome or subgroup title | No. of studies | No. of participants | Statistical method | Effect size |
| 1 Duration of cold symptoms Show forest plot | 14 | 1656 | Mean Difference (IV, Random, 95% CI) | ‐1.03 [‐1.72, ‐0.34] |
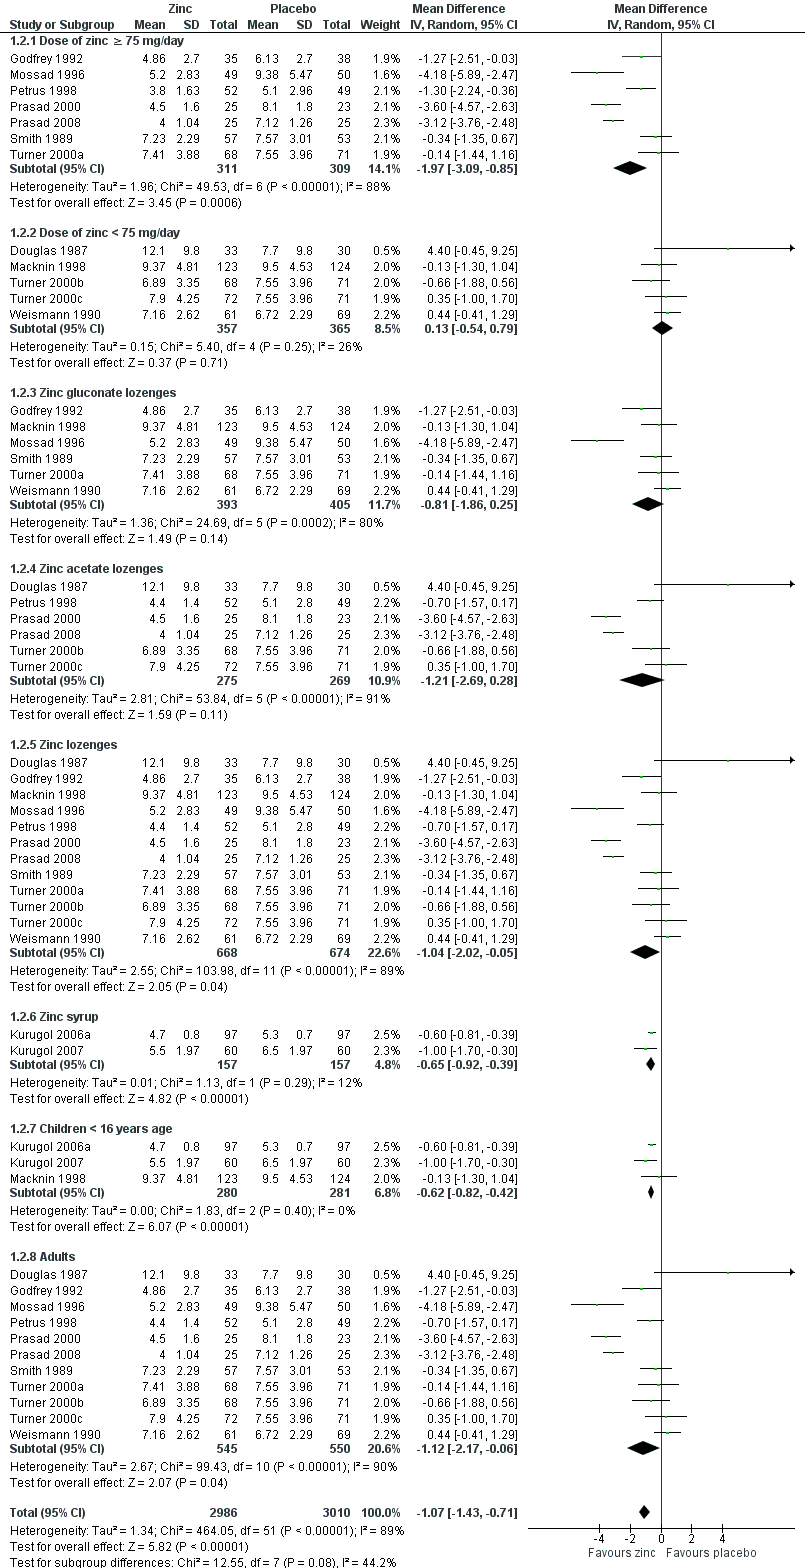
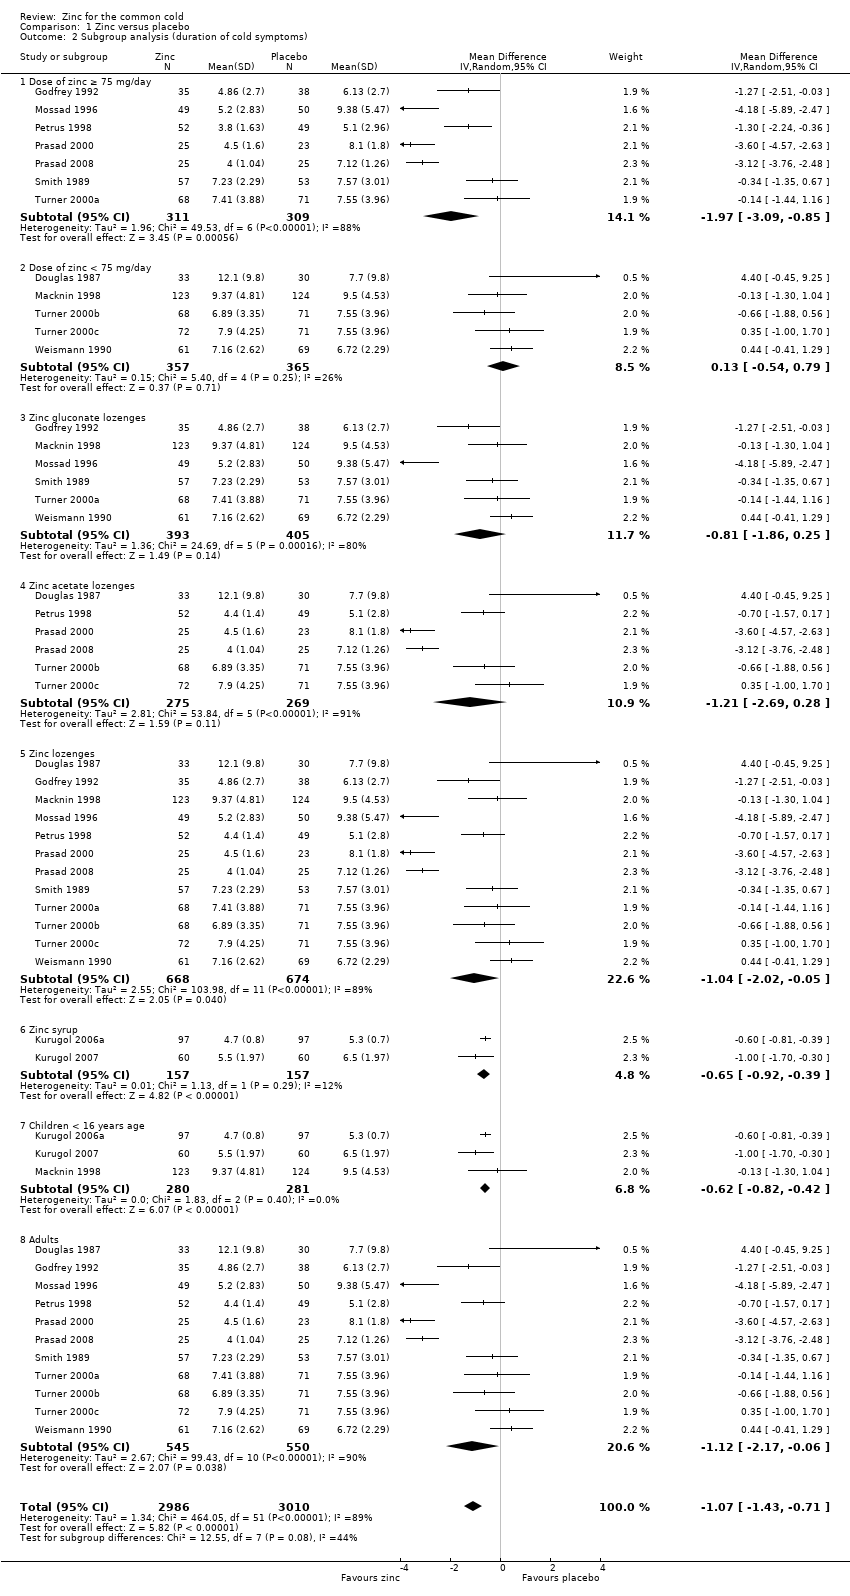
| 2 Subgroup analysis (duration of cold symptoms) Show forest plot | 14 | 5996 | Mean Difference (IV, Random, 95% CI) | ‐1.07 [‐1.43, ‐0.71] |
| 2.1 Dose of zinc ≥ 75 mg/day | 7 | 620 | Mean Difference (IV, Random, 95% CI) | ‐1.97 [‐3.09, ‐0.85] |
| 2.2 Dose of zinc < 75 mg/day | 5 | 722 | Mean Difference (IV, Random, 95% CI) | 0.13 [‐0.54, 0.79] |
| 2.3 Zinc gluconate lozenges | 6 | 798 | Mean Difference (IV, Random, 95% CI) | ‐0.81 [‐1.86, 0.25] |
| 2.4 Zinc acetate lozenges | 6 | 544 | Mean Difference (IV, Random, 95% CI) | ‐1.21 [‐2.69, 0.28] |
| 2.5 Zinc lozenges | 12 | 1342 | Mean Difference (IV, Random, 95% CI) | ‐1.04 [‐2.02, ‐0.05] |
| 2.6 Zinc syrup | 2 | 314 | Mean Difference (IV, Random, 95% CI) | ‐0.65 [‐0.92, ‐0.39] |
| 2.7 Children < 16 years age | 3 | 561 | Mean Difference (IV, Random, 95% CI) | ‐0.62 [‐0.82, ‐0.42] |
| 2.8 Adults | 11 | 1095 | Mean Difference (IV, Random, 95% CI) | ‐1.12 [‐2.17, ‐0.06] |
| 3 Severity of cold symptoms Show forest plot | 5 | 513 | Mean Difference (IV, Random, 95% CI) | ‐1.06 [‐2.36, 0.23] |
| 4 Subgroup analysis (severity of cold symptoms) Show forest plot | 5 | 513 | Mean Difference (IV, Random, 95% CI) | ‐1.06 [‐2.36, 0.23] |
| 4.1 Zinc lozenges | 3 | 199 | Mean Difference (IV, Random, 95% CI) | ‐1.55 [‐3.62, 0.52] |
| 4.2 Zinc syrup | 2 | 314 | Mean Difference (IV, Random, 95% CI) | ‐0.27 [‐1.51, 0.97] |
| 5 Incidence of common cold Show forest plot | 2 | 1522 | Risk Ratio (M‐H, Random, 95% CI) | 0.64 [0.47, 0.88] |
| Outcome or subgroup title | No. of studies | No. of participants | Statistical method | Effect size |
| 1 Number of participants symptomatic after 3 days of treatment Show forest plot | 3 | 340 | Odds Ratio (M‐H, Random, 95% CI) | 0.81 [0.27, 2.42] |
| 2 Number of participants symptomatic after 5 days of treatment Show forest plot | 3 | 340 | Odds Ratio (M‐H, Random, 95% CI) | 0.78 [0.32, 1.95] |
| 3 Number of participants symptomatic after 7 days of treatment Show forest plot | 5 | 476 | Odds Ratio (M‐H, Random, 95% CI) | 0.45 [0.20, 1.00] |
| 4 Time to resolution of cough Show forest plot | 4 | 453 | Mean Difference (IV, Random, 95% CI) | ‐1.73 [‐3.49, 0.03] |
| 5 Time to resolution of nasal congestion Show forest plot | 5 | 605 | Mean Difference (IV, Random, 95% CI) | ‐0.70 [‐1.39, ‐0.01] |
| 6 Time to resolution of nasal drainage Show forest plot | 5 | 599 | Mean Difference (IV, Random, 95% CI) | ‐1.01 [‐2.01, ‐0.01] |
| 7 Time to resolution of sore throat Show forest plot | 4 | 430 | Mean Difference (IV, Fixed, 95% CI) | ‐0.46 [‐0.82, ‐0.09] |
| 8 Change in cough symptom score Show forest plot | 1 | 101 | Mean Difference (IV, Fixed, 95% CI) | ‐0.23 [‐0.26, ‐0.20] |
| 9 Change in nasal symptom score Show forest plot | 2 | 314 | Mean Difference (IV, Fixed, 95% CI) | ‐0.20 [‐1.34, 0.94] |
| 10 School absence (days) Show forest plot | 2 | 394 | Mean Difference (IV, Fixed, 95% CI) | ‐0.66 [‐0.99, ‐0.33] |
| 11 Antibiotic use Show forest plot | 2 | 394 | Odds Ratio (M‐H, Fixed, 95% CI) | 0.27 [0.16, 0.46] |
| 12 Any adverse event Show forest plot | 8 | 1217 | Odds Ratio (M‐H, Fixed, 95% CI) | 1.58 [1.19, 2.09] |
| 12.1 Lozenge formulation | 6 | 897 | Odds Ratio (M‐H, Fixed, 95% CI) | 2.00 [1.40, 2.86] |
| 12.2 Syrup formulation | 2 | 320 | Odds Ratio (M‐H, Fixed, 95% CI) | 1.03 [0.64, 1.66] |
| 13 Bad taste Show forest plot | 12 | 1483 | Odds Ratio (M‐H, Fixed, 95% CI) | 2.31 [1.71, 3.11] |
| 13.1 Lozenges formulation | 10 | 1163 | Odds Ratio (M‐H, Fixed, 95% CI) | 2.66 [1.91, 3.69] |
| 13.2 Syrup formulation | 2 | 320 | Odds Ratio (M‐H, Fixed, 95% CI) | 1.15 [0.55, 2.39] |
| 14 Nausea Show forest plot | 8 | 932 | Odds Ratio (M‐H, Fixed, 95% CI) | 2.15 [1.44, 3.23] |
| 14.1 Lozenges formulation | 6 | 612 | Odds Ratio (M‐H, Fixed, 95% CI) | 2.46 [1.56, 3.89] |
| 14.2 Syrup formulation | 2 | 320 | Odds Ratio (M‐H, Fixed, 95% CI) | 1.24 [0.50, 3.08] |
| 15 Constipation Show forest plot | 7 | 874 | Odds Ratio (M‐H, Fixed, 95% CI) | 1.60 [0.82, 3.10] |
| 15.1 Lozenges formulation | 5 | 554 | Odds Ratio (M‐H, Fixed, 95% CI) | 2.00 [0.88, 4.55] |
| 15.2 Syrup formulation | 2 | 320 | Odds Ratio (M‐H, Fixed, 95% CI) | 1.0 [0.31, 3.21] |
| 16 Diarrhoea Show forest plot | 6 | 764 | Odds Ratio (M‐H, Fixed, 95% CI) | 1.89 [0.92, 3.89] |
| 16.1 Lozenges formulation | 4 | 444 | Odds Ratio (M‐H, Fixed, 95% CI) | 2.09 [0.92, 4.75] |
| 16.2 Syrup formulation | 2 | 320 | Odds Ratio (M‐H, Fixed, 95% CI) | 1.34 [0.30, 6.09] |
| 17 Abdominal pain Show forest plot | 6 | 824 | Odds Ratio (M‐H, Fixed, 95% CI) | 1.31 [0.83, 2.07] |
| 17.1 Lozenges formulation | 4 | 504 | Odds Ratio (M‐H, Fixed, 95% CI) | 1.27 [0.76, 2.11] |
| 17.2 Syrup formulation | 2 | 320 | Odds Ratio (M‐H, Fixed, 95% CI) | 1.52 [0.53, 4.33] |
| 18 Dry mouth Show forest plot | 7 | 874 | Odds Ratio (M‐H, Fixed, 95% CI) | 1.37 [0.95, 1.99] |
| 18.1 Lozenges formulation | 5 | 554 | Odds Ratio (M‐H, Fixed, 95% CI) | 1.42 [0.95, 2.11] |
| 18.2 Syrup formulation | 2 | 320 | Odds Ratio (M‐H, Fixed, 95% CI) | 1.13 [0.43, 3.01] |
| 19 Mouth irritation Show forest plot | 7 | 822 | Odds Ratio (M‐H, Fixed, 95% CI) | 1.15 [0.77, 1.73] |
| 19.1 Lozenges formulation | 5 | 502 | Odds Ratio (M‐H, Fixed, 95% CI) | 1.08 [0.67, 1.73] |
| 19.2 Syrup formulation | 2 | 320 | Odds Ratio (M‐H, Fixed, 95% CI) | 1.40 [0.62, 3.15] |