| 1 Number of participants symptomatic after 3 days of treatment Show forest plot | 3 | 340 | Odds Ratio (M‐H, Random, 95% CI) | 0.81 [0.27, 2.42] |
|
| 2 Number of participants symptomatic after 5 days of treatment Show forest plot | 3 | 340 | Odds Ratio (M‐H, Random, 95% CI) | 0.78 [0.32, 1.95] |
|
| 3 Number of participants symptomatic after 7 days of treatment Show forest plot | 5 | 476 | Odds Ratio (M‐H, Random, 95% CI) | 0.45 [0.20, 1.00] |
|
| 4 Time to resolution of cough Show forest plot | 4 | 453 | Std. Mean Difference (IV, Random, 95% CI) | ‐0.55 [‐1.04, ‐0.05] |
|
| 5 Time to resolution of nasal congestion Show forest plot | 5 | 605 | Std. Mean Difference (IV, Fixed, 95% CI) | ‐0.25 [‐0.41, ‐0.09] |
|
| 6 Time to resolution of nasal drainage Show forest plot | 5 | 599 | Std. Mean Difference (IV, Random, 95% CI) | ‐0.32 [‐0.62, ‐0.01] |
|
| 7 Time to resolution of sore throat Show forest plot | 4 | 430 | Std. Mean Difference (IV, Fixed, 95% CI) | ‐0.24 [‐0.44, ‐0.03] |
|
| 8 Change in cough symptom score Show forest plot | 1 | 101 | Std. Mean Difference (IV, Fixed, 95% CI) | ‐2.84 [‐3.40, ‐2.28] |
|
| 9 Change in nasal symptom score Show forest plot | 2 | 314 | Std. Mean Difference (IV, Fixed, 95% CI) | ‐0.06 [‐0.42, 0.30] |
|
| 10 School absenteeism (days) Show forest plot | 2 | 394 | Std. Mean Difference (IV, Random, 95% CI) | ‐0.37 [‐0.70, ‐0.04] |
|
| 11 Antibiotic use Show forest plot | 2 | 394 | Odds Ratio (M‐H, Fixed, 95% CI) | 0.27 [0.16, 0.46] |
|
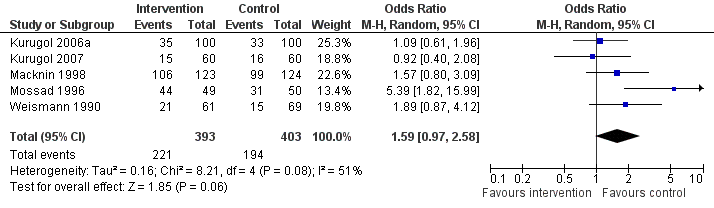
| 12 Any adverse event Show forest plot | 5 | 796 | Odds Ratio (M‐H, Random, 95% CI) | 1.59 [0.97, 2.58] |
|
| 13 Bad taste Show forest plot | 9 | 1062 | Odds Ratio (M‐H, Fixed, 95% CI) | 2.64 [1.91, 3.64] |
|
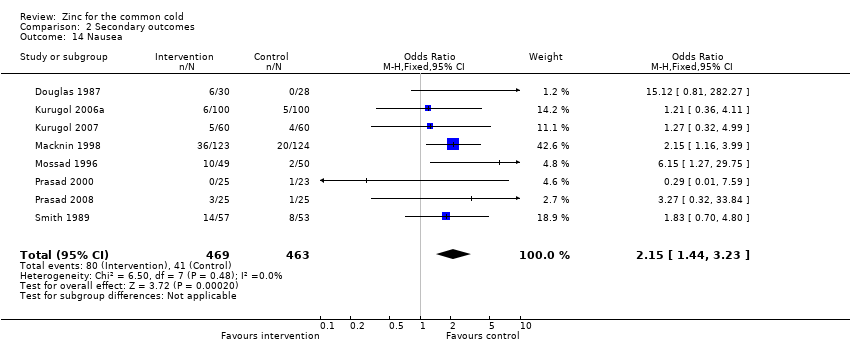
| 14 Nausea Show forest plot | 8 | 932 | Odds Ratio (M‐H, Fixed, 95% CI) | 2.15 [1.44, 3.23] |
|
| 15 Constipation Show forest plot | 7 | 874 | Odds Ratio (M‐H, Fixed, 95% CI) | 1.60 [0.82, 3.10] |
|
| 16 Diarrhoea Show forest plot | 6 | 764 | Odds Ratio (M‐H, Fixed, 95% CI) | 1.89 [0.92, 3.89] |
|
| 17 Abdominal pain Show forest plot | 6 | 824 | Odds Ratio (M‐H, Fixed, 95% CI) | 1.31 [0.83, 2.07] |
|
| 18 Dry mouth Show forest plot | 7 | 874 | Odds Ratio (M‐H, Fixed, 95% CI) | 1.37 [0.95, 1.99] |
|
| 19 Mouth irritation Show forest plot | 7 | 822 | Odds Ratio (M‐H, Fixed, 95% CI) | 1.15 [0.77, 1.73] |
|