Scolaris Content Display Scolaris Content Display

Methodological quality summary: review authors' judgements about each methodological quality item for each included study.
Figuras y tablas -
Figure 1

Methodological quality summary: review authors' judgements about each methodological quality item for each included study.

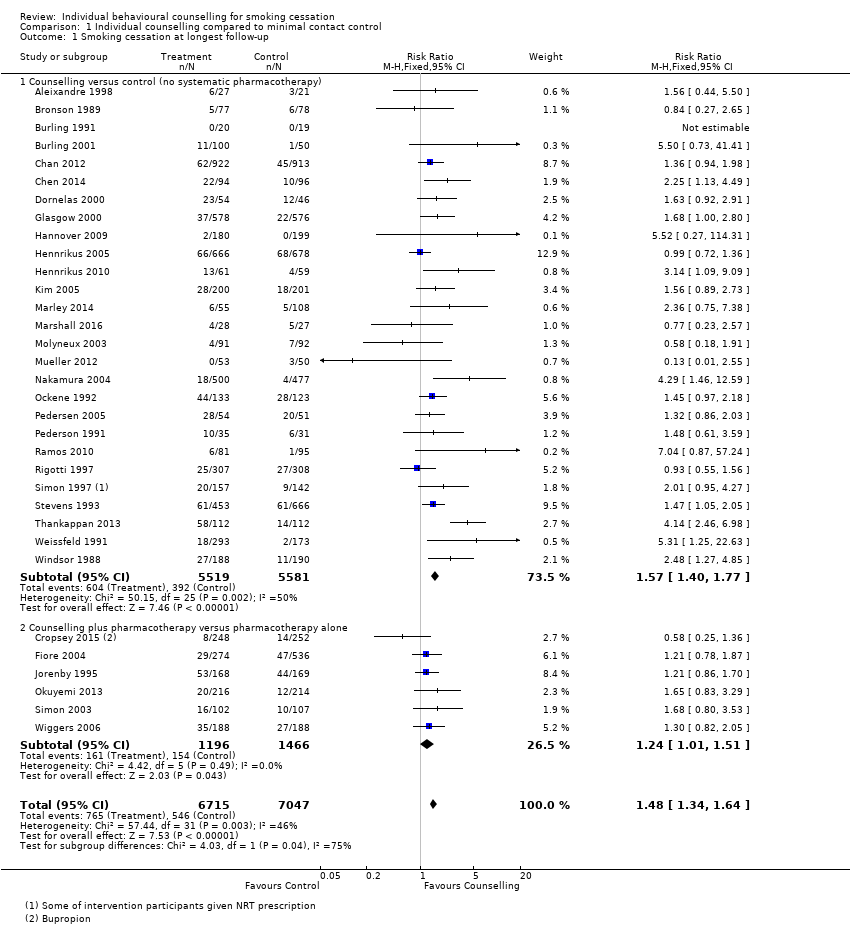
Forest plot of comparison: 1 Individual counselling compared to minimal contact control, outcome: 1.1 Smoking cessation at longest follow‐up.
Figuras y tablas -
Figure 2

Forest plot of comparison: 1 Individual counselling compared to minimal contact control, outcome: 1.1 Smoking cessation at longest follow‐up.

Comparison 1 Individual counselling compared to minimal contact control, Outcome 1 Smoking cessation at longest follow‐up.
Figuras y tablas -
Analysis 1.1

Comparison 1 Individual counselling compared to minimal contact control, Outcome 1 Smoking cessation at longest follow‐up.

Comparison 2 More intensive versus less intensive counselling, Outcome 1 Smoking cessation at longest follow‐up.
Figuras y tablas -
Analysis 2.1

Comparison 2 More intensive versus less intensive counselling, Outcome 1 Smoking cessation at longest follow‐up.

Comparison 3 Comparisons between counselling approaches of similar intensity, Outcome 1 Smoking cessation at longest follow‐up.
Figuras y tablas -
Analysis 3.1

Comparison 3 Comparisons between counselling approaches of similar intensity, Outcome 1 Smoking cessation at longest follow‐up.

Summary of findings for the main comparison. Individual counselling compared to minimal contact control for smoking cessation

Patient or population: People who smoke
Setting: Healthcare and community settings
Intervention: Individual counselling from a smoking cessation counsellor including at least one face‐to‐face session lasting 10 minutes or more
Comparison: Minimal‐contact control (usual care, brief advice or self‐help materials)

Outcomes

Anticipated absolute effects* (95% CI)

Relative effect
(95% CI)

№ of participants
(studies)

Quality of the evidence
(GRADE)

Comments

Numbers quit in control condition

Numbers quit after individual counselling

Smoking cessation at longest follow‐up ‐ 6 months or more

No systematic pharmacotherapy

Study population

RR 1.57
(1.40 to 1.77)

11,100
(27 RCTs)

⊕⊕⊕⊕
HIGH

Limiting to studies at low risk of bias on all assessed domains marginally increases estimate of effect

7 per 100

11 per 100
(10 to 12)

Smoking cessation at longest follow‐up ‐ 6 months or more

Pharmacotherapy offered to all participants

Study population

RR 1.24
(1.01 to 1.51)

2662
(6 RCTs)

⊕⊕⊕⊝
MODERATE 1

Higher control group quit rate reflecting use of pharmacotherapy

11 per 100

13 per 100
(11 to 16)

*The risk in the intervention group (and its 95% confidence interval) is based on the assumed risk in the comparison group and the relative effect of the intervention (and its 95% CI).

CI: Confidence interval; RR: Risk ratio

GRADE Working Group grades of evidence
High quality: We are very confident that the true effect lies close to that of the estimate of the effect
Moderate quality: We are moderately confident in the effect estimate: The true effect is likely to be close to the estimate of the effect, but there is a possibility that it is substantially different
Low quality: Our confidence in the effect estimate is limited: The true effect may be substantially different from the estimate of the effect
Very low quality: We have very little confidence in the effect estimate: The true effect is likely to be substantially different from the estimate of effect

1Downgraded due to wide confidence intervals.

Figuras y tablas -
Summary of findings for the main comparison. Individual counselling compared to minimal contact control for smoking cessation
Summary of findings 2. More intensive compared to less intensive counselling for smoking cessation

More intensive compared to less intensive counselling for smoking cessation

Patient or population: People who smoke
Setting: Healthcare and community settings
Intervention: More intensive individual counselling (± pharmacotherapy)
Comparison: Individual counselling (± pharmacotherapy)

Outcomes

Anticipated absolute effects* (95% CI)

Relative effect
(95% CI)

№ of participants
(studies)

Quality of the evidence
(GRADE)

Comments

Numbers quit with less intensive counselling

Numbers quit with more intensive counselling

Smoking cessation at longest follow‐up

Without pharmacotherapy

RR 1.29
(1.09 to 1.53)

2920
(11 RCTs)

⊕⊕⊕⊕
HIGH

Effect estimates for subgroups of studies with and without pharmacotherapy for all participants overlapped, so the overall pooled estimate is used with alternative control group estimates from subgroups

9 per 100 1

12 per 100
(10 to 14)

With pharmacotherapy

14 per 100 2

18 per 100
(15 to 21)

*The risk in the intervention group (and its 95% confidence interval) is based on the assumed risk in the comparison group and the relative effect of the intervention (and its 95% CI).

CI: Confidence interval; RR: Risk ratio; OR: Odds ratio;

GRADE Working Group grades of evidence
High quality: We are very confident that the true effect lies close to that of the estimate of the effect
Moderate quality: We are moderately confident in the effect estimate: The true effect is likely to be close to the estimate of the effect, but there is a possibility that it is substantially different
Low quality: Our confidence in the effect estimate is limited: The true effect may be substantially different from the estimate of the effect
Very low quality: We have very little confidence in the effect estimate: The true effect is likely to be substantially different from the estimate of effect

1Based on average in studies without pharmacotherapy.

2Based on average in studies with pharmacotherapy.

Figuras y tablas -
Summary of findings 2. More intensive compared to less intensive counselling for smoking cessation
Comparison 1. Individual counselling compared to minimal contact control

Outcome or subgroup title

No. of studies

No. of participants

Statistical method

Effect size

1 Smoking cessation at longest follow‐up Show forest plot

33

13762

Risk Ratio (M‐H, Fixed, 95% CI)

1.48 [1.34, 1.64]

1.1 Counselling versus control (no systematic pharmacotherapy)

27

11100

Risk Ratio (M‐H, Fixed, 95% CI)

1.57 [1.40, 1.77]

1.2 Counselling plus pharmacotherapy versus pharmacotherapy alone

6

2662

Risk Ratio (M‐H, Fixed, 95% CI)

1.24 [1.01, 1.51]

Figuras y tablas -
Comparison 1. Individual counselling compared to minimal contact control
Comparison 2. More intensive versus less intensive counselling

Outcome or subgroup title

No. of studies

No. of participants

Statistical method

Effect size

1 Smoking cessation at longest follow‐up Show forest plot

11

2920

Risk Ratio (M‐H, Fixed, 95% CI)

1.29 [1.09, 1.53]

1.1 No pharmacotherapy

4

872

Risk Ratio (M‐H, Fixed, 95% CI)

1.42 [0.98, 2.06]

1.2 Adjunct to pharmacotherapy

8

2048

Risk Ratio (M‐H, Fixed, 95% CI)

1.26 [1.04, 1.52]

Figuras y tablas -
Comparison 2. More intensive versus less intensive counselling
Comparison 3. Comparisons between counselling approaches of similar intensity

Outcome or subgroup title

No. of studies

No. of participants

Statistical method

Effect size

1 Smoking cessation at longest follow‐up Show forest plot

5

Risk Ratio (M‐H, Fixed, 95% CI)

Totals not selected

1.1 Relapse prevention versus health belief model

1

Risk Ratio (M‐H, Fixed, 95% CI)

0.0 [0.0, 0.0]

1.2 Motivational interviewing versus health education

1

Risk Ratio (M‐H, Fixed, 95% CI)

0.0 [0.0, 0.0]

1.3 Counselling versus equal sessions of psychoeducation

1

Risk Ratio (M‐H, Fixed, 95% CI)

0.0 [0.0, 0.0]

1.4 Front‐loaded versus weekly counselling

1

Risk Ratio (M‐H, Fixed, 95% CI)

0.0 [0.0, 0.0]

1.5 Face‐to‐face versus telephone counselling

1

Risk Ratio (M‐H, Fixed, 95% CI)

0.0 [0.0, 0.0]

Figuras y tablas -
Comparison 3. Comparisons between counselling approaches of similar intensity