Profesionales de enfermería como reemplazantes de los médicos en la atención primaria
Resumen
Antecedentes
Los problemas actuales y esperados como el envejecimiento, el aumento de la prevalencia de las afecciones crónicas y la multimorbilidad, el aumento en el énfasis en el estilo de vida sano y la prevención, y el reemplazo de la atención proporcionada en los hospitales por la atención brindada en la comunidad, alientan a los países en todo el mundo a desarrollar nuevos modelos de prestación de atención primaria. Dado que muchas tareas no requieren necesariamente el conocimiento y las habilidades de un médico, ha aumentado el interés en utilizar a los profesionales de enfermería para ampliar la capacidad del personal de atención primaria. El reemplazo de los médicos por profesionales de enfermería es una estrategia utilizada para mejorar el acceso, la eficiencia y la calidad de la atención. Ésta es la primera actualización de la revisión Cochrane publicada en 2005.
Objetivos
El objetivo fue investigar la repercusión de los profesionales de enfermería que trabajan como reemplazantes de los médicos de atención primaria en:
• resultados de los pacientes;
• proceso de atención; y
• utilización, incluido el volumen y el coste.
Métodos de búsqueda
Se hicieron búsquedas en el Registro Cochrane Central de Ensayos Controlados (Cochrane Central Register of Controlled Trials) (CENTRAL), parte de la Biblioteca Cochrane (www.cochranelibrary.com), y también en MEDLINE, Ovid y en Cumulative Index to Nursing and Allied Health Literature (CINAHL) y EbscoHost (búsqueda 20 de enero de 2015). Se hicieron búsquedas de literatura gris en Grey Literature Report y OpenGrey (21 de febrero de 2017), y se buscó en la International Clinical Trials Registry Platform (ICTRP) y en los ClinicalTrials.gov trial registries (21 de febrero de 2017). Se hizo una búsqueda de referencias de citas de los estudios relevantes (búsqueda el 27 de enero de 2015) y se verificaron las listas de referencias de todos los estudios incluidos. Se volvieron a aplicar estrategias ligeramente revisadas, limitadas a años de publicación entre 2015 y 2017, para CENTRAL, MEDLINE y CINAHL, en marzo de 2017, y se ha agregado un ensayo a "Estudios en espera de clasificación".
Criterios de selección
Ensayos aleatorios que evaluaron los resultados de los profesionales de enfermería como reemplazantes de los médicos. La revisión se limita a los servicios de asistencia sanitaria primaria que proporcionan el primer contacto y atención en curso a los pacientes con cualquier tipo de problema de salud, con la exclusión de los problemas de salud mental. Se excluyeron los estudios que evaluaron el reemplazo del trabajo de los médicos de la atención primaria por profesionales de enfermería.
Obtención y análisis de los datos
Dos autores de la revisión, de forma independiente, realizaron la extracción de los datos y la evaluación del riesgo de sesgo de los estudios incluidos. Cuando fue factible, se combinaron los resultados de los estudios y se determinó una estimación general del efecto. Se completó una síntesis estructurada para evaluar otros resultados.
Resultados principales
Para esta revisión, se identificaron 18 ensayos aleatorios que evaluaron el impacto de las enfermeras que trabajan como sustitutas de los médicos. Se realizó un estudio en un país de ingresos medios y todos los demás estudios en países de altos ingresos. A menudo el nivel de los profesionales de enfermería fue poco claro o varió entre, e incluso dentro de, los estudios. Los estudios examinaron a los profesionales de enfermería involucrados en la atención de primer contacto (incluida la atención urgente), la atención en curso por molestias físicas y el seguimiento de los pacientes con afecciones crónicas particulares, como la diabetes. En muchos de los estudios los profesionales de enfermería podrían recibir apoyo o consejo adicional de un médico. Existen menos estudios sobre el reemplazo de médicos por profesionales de enfermería en los servicios de prevención y en la educación en salud de la atención primaria.
Los hallazgos de los estudios indican que la asistencia proporcionada por los profesionales de enfermería, comparada con la asistencia proporcionada por los médicos, probablemente da lugar a resultados de salud similares o mejores para una amplia variedad de afecciones de los pacientes (evidencia de certeza baja o moderada):
• La atención primaria dirigida por un profesional de enfermería puede dar lugar a levemente menos muertes entre ciertos grupos de pacientes, en comparación con la atención dirigida por un médico. Sin embargo, los resultados son variables y es posible que la atención primaria dirigida por un profesional de enfermería logre poco o ningún cambio en el número de muertes (evidencia de certeza baja).
• Es probable que los resultados de la presión arterial mejoren levemente con la atención primaria dirigida por un profesional de enfermería. Otros resultados del estado clínico o de la salud son probablemente similares (evidencia de certeza moderada).
• Es probable que la satisfacción de los pacientes sea levemente mayor con la atención primaria dirigida por un profesional de enfermería (evidencia de certeza moderada). La calidad de vida puede ser levemente mayor (evidencia de certeza baja).
No existe certeza acerca de los efectos de la atención dirigida por un profesional de enfermería sobre el proceso de atención porque la certeza de esta evidencia se evaluó como muy baja.
El efecto de la atención dirigida por un profesional de enfermería sobre el uso de la atención es mixto y depende del tipo de resultado. Las consultas son probablemente más largas en la atención primaria dirigida por un profesional de enfermería (evidencia de certeza moderada), y el número de asistencias a nuevas visitas es levemente mayor para los profesionales de enfermería que para los médicos (evidencia de certeza alta). Se encontró poca o ninguna diferencia entre los profesionales de enfermería y los médicos en cuanto al número de prescripciones y la asistencia a las unidades de accidentes y urgencias (evidencia de certeza alta). Puede haber poca o ninguna diferencia en el número de pruebas e investigaciones, derivaciones a hospitales e ingresos hospitalarios en los profesionales de enfermería y los médicos (evidencia de certeza baja).
No existe certeza acerca de los efectos de la atención dirigida por un profesional de enfermería sobre los costes de la atención porque la certeza de esta evidencia se evaluó como muy baja.
Conclusiones de los autores
Esta revisión indica que para algunas molestias físicas en curso y urgentes y para las afecciones crónicas, los profesionales de enfermería adiestrados como los especializados, los practicantes y los titulados, probablemente proporcionan similar o mejor calidad de atención en comparación con los médicos de atención primaria, y probablemente logran similares o mejores resultados de salud para los pacientes. Los profesionales de enfermería probablemente logran niveles más altos de satisfacción de los pacientes, comparados con los médicos de atención primaria. Además, la duración de la consulta es probablemente mayor cuando los profesionales de enfermería proporcionan la atención y la frecuencia de asistencia a nuevas visitas es probablemente algo mayor para los profesionales de enfermería, en comparación con los médicos. Otros resultados de utilización de recursos son probablemente similares. Los efectos de la atención dirigida por un profesional de enfermería sobre el proceso de atención y los costes de la atención son poco claros, y tampoco fue posible evaluar qué nivel educacional de los profesionales de enfermería da lugar a mejores resultados cuando los profesionales de enfermería reemplazan a los médicos.
PICO
Resumen en términos sencillos
Profesionales de enfermería como reemplazantes de los médicos en la atención primaria
¿Cuál es el objetivo de esta revisión?
El objetivo de esta revisión Cochrane fue determinar lo que sucede cuando los profesionales de enfermería proporcionan los servicios de asistencia sanitaria primaria, en lugar de los médicos. Se recopilaron y analizaron todos los estudios relevantes para responder a esta cuestión y se encontraron 18 estudios para la inclusión en la revisión.
¿Cuáles son los mensajes clave de esta revisión?
La provisión de los servicios de asistencia sanitaria primaria por los profesionales de enfermería en lugar de los médicos probablemente da lugar a resultados de salud similares o mejores y a una satisfacción mayor de los pacientes. Los profesionales de enfermería probablemente también atienden a los pacientes durante más tiempo. El uso de los profesionales de enfermería en lugar de los médicos logra poca o ninguna diferencia en el número de prescripciones y pruebas indicadas. Sin embargo, las repercusiones sobre la cantidad de información ofrecida a los pacientes, el grado en el que se siguen las guías y los costes de la asistencia sanitaria son poco claras.
¿Qué se estudió en esta revisión?
En la mayoría de los países, la población envejece y más personas presentan enfermedades crónicas. Lo anterior significa un cambio en los servicios que los trabajadores de la asistencia sanitaria primaria deben proporcionar. Al mismo tiempo, muchos países carecen de médicos y de otros trabajadores de la asistencia sanitaria, o los pacientes se esfuerzan para pagar los servicios de asistencia sanitaria. Al utilizar profesionales de enfermería en lugar de médicos, los países esperan proporcionar asistencia de la misma calidad por menos dinero.
En esta revisión se buscaron los estudios que compararon a los profesionales de enfermería con los médicos para la provisión de los servicios de atención primaria. Se examinó si lo anterior dio lugar a algún cambio en la salud de los pacientes, la satisfacción y el uso de los servicios. También se examinó si esta intervención dio lugar a algún cambio con respecto a cómo se proporcionaron los servicios y cuánto costaron.
¿Cuáles son los principales resultados de esta revisión?
Se incluyeron en esta revisión 18 estudios, principalmente de países de altos ingresos. En algunos estudios, los profesionales de enfermería fueron responsables de todos los pacientes que acudieron al consultorio o de todos los pacientes que necesitaron una consulta urgente. En algunos estudios, los profesionales de enfermería se encargaron de los pacientes con enfermedades crónicas particulares, o fueron responsables de proporcionar educación sanitaria o servicios preventivos a ciertos grupos de pacientes. Los estudios incluidos compararon a estos profesionales de enfermería con los médicos que realizaban las mismas tareas.
Esta revisión indica que la atención primaria dirigida por un profesional de enfermería puede dar lugar a levemente menos muertes entre ciertos grupos de pacientes, en comparación con la atención dirigida por un médico. Sin embargo, los resultados varían y es posible que la atención primaria a cargo del profesional de enfermería logre poca o ninguna diferencia en el número de muertes. Además, los pacientes probablemente tienen resultados similares o mejores en áreas de la salud como la cardiopatía, la diabetes, el reumatismo y la hipertensión. También es probable que los pacientes estén levemente más satisfechos con la atención y pueden tener una calidad de vida algo mejor cuando son tratados por profesionales de enfermería.
Esta revisión también indica que, comparados con los médicos, los profesionales de enfermería probablemente atienden durante más tiempo, y que es algo más probable que sus pacientes cumplan con las citas de seguimiento. Los estudios encontraron poca o ninguna diferencia en el número de prescripciones y puede haber poca o ninguna diferencia en el número de pruebas e investigaciones indicadas, o en el uso que hacen los pacientes de otros servicios. Son poco claros los efectos de la atención primaria dirigida por un profesional de enfermería sobre la cantidad de asesoramiento e información suministrados a los pacientes, y sobre si se siguen las guías, ya que la certeza en estos hallazgos es muy baja.
Esta revisión indica que son poco claras las repercusiones sobre los costes de atención de la utilización de profesionales de enfermería en lugar de médicos para proporcionar la asistencia primaria. La certeza de estos hallazgos se evaluó como muy baja.
¿Cuál es el grado de actualización de esta revisión?
Se hicieron búsquedas de estudios que se habían publicado hasta marzo 2017.
Conclusiones de los autores
Summary of findings
| Nurse‐led primary care compared with doctor‐led primary care for patient outcomes, process of care and utilisation | ||||||
| Patient or population: all presenting patients in primary care Settings: UK (n = 6), Netherlands (n = 3), USA (n = 3), Canada (n = 3), Sweden (n = 1), Spain (n = 1), South Africa (n = 1) Intervention: substitution of doctors with nurses for primary care Comparison: routine doctor‐led primary care | ||||||
| Outcomes | Impact | Number of participants | Certainty of the evidence | |||
| Illustrative comparative risks* (95% CI) | Effect estimate | Results in words | ||||
| Assumed risk | Corresponding risk | |||||
| Doctor‐led primary care | Nurse‐led primary care | |||||
| Mortality follow‐up: 0.5 to 48 months Mean = 21 (SD 19) months | 6.29 per 1000 | 4.84 per 1000 (4 to 6) | RR 0.77 (0.57 to 1.03) | Nurse‐led primary care may lead to slightly fewer deaths among certain groups of patients, compared to doctor‐led care. However, the results vary and it is possible that nurse‐led primary care makes little or no difference to the number of deaths. | 36,529 (8)1 | ⊕⊕⊝⊝ a |
| Patient health status follow‐up: 0.2 to 47 months Mean = 14 (SD 12) months | Compared to doctor‐led care, nurse‐led primary care probably slightly improves blood pressure control; probably leads to similar outcomes for diabetes indicators and measures of disease activity and pain in people with rheumatological disorders; may lead to similar outcomes for physical functioning; and leads to similar outcomes for cholesterol | Clinical outcomes (3) Self‐reported measurements (13)2 | ⊕⊕⊕⊝ b | |||
| Satisfaction and preferences follow‐up: 0.5 to 25 months Mean = 12 (SD 10) months | Patient satisfaction is probably slightly higher in nurse‐led primary care compared to doctor‐led primary care. | 16,993 | ⊕⊕⊕⊝ c | |||
| Quality of life follow‐up: 6 to 25 months Mean = 15 (SD 9) months | Quality of life may be slightly higher in nurse‐led primary care compared to doctor‐led primary care. | 16,002 | ⊕⊕⊝⊝d | |||
| Process of care follow‐up: 0.5 to 48 months Mean = 17 (SD 15) months | We are uncertain of the effects of nurse‐led care on process of care because the certainty of this evidence was assessed as very low. | (10)5 | ⊕⊝⊝⊝e Very low | |||
| Utilisation (consultations, prescriptions, tests, investigations, and services) follow‐up: 0.2 to 48 months Mean = 14 (SD 13) months | Consultations: Compared to doctor‐led primary care, consultation length is probably longer in nurse‐led primary care; there may be little or no difference in scheduled return visits; and the number of return visits attended is slightly higher for nurses. Prescriptions, tests and investigations: There is little or no difference between nurses and doctors in the number of prescriptions and may be little or no difference in the number of tests and investigations ordered. Use of other services: There may be little or no difference between nurses and doctors in the likelihood of hospital referrals and hospital admissions; little or no difference in attendance at accident and emergency units. | (16)6 | ⊕⊕⊕⊝ f | |||
| Costs follow‐up: 0.2 to 48 months Mean = 14 (SD 14) months | We are uncertain of the effects of nurse‐led care on the cost of care because the certainty of this evidence was assessed as very low. | (9)7 | ⊕⊝⊝⊝ g | |||
| *The basis for the assumed risk is the mean control group risk across studies for pooled results. The corresponding risk is based on the assumed risk in the comparison group and the relative effect of the intervention (and its 95% CI). aDowngraded by 1 for imprecision owing to a wide confidence interval that includes no effect and downgraded by 1 for clinical heterogeneity as the trials contributing to this estimate are quite varied (some focus on people with specific health issues and others on more generalist primary care attenders). bDowngraded by 1. Outcomes were downgraded by 1 for inconsistency, imprecision, indirectness or high risk of bias. The certainty of the evidence is moderate for all outcomes listed, apart for physical functioning for which the certainty of evidence was low and cholesterol for which the certainty of evidence was high. cDowngraded by 1 for inconsistency. dDowngraded by 1 for imprecision, due to a wide confidence interval that touches on the null, and 1 for inconsistency eNon‐comparable results and therefore downgraded to very low. fDowngraded by 1. Outcomes were downgraded by 1 for inconsistency, imprecision or high risk of bias. gNon‐comparable results (the types of costs assessed varied widely and a range of different approaches were used to value resources and calculate costs) and therefore downgraded to very low. 1Campbell 2014; Hemani 1999; Lattimer 1998; Ndosi 2013; Sanne 2010; Shum 2000; Spitzer 1973; Voogdt‐Pruis 2010. 2Campbell 2014; Chambers 1978; Chan 2009; Dierick‐van Daele 2009; Houweling 2011; Iglesias 2013; Larsson 2014; Lattimer 1998; Lewis 1967; Moher 2001; Mundinger 2000; Sanne 2010; Shum 2000; Spitzer 1973; Venning 2000; Voogdt‐Pruis 2010. 3Campbell 2014; Dierick‐van Daele 2009; Iglesias 2013; Larsson 2014; Mundinger 2000; Shum 2000; Venning 2000. 4Campbell 2014; Chan 2009; Dierick‐van Daele 2009; Houweling 2011; Mundinger 2000; Ndosi 2013. 5Campbell 2014; Dierick‐van Daele 2009; Houweling 2011; Moher 2001; Mundinger 2000; Ndosi 2013; Shum 2000; Spitzer 1973; Venning 2000; Voogdt‐Pruis 2010. 6Campbell 2014; Chan 2009; Dierick‐van Daele 2009; Hemani 1999; Houweling 2011; Iglesias 2013; Larsson 2014; Lattimer 1998; Lewis 1967; Moher 2001; Mundinger 2000; Ndosi 2013; Shum 2000; Spitzer 1973; Venning 2000; Voogdt‐Pruis 2010. 7Campbell 2014; Chambers 1978; Chan 2009; Dierick‐van Daele 2009; Lattimer 1998; Lewis 1967; Ndosi 2013; Spitzer 1973; Venning 2000. *there may be additional data in the Campbell 2014 articles that have not been extracted | ||||||
| GRADE Working Group grades of evidence. †Substantially different = a large enough difference that it might affect a decision. | ||||||
Antecedentes
Descripción de la afección
Hay una amplia gama de problemas existentes y previstos, como el envejecimiento de las poblaciones, el aumento de la prevalencia de las afecciones crónicas y la multimorbilidad, el aumento en el énfasis en el estilo de vida sano y la prevención, y el traslado de los servicios de asistencia sanitaria de los hospitales a las comunidades, que han alentado a los países en todo el mundo a desarrollar nuevos modelos de provisión de la atención primaria (Freund 2015; Roland 2014). Como todas estas tareas no requieren necesariamente del conocimiento y las habilidades de un médico, la utilización de los profesionales de enfermería para ampliar la capacidad del personal de la atención primaria es un tema de gran interés (Kooienga 2015; Maier 2016b). El reemplazo de los médicos por los profesionales de enfermería es una estrategia para mejorar el acceso, la eficiencia y la calidad de la atención (NHS 2016; Perloff 2016), y las funciones avanzadas en la práctica de los profesionales de enfermería son frecuentes en los países de ingresos altos, medios y bajos (Kooienga 2015; Maier 2016b). Sin embargo, existe una amplia variación en la composición de la práctica de la atención primaria, y el mismo profesional podría tener diferentes funciones y autoridad con respecto a la práctica según la legislación, el sistema de asistencia sanitaria y las prácticas locales(Freund 2015; Groenewegen 2015; Laurant 2009). Además, las reformas que se realizan en la actualidad en muchos países con respecto a las barreras reguladoras a la ampliación del alcance de la práctica de los profesionales de enfermería (p.ej. con respecto a la prescripción de fármacos) indican un cambio en los límites entre la medicina y la enfermería (Maier 2016b).
Descripción de la intervención
Los profesionales de enfermería en la atención primaria pueden realizar muchas tareas que tradicionalmente realizan los médicos. Las tareas pueden ser complementarias a las realizadas por los médicos o pueden reemplazar a las realizadas por los médicos. La revisión actual se centra en las tareas en las que los profesionales de enfermería reemplazan a los médicos, lo que significa que proporcionan los mismos servicios que los médicos (Laurant 2009; Rashidian 2013), y se limita a la provisión de atención para los pacientes que presentan una molestia física. Estas tareas pueden incluir el diagnóstico, el tratamiento, la derivación a otros servicios, la promoción de salud, el tratamiento de enfermedades crónicas o el tratamiento de problemas agudos que necesitan una consulta el mismo día. El contacto con los pacientes puede tener lugar en una instrucción primaria de salud o en el domicilio del paciente. Debido a que la comprensión de las personas de lo que es un profesional de enfermería, así como el nivel educacional de los profesionales de enfermería, difieren entre los países (Kooienga 2015; Maier 2016b), en esta revisión se incluyeron todos los profesionales de enfermería titulados que proporcionan atención como reemplazantes de los médicos. Cuando estuvo disponible, se proporcionó información sobre el nivel educacional de los profesionales de enfermería en los estudios incluidos, según el European Qualification Framework (EQF 2016). Además, la revisión intentó incluir estudios de países de ingresos altos, medios y bajos, y se describió la repercusión de este enfoque sobre la heterogeneidad.
De qué manera podría funcionar la intervención
La expectativa es que los profesionales de enfermería que reemplazan a los médicos puedan hacer las siguientes tareas (p.ej. Freund 2015; Kooienga 2015; Newhouse 2011; Rashidian 2013).
-
Mejorar la calidad de los servicios proporcionados en la atención primaria.
-
Aumentar el acceso a los servicios de atención primaria, al aumentar la capacidad.
-
Reducir el volumen de trabajo de los médicos y, por lo tanto, liberarlos de tiempo para que asuman tareas más complejas.
-
Reducir los costes de la atención al disminuir los costes relacionados con los salarios de los profesionales de enfermería y el entrenamiento educacional limitado, que se proporciona de manera más rápida y es menos costosa.
Sin embargo, este último aspecto no se confirmó en una revisión sistemática anterior sobre esta intervención(Martínez‐González 2015c). Es posible ganar en términos de eficiencia de los servicios, si los médicos dejan de proporcionar los servicios que han delegado en los profesionales de enfermería. Lo anterior permite que los médicos se centren en la complejidad del volumen de casos y en utilizar su entrenamiento y experiencia avanzada (Contandriopoulos 2015; Richardson 1999).
Por qué es importante realizar esta revisión
En todo el mundo se han desarrollado funciones avanzadas para la práctica de la enfermería, incluidos los países de ingresos bajos, medios y altos (Freund 2015; Kooienga 2015; Maier 2016b). Las primeras funciones avanzadas de enfermería se desarrollaron en los EE.UU. y Canadá a fines de años sesenta/setenta, en el Reino Unido en los años ochenta y en otros países de ingresos altos a partir de los años noventa (Laurant 2009). Desde el principio, los profesionales de enfermería se han utilizado para proporcionar atención primaria, tradicionalmente en áreas subatendidas y a poblaciones vulnerables. Actualmente, su función se ha ampliado para incluir otros tipos de servicios en la atención primaria(Poghosyan 2012), y este cambio se ha implementado en varios países en todo el mundo (Freund 2015; Kooienga 2015; Maier 2016b).
Los profesionales de enfermería en funciones avanzadas representan una fuente apreciable de personal para aumentar la calidad de la atención, el acceso a la atención (primaria) y, como se argumenta en ocasiones, la eficiencia de la atención, aunque las revisiones recientes no han confirmado las mejorías en la eficiencia (Martínez‐González 2014a; Martínez‐González 2014b; Martínez‐González 2015a; Martínez‐González 2015b; Martínez‐González 2015c). Se considera que la inclusión de los profesionales de enfermería en funciones avanzadas puede asegurar que se cubra de manera adecuada la demanda de los servicios de asistencia sanitaria para tratar las necesidades de los pacientes. Los profesionales y los elaboradores de políticas creen que, para afrontar los retos de la atención primaria, se necesita un personal de la asistencia sanitaria más consistente, que incluye a los médicos y a profesionales de enfermería en funciones avanzadas de enfermería (NHS 2016).
Aunque el interés en la ampliación de las funciones de enfermería y la utilización de los profesionales de enfermería como reemplazantes de los médicos ha aumentado a nivel global, las razones fundamentales de estas iniciativas difieren según el contexto y las circunstancias locales (Savrin 2009). Por ejemplo, la Health Resources and Services Administration de los EE.UU., previendo una escasez de médicos, ha aumentado la cantidad de dinero disponible no solo para el entrenamiento de los médicos, sino también para preparar a los profesionales de enfermería de la atención primaria y a los asistentes médicos para apoyar al personal de la atención primaria (Petterson 2012). Además, organizaciones como la Organización Mundial de la Salud (OMS) han hecho varias recomendaciones con respecto a las vías para ampliar la función de los profesionales de enfermería (WHO 2012). Para permitir que los elaboradores de políticas tomen decisiones fundamentadas acerca de los modelos de provisión de asistencia sanitaria, se necesita evidencia rigurosa sobre la calidad de la atención, así como sobre el acceso y los costes, asociados con la atención proporcionada por los profesionales de enfermería, en comparación con la atención proporcionada por los médicos.
Desde que esta revisión se publicó por primera vez en 2005 (Laurant 2005), un gran número de estudios comparativos han producido una base de evidencia más sólida con respecto a la efectividad del reemplazo de los médicos por un profesional de enfermería. Muchos estudios nuevos sobre los profesionales de enfermería en la atención primaria muestran el interés creciente a nivel internacional en el cambio de tareas y de límites entre la medicina y la enfermería. Además, las reformas reguladoras y educacionales apoyan internacionalmente la tendencia hacia las funciones de enfermería avanzadas para la provisión de asistencia sanitaria y el cambio de tareas. La tasa de crecimiento del personal de enfermería es actualmente tres veces mayor que el del personal médico (nueve veces mayor que para los profesionales de enfermería de la atención primaria), lo que brinda una oportunidad importante para cubrir la creciente demanda en la atención primaria (Maier 2016b).
Esta revisión actualizada añade valor a las revisiones sistemáticas publicadas recientemente sobre este tema al excluir los estudios que no se centran exclusivamente en el reemplazo, lo que da lugar a resultados más exactos con respecto a la efectividad del reemplazo del médico por un profesional de enfermería específicamente; y al utilizar métodos Cochrane rigurosos. Las apreciaciones adicionales proporcionadas por esta actualización son importantes porque los resultados presentados por algunas otras revisiones no han sido concluyentes (p.ej. sobre los costes), y porque la manera en la que se organizan los servicios de asistencia sanitaria primaria ha cambiado desde que se publicó la revisión original.
Objetivos
El objetivo fue investigar la repercusión de los profesionales de enfermería que trabajan como reemplazantes de los médicos de atención primaria en:
-
resultados de los pacientes;
-
el proceso de atención; y
-
utilización, incluido el volumen y los costes.
Métodos
Criterios de inclusión de estudios para esta revisión
Tipos de estudios
Ensayos aleatorios (es decir, ensayos en los que los participantes se asignaron de manera aleatoria a los grupos intervención y control). En la revisión Cochrane anterior se incluyeron estudios controlados tipo antes y después y ensayos no aleatorios (Laurant 2005). El número de ensayos aleatorios disponibles ha aumentado desde entonces; por lo tanto, se decidió excluir de esta actualización los estudios controlados tipo antes y después (n = 3) y los ensayos no aleatorios (n = 3). Los ensayos aleatorios proporcionan la evidencia más consistente sobre la efectividad, y es poco probable que la inclusión de otros diseños de estudios tenga valor si se considera el gran número de ensayos aleatorios disponibles en la actualidad.
Tipos de participantes
-
Médicos: cualquier tipo de médico que trabaje en un contexto de atención primaria, incluidos los médicos generales, los médicos de familia, los pediatras, los internistas generales y los geriatras. En esta revisión se utilizó "médico" como término genérico para este profesional.
-
Profesionales de enfermería: cualquier profesional de enfermería titulado calificado que trabaje como reemplazante de los médicos en la atención primaria. La definición de profesional de enfermería calificado es "un graduado que está legalmente autorizado (titulado) para practicar después de un examen por una junta estatal de examinadores de enfermería o una autoridad reguladora similar" (WHO 2012). Se incluyen los profesionales de enfermería de la atención primaria, los especializados, los profesionales de enfermería de práctica avanzada, los profesionales de enfermería entrenados, los visitadores sanitarios, etc. Como el título del trabajo, la educación y la experiencia de los profesionales de enfermería varían considerablemente entre y en los países, no se seleccionaron los profesionales de enfermería según el título del trabajo. Solo se excluyeron los profesionales de enfermería de salud mental porque este tipo de reemplazo se aborda en la revisión EPOC sobre los trabajadores sanitarios no especializados para la salud mental (Ginneken 2013). También se excluyeron los profesionales de enfermería en adiestramiento porque, debido al adiestramiento, no trabajan según todo su potencial.
-
Pacientes: cualquier persona que se presente en la atención primaria con una molestia física.
Esta revisión se limita a los servicios de asistencia sanitaria primaria que proporcionan el primer contacto y atención en curso a los pacientes con cualquier tipo de problema físico de salud. Incluye la medicina familiar, la práctica general, la atención ambulatoria y los contextos de atención primaria ambulatoria, pero excluye los departamentos hospitalarios de accidentes y urgencias. Se considera que los pacientes que se presentan a los departamentos hospitalarios de accidentes y urgencias no son comparables a los pacientes que acuden a los servicios de atención primaria. Estos departamentos hospitalarios en general tratan verdaderas emergencias potencialmente mortales, por lo que no se consideran una opción a una cita con un médico en la atención primaria.
Tipos de intervenciones
Esta revisión se centra en los profesionales de enfermería que trabajan como reemplazantes de los médicos de la atención primaria. Reemplazo se refiere a la situación en la que la/s tarea/s antes realizada/s por un tipo de profesional (es decir, un médico) se transfiere/n a un tipo de profesional diferente (es decir, un profesional de enfermería), generalmente con la intención de reducir los costes o abordar la escasez de personal (Freund 2015; Laurant 2009). Los estudios de reemplazo examinan habitualmente los casos en los que el profesional de enfermería se encarga de proporcionar la misma asistencia sanitaria que un médico y comparan el rendimiento de estos dos profesionales. Por ejemplo, los autores del estudio pueden comparar un consultorio dirigido por un profesional de enfermería para una enfermedad o afección particulares versus un consultorio dirigido por un médico para esa misma enfermedad o afección.
Se excluyeron los estudios que evaluaron a profesionales de enfermería que complementaron el trabajo de los médicos de la atención primaria. Complementar se refiere a la situación en la que un profesional de enfermería complementa o amplía la atención proporcionada por un médico al brindar un nuevo servicio de atención primaria. En general, el objetivo es mejorar la calidad de la atención en lugar de reducir el coste o abordar la escasez de personal. Generalmente, los estudios de complementación comparan la atención habitual proporcionada por un médico versus un servicio innovador proporcionado por un profesional de enfermería que trabaja junto con un médico. Por ejemplo, los investigadores pueden comparar un consultorio de medicina familiar con un consultorio de diabetes dirigido por un profesional de enfermería versus un consultorio de medicina familiar sin dicho consultorio. Este tipo de estudio tiene el riesgo de confundir dos aspectos de la provisión de atención: el tipo de servicio (consultorio especializado versus consultorio habitual) y quién proporciona el servicio (médico o profesional de enfermería).
Tipos de medida de resultado
Para la inclusión en la revisión se consideraron tres tipos de resultados: resultados de los pacientes; resultados del proceso de atención; y resultados de utilización, incluido el volumen y los costes.
Resultados primarios
Resultados de los pacientes
-
Mortalidad
-
Estado de salud (resultados clínicos y resultados informados por el paciente)
-
Satisfacción
-
Calidad de vida
-
Otros (adherencia, conocimiento, preferencia por el médico o el profesional de enfermería)
Resultados secundarios
Resultados el proceso de atención
-
Cumplimiento de los profesionales con las guías clínicas
-
Actividades de asistencia sanitaria de los profesionales (exámenes, provisión de asesoría)
Resultados de utilización
Volumen
-
Frecuencia y duración de las consultas
-
Número de nuevas visitas
-
Número de prescripciones
-
Números de pruebas e investigaciones
-
Número de derivaciones o frecuencia del uso de otros servicios
Costes
-
Costes directos del servicio de salud relacionados con el volumen
-
Costes indirectos (sociales)
Métodos de búsqueda para la identificación de los estudios
Búsquedas electrónicas
We searched the following databases.
-
Cochrane Central Register of Controlled Trials (CENTRAL; 2014, Issue 12), part of the Cochrane Library (www.cochranelibrary.com (searched 20.01.2015).
-
MEDLINE In‐Process & Other Non‐Indexed Citations, MEDLINE Daily, MEDLINE and Ovid OLDMEDLINE 1946 to present, Ovid (searched 20.01.2015).
-
Cumulative Index to Nursing and Allied Health Literature (CINAHL) 1981 to present, EbscoHost (searched 20.01.2015).
We performed an updated search in CENTRAL, MEDLINE, and CINAHL in March 2017. We have added one study to ‘Studies awaiting classification’ and will incorporate this study into the review at the next update.
Búsqueda de otros recursos
Grey literature databases
-
The Grey Literature Report (http://www.nyam.org/library/online‐resources/grey‐literature‐report/) (searched 21.02.2017)
-
OpenGrey (http://www.opengrey.eu/) (searched 21.02.2017)
Trial registries
-
International Clinical Trials Registry Platform (ICTRP), World Health Organization (WHO) (http://www.who.int/ictrp/en/) (searched 21.02.2017)
-
ClinicalTrials.gov, US National Institutes of Health (NIH) (http://clinicaltrials.gov/) (searched 21.02.2017)
We also searched the Science Citation Index and the Social Sciences Citation Index 1975 to present, for articles citing relevant studies, as well as Web of Knowledge (Thomson Reuters) (searched 27.01.2015) and the reference lists of all included papers and identified relevant reviews.
Please see Appendix 1 for strategies used and the PRISMA flow chart (Figure 1) for records retrieved, excluded, and included.
Obtención y análisis de los datos
Selección de los estudios
At least two review authors (among ML, NW, KW, EK, and AVV) independently screened search results at three levels: titles; abstracts to assess which studies potentially satisfied the inclusion criteria; and full‐text copies of papers that were potentially relevant. If we could not assess the paper for eligibility based on title or abstract, we obtained the full text. Where data was published in duplicate, we included these data only once in the review.
Extracción y manejo de los datos
For this review, we designed a data extraction form that was based on the previously used standard form of the Cochrane Effective Practice and Organisation of Care Group (EPOC). At least two review authors (of ML, MB, NW, KW, EK, and AVV) independently abstracted data from each study and resolved differences by discussion.
If a single publication reported two or more separate studies, we extracted each study separately. If findings of a single study were spread across two or more publications, we extracted data from these publications as one. We extracted outcomes measured at different time points and presented in different publications, for example, at six months and two years after the intervention. We used the longest follow‐up in meta‐analyses. For each study with more than one control or comparison group for the nurse intervention, we reported only results for the control condition in which doctors provided the same intervention as the nurse.
Evaluación del riesgo de sesgo de los estudios incluidos
At least two review authors (among ML, MB, NW, KW, EK, and AVV) independently assessed risk of bias of each included study using the criteria suggested by EPOC (EPOC 2017). We assessed randomised trials for generation of allocation sequence, concealment of allocation, similar baseline outcome measurements, similar baseline characteristics, incomplete outcome data, blinding of participants, blinding of outcome assessors, protection against contamination, selective outcome reporting, and bias due to lack of power. We scored each study for risk of bias as follows: ’low’ if all key domains were scored as ’low risk’; ’unclear’ if one or two key domains were scored as ’unclear risk’; and ’high’ if more than two key domains were scored ’unclear risk’ or ’high risk’. When no information was available, we scored 'unclear risk'. For similar baseline characteristics and outcome measurements, we scored 'low risk' when baseline values were equal, or when analysis included a correction for differences in baseline values. We scored incomplete outcome data as low risk when follow‐up was ≥ 80% or when follow‐up was < 80%, with equal results attained by intention‐to‐treat (ITT) and per‐protocol (PP) analyses. With respect to blinding, we used the following approach. When investigators reported no blinding of patients and personnel, we scored 'unclear risk', because we do not know whether lack of blinding influenced study results. For some objective outcomes (e.g. mortality), blinding does not influence risk of bias, but for other outcomes in the same study (e.g. satisfaction), non‐blinding may influence outcomes.
We did not split the different outcomes for assessment of risk of bias within a study because the judgement of risk of bias was generally equal for all outcomes within a study. If the risk of bias judgement for a particular outcome was divergent, we commented on that.
We have shown assessments of risk of bias for included studies in the Characteristics of included studies table and have summarised this information in Figure 1 and Figure 2. We did not use risk of bias assessments in deciding which studies should be included in the meta‐analyses. However, we conducted sensitivity analyses by excluding studies with high risk of bias (see Sensitivity analysis). Furthermore, we used these assessments in interpreting study results and, particularly, in assessing the certainty of evidence for nurse‐doctor substitution.
Medidas del efecto del tratamiento
The measure of effect size for continuous outcomes (patient satisfaction, disease activity score, pain, and length of consultation) was the standardised mean difference (SMD). The SMD is more appropriate than the mean difference (MD) in situations where the measurement instrument (i.e. the patient satisfaction scale) differs between studies. (See the Cochrane Handbook for Systematic Reviews of Interventions version 5.1.0.) We used MDs for patient outcomes including blood pressure, cholesterol, and glycated haemoglobin (HbA1c).
The measure of effect size used for dichotomous outcomes was the risk ratio (RR). (See the Cochrane Handbook for Systematic Reviews of Interventions version 5.1.0.) We converted odds ratios (ORs) to RRs using the built‐in calculator in RevMan 5.3 (RevMan 2014).
Cuestiones relativas a la unidad de análisis
We included in the meta‐analyses three cluster‐randomised trials along with fifteen individually randomised trials. We included one cluster‐randomised trial that accounted for clustering in their analyses (Campbell 2014). Two of the included cluster‐randomised trials did not correct adequately for clustering (Chambers 1978; Spitzer 1973). We explored the impacts of these trials by performing a Sensitivity analysis.
Manejo de los datos faltantes
For missing or unclear information, we contacted study investigators to request clarification or additional information. For studies that reported continuous data but did not report standard deviations, we calculated these values from other available data such as standard errors, or imputed them using the methods suggested in Higgins 2011.
We extracted data from the ITT analysis when possible. If ITT data were not present, we excluded the study from meta‐analyses by performing a Sensitivity analysis.
Evaluación de la heterogeneidad
Clinical settings, country contexts, and methodological diversity
We first made a qualitative assessment of the extent to which studies assessing a particular comparison were similar to one another. This included assessment of clinical settings, country contexts, and types of measurement scales to determine whether meta‐analysis was appropriate.
Statistical heterogeneity
We obtained an initial visual overview of statistical heterogeneity by scrutinising forest plots, looking at the overlap between confidence intervals around the estimate for each included study. In addition, we used the I2 statistic and confidence intervals to estimate and quantify heterogeneity.
Evaluación de los sesgos de notificación
To reduce possible publication bias, we employed strategies to search for and identify relevant unpublished studies for inclusion. These strategies included searching the grey literature and prospective trial registration databases to overcome time‐lag bias.
We used funnel plots for outcomes reported by more than four studies to visualise whether data showed asymmetry. No plots showed asymmetry. However, we identified too few studies for reliable assessment of funnel plot asymmetry ‐ visually or quantitatively.
Síntesis de los datos
To summarise the effectiveness of the nurse‐doctor substitution, we performed several meta‐analyses. We conducted statistical meta‐analyses using the RevMan 5.3 software distributed by Cochrane (RevMan 2014). For studies in which quantitative data were absent or were insufficient for calculation, we reproduced the data as presented in the additional tables, undertook a structured synthesis, and reported the findings narratively. We performed a meta‐analysis if the nature of the outcome and other key aspects of studies were similar. We used adjusted RRs if available in the article. When not available, we calculated RRs from events. For categorical outcomes, we calculated log RRs and standard errors (SEs) of log RRs for both individual and cluster‐randomised trials. We analysed together log RRs for individual randomised trials and adjusted log RRs for cluster‐randomised trials. We preferred RRs over ORs because interpretation is intuitive. When no cluster‐randomised trials were included in the meta analysis, we used RRs instead of log RRs.
We used a random‐effects meta‐analysis, which is known to be more conservative and more suitable in the presence of any heterogeneity (Kontopantelis 2012). Although we expected substantial heterogeneity in some cases, which could be attributed to differences among populations, interventions, comparators, outcomes, and settings, we are aware that detection of existing heterogeneity can be problematic for meta‐analysis that includes a small number of studies (Kontopantelis 2013). Therefore, for greater transparency, we reported 95% confidence intervals of the I2 statistic, obtained under an inverse variance DerSimonian‐Laird random‐effects model for continuous outcomes, and a Mantel‐Haenszel/DerSimonian‐Laird random‐effects model hybrid for dichotomous outcomes.
'Summary of findings'
We used the GRADE approach to assess the certainty of evidence related to each of the key outcomes (Schünemann 2009). We used the GRADE profiler to import data from Review Manager 5.3 and create Summary of findings table 1 (RevMan 2014; GRADEpro GDT 2015).
For assessments of the overall certainty of evidence for each outcome, we downgraded the evidence from 'high certainty' by one level for serious (or by two levels for very serious) study limitations (risk of bias), indirectness of evidence, serious inconsistency, imprecision of effect estimates, or potential publication bias. We provided justification for decisions to downgrade or upgrade ratings by inserting footnotes into the table and made comments to aid readers' understanding of the review when necessary. We used plain language statements to report these findings in the review.
We used these assessments, along with evidence for absolute benefit or harm of the interventions and the sum of available data on all critical and important outcomes from each study included for each comparison, to draw conclusions about the effectiveness of nurse‐led primary care. Summary of findings table 1 consists of critically important clinical and functional outcomes identified in the selected trials.
When judging the importance of SMDs, we acknowledged that 0.2 represents a slight effect, 0.5 a moderate effect, and 0.8 a significant effect (Guyatt 2008; Higgins 2011).
Análisis de subgrupos e investigación de la heterogeneidad
During the review process, we identified several factors that might explain heterogeneity in review findings, including type of nurse (i.e. nurse, registered nurse, nurse practitioner, specialised nurse); characteristics of the intervention and the comparator (i.e. total substitution, partial substitution); study size; duration of follow‐up; type of care (i.e. single contact, series, urgent care); range of patient complaints (i.e. all patients or particular patient groups); and setting. We undertook these as exploratory, hypothesis‐generating analyses because these factors were not identified a priori and several potentially explanatory factors were considered. We considered undertaking a subgroup analysis based on nurse title as described in the included studies, as has been done in other systematic reviews (Martínez‐González 2014a). However, we have little information about exact role definitions and educational levels of nurses in the different trials, and we know that job titles differ among countries; therefore, we decided it was not possible to create clear and valid subgroups for subgroup analyses.
Análisis de sensibilidad
We performed sensitivity analyses by excluding trials assessed as having high risk of bias (overall) (Chambers 1978; Lewis 1967; Hemani 1999; Mundinger 2000), cluster‐randomised trials (Chambers 1978; Spitzer 1973), trials presenting per‐protocol (PP) rather than intention‐to‐treat (ITT) data when follow‐up was < 80% (Chambers 1978; Mundinger 2000; Venning 2000), trials from low‐income countries (Sanne 2010), and trials in which investigators had calculated the RR from an OR (Iglesias 2013). We performed all sensitivity analyses on all outcomes.
Results
Description of studies
Results of the search
We identified a total of 4831 articles from electronic and supplementary searches. We excluded 4741 articles following a review of titles and abstracts and retrieved and assessed the full text of 90 articles. We excluded 78 full‐text articles that investigated the role of nurses working as supplements to primary care doctors and excluded two additional studies that involved a mix of primary and hospital care. Nine randomised trials met the inclusion criteria, and we included them in this update. We performed an updated search in CENTRAL, MEDLINE, and CINAHL in March 2017. We have added one study to ‘Studies awaiting classification’ and will incorporate this study into the review at the next update. We have presented the study flow diagram in Figure 1.
Included studies
We included nine new randomised trials in this update (Campbell 2014; Chan 2009; Dierick‐van Daele 2009; Houweling 2011; Iglesias 2013; Larsson 2014; Ndosi 2013; Sanne 2010; Voogdt‐Pruis 2010). The review now includes 18 randomised trials in which nurses worked as substitutes for doctors. Four of them were cluster‐randomised trials (Campbell 2014; Chambers 1978; Moher 2001; Spitzer 1973) that were randomised by practice (Campbell 2014; Moher 2001) or by family (Chambers 1978; Spitzer 1973). We described the findings of the included studies below and summarised them in the Characteristics of included studies table.
Setting
Six studies were conducted in the UK (Campbell 2014; Chan 2009; Lattimer 1998; Moher 2001; Ndosi 2013; Shum 2000), three in the Netherlands (Dierick‐van Daele 2009; Houweling 2011; Voogdt‐Pruis 2010), three in the USA (Hemani 1999; Lewis 1967; Mundinger 2000), three in Canada (Chambers 1978; Spitzer 1973; Venning 2000), one in Sweden (Larsson 2014), one in Spain (Iglesias 2013), and one in South Africa (Sanne 2010).
Nurses substituted for doctors in a range of care settings. Interventions were carried out in general practices/family practices (Campbell 2014; Chambers 1978; Dierick‐van Daele 2009; Houweling 2011; Iglesias 2013; Lattimer 1998; Moher 2001; Mundinger 2000; Sanne 2010; Shum 2000; Spitzer 1973; Venning 2000; Voogdt‐Pruis 2010),(out‐patient) nurse clinics (Chan 2009; Lewis 1967; Larsson 2014; Ndosi 2013). and specialised practices (Hemani 1999).
The study period ranged from 2 weeks in Venning 2000 to 48 months (Ndosi 2013) with a mean of 14 months (standard deviation (SD) 12 months). For one study, the study period remains unknown (Houweling 2011).
Role of the nurse
Included studies were of nurse‐doctor substitution in primary care for provision of first contact care (including urgent care), ongoing care for all presenting physical complaints, and follow‐up of patients with a particular chronic condition. Nurse‐doctor substitution for preventive services and health education in primary care has been less well studied.
-
In five studies, the nurse assumed responsibility for first contact and ongoing care for all presenting patients (Chambers 1978; Hemani 1999; Iglesias 2013; Mundinger 2000; Spitzer 1973).
-
In five studies, the nurse assumed responsibility for first contact care for patients wanting (urgent) consultations during routine practice hours ‐ Campbell 2014; Dierick‐van Daele 2009; Shum 2000; Venning 2000 ‐ or out‐of‐hours ‐ Lattimer 1998.
-
In seven studies, the nurse had responsibility for ongoing treatment or follow‐up of patients with a particular chronic disease (Chan 2009; Houweling 2011; Larsson 2014; Lewis 1967; Moher 2001; Ndosi 2013; Sanne 2010).
-
In one study, the nurse provided mainly health education or preventive services to a specific group of patients (Voogdt‐Pruis 2010).
Excluded studies
We excluded almost all excluded full‐text articles because they investigated the role of nurses working as supplements to primary care doctors. We excluded seven studies from this update that had been included in the previous version of the review (Laurant 2005): one study focussed on mental health problems (McIntosh 1997); three controlled before‐after studies ‐ Chambers 1977; Gordon 1974; Myers 1997; and three non‐randomised studies ‐ Flynn 1974; Kinnersley 2000; Stein 1974 . In addition, we excluded two studies that involved a mix of primary care and hospital care (Kuethe 2011; Irewall 2015). We listed these nine studies in the Characteristics of excluded studies tables.
Risk of bias in included studies
We prepared an assessment of risk of bias for each trial and illustrated final judgements for the ten criteria in Figure 2 and Figure 3. All studies had some methodological shortcomings, in most instances related to unclear risk of bias for different criteria. We judged only one study to be at high risk of bias for more than one criterion (Mundinger 2000). The criteria most commonly assessed as having unclear risk of bias were blinding of personnel, outcome assessment, and selective reporting. The criterion most commonly assessed as having high risk of bias was contamination (Lewis 1967; Mundinger 2000; Spitzer 1973; Voogdt‐Pruis 2010).

Risk of bias summary: review authors' judgements about each risk of bias item for each included study.
Allocation
Most studies stated that participants or practices (in case of cluster randomisation (Campbell 2014)) were assigned randomly, according to a computerised randomisation scheme. Twelve of the included studies met the ‘low risk of bias’ criteria for random sequence generation. Most of these studies used a computer (Chan 2009; Hemani 1999; Voogdt‐Pruis 2010), and some used envelopes for this purpose (Dierick‐van Daele 2009; Houweling 2011; Larsson 2014; Shum 2000). For six studies, the risk of bias for random sequence generation was unclear owing to poor reporting. Campbell 2014 used a random component in the sequence process, and 10 of 15 practices withdrew after randomisation, which made the risk of bias unclear.
Baseline values
Most studies provided similar outcome measurements between the two study arms at baseline or corrected for differences in baseline values. Hemani 1999 did not assess baseline characteristics, and study arms differed for one or two outcome measures in Larsson 2014.
Blinding
Risk of performance bias was low in two studies (Hemani 1999; Voogdt‐Pruis 2010). In Hemani 1999, personnel did not know which patients were included in the study, and Voogdt‐Pruis 2010 collected data retrospectively and asked patients for their consent after one year. For all other studies, we judged the risk of performance bias as unclear because no information was available. We expect that patients and personnel were not blinded in these studies because the care provider constitutes the intervention. Whether this lack of blinding influences outcomes is unclear. Three studies satisfied the criteria for blinding of outcome assessors (Chan 2009; Iglesias 2013; Ndosi 2013). These studies provided independent researchers who where blind to group assignment when measuring outcomes. Most studies did not provide sufficient information on blinding of outcome assessment; we therefore assessed them as having unclear risk of detection bias.
Incomplete outcome data
Three studies reported follow‐up less than 80% (Chambers 1978; Mundinger 2000; Venning 2000); we therefore judged these studies to have high risk of bias for incomplete outcome data. In most studies, 80% or more of the initial participants completed the study. Risk of bias due to incomplete outcome data was unclear in Hemani 1999 because of limited reporting about follow‐up. Ndosi 2013 reported follow‐up of less than 80%. However, investigators performed both ITT and PP analyses and reported the same results (Ndosi 2013).
Selective reporting
We judged two studies to have low risk for selective outcome reporting bias (Campbell 2014; Ndosi 2013). A protocol was available for each study, and these papers reported predefined outcome measures. Absence of study protocols to confirm reporting of all intended outcomes led to the unclear judgement in all other studies.
Other potential sources of bias
Risk of bias due to contamination was high in four studies (Lewis 1967; Mundinger 2000; Spitzer 1973; Voogdt‐Pruis 2010). These studies reported an increased likelihood of cross‐over of patients or personnel between groups. Contamination was not likely in six studies (Campbell 2014; Chan 2009; Dierick‐van Daele 2009; Moher 2001; Ndosi 2013; Sanne 2010). Lack of information or insufficient details in the paper led to judgement of unclear risk in the other studies.
Effects of interventions
See: Summary of findings for the main comparison
Patient outcomes
A total of 18 trials investigated patient outcomes (Campbell 2014; Chambers 1978; Chan 2009; Dierick‐van Daele 2009; Hemani 1999; Houweling 2011; Iglesias 2013; Larsson 2014; Lattimer 1998; Lewis 1967; Moher 2001; Mundinger 2000; Ndosi 2013; Sanne 2010; Shum 2000; Spitzer 1973; Venning 2000; Voogdt‐Pruis 2010) (Table 1).
| Study | Various health status outcomes |
| Health status: ‐ Emotional function: no differencea ‐ Social function: no differencea | |
| Health status: ‐ Severity of symptoms: Nurse group had greatest improvement. Difference adjusted for baseline 2.3 (95% CI 1.4 to 3.1), P < 0.001 | |
| Health status: ‐ Burden of illness: nurse vs doctor (MD 0.27, P = 0.16) ‐ Concerns about illness: nurse vs doctor (MD 0.11, P = 0.20) ‐ Absence of work: both nurse and doctor 1.11 daysa,b ‐ Ability to perform daily activities: nurse mean 2.53, doctor mean 2.69a,b | |
| Objective measures of patient health (MD (95% CI)): ‐ BMI (kg/m2): nurse ‐0.2 (‐0.5; 0.1), doctor ‐0.3 (‐0.6; ‐0.1), P = 0.377 ‐ Cholesterol/HDL: nurse ‐0.03 (‐0.1; 0.2), doctor ‐0.07 (‐0.1; ‐0.2), P = 0.321 Health status: ‐ Diabetes symptom score: no differencea,b ‐ Fatigue: no differencea,b ‐ Cognitive distress: no differencea,b | |
| Health status: ‐ DAS28‐CRP: nurse vs doctor 0.05 (95% CI ‐0.28 to 0.19, P = 0.70) ‐ ESR (mm/h): nurse vs doctor ‐1.05 (95% CI ‐3.97 to 1.86, P = 0.47) ‐ CRP (mg/L): nurse vs doctor ‐1.07 (95% CI ‐2.02 to ‐0.12, P = 0.03) ‐ Swollen joints (28): nurse vs doctor 0.13 (95% CI ‐2.18 to 0.61, P = 0.60) ‐ Tender joints (28): nurse vs doctor 0.33 (95% CI ‐0.47 to 1.13, P = 0.42) ‐ VAS global health (mm): nurse vs doctor 4.29 (95% CI ‐2.58 to 11.16, P = 0.22) | |
| Health status: ‐ Resolution of symptoms in nurse group from 16.33 to 18.39 (possible range 6 to 24; higher scores mean fewer reductions in complaints). Doctors no change. P < 0.02 | |
| Health status (lifestyle factor): ‐ Smoking: no differencea ‐ Blood pressure (mmHg) systolic: nurse 148 (142 to 153), GP 147 (135 to 153), P = 0.82a ‐ Blood pressure (mmHg) diastolic: nurse 80 (74 to 87), GP 81 (75 to 83), P = 0.82a ‐ Cholesterol (mmol/L) total: nurse 5.4 (5.2 to 5.5), GP 5.5 (5.0 to 5.9), P = 0.61a ‐ Cholesterol (mmol/L) high‐density lipoprotein: nurse 1.2 (1.1 to 1.3), GP 1.2 (1.2 to 1.3), P = 0.83a | |
| Health status (10 dimensions): no differenceb Objective measures of patient health: ‐ Asthma ‐ peak flow: NP 292.82 (94.2), GP 319.90 (136.56), P = 0.365 | |
| Health status: ‐ Fatigue ITT: nurse < doctor; mean (95% CI) 3.38 (‐2.01 to 8.76), P = 0.0171 ‐ Stiffness ITT: nurse < doctor; mean (95% CI) 8.91 (‐2.66 to 20.5), P = 0.0113 ‐ RAQoL ITT: nurse < doctor; mean (95% CI) ‐0.14 (‐1.77 to 1.49), P = 0.0001 ‐ HAQ ITT: nurse > doctor; mean (95% CI) ‐0.07 (‐0.21 to 0.07), P < 0.0001 ‐ HAD‐Anxiety ITT: nurse < doctor; mean (95% CI) 0.54 (‐0.36 to 1.43), P = 0.0179 ‐ HAD‐Depression ITT: nurse < doctor; mean (95% CI) 0.12 (‐0.65 to 0.89), P = 0.0004 ‐ ASES ITT: nurse > doctor; mean (95% CI) ‐0.92 (‐4.96 to 3.12), P = 0.0019 | |
| Health status: ‐ Cumulative failure: nurse 48%, doctor 44% HR (95% CI) 1.09 (0.89 to 1.33) ‐ All virological failure: nurse 11%, doctor 10% HR (95% CI) 1.15 (0.75 to 1.76) ‐ Toxicity failure: nurse 17%, doctor 16% HR (95% CI) 1.04 (0.74 to 1.45) ‐ Death: nurse 3%, doctor 3% HR (95% CI) 0.92 (0.39 to 2.17) | |
| Health status: ‐ Physical function (3 indicators): nurses 86%, doctors 88%b ‐ Emotional function: nurses 58%, doctors 58%b ‐ Social function: nurses 84%, doctors 83%b | |
| Health status: no differencea | |
| Objective measures of patient health: ‐ LDL cholesterol: nurse 2.9, doctors 3.0, P = 0.07 ‐ BMI: nurse 27.2, doctor 27.2, P = 0.87 Health status (lifestyle factor): ‐ Smoking: 4% of smokers in the GP group (4/102) Subgroup: at‐risk patients ‐ Systolic blood pressure: nurse 144.0, doctor 147.6, P = 0.1 ‐ Total cholesterol: nurse 5.2, doctor 5.6, P = 0.006 ‐ LDL cholesterol: nurse 3.1, doctor 3.3, P = 0.16 ‐ BMI: nurse 28.6, doctor 28.6, P = 0.78 |
a Authors reported no effect size or reported effect sizes in graphs (no exact effect sizes extracted).
b No p‐value reported.
ASES: Standardized Shoulder Assessment Form.
BMI: body mass index.
CI: confidence interval.
CRP: C‐reactive protein.
DAS28: disease activity score 28.
ESR: erythrocyte sedimentation rate.
GP: general practitioner.
HAD: Hospital and Anxiety Depression Scale.
HAQ: Health Assessment Questionnaire.
HDL: high‐density lipoprotein.
HR: heart rate.
ITT: intention‐to‐treat.
LDL: low‐density lipoprotein.
MD: mean difference.
NP: nurse practitioner.
RAQoL: Rheumatoid Arthritis Quality of Life Questionnaire.
VAS: visual analogue scale.
*there may be additional data in the Campbell 2014 articles that have not been extracted
We have grouped patient outcomes into the following categories: mortality, health status outcomes, satisfaction and preferences, quality of life, and other patient outcomes.
Mortality
Eight trials evaluated mortality (Campbell 2014; Hemani 1999; Lattimer 1998; Ndosi 2013; Sanne 2010; Shum 2000; Spitzer 1973; Voogdt‐Pruis 2010). Meta‐analysis of data from these trials suggests that nurse‐led primary care may lead to slightly fewer deaths among certain groups of patients, compared to doctor‐led care. Among those people who received doctor‐led care, 6 per 1000 people died. Among those people who received nurse‐led care, between 4 and 6 people per 1000 died (RR 0.77, 95% CI 0.57 to 1.03, low certainty evidence). Data show no evidence of statistical heterogeneity (I2 = 0%, 95% CI 0 to 68; Analysis 1.1). The evidence is of low certainty owing to a wide confidence interval that includes no effect (imprecision) and clinical heterogeneity, as the trials contributing to this estimate are quite varied (some focus on people with specific health issues and others on more generalist primary care attenders). Excluding from the meta‐analysis a trial assessed as cluster‐randomised did not greatly change the result (RR 0.56, 95% CI 0.33 to 0.95) (Lattimer 1998). Results did not differ considerably in the other sensitivity analyses.
Other health status outcomes
We grouped health status outcomes into clinical outcomes (e.g. blood pressure, cholesterol, glycated haemoglobin (HbA1c)) and self‐reported measurements of health status, including measures related to physical functioning (e.g. pain, Disease Activity Score (DAS)) and lifestyle factors (e.g. smoking, alcohol consumption, exercise).
Clinical outcomes
Three trials focussing on patients with cardiovascular disease or diabetes evaluated clinical outcomes (Houweling 2011; Mundinger 2000; Voogdt‐Pruis 2010). Meta‐analyses for blood pressure levels suggest that, compared to doctor‐led care, nurse‐led primary care probably slightly improves blood pressure outcomes for both systolic blood pressure (MD ‐3.73, 95% CI ‐6.02 to ‐1.44, moderate‐certainty evidence; Analysis 1.5) and diastolic blood pressure (MD ‐2.54, 95% CI ‐4.57 to ‐0.52, moderate‐certainty evidence; Analysis 1.6). For both outcomes, data show no evidence of statistical heterogeneity (systolic blood pressure: I2 = 0%, 95% CI 0 to 90; diastolic blood pressure: I2 = 0%). Assessment of moderate‐certainty evidence is due to high risk of bias in one of the included studies (Mundinger 2000). Results did not change considerably under Sensitivity analysis.
A meta‐analysis for HbA1c suggest that nurse‐led primary care probably leads to similar outcomes as doctor‐led care and a meta‐analysis for cholesterol suggest that nurse‐led primary care leads to similar outcomes as doctor‐led care for patients with heart failure or diabetes (HbA1c levels: MD 0.08, 95% CI ‐0.25 to 0.41, moderate‐certainty evidence; Analysis 1.8; total cholesterol: MD ‐0.15, 95% CI ‐0.32 to 0.02, high‐certainty evidence; Analysis 1.7). For both outcomes, data show no evidence of statistical heterogeneity (cholesterol: I2 = 0%, 95% CI 0 to 90; HbA1c: I2 = 0%). The assessment of moderate‐certainty evidence for HbA1c evidence is due to high risk of bias in one of the included studies (Mundinger 2000). Results did not change considerably under Sensitivity analysis.
Self‐reported measurements of health status
Twelve trials provided self‐reported measurements of health status (Chambers 1978; Chan 2009; Dierick‐van Daele 2009; Houweling 2011; Larsson 2014; Lewis 1967; Moher 2001; Ndosi 2013; Sanne 2010; Spitzer 1973; Venning 2000; Voogdt‐Pruis 2010). Two trials among patients with rheumatological diseases (Larsson 2014; Ndosi 2013) assessed the outcomes disease activity in rheumatoid arthritis and pain. Meta‐analyses for DAS and pain suggest that nurse‐led primary care, compared to doctor‐led care, for patients with rheumatological disease probably leads to similar outcomes for DAS and pain (DAS: MD 0.04, 95% CI ‐0.17 to 0.24, moderate‐certainty evidence; Analysis 1.9; pain: MD 0.76, 95% CI ‐3.85 to 5.38, moderate‐certainty evidence; Analysis 1.3). For both outcomes, there was no evidence of statistical heterogeneity (DAS: I2 = 1%; pain: I2 = 0%). The evidence is of moderate certainty owing to indirectness, as only patients with rheumatoid arthritis were included. Results did not change considerably under Sensitivity analysis.
We included in a meta‐analysis three studies assessing physical functioning. Results suggest that, compared to doctor‐led care, nurse‐led primary care may lead to little or no difference in physical functioning (RR 1.03, 95% CI 0.98 to 1.09, low‐certainty evidence; Analysis 1.2). Results showed statistical heterogeneity (I2 = 62%, 95% CI 0 to 87, P = 0.07). The evidence is of low certainty owing to inconsistency and high risk of bias. Results did not change considerably when a trial assessed as having high risk of bias (Chambers 1978) was excluded under Sensitivity analysis.
In addition, studies measured a large number of other outcomes related to health status and lifestyle. It was not possible to pool these results because of the wide range of outcomes assessed, but results suggest that care provided by nurses was at least as good as care provided by doctors. We have summarised the details in Table 1.
Satisfaction and preferences
Ten trials measured satisfaction with care (Campbell 2014; Dierick‐van Daele 2009; Iglesias 2013; Larsson 2014; Lewis 1967; Mundinger 2000; Ndosi 2013; Shum 2000; Spitzer 1973; Venning 2000). This outcome was assessed in many different ways across trials; therefore we could include only seven trials in a meta‐analysis (Campbell 2014; Dierick‐van Daele 2009; Iglesias 2013; Larsson 2014; Mundinger 2000; Shum 2000; Venning 2000). This showed that patient satisfaction is probably slightly higher in nurse‐led primary care than in doctor‐led primary care (SMD 0.08, 95% CI 0.01 to 0.15, moderate‐certainty evidence; Analysis 1.10). The evidence is of moderate certainty owing to inconsistency (I2 = 56%, 95% CI 23 to 74), suggesting that the extent to which nurse‐led care increased patient satisfaction varied considerably with the context of care. Results did not change considerably under Sensitivity analysis. Findings of trials not included in this meta‐analysis also suggest that patients are probably at least as satisfied with nurse‐led care as with doctor‐led care. Table 2 summarises the data for all trials that assessed this outcome.
| Study | Satisfaction, preference |
| Overall satisfaction: nurse triage vs GP triage MD 2.60 (95% CI 0.58 to 4.63)a | |
| Overall satisfaction: nurse vs doctor (0 to 10), MD ‐0.015, P = 0.83 Communication/attitude (1 to 6) ‐ Understanding: nurse vs doctor, MD ‐0.015, P = 0.41 ‐ Telling the plan: nurse vs doctor, MD ‐0.02, P = 0.74 ‐ Explaination goals and treatment: nurse vs doctor, MD ‐0.01, P = 0.76 ‐ Importance advice: nurse vs doctor, MD ‐0.07, P = 0.17 ‐ Appropriate attention: nurse vs doctor, MD 0.01, P = 0.78 Provision of information (1 to 6) ‐ Cause of problems: nurse vs doctor, MD ‐0.08, P = 0.21 ‐ Relief of symptoms: nurse vs doctor, MD ‐0.04, P = 0.47 ‐ Duration of illness: nurse vs doctor, MD ‐0.09, P = 0.25 ‐ Change of recurrence: nurse vs doctor, MD ‐0.15, P = 0.08 ‐ What to do: nurse vs doctor, MD ‐0.06, P = 0.45 Subgroup at least 1 chronic condition Satisfaction: NP 8.35 (1.07) vs GP 8.11 (1.32), P = 0.02 Judgement seeing the right professional: P = 0.35b Attending same provider in future: P = 0.67 Recommendation to others: P = 0.41 | |
| Satisfaction: ‐ Satisfaction with duration of the visit (0 to 10): doctor 8.1, nurse 8.4; MD (95% CI%) 0.256 (0.016 to 0.496)a ‐ Satisfaction with personal attention (0 to 10): doctor 8.1, nurse 8.4, MD (95% CI%) 0.240 (0.003 to 0.476)a ‐ Satisfaction with explanations and information received in the visit (0 to 10): doctor 8.3, nurse 8.5, MD (95% CI%) 0.240 (0.015 to 0.495)a Provider preference: More than 40% of patients in each group expressed indifference. In the control group, 13.9% of patients would prefer to be seen by a nurse, as opposed to 20.9% in the intervention group.a | |
| Confidence: ‐ NRS confidence: nurse vs doctor: 0.20 (95% CI ‐0.29 to 0.69), P = 0.42 | |
| Provider preference: doctor 5.72 vs nurse 9.80, P < 0.001. Possible range 0 to 20; higher scores indicate a more positive view of the provider. | |
| Satisfaction (9 items): no difference in overall satisfaction, or on any of the 9 subscalesa Would recommend provider to others: no differencea | |
| Leeds Satisfaction Questionnaire ‐ LSQ Week 26 ‐ LSQ‐General: nurse vs doctor effect size: 0.17, P = 0.036 ‐ LSQ‐Information: nurse vs doctor effect size: 0.08, P = 0.327 ‐ LSQ‐Empathy: nurse vs doctor effect size: 0.05, P = 0.557 ‐ LSQ‐Technical: nurse vs doctor effect size: 0.08, P = 0.293 ‐ LSQ‐Attitude: nurse vs doctor effect size: 0.14, P = 0.082 ‐ LSQ‐Access: nurse vs doctor effect size: 0.01, P = 0.936 Week 52 ‐ LSQ‐General: nurse vs doctor effect size: 0.12, P = 0.183 ‐ LSQ‐Information: nurse vs doctor effect size: 0.09, P = 0.301 ‐ LSQ‐Empathy: nurse vs doctor effect size: 0.05, P = 0.578 ‐ LSQ‐Technical: nurse vs doctor effect size: 0.08, P = 0.369 ‐ LSQ‐Attitude: nurse vs doctor effect size: 0.08, P = 0.375 ‐ LSQ‐Access: nurse vs doctor effect size: 0.10, P = 0.248 | |
| Satisfaction: ‐ Professional care: nurse 79.2 (13.4) vs GP 76.7 (15.1), possible range 0 to 100, P = 0.002 ‐ Relationship to provider: nurse 64.3 (15.7) vs GP 64.2 (16.9), possible range 0 to 100, P = 0.945 ‐ Adequacy of time: nurse 73.3 (16.9) vs GP 67.7 (19.3), possible range 0 to 100, P < 0.001 ‐ Explanation helpful: nurse 88.8% vs GP 87.3%, P = 0.359 ‐ Advice helpful: nurse 86.9% vs GP 83.9%, P = 0.060 Provider preference: GP group: 47.5% prefer GP, 2.0% nurse, 50.5% no preference. Nurse group: 31.5% prefer GP, 7.5% nurse, 61% no preference; P < 0.001 | |
| Satisfaction: nurses 96%, doctors 97%a | |
| Satisfaction: Adults ‐ Communication: NP 4.35 (0.54) vs GP 4.21 (0.60), P = 0.001 ‐ Distress relief: NP 4.43 (0.47) vs GP 4.26 (0.57), P = 0.001 ‐ Professional care: NP 4.44 (0.49) vs GP 4.22 (0.57), P < 0.001 Children ‐ General: NP 4.39 (0.46) vs GP 4.17 (0.57), P < 0.001 ‐ Communication with parent: no difference ‐ Communication with child: NP 4.16 (0.63) vs GP 3.67 (0.77), P < 0.001 ‐ Distress relief: NP 4.41 (0.53) vs GP 4.21 (0.64), P = 0.002 ‐ Adherence intent: no difference |
ano p‐value reported
b authors reported no effect size or reported effect sizes in graphs (no exact effect sizes extracted)
CI: confidence interval.
GP: general practitioner.
LSQ: Leeds Satisfaction Questionnaire.
MD: mean difference.
NP: nurse practitioner.
NRS: Numeric Rating Scale
*there may be additional data in the Campbell 2014 articles that have not been extracted
In addition, investigators measured a large number of other outcomes related to patient satisfaction and preferences. It was not possible to pool these results, but findings suggest that patients are at least as satisfied with nurses as with doctors. We have summarised details in Table 2.
Quality of life
Six trials evaluated quality of life (Campbell 2014; Chan 2009; Dierick‐van Daele 2009; Houweling 2011; Mundinger 2000; Ndosi 2013). Meta‐analysis of data from these trials suggests that quality of life may be slightly higher for people receiving nurse‐led primary care, compared to doctor‐led primary care (SMD 0.16, 95% CI 0.00 to 0.31, low‐certainty evidence; Analysis 1.4). The evidence is of low certainty owing to inconsistency (I2 = 85%, 95% CI 69 to 93) and to imprecision, as the confidence interval touches on the null. The heterogeneity was caused by one trial (Chan 2009), which included a specific patient group (i.e. people who had experienced dyspepsia after direct access gastroscopy). After we excluded this trial, we found that there may be little or no difference in quality of life among patients receiving nurse‐led primary care, compared to doctor‐led primary care (SMD 0.02, 95% CI ‐0.01 to 0.05). The results also did not show evidence of heterogeneity or change considerably under other Sensitivity analysis.
Other patient outcomes
Investigators measured a large number of other patient outcomes, including patient knowledge (understanding the health issue) and patient enablement (coping with his or her health issues). It was not possible to pool these results, but findings suggest that care provided by nurses was probably at least as good as care provided by doctors. We have summarised the details in Table 3.
| Study | Compliance | Other |
| Rating information (5 items): no differencea,b | ||
| Enablement: nurse vs GP, MD = 0.65 (CI ‐1.50 to 0.19), P = 0.13 | ||
| Patient adherence to medical treatment after 1 year of follow‐up nurse vs doctor (95% CI) Medication blood pressure: 92.2 vs 84.9 (1.06 to 3.73; P = 0.03) Forgetting to take medication: group difference 1.32 (0.88 to 1.97; P = 0.18) ‐ Never: 52.6 vs 61.0 ‐ Sometimes: 46.8 vs 39.0 Patient lifestyle after 1 year of follow‐up nurse vs doctor (95% CI) ‐ Exercise: 28.6 vs 27.3 (0.73 to 1.67; P = 0.79) ‐ Alcohol 5 days per week at most: 78.6 vs 75.5 (0.79 to 2.01; P = 0.33) ‐ Alcohol 2 for woman, 3 for man at most: 79.1 vs 80.6 (0.53 to 1.56; P = 0.73) ‐ Fat intake: 6.5 vs 7.2 (0.02 to 1.28; P = 0.04) |
aTrial authors reported only the direction of the outcome; it is unknown if the difference is statistically significant.
bTrial authors reported no effect size or reported effect sizes on graphs (no exact effect sizes extracted).
CI: confidence interval.
GP: general practitioner.
MD: mean difference.
Process of care outcomes
Ten trials investigated process of care outcomes (Campbell 2014; Dierick‐van Daele 2009; Houweling 2011; Moher 2001; Mundinger 2000; Ndosi 2013; Shum 2000; Spitzer 1973; Venning 2000; Voogdt‐Pruis 2010). We have summarised the data in Table 4. Owing to the large variety of approaches used in measuring the process of care, we did not judge it appropriate to pool these data in a meta‐analysis. The individual trial results show some differences between nurses and primary care doctors in process of care measures. For example, investigators reported that nurses gave more advice/information to patients and adhered to guidelines more frequently. However, the quality of patient examinations appeared to be similar between nurses and doctors. Overall, we assessed this evidence to be of very low certainty as the results were non‐comparable and we could not calculate an overall effect size.
| Study | Provider care |
| Difficulty with (nurse triage vs GP triage, MD (95% CI): Phone access: 6.49 (–1.26 to 14.25)a Receiving prompt care: 6.63 (3.23 to 10.03)a Seeing a doctor or nurse: 3.67 (–0.37 to 7.71)a Getting medical help: 5.09 (2.69 to 7.50)a Convenience of care 3.68 (1.13 to 6.24)a Problem resolution: nurse triage vs GP triage: 0.41 (–1.86 to 2.67)a Process indicators: ‐ Number of contacts per person: nurse vs GP triage: 1·04 (1·01 to 1·08)a ‐ 23% in the GP‐triage group and 12% in the nurse‐triage group had just 1 contact after their initial consultation requestb | |
| Adherence to guidelines: nurse 79.8%, doctor 76.2%a,c | |
| Process indicators: ‐ Patients with last retina control > 24 months ago (n = 64) referred to an ophthalmologist: nurse 24/34 (70.6) vs GP 11/30 (36.7), P = 0.007 ‐ Patients with feet at‐risk (n = 109) for whom measures were taken: nurse 34/60 (56.7) vs GP 13/49 (26.5), P = 0.001 ‐ Patients referred to an internist to start insulin therapy: nurse 10/102 (9.8) vs GP 2/104 (1.9), P = 0.015 ‐ Patients with HbA1c ≥ 7 at baseline (n = 120), for whom glucose‐lowering therapy was intensified: nurse 53/64 (82.8) vs GP 28/56 (50.0), P = 0.001 ‐ Patients with BP > 140/90 at baseline (n = 170) for whom blood pressure‐lowering therapy was intensified: nurse 42/85 (49.4) vs GP 24/85 (28.2), P = 0.005 ‐ Patients not meeting target values for lipid profile at baseline (n = 55), for whom lipid‐lowering therapy was intensified: nurse 13/29 (44.8) vs GP 13/26 (50.0), P = 0.147 | |
| Adequate assessment: ‐ Clinical assessment: nurse vs GP: 9% (95% CI ‐3 to 22), P = 0.13 ‐ Blood pressure: no differencec ‐ Cholesterol: no differencec ‐ Smoking status: no differencec | |
| Documentation of provider behaviour diabetes care: ‐ Education (8 items): overall ‘any education’: nurse 84,9% vs medical doctor 42.4% (P < 0.001). With regard to specific items, nurse more education: 4 out of 7 topics: nutrition, weight, exercise, and medication (P < 0.01) ‐ History taken (5 items): no difference ‐ Monitoring (9 items): nurse ordered/carried out more laboratory tests, such as urinalysis (nurse 80.2%, medical doctor 55.9%, P < 0.01) and glycosylated haemoglobin (A1C value) (nurse 81.4, medical doctor 66.1, P < 0.05); nurse reported more frequently height of patients (nurse 91.9%, medical doctor 71.2%, P < 0.01). On other 6 items, no difference ‐ Referral (1 item): no differences | |
| Interventions: ‐ Giving patient education: nurse > doctor; RR (95% CI) 1.76 (1.15 to 2.69), P = 0.009 ‐ Giving psychosocial support: nurse > doctor; RR (95% CI) 3.29 (2.55 to 4.24), P < 0.0001 | |
| Provision of information: ‐ Self‐medication: nurse 22.2% vs GP 13.7%, P < 0.001 ‐ Self‐management: nurse 81.7% vs GP 57.6%, P < 0.001 | |
| Adequate treatment: ‐ Drug treatment: nurses 71%, doctors 75%a ‐ Management of episodes: nurses 69%, doctors 66%a | |
| Lifestyle and medical intervention nurse vs doctor: ‐ Smoking behaviour 8.2% vs 3.2%a ‐ Blood pressure 35.4% vs 26.6% (1.01 to 2.24; P = 0.04) ‐ Lipids 47.1 vs 22.3 (1.98 to 4.43; P < 0.01) ‐ Weight 36.9 vs 7.6 (4.26 to 12.52; P < 0.01) ‐ Exercise 19.4 vs 3.2a ‐ Food intake 14.6 vs 3.2a ‐ Medication 22.3 vs 14.7 (0.99 to 2.59; P = 0.05) ‐ None 22.8 vs 43.2 (1.69 to 3.86; P < 0.01) Asked about the use of medication: nurse vs doctor Group difference 2.12 (1.38 to 3.26; P < 0.01) ‐ Never 57.4 vs 75.4 ‐ Sometimes 20.0 vs 14.4 ‐ Often 22.1 vs 9.7 | |
| Examinations: nurse vs GP: MD 0.19 (95% CI ‐0.03 to 0.71), P = 0.072 |
aNo P value reported.
bTrial authors reported only the direction of the outcome; it remains unknown whether the difference is statistically significant.
cTrial authors reported no effect size or reported effect sizes in graphs (no exact effect sizes extracted).
CI: confidence interval.
GP: general practitioner.
MD: mean difference.
RR: risk ratio.
*there may be additional data in the Campbell 2014 articles that have not been extracted
Utilisation outcomes
Sixteen trials measured utilisation and costs (Campbell 2014; Chan 2009; Dierick‐van Daele 2009; Hemani 1999; Houweling 2011; Iglesias 2013; Larsson 2014; Lattimer 1998; Lewis 1967; Moher 2001; Mundinger 2000; Ndosi 2013; Shum 2000; Spitzer 1973; Venning 2000; Voogdt‐Pruis 2010). The range of outcomes varied across trials and can be grouped into four categories: length and frequency of consultations; numbers of prescriptions, tests, and investigations ordered; use of other healthcare services, such as hospital admissions or referral to other professionals (Table 5); and costs (Table 6). Findings for each of these categories are presented below.
| Study | Number, length, and frequency of consultations | Numbers of prescriptions, tests, and investigations | Use of other services |
| Referrals: nurse 12%, doctor 14.2%, P = 0.24a | |||
| Compared to qualified doctors Consultation rate: Nurses 3.52 vs qualified doctors 4.03 (P > 0.05) Compared to residents (trainee doctors) Consultation rate: Nurses 3.52 vs residents 2.95 (P < 0.05) | Mean utilisation rate: Compared to qualified doctors Tests & investigations: Lab tests: NP 32.67, doctor 29.46, P > 0.05 Radiological tests (total): NP 1.68. doctor 1.37, P > 0.05 ‐ CT/MRI: NP 0.32, doctor 0.13, P < 0.05 ‐ Ultrasound: NP 0.16, doctor 0.07, P < 0.05 Compared to residents (trainee doctors) Tests & investigations: Lab tests: NP 32.67, doctor 28.26, P > 0.05 ‐ Urinalysis: NP 1.31, doctor 0.99, P < 0.05 ‐ Thyroid function: NP 0.37, doctor 0.19, P < 0.05 Radiological tests: NP 1.68, doctor 1.48, P > 0.05 | Mean utilisation rate: Compared to qualified doctors Hospital admission: NP 0.43, doctor 0.33, P > 0.05 Emergency room visits: NP 1.22, doctor 1.23, P > 0.05 Specialty visits: NP 5.35, doctor 4.26, P > 0.05 Compared to residents (trainee doctors) Hospital admission: NP 0.43, doctor 0.31, P > 0.05 Emergency department visits: NP 1.22, doctor 1.05, P > 0.05 Specialty visits: NP 5.35, doctor 4.21, P > 0.05 | |
| Mean number of visits: nurse 6.1, GP 2.8 (P < 0.0001) Total duration of visits: significantly higher in nurse groupa Consultation of nurses' patients with GP: Median number of these consultations per patient was 1.4 (25 to 75 quartiles: 0.0 to 2.0) with median time of 1.0 (25 to 75 quartiles: 0.0 to 3.3) minute | |||
| Level of resolution by nurses: Nurses led 86.3% (95% CI 83.6 to 88.7) of consultations without referral to GP (referrals according to protocol indication not included) | |||
| Proportion nurse‐led vs doctor‐led: ‐ Cortisone injections in addition to regular rheumatologist monitoring visits (1:0.7; P = 0.463) ‐ Blood tests (1:3.9; P = 0.014) ‐ Radiography (1:1.6; P = 0.162) ‐ Pharmacological therapy (1:1.1; P = 0.029) | Proportion nurse‐led vs doctor‐led: ‐ Additional telephone calls to a rheumatology nurse (1:1.8; P = 0.060) ‐ Additional telephone calls to a rheumatologist (1:1.9; P =0.287) ‐ Additional rheumatologist visits (1:2.4; P = 0.077) ‐ Team rehabilitation in in‐patient settings (0:79; P = 0.086) ‐ Team rehabilitation in out‐patient settings (15:0; P = 0.135) ‐ Occupational therapist treatments (0:3.0; P = 0.162) ‐ Psychosocial treatments (0:1.0; P = 0.152) ‐ Specialist consultations (1:1.0; P = 0.949) | ||
| Impact on GP workload: ‐ Telephone advice from GP: fewer with nurse‐led care, 35% reductionb ‐ Surgery visits: 10% fewer with nurse‐led careb ‐ Home visits: 6% fewer home visits during intervention periodb | Hospital admission within 24 hours: nurse 2%, GP 6.5%, RR 0.31 (95% CI 0.07 to 1.42) Hospital admission within 3 days: nurse 5%, GP 6.5%, RR 0.77 (95% CI 0.26 to 2.28) Emergency department visit: nurse 3%, GP 2%, RR 1.84 (95% CI 0.31 to 10.82) | ||
| Consultation length: doctor 15 minutes, nurse 30 minutesc Consultation rate: doctor 150 visits, nurse 345 visitsc | Days in hospital: doctor 68 days, nurse 45 daysc | ||
| Prescriptions: ‐ Antihypertensives: no difference, P = 0.35a ‐ Lipid lowering: no difference, P = 0.63a ‐ Antiplatelet: nurse 8% (95% CI 1% to 9%) more than GP (P = 0.031) | |||
| Consultation rate: Doctor patients had higher primary care utilisation than nurse | Speciality visits: no differenced, P = 0.61 | ||
| Consultation length: Mean total consultation time: nurse 111 min, doctor 71 mina,b Consultation rate: Patients attending all 5 sessions: nurse 92%, doctor 85%a,b | ‐ Change in medicines: nurse < doctor; RR (95% CI) 0.58 (0.43 to 0.79), P = 0.0006 ‐ Dosage changes: nurse < doctor; RR (95% CI) 0.52 (0.34 to 0.79), P = 0.0020 ‐ Intra‐articular injections: nurse < doctor; RR (95% CI) 0.82 (0.50 to 1.35), P = 0.4400 ‐ Intramusclar injections: nurse < doctor; RR (95% CI) 0.73 (0.45 to 1.19), P = 0.2100 ‐ Non‐protocol bloods: nurse < doctor; RR (95% CI) 1.02 (0.74 to 1.40), P = 0.9100 | ‐ Referral to physiotherapy: nurse < doctor; RR (95% CI) 1.21 (0.62 to 2.39), P = 0.5800 ‐ Referral to occupational therapy: nurse < doctor; RR (95% CI) 1.74 (0.76 to 3.96), P = 0.1900 ‐ Referral to podiatry: nurse < doctor; RR (95% CI) 0.89 (0.37 to 2.14), P = 0.8000 ‐ Conferrals: nurse < doctor; RR (95% CI) 2.92 (1.77 to 4.83), P < 0.0001 ‐ Referral to other consultants: nurse < doctor; RR (95% CI) 0.58 (0.11 to 3.11), P = 0.5200 | |
| Out‐of‐hours calls: nurse 0.9% vs GP 1.8%, P = 0.218 | |||
| Physical examinations: nurse vs GP; MD 0.19 (95% CI ‐0.03 to 0.71), P = 0.072 | |||
| Referred to professional nurse vs doctor: ‐ Dietician 17.0 vs 8.9b ‐ Physiotherapist 3.1 vs 1.9b ‐ Cardiovascular specialist 1.9 vs 6.3b ‐ Visited a cardiovascular specialist 46.3 vs 45.3 (0.84 to 1.79; P = 0.30) ‐ Admission into hospital because of CVD 10.4 vs 13.4 (0.43 to 1.38; P = 0.38) |
aTrial authors reported no effect size or reported effect sizes in graphs (no exact effect sizes extracted).
bNo P value reported.
cTrial authors reported only the direction of the outcome; it remains unknown whether the difference is statistically significant.
dToo many numbers to report.
CI: confidence interval.
CT: computed tomography.
CVD: cardiovascular disease.
GP: general practitioner.
MRI: magnetic resonance imaging.
NP: nurse practitioner.
RR: risk ratio.
*there may be additional data in the Campbell 2014 articles that have not been extracted
| Study | Costs based on | Cost outcomes |
|
| Total costs: Mean 28‐day cost estimates for primary outcome contacts: Nurses ‐ £75·68 (63·09) GPs ‐ £75·21 (65·45) | |
|
| Costs of medication use: Nurses – mean £35.5 (SD £48.8) Doctors – mean £71.7 (SD £ 63.1) Mean difference (adjusted baseline level): £39.6 (95% CI 24.2 to 55.1); P < 0.001 | |
|
| Total direct healthcare costs: Nurses: €31.94 Doctors: €40.15 Mean difference (95% CI): €8.21 (3.56 to 12.85); P = 0.001 Total direct healthcare costs and productivity: Nurses: €140.40 Doctors: €145.87 Mean difference (95% CI): €1.48 (‐4.94 to 7.90); P = 0.65 Subgroup younger than 65 years: Total direct healthcare costs and productivity: Nurses: €161.57 Doctors: €170.75 Mean difference (95% CI): €9.18 (4.84 to 13.88); P < 0.001 | |
|
| Total annual rheumatology care per patient: Nurse‐led: €14107,70 Doctor‐led: €16274,90 Mean difference (95% CI): −2167.2 (−3757.3 to −641.7) P = 0.004 | |
|
| Annual direct cost:Nurse‐led service: ‐ £81,237 more than doctor‐led service Savings: Generated in reduced hospital and primary care utilisation £94,422 Net reduction in costs:with nurse‐led service £3,728 to £123,824 (determined by sensitivity analysis) | |
|
| Total direct cost per year: Nurses ‐ $3,251 Doctors ‐ $4,199 Average cost per patient per year: Nurses ‐ $98.51 Doctors ‐ $127.24 | |
|
| NHS resources plus out‐of‐pocket expenditures: Nurses ‐ mean £1276 Doctors ‐ mean £2286 (95% CI ‐352 to 1773) P = 0.1872 | |
|
| Average cost per patient per year: Nurses ‐ $297.01 Doctors – $285.67 | |
|
| Total direct cost per consultation: Nurses – mean £18.11 (SD £33.43; range £0.66 to £297.1) Doctors – mean £20.70 (SD £33.43; range £0.78 to £300.6) Mean difference (adjusted age, sex): £2.33 (95% CI 1.62 to 6.28); P = 0.247 |
aSpitzer reported an overall reduction in practice costs following the introduction of nurse practitioners, but this finding was based on observational before‐and‐after data. Data obtained from the related randomised controlled trial (reported above) did not support this finding.
A&E: accident and emergency.
CI: confidence interval.
DEXA: dual energy x‐ray absorptiometry.
GP: general practitioner.
*there may be additional data in the Campbell 2014 articles that have not been extracted
Consultations
Seven trials investigated consultation length (Dierick‐van Daele 2009; Houweling 2011; Iglesias 2013; Lewis 1967; Ndosi 2013; Shum 2000; Venning 2000). Four trials provided sufficient data for a meta‐analysis on consultation length (Dierick‐van Daele 2009; Iglesias 2013; Shum 2000; Venning 2000). This analysis suggests that nurses probably have longer consultations than doctors (SMD 0.38, 95% CI 0.22 to 0.54, moderate‐certainty evidence; Analysis 1.11). The evidence is of moderate certainty owing to serious inconsistency (I2 = 90%, 95% CI 80 to 95). The extent of heterogeneity suggests that differences in consultation length varied considerably with the context of care. On average, consultations with nurses were 39% (95% CI 30% to 52%) longer than those with doctors. Results did not change considerably under Sensitivity analysis. Findings of the trials not included in the meta‐analysis also suggest that consultations in nurse‐led care were probably longer than those in doctor‐led care.
Nine trials investigated consultation rates in primary care (including overall consultation rates, return visits for whatever reason, and home visits) (Dierick‐van Daele 2009; Hemani 1999; Houweling 2011; Iglesias 2013; Lewis 1967; Mundinger 2000; Ndosi 2013; Shum 2000; Venning 2000). Three trials provided sufficient data for a meta‐analysis of scheduled return visits (Dierick‐van Daele 2009; Shum 2000; Venning 2000), and four trials on attended return visits (Dierick‐van Daele 2009; Iglesias 2013; Shum 2000; Venning 2000). Data show that there may be little or no difference in scheduled return visits (RR 1.31, 95% CI 0.89 to 1.94, low‐certainty evidence; Analysis 1.12). The number of attended return visits is higher in nurse‐led primary care than in doctor‐led primary care (RR 1.19, 95% CI 1.07 to 1.33, high‐certainty evidence; Analysis 1.13). For scheduled return visits, the evidence is of low certainty owing to serious inconsistency (I2 = 86%, 95% CI 54 to 92) and imprecision (wide confidence interval). Results did not change considerably under Sensitivity analysis.
Findings of the trials not included in the meta‐analysis were congruent with those reported above . Furthermore, the workload of doctors was probably slightly less where care was led by nurses, compared to where it was led by doctors, as were waiting times for patients in the waiting room. Table 5 summarises the data for all trials that assessed this outcome.
Numbers of prescriptions, tests, and investigations
Seven trials evaluated rates of prescriptions, tests, and investigations (Dierick‐van Daele 2009; Hemani 1999; Iglesias 2013; Moher 2001; Shum 2000; Venning 2000; Ndosi 2013). Four trials provided sufficient data for a meta‐analysis on the number of prescriptions given (Dierick‐van Daele 2009; Iglesias 2013; Shum 2000; Venning 2000), and four trials on the number of tests and investigations (Dierick‐van Daele 2009; Hemani 1999; Venning 2000; Ndosi 2013). Meta‐analyses of data from these trials suggest little or no difference between nurse‐led care and doctor‐led care in the number of prescriptions given (RR 0.99, 95% CI 0.95 to 1.03, high‐certainty evidence; Analysis 1.14).
The findings also show that there may be little or no difference in the number of tests/investigations (RR 0.95, 95% CI 0.59 to 1.51, low‐certainty evidence; Analysis 1.15). The evidence is of low certainty owing to serious inconsistency (I2 = 76%, 95% CI 23 to 86) and a wide confidence interval, suggesting that the number of ordering tests/investigations varied between nurse‐led care and doctor‐led care according to the context of care.
The findings of trials not included in the meta‐analyses also suggest little or no difference between nurse‐led and doctor‐led care in numbers of prescriptions and investigations/tests. Table 5 summarises the data for all trials that assessed this outcome.
Use of other services
Thirteen trials investigated people's use of services, including referrals, specialty visits, and hospital admissions (Campbell 2014; Dierick‐van Daele 2009; Hemani 1999; Houweling 2011; Iglesias 2013; Larsson 2014; Lattimer 1998; Lewis 1967; Mundinger 2000; Ndosi 2013; Shum 2000; Venning 2000; Voogdt‐Pruis 2010). Of these trials, four provided sufficient data for a meta‐analysis on hospital referral (Houweling 2011; Lattimer 1998; Mundinger 2000; Venning 2000), five for a meta‐analysis on attendance at accident and emergency units (Campbell 2014; Iglesias 2013; Lattimer 1998; Mundinger 2000; Shum 2000), and three for a meta‐analysis on hospital admission (Lattimer 1998; Mundinger 2000; Ndosi 2013). These meta‐analyses suggest that there may be little or no difference between nurse‐led care and doctor‐led care in the likelihood of hospital referrals (RR 0.90, 95% CI 0.54 to 1.49, low‐certainty evidence; Analysis 1.16), as well as little or no difference in attendance at accident and emergency units (RR 1.00, 95% CI 0.91 to 1.09, high‐certainty evidence; Analysis 1.17). In addition, there may be little or no difference in hospital admissions (RR 1.04, 95% CI 0.78 to 1.39, low‐certainty evidence; Analysis 1.18). For referrals, evidence is of low certainty owing to inconsistency (I2 = 50%, 95% CI 0 to 86) and a wide confidence interval, suggesting that the extent to which the frequency of referrals differs between nurse‐led care and doctor‐led care varied with the context of care. For hospital admissions, the evidence is of low certainty owing to risk of bias in one of the included trials (Mundinger 2000) and a wide confidence interval. Results did not change considerably in the Sensitivity analysis.
Findings of the trials not included in the meta‐analyses also suggest little or no difference between nurse‐led and doctor‐led care on use of other services. Table 5 summarises the data for all trials that assessed this outcome.
Costs
Nine trials investigated the cost of care (Campbell 2014; Chambers 1978; Chan 2009; Dierick‐van Daele 2009; Lattimer 1998; Lewis 1967; Ndosi 2013; Spitzer 1973; Venning 2000) (Table 6). Three trials estimated cost of care for nurses providing first contact care (Dierick‐van Daele 2009; Lattimer 1998; Venning 2000), two trials for nurses providing first contact and ongoing care (Chambers 1978; Spitzer 1973), and three trials for nurses providing ongoing care for patients with chronic disease (Chan 2009; Lewis 1967; Ndosi 2013). Individually, the trials appear to suggest little or no difference in cost of care between nurse‐led care and doctor‐led care. However, owing to the large variety of approaches used to value resources and calculate costs, we judged the results to be non‐comparable and did not pool these in a meta‐analysis. We therefore assessed the certainty of the evidence as very low.
Discusión
Resumen de los resultados principales
Esta revisión identificó 18 ensayos aleatorios que evalúan la repercusión de los profesionales de enfermería que trabajan como reemplazantes de los médicos. Un estudio fue en un país de ingresos medios, y todos los otros estudios fueron en países de ingresos altos. A menudo fue poco claro el tipo de profesional de enfermería involucrado en los estudios o varió entre, e incluso en, los estudios.
Los hallazgos indican que la asistencia proporcionada por los profesionales de enfermería, comparada con la asistencia proporcionada por los médicos, probablemente da lugar a resultados de salud similares o mejores para una amplia variedad de afecciones de los pacientes (evidencia de certeza moderada).
-
La atención primaria dirigida por un profesional de enfermería puede dar lugar a menos muertes entre ciertos grupos de pacientes, en comparación con la atención dirigida por un médico. Sin embargo, los resultados varían y es posible que la atención primaria a cargo del profesional de enfermería logre poca o ninguna diferencia en el número de muertes.
-
Es probable que los resultados de presión arterial mejoren en la atención primaria dirigida por un profesional de enfermería. Otros resultados de estado clínico o de salud son probablemente similares.
-
Es probable que la satisfacción de los pacientes sea levemente mayor en la atención primaria dirigida por un profesional de enfermería. La calidad de vida puede ser algo mayor.
No existe certeza acerca de los efectos de la atención dirigida por un profesional de enfermería, comparada con la atención dirigida por un médico, sobre los procesos de atención como la educación de los pacientes y el cumplimiento con las guías. El efecto de la atención dirigida por un profesional de enfermería sobre la utilización es mixto y depende del tipo de resultado. Las consultas son probablemente más largas en la atención primaria dirigida por un profesional de enfermería, y el número de asistencias a nuevas visitas es levemente mayor para los profesionales de enfermería en comparación con los médicos. Se encontró poca o ninguna diferencia entre los profesionales de enfermería y los médicos en cuanto al número de prescripciones y la asistencia a las unidades de accidentes y urgencias. También puede haber poca o ninguna diferencia en el número de pruebas e investigaciones, derivaciones a hospitales e ingresos hospitalarios entre los profesionales de enfermería y los médicos. No existe certeza acerca de los efectos de la atención dirigida por un profesional de enfermería sobre el coste de la atención porque esta evidencia se evaluó como muy baja.
Es posible encontrar un resumen en Resumen de los hallazgos, Tabla 1.
Compleción y aplicabilidad general de las pruebas
Es necesario considerar varios aspectos cuando se valora la aplicabilidad de estos hallazgos para los sistemas de atención primaria. Primero, fue posible identificar un gran número de estudios, publicados hasta marzo de 2017, que fueron suficientes para abordar todos los objetivos de la revisión. Estos estudios varían mucho en cuanto al tipo de profesional de enfermería (con respecto a su nivel educacional y sus funciones), a los sistemas de asistencia sanitaria y a los contextos geográficos, y examinan la atención proporcionada a poblaciones generales de pacientes, así como a grupos específicos de pacientes como los pacientes con enfermedades cardiovasculares, diabetes y enfermedades reumatológicas. Además, se encontró una gran variación en las medidas de resultado. Solo hubo pocos estudios que contribuyeron a varios resultados, mientras que para otros hubo un número relativamente grande de estudios que contribuyeron a la evidencia. Además, a menudo faltaron detalles (como el nivel educacional de los profesionales de enfermería) en los informes de los estudios. Por lo tanto, no fue posible realizar los análisis de subgrupos planificados. Como resultado, no es posible establecer conclusiones sobre la influencia del tipo de profesional de enfermería sobre los resultados. Además, todos los estudios incluidos, excepto uno, se realizaron en ámbitos de países de ingresos altos. Segundo, en algunos estudios, las intervenciones en los grupos dirigidos por un profesional de enfermería y por un médico fueron algo diferentes. Por ejemplo, los profesionales de enfermería contaban con protocolos o se les ofreció una herramienta informatizada para la toma de decisiones, lo que no ocurrió con los médicos (Campbell 2014; Houweling 2011; Iglesias 2013; Lattimer 1998). En otros estudios, a los pacientes de los profesionales de enfermería se les dio una cita, mientras que a los pacientes de los médicos solo se les recomendó ver a su médico (Chan 2009), o la atención dirigida por un profesional de enfermería incluyó un período de tiempo mayor para las consultas (Ndosi 2013). Estas diferencias en las intervenciones proporcionadas podrían haber influido en los resultados de los estudios. Por último, en los diez años desde la publicación de la revisión anterior, los servicios de atención primaria han cambiado considerablemente en muchos contextos. Sin embargo, no se identificó una tendencia en los tipos de reemplazo de los médicos por los profesionales de enfermería, ni en los cambios en los resultados evaluados que podrían reflejar los cambios en los servicios de atención primaria. Las razones por las cuales sucede no están claras.
Calidad de la evidencia
Esta revisión incluyó estudios de una amplia gama de niveles de enfermería, grupos de pacientes y países. Fue posible identificar evidencia en muchos resultados diferentes, pero la certeza de esta evidencia varía. Todos los estudios tuvieron algunas deficiencias metodológicas, como la contaminación y la falta de cegamiento de los pacientes y el personal, lo que en ocasiones provocó que se disminuyera la calidad de la evidencia debido al riesgo de sesgo. Aunque la falta de cegamiento se considera una deficiencia, a menudo no es posible para las intervenciones de tipo organizacional, como el reemplazo de una clase de cuidador sanitario por otro. Aunque la repercusión de lo anterior sobre los resultados es poco clara, se considera que es probable que la repercusión sobre la satisfacción y las experiencias de los pacientes con la atención sea limitada. Por ejemplo, un estudio holandés que evaluó la repercusión de los profesionales de enfermería de la atención primaria en el ámbito de la atención primaria aguda reveló que los pacientes a menudo no saben la profesión de su proveedor de atención, incluso si el proveedor de atención se presentó al inicio de la consulta (solo el 18% de los pacientes tratados por profesionales de enfermería de la atención primaria lo recordaban)(Wijers 2013). El estudio indica que los pacientes no juzgan al profesional sobre la base de su profesión, sino según su competencia. No cegar al personal puede afectar la colaboración, ya que la aceptación de un nuevo profesional es uno de los factores principales que influyen en la combinación de habilidades(Laurant 2009). Esta influencia podría ir en cualquier dirección: cuando un nuevo profesional se presenta por primera vez, otros profesionales y pacientes pueden no estar seguros acerca de las competencias del nuevo profesional. Sin embargo, con el transcurso del tiempo el nuevo profesional puede ser aceptado por los pacientes y por otros profesionales. Este hecho se ha demostrado en un estudio reciente, en el que los pacientes estaban más satisfechos con la atención prestada por los profesionales de enfermería con el transcurso del tiempo (Wijers 2013). No está claro si este efecto también podría repercutir en los resultados de los pacientes, los resultados del proceso de atención y la utilización de recursos.
Para muchos metanálisis, las medidas de heterogeneidad estadística fueron altas, lo que indica inconsistencia entre los ensayos incluidos. Incluso cuando no se detectó heterogeneidad estadística, la heterogeneidad clínica puede estar presente debido a la variedad de tipos de profesionales de enfermería, los problemas de salud y los contextos incluidos en la revisión (Kontopantelis 2013). Los intervalos de confianza amplios (imprecisión) fueron otra razón frecuente para disminuir la calidad.
Para algunos estudios y resultados no fue posible realizar metanálisis debido a la diversidad de los resultados evaluados. Para estos estudios solo fue posible describir los resultados de manera narrativa, lo que hizo difícil establecer conclusiones generales.
Sesgos potenciales en el proceso de revisión
La estrategia de búsqueda se diseñó para maximizar la sensibilidad (detectar los estudios de investigación relevantes) a expensas de la especificidad (excluir los estudios de investigación irrelevantes). Aun así, los estudios de investigación relevantes fueron difíciles de identificar, y pueden haberse pasado por alto algunos estudios.
Se realizó esta revisión según los estándares Cochrane. Por lo tanto, existe certeza acerca de la calidad de la revisión. Aunque no es posible descartar el sesgo de publicación en esta área (Egger 1997), parece poco probable que este sesgo sea apreciable, ya que las comunidades clínicas y de investigación están por igual interesadas en si los profesionales de enfermería se desempeñan igual o mejor que los médicos, o si no ocurre así.
Acuerdos y desacuerdos con otros estudios o revisiones
Los resultados de esta actualización son similares a los de la revisión original(Laurant 2005) en cuanto a los resultados de salud para los pacientes, el proceso de atención y la utilización de recursos.
Otras revisiones publicadas han examinado a los profesionales de enfermería en la atención primaria (Bonsall 2008; Hollinghurst 2006; Horrocks 2002; Martin‐Misener 2015; Martínez‐González 2014a; Martínez‐González 2014b; Martínez‐González 2015a; Martínez‐González 2015b; Martínez‐González 2015c; Naylor 2010; Newhouse 2011; Swan 2015). Aunque los resultados de la presente revisión son en general compatibles con los de otras revisiones, las diferencias de los resultados se podrían explicar por las diferencias en los métodos de revisión. La revisión actual está más estrechamente relacionada con las revisiones de Martínez‐González y cols. (Martínez‐González 2014a; Martínez‐González 2014b; Martínez‐González 2015a; Martínez‐González 2015b; Martínez‐González 2015c). Aunque dichos autores utilizaron criterios de inclusión similares, se observaron diferencias en los estudios incluidos. Hay varias explicaciones posibles para estas diferencias. En primer lugar, puede haber diferencias en la manera en la que se nombró el tipo de funciones de los profesionales de enfermería en la revisión y, específicamente, si este cambio se evaluó como reemplazo o como complementación. Otras revisiones sistemáticas incluyeron algunos estudios que se consideró que involucraron a profesionales de enfermería que complementaron la atención proporcionada por los médicos, en lugar de hacerse cargo de las tareas de los médicos mediante el reemplazo (Andryukhin 2010; Denver 2003; Du Moulin 2007; Fairall 2012; Hesselink 2004; Hiss 2007; Jarman 2002; Kernick 2000; Kernick 2002; Kuethe 2011; Winter 1981). En estos estudios de complementación, los profesionales de enfermería del grupo de intervención proporcionaron una intervención que fue complementaria a la atención habitual, o los profesionales de enfermería y los médicos participaron en la atención de los pacientes y proporcionaron atención como un equipo en lugar de darla por separado. En segundo lugar, se incluyeron varios estudios que no estaban en las revisiones del equipo de González Martínez(Chambers 1978; Lattimer 1998; Moher 2001; Sanne 2010; Spitzer 1973). Sólo uno de estos cinco estudios (Spitzer 1973) se enumeró en la tabla que presentó las razones para las exclusiones. El equipo de Martinez‐Gonzalez argumentó que este estudio no fue un reemplazo real debido a la contaminación que ocurrió durante el ensayo, en el que el 30% de los pacientes también fueron tratados por médicos al final del estudio. La contaminación se consideró como un alto riesgo en este estudio, pero no como una razón para excluirlo. Los otros cuatro estudios (Chambers 1978; Lattimer 1998; Moher 2001; Sanne 2010) no se incluyeron en la revisión a texto completo de los artículos de Martinez‐Gonsalez. Por lo tanto poco, no está claro si estos artículos no se identificaron debido a las diferencias en las estrategias de búsqueda o si estos artículos se excluyeron en el estadio de revisión de los títulos y resúmenes de las revisiones de Martinez‐Gonsalez. En la Tabla 7 se presentan las diferencias metodológicas clave entre la presente revisión y las otras revisiones mencionadas aquí.
Varias revisiones encontraron resultados similares a los de la presente revisión en cuanto a las reducciones de la mortalidad en la atención primaria dirigida por un profesional de enfermería en comparación con la atención primaria dirigida por un médico, en particular en la atención en curso y la atención no urgente proporcionada por los profesionales de enfermería de atención primaria (Martínez‐González 2014a; Swan 2015). Sin embargo, una revisión (Newhouse 2011) indicó que las tasas de mortalidad fueron similares entre estos profesionales, debido posiblemente a las diferencias en los criterios de inclusión de las revisiones. Todas las otras revisiones describieron resultados similares a los de la presente revisión en cuanto al estado de salud igual o mejor para los pacientes que recibieron atención de los profesionales de enfermería en comparación con los médicos (Martínez‐González 2015a; Newhouse 2011; Swan 2015).
Otras revisiones también encontraron que la atención dirigida por un profesional de enfermería probablemente da lugar a una mayor satisfacción de los pacientes (Horrocks 2002; Martin‐Misener 2015; Martínez‐González 2014a; Swan 2015 ); una calidad de vida levemente más alta (Martínez‐González 2014a); una duración mayor de las consultas; y tasas mayores de nuevas visitas (Hollinghurst 2006; Horrocks 2002; Martin‐Misener 2015; Martínez‐González 2015b), en comparación con la atención dirigida por un médico. El hallazgo de la presente revisión de que hay poca o ninguna diferencia entre los profesionales de enfermería y los médicos en cuanto a la frecuencia de prescripciones, pruebas e investigaciones, y en el uso de otros servicios por los pacientes, es similar al de la revisión González‐Martínez 2015b. Sin embargo, Horrocks 2002 encontró que la atención dirigida por los profesionales de enfermería se asoció con más investigaciones, pero con un número similar de prescripciones. Sin embargo, es probable que los resultados de la revisión Horrocks 2002 estén desactualizados.
Aunque no existe certeza acerca de los efectos de la atención dirigida por un profesional de enfermería sobre el coste de la atención, la mayoría de las otras revisiones (Hollinghurst 2006; Martin‐Misener 2015; Martínez‐González 2015b; Swan 2015)informaron que puede haber poca o ninguna diferencia en los costes de la atención entre la atención dirigida por un profesional de enfermería y la atención dirigida por un médico. Naylor 2010 y Newhouse 2011 indicaron que la atención de enfermería se asoció con costes menores. Esta diferencia se podría explicar porque se centraron solamente en los EE.UU. (Newhouse 2011), incluyeron ensayos no aleatorios, y porque se centraron en los profesionales de enfermería avanzados y los profesionales de enfermería adiestrados(Naylor 2010; Newhouse 2011). Los autores de todas las revisiones coinciden en que la evidencia de los efectos de la atención dirigida por un profesional de enfermería sobre los costes de la atención es de baja calidad.
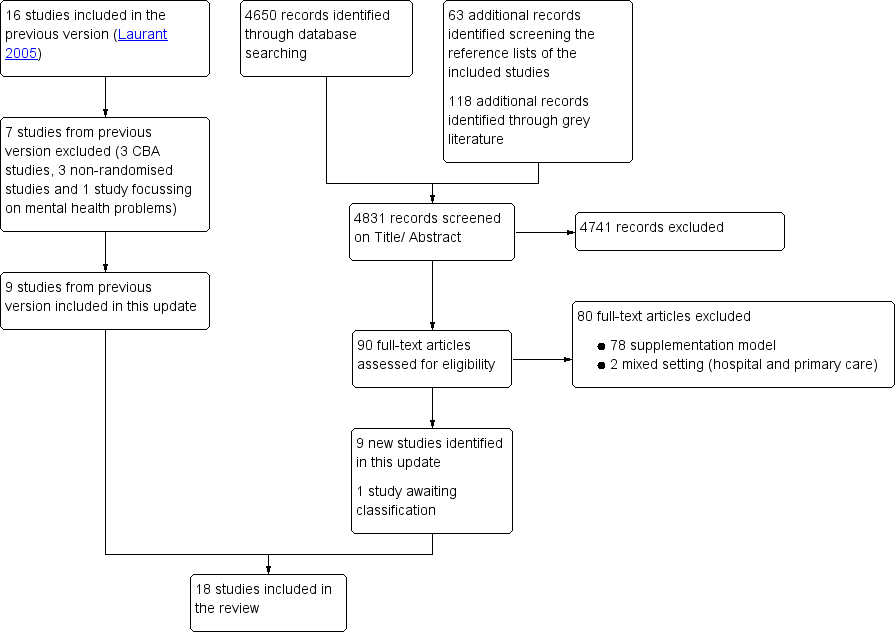
Study flow diagram.
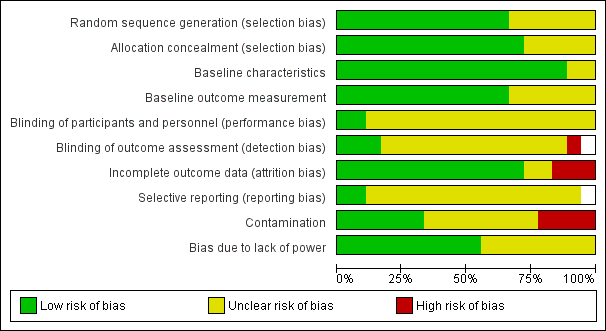
Risk of bias graph: review authors' judgements about each risk of bias item presented as percentages across all included studies.

Risk of bias summary: review authors' judgements about each risk of bias item for each included study.
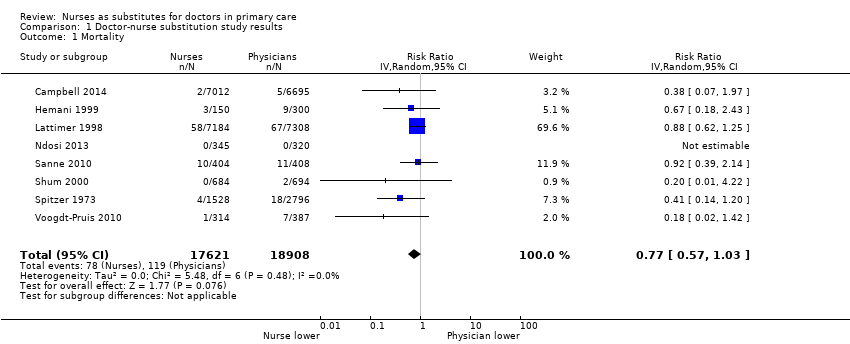
Comparison 1 Doctor‐nurse substitution study results, Outcome 1 Mortality.
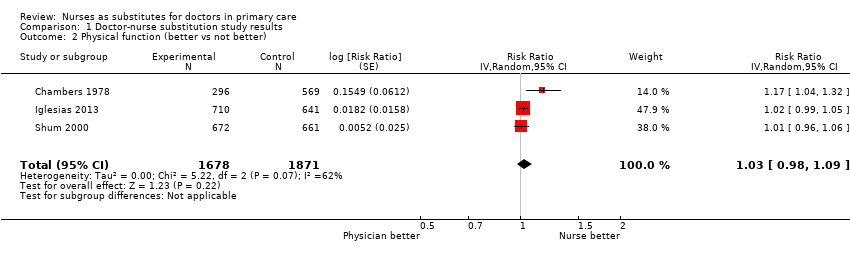
Comparison 1 Doctor‐nurse substitution study results, Outcome 2 Physical function (better vs not better).

Comparison 1 Doctor‐nurse substitution study results, Outcome 3 Pain.

Comparison 1 Doctor‐nurse substitution study results, Outcome 4 Quality of life.

Comparison 1 Doctor‐nurse substitution study results, Outcome 5 Systolic blood pressure.

Comparison 1 Doctor‐nurse substitution study results, Outcome 6 Diastolic blood pressure.

Comparison 1 Doctor‐nurse substitution study results, Outcome 7 Total cholesterol.

Comparison 1 Doctor‐nurse substitution study results, Outcome 8 HbA1c.
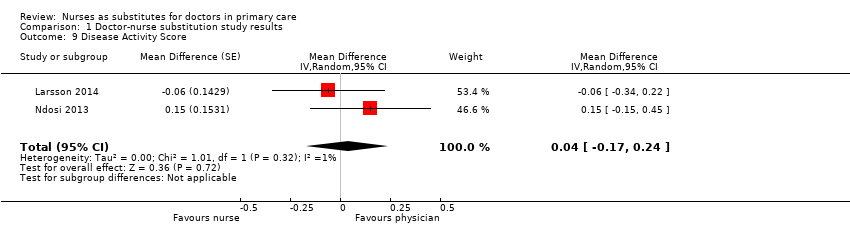
Comparison 1 Doctor‐nurse substitution study results, Outcome 9 Disease Activity Score.

Comparison 1 Doctor‐nurse substitution study results, Outcome 10 Patient satisfaction.
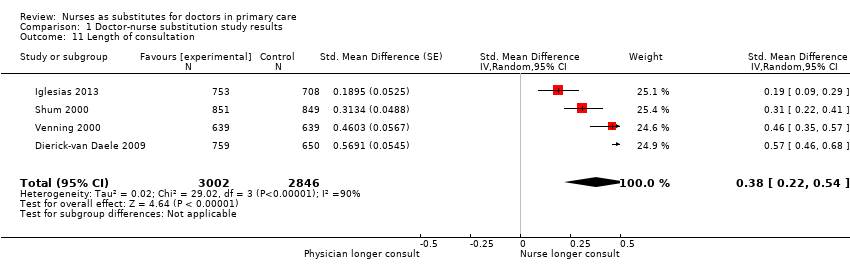
Comparison 1 Doctor‐nurse substitution study results, Outcome 11 Length of consultation.

Comparison 1 Doctor‐nurse substitution study results, Outcome 12 Scheduled return visits.

Comparison 1 Doctor‐nurse substitution study results, Outcome 13 Attended return visit.
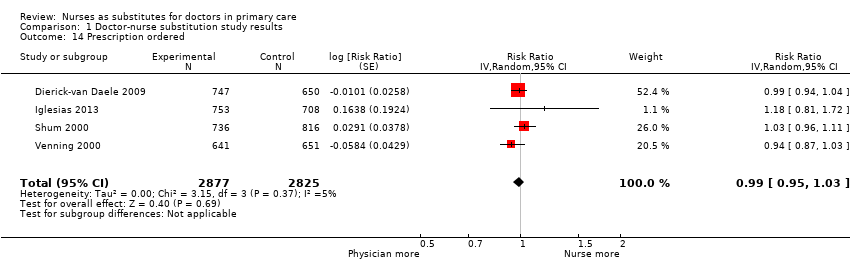
Comparison 1 Doctor‐nurse substitution study results, Outcome 14 Prescription ordered.
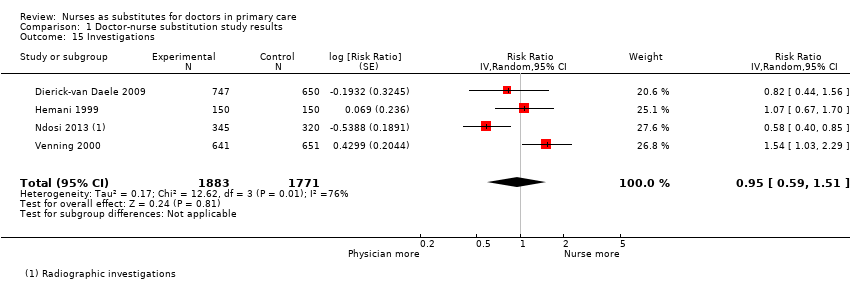
Comparison 1 Doctor‐nurse substitution study results, Outcome 15 Investigations.
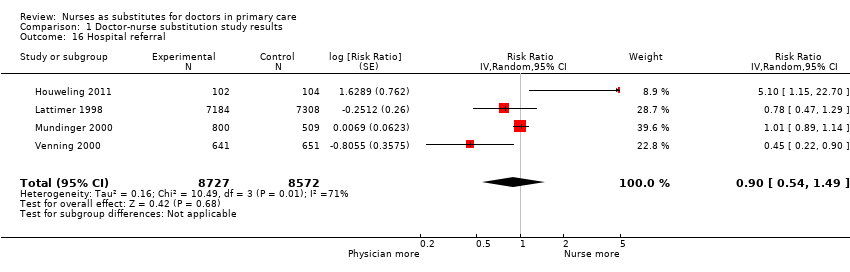
Comparison 1 Doctor‐nurse substitution study results, Outcome 16 Hospital referral.

Comparison 1 Doctor‐nurse substitution study results, Outcome 17 Attendance at accident and emergency.

Comparison 1 Doctor‐nurse substitution study results, Outcome 18 Hospital admission.
| Nurse‐led primary care compared with doctor‐led primary care for patient outcomes, process of care and utilisation | ||||||
| Patient or population: all presenting patients in primary care Settings: UK (n = 6), Netherlands (n = 3), USA (n = 3), Canada (n = 3), Sweden (n = 1), Spain (n = 1), South Africa (n = 1) Intervention: substitution of doctors with nurses for primary care Comparison: routine doctor‐led primary care | ||||||
| Outcomes | Impact | Number of participants | Certainty of the evidence | |||
| Illustrative comparative risks* (95% CI) | Effect estimate | Results in words | ||||
| Assumed risk | Corresponding risk | |||||
| Doctor‐led primary care | Nurse‐led primary care | |||||
| Mortality follow‐up: 0.5 to 48 months Mean = 21 (SD 19) months | 6.29 per 1000 | 4.84 per 1000 (4 to 6) | RR 0.77 (0.57 to 1.03) | Nurse‐led primary care may lead to slightly fewer deaths among certain groups of patients, compared to doctor‐led care. However, the results vary and it is possible that nurse‐led primary care makes little or no difference to the number of deaths. | 36,529 (8)1 | ⊕⊕⊝⊝ a |
| Patient health status follow‐up: 0.2 to 47 months Mean = 14 (SD 12) months | Compared to doctor‐led care, nurse‐led primary care probably slightly improves blood pressure control; probably leads to similar outcomes for diabetes indicators and measures of disease activity and pain in people with rheumatological disorders; may lead to similar outcomes for physical functioning; and leads to similar outcomes for cholesterol | Clinical outcomes (3) Self‐reported measurements (13)2 | ⊕⊕⊕⊝ b | |||
| Satisfaction and preferences follow‐up: 0.5 to 25 months Mean = 12 (SD 10) months | Patient satisfaction is probably slightly higher in nurse‐led primary care compared to doctor‐led primary care. | 16,993 | ⊕⊕⊕⊝ c | |||
| Quality of life follow‐up: 6 to 25 months Mean = 15 (SD 9) months | Quality of life may be slightly higher in nurse‐led primary care compared to doctor‐led primary care. | 16,002 | ⊕⊕⊝⊝d | |||
| Process of care follow‐up: 0.5 to 48 months Mean = 17 (SD 15) months | We are uncertain of the effects of nurse‐led care on process of care because the certainty of this evidence was assessed as very low. | (10)5 | ⊕⊝⊝⊝e Very low | |||
| Utilisation (consultations, prescriptions, tests, investigations, and services) follow‐up: 0.2 to 48 months Mean = 14 (SD 13) months | Consultations: Compared to doctor‐led primary care, consultation length is probably longer in nurse‐led primary care; there may be little or no difference in scheduled return visits; and the number of return visits attended is slightly higher for nurses. Prescriptions, tests and investigations: There is little or no difference between nurses and doctors in the number of prescriptions and may be little or no difference in the number of tests and investigations ordered. Use of other services: There may be little or no difference between nurses and doctors in the likelihood of hospital referrals and hospital admissions; little or no difference in attendance at accident and emergency units. | (16)6 | ⊕⊕⊕⊝ f | |||
| Costs follow‐up: 0.2 to 48 months Mean = 14 (SD 14) months | We are uncertain of the effects of nurse‐led care on the cost of care because the certainty of this evidence was assessed as very low. | (9)7 | ⊕⊝⊝⊝ g | |||
| *The basis for the assumed risk is the mean control group risk across studies for pooled results. The corresponding risk is based on the assumed risk in the comparison group and the relative effect of the intervention (and its 95% CI). aDowngraded by 1 for imprecision owing to a wide confidence interval that includes no effect and downgraded by 1 for clinical heterogeneity as the trials contributing to this estimate are quite varied (some focus on people with specific health issues and others on more generalist primary care attenders). bDowngraded by 1. Outcomes were downgraded by 1 for inconsistency, imprecision, indirectness or high risk of bias. The certainty of the evidence is moderate for all outcomes listed, apart for physical functioning for which the certainty of evidence was low and cholesterol for which the certainty of evidence was high. cDowngraded by 1 for inconsistency. dDowngraded by 1 for imprecision, due to a wide confidence interval that touches on the null, and 1 for inconsistency eNon‐comparable results and therefore downgraded to very low. fDowngraded by 1. Outcomes were downgraded by 1 for inconsistency, imprecision or high risk of bias. gNon‐comparable results (the types of costs assessed varied widely and a range of different approaches were used to value resources and calculate costs) and therefore downgraded to very low. 1Campbell 2014; Hemani 1999; Lattimer 1998; Ndosi 2013; Sanne 2010; Shum 2000; Spitzer 1973; Voogdt‐Pruis 2010. 2Campbell 2014; Chambers 1978; Chan 2009; Dierick‐van Daele 2009; Houweling 2011; Iglesias 2013; Larsson 2014; Lattimer 1998; Lewis 1967; Moher 2001; Mundinger 2000; Sanne 2010; Shum 2000; Spitzer 1973; Venning 2000; Voogdt‐Pruis 2010. 3Campbell 2014; Dierick‐van Daele 2009; Iglesias 2013; Larsson 2014; Mundinger 2000; Shum 2000; Venning 2000. 4Campbell 2014; Chan 2009; Dierick‐van Daele 2009; Houweling 2011; Mundinger 2000; Ndosi 2013. 5Campbell 2014; Dierick‐van Daele 2009; Houweling 2011; Moher 2001; Mundinger 2000; Ndosi 2013; Shum 2000; Spitzer 1973; Venning 2000; Voogdt‐Pruis 2010. 6Campbell 2014; Chan 2009; Dierick‐van Daele 2009; Hemani 1999; Houweling 2011; Iglesias 2013; Larsson 2014; Lattimer 1998; Lewis 1967; Moher 2001; Mundinger 2000; Ndosi 2013; Shum 2000; Spitzer 1973; Venning 2000; Voogdt‐Pruis 2010. 7Campbell 2014; Chambers 1978; Chan 2009; Dierick‐van Daele 2009; Lattimer 1998; Lewis 1967; Ndosi 2013; Spitzer 1973; Venning 2000. *there may be additional data in the Campbell 2014 articles that have not been extracted | ||||||
| GRADE Working Group grades of evidence. †Substantially different = a large enough difference that it might affect a decision. | ||||||
| Study | Various health status outcomes |
| Health status: ‐ Emotional function: no differencea ‐ Social function: no differencea | |
| Health status: ‐ Severity of symptoms: Nurse group had greatest improvement. Difference adjusted for baseline 2.3 (95% CI 1.4 to 3.1), P < 0.001 | |
| Health status: ‐ Burden of illness: nurse vs doctor (MD 0.27, P = 0.16) ‐ Concerns about illness: nurse vs doctor (MD 0.11, P = 0.20) ‐ Absence of work: both nurse and doctor 1.11 daysa,b ‐ Ability to perform daily activities: nurse mean 2.53, doctor mean 2.69a,b | |
| Objective measures of patient health (MD (95% CI)): ‐ BMI (kg/m2): nurse ‐0.2 (‐0.5; 0.1), doctor ‐0.3 (‐0.6; ‐0.1), P = 0.377 ‐ Cholesterol/HDL: nurse ‐0.03 (‐0.1; 0.2), doctor ‐0.07 (‐0.1; ‐0.2), P = 0.321 Health status: ‐ Diabetes symptom score: no differencea,b ‐ Fatigue: no differencea,b ‐ Cognitive distress: no differencea,b | |
| Health status: ‐ DAS28‐CRP: nurse vs doctor 0.05 (95% CI ‐0.28 to 0.19, P = 0.70) ‐ ESR (mm/h): nurse vs doctor ‐1.05 (95% CI ‐3.97 to 1.86, P = 0.47) ‐ CRP (mg/L): nurse vs doctor ‐1.07 (95% CI ‐2.02 to ‐0.12, P = 0.03) ‐ Swollen joints (28): nurse vs doctor 0.13 (95% CI ‐2.18 to 0.61, P = 0.60) ‐ Tender joints (28): nurse vs doctor 0.33 (95% CI ‐0.47 to 1.13, P = 0.42) ‐ VAS global health (mm): nurse vs doctor 4.29 (95% CI ‐2.58 to 11.16, P = 0.22) | |
| Health status: ‐ Resolution of symptoms in nurse group from 16.33 to 18.39 (possible range 6 to 24; higher scores mean fewer reductions in complaints). Doctors no change. P < 0.02 | |
| Health status (lifestyle factor): ‐ Smoking: no differencea ‐ Blood pressure (mmHg) systolic: nurse 148 (142 to 153), GP 147 (135 to 153), P = 0.82a ‐ Blood pressure (mmHg) diastolic: nurse 80 (74 to 87), GP 81 (75 to 83), P = 0.82a ‐ Cholesterol (mmol/L) total: nurse 5.4 (5.2 to 5.5), GP 5.5 (5.0 to 5.9), P = 0.61a ‐ Cholesterol (mmol/L) high‐density lipoprotein: nurse 1.2 (1.1 to 1.3), GP 1.2 (1.2 to 1.3), P = 0.83a | |
| Health status (10 dimensions): no differenceb Objective measures of patient health: ‐ Asthma ‐ peak flow: NP 292.82 (94.2), GP 319.90 (136.56), P = 0.365 | |
| Health status: ‐ Fatigue ITT: nurse < doctor; mean (95% CI) 3.38 (‐2.01 to 8.76), P = 0.0171 ‐ Stiffness ITT: nurse < doctor; mean (95% CI) 8.91 (‐2.66 to 20.5), P = 0.0113 ‐ RAQoL ITT: nurse < doctor; mean (95% CI) ‐0.14 (‐1.77 to 1.49), P = 0.0001 ‐ HAQ ITT: nurse > doctor; mean (95% CI) ‐0.07 (‐0.21 to 0.07), P < 0.0001 ‐ HAD‐Anxiety ITT: nurse < doctor; mean (95% CI) 0.54 (‐0.36 to 1.43), P = 0.0179 ‐ HAD‐Depression ITT: nurse < doctor; mean (95% CI) 0.12 (‐0.65 to 0.89), P = 0.0004 ‐ ASES ITT: nurse > doctor; mean (95% CI) ‐0.92 (‐4.96 to 3.12), P = 0.0019 | |
| Health status: ‐ Cumulative failure: nurse 48%, doctor 44% HR (95% CI) 1.09 (0.89 to 1.33) ‐ All virological failure: nurse 11%, doctor 10% HR (95% CI) 1.15 (0.75 to 1.76) ‐ Toxicity failure: nurse 17%, doctor 16% HR (95% CI) 1.04 (0.74 to 1.45) ‐ Death: nurse 3%, doctor 3% HR (95% CI) 0.92 (0.39 to 2.17) | |
| Health status: ‐ Physical function (3 indicators): nurses 86%, doctors 88%b ‐ Emotional function: nurses 58%, doctors 58%b ‐ Social function: nurses 84%, doctors 83%b | |
| Health status: no differencea | |
| Objective measures of patient health: ‐ LDL cholesterol: nurse 2.9, doctors 3.0, P = 0.07 ‐ BMI: nurse 27.2, doctor 27.2, P = 0.87 Health status (lifestyle factor): ‐ Smoking: 4% of smokers in the GP group (4/102) Subgroup: at‐risk patients ‐ Systolic blood pressure: nurse 144.0, doctor 147.6, P = 0.1 ‐ Total cholesterol: nurse 5.2, doctor 5.6, P = 0.006 ‐ LDL cholesterol: nurse 3.1, doctor 3.3, P = 0.16 ‐ BMI: nurse 28.6, doctor 28.6, P = 0.78 | |
| a Authors reported no effect size or reported effect sizes in graphs (no exact effect sizes extracted). b No p‐value reported. ASES: Standardized Shoulder Assessment Form. BMI: body mass index. CI: confidence interval. CRP: C‐reactive protein. DAS28: disease activity score 28. ESR: erythrocyte sedimentation rate. GP: general practitioner. HAD: Hospital and Anxiety Depression Scale. HAQ: Health Assessment Questionnaire. HDL: high‐density lipoprotein. HR: heart rate. ITT: intention‐to‐treat. LDL: low‐density lipoprotein. MD: mean difference. NP: nurse practitioner. RAQoL: Rheumatoid Arthritis Quality of Life Questionnaire. VAS: visual analogue scale. *there may be additional data in the Campbell 2014 articles that have not been extracted | |
| Study | Satisfaction, preference |
| Overall satisfaction: nurse triage vs GP triage MD 2.60 (95% CI 0.58 to 4.63)a | |
| Overall satisfaction: nurse vs doctor (0 to 10), MD ‐0.015, P = 0.83 Communication/attitude (1 to 6) ‐ Understanding: nurse vs doctor, MD ‐0.015, P = 0.41 ‐ Telling the plan: nurse vs doctor, MD ‐0.02, P = 0.74 ‐ Explaination goals and treatment: nurse vs doctor, MD ‐0.01, P = 0.76 ‐ Importance advice: nurse vs doctor, MD ‐0.07, P = 0.17 ‐ Appropriate attention: nurse vs doctor, MD 0.01, P = 0.78 Provision of information (1 to 6) ‐ Cause of problems: nurse vs doctor, MD ‐0.08, P = 0.21 ‐ Relief of symptoms: nurse vs doctor, MD ‐0.04, P = 0.47 ‐ Duration of illness: nurse vs doctor, MD ‐0.09, P = 0.25 ‐ Change of recurrence: nurse vs doctor, MD ‐0.15, P = 0.08 ‐ What to do: nurse vs doctor, MD ‐0.06, P = 0.45 Subgroup at least 1 chronic condition Satisfaction: NP 8.35 (1.07) vs GP 8.11 (1.32), P = 0.02 Judgement seeing the right professional: P = 0.35b Attending same provider in future: P = 0.67 Recommendation to others: P = 0.41 | |
| Satisfaction: ‐ Satisfaction with duration of the visit (0 to 10): doctor 8.1, nurse 8.4; MD (95% CI%) 0.256 (0.016 to 0.496)a ‐ Satisfaction with personal attention (0 to 10): doctor 8.1, nurse 8.4, MD (95% CI%) 0.240 (0.003 to 0.476)a ‐ Satisfaction with explanations and information received in the visit (0 to 10): doctor 8.3, nurse 8.5, MD (95% CI%) 0.240 (0.015 to 0.495)a Provider preference: More than 40% of patients in each group expressed indifference. In the control group, 13.9% of patients would prefer to be seen by a nurse, as opposed to 20.9% in the intervention group.a | |
| Confidence: ‐ NRS confidence: nurse vs doctor: 0.20 (95% CI ‐0.29 to 0.69), P = 0.42 | |
| Provider preference: doctor 5.72 vs nurse 9.80, P < 0.001. Possible range 0 to 20; higher scores indicate a more positive view of the provider. | |
| Satisfaction (9 items): no difference in overall satisfaction, or on any of the 9 subscalesa Would recommend provider to others: no differencea | |
| Leeds Satisfaction Questionnaire ‐ LSQ Week 26 ‐ LSQ‐General: nurse vs doctor effect size: 0.17, P = 0.036 ‐ LSQ‐Information: nurse vs doctor effect size: 0.08, P = 0.327 ‐ LSQ‐Empathy: nurse vs doctor effect size: 0.05, P = 0.557 ‐ LSQ‐Technical: nurse vs doctor effect size: 0.08, P = 0.293 ‐ LSQ‐Attitude: nurse vs doctor effect size: 0.14, P = 0.082 ‐ LSQ‐Access: nurse vs doctor effect size: 0.01, P = 0.936 Week 52 ‐ LSQ‐General: nurse vs doctor effect size: 0.12, P = 0.183 ‐ LSQ‐Information: nurse vs doctor effect size: 0.09, P = 0.301 ‐ LSQ‐Empathy: nurse vs doctor effect size: 0.05, P = 0.578 ‐ LSQ‐Technical: nurse vs doctor effect size: 0.08, P = 0.369 ‐ LSQ‐Attitude: nurse vs doctor effect size: 0.08, P = 0.375 ‐ LSQ‐Access: nurse vs doctor effect size: 0.10, P = 0.248 | |
| Satisfaction: ‐ Professional care: nurse 79.2 (13.4) vs GP 76.7 (15.1), possible range 0 to 100, P = 0.002 ‐ Relationship to provider: nurse 64.3 (15.7) vs GP 64.2 (16.9), possible range 0 to 100, P = 0.945 ‐ Adequacy of time: nurse 73.3 (16.9) vs GP 67.7 (19.3), possible range 0 to 100, P < 0.001 ‐ Explanation helpful: nurse 88.8% vs GP 87.3%, P = 0.359 ‐ Advice helpful: nurse 86.9% vs GP 83.9%, P = 0.060 Provider preference: GP group: 47.5% prefer GP, 2.0% nurse, 50.5% no preference. Nurse group: 31.5% prefer GP, 7.5% nurse, 61% no preference; P < 0.001 | |
| Satisfaction: nurses 96%, doctors 97%a | |
| Satisfaction: Adults ‐ Communication: NP 4.35 (0.54) vs GP 4.21 (0.60), P = 0.001 ‐ Distress relief: NP 4.43 (0.47) vs GP 4.26 (0.57), P = 0.001 ‐ Professional care: NP 4.44 (0.49) vs GP 4.22 (0.57), P < 0.001 Children ‐ General: NP 4.39 (0.46) vs GP 4.17 (0.57), P < 0.001 ‐ Communication with parent: no difference ‐ Communication with child: NP 4.16 (0.63) vs GP 3.67 (0.77), P < 0.001 ‐ Distress relief: NP 4.41 (0.53) vs GP 4.21 (0.64), P = 0.002 ‐ Adherence intent: no difference | |
| ano p‐value reported b authors reported no effect size or reported effect sizes in graphs (no exact effect sizes extracted) CI: confidence interval. GP: general practitioner. LSQ: Leeds Satisfaction Questionnaire. MD: mean difference. NP: nurse practitioner. NRS: Numeric Rating Scale *there may be additional data in the Campbell 2014 articles that have not been extracted | |
| Study | Compliance | Other |
| Rating information (5 items): no differencea,b | ||
| Enablement: nurse vs GP, MD = 0.65 (CI ‐1.50 to 0.19), P = 0.13 | ||
| Patient adherence to medical treatment after 1 year of follow‐up nurse vs doctor (95% CI) Medication blood pressure: 92.2 vs 84.9 (1.06 to 3.73; P = 0.03) Forgetting to take medication: group difference 1.32 (0.88 to 1.97; P = 0.18) ‐ Never: 52.6 vs 61.0 ‐ Sometimes: 46.8 vs 39.0 Patient lifestyle after 1 year of follow‐up nurse vs doctor (95% CI) ‐ Exercise: 28.6 vs 27.3 (0.73 to 1.67; P = 0.79) ‐ Alcohol 5 days per week at most: 78.6 vs 75.5 (0.79 to 2.01; P = 0.33) ‐ Alcohol 2 for woman, 3 for man at most: 79.1 vs 80.6 (0.53 to 1.56; P = 0.73) ‐ Fat intake: 6.5 vs 7.2 (0.02 to 1.28; P = 0.04) | ||
| aTrial authors reported only the direction of the outcome; it is unknown if the difference is statistically significant. bTrial authors reported no effect size or reported effect sizes on graphs (no exact effect sizes extracted). CI: confidence interval. GP: general practitioner. MD: mean difference. | ||
| Study | Provider care |
| Difficulty with (nurse triage vs GP triage, MD (95% CI): Phone access: 6.49 (–1.26 to 14.25)a Receiving prompt care: 6.63 (3.23 to 10.03)a Seeing a doctor or nurse: 3.67 (–0.37 to 7.71)a Getting medical help: 5.09 (2.69 to 7.50)a Convenience of care 3.68 (1.13 to 6.24)a Problem resolution: nurse triage vs GP triage: 0.41 (–1.86 to 2.67)a Process indicators: ‐ Number of contacts per person: nurse vs GP triage: 1·04 (1·01 to 1·08)a ‐ 23% in the GP‐triage group and 12% in the nurse‐triage group had just 1 contact after their initial consultation requestb | |
| Adherence to guidelines: nurse 79.8%, doctor 76.2%a,c | |
| Process indicators: ‐ Patients with last retina control > 24 months ago (n = 64) referred to an ophthalmologist: nurse 24/34 (70.6) vs GP 11/30 (36.7), P = 0.007 ‐ Patients with feet at‐risk (n = 109) for whom measures were taken: nurse 34/60 (56.7) vs GP 13/49 (26.5), P = 0.001 ‐ Patients referred to an internist to start insulin therapy: nurse 10/102 (9.8) vs GP 2/104 (1.9), P = 0.015 ‐ Patients with HbA1c ≥ 7 at baseline (n = 120), for whom glucose‐lowering therapy was intensified: nurse 53/64 (82.8) vs GP 28/56 (50.0), P = 0.001 ‐ Patients with BP > 140/90 at baseline (n = 170) for whom blood pressure‐lowering therapy was intensified: nurse 42/85 (49.4) vs GP 24/85 (28.2), P = 0.005 ‐ Patients not meeting target values for lipid profile at baseline (n = 55), for whom lipid‐lowering therapy was intensified: nurse 13/29 (44.8) vs GP 13/26 (50.0), P = 0.147 | |
| Adequate assessment: ‐ Clinical assessment: nurse vs GP: 9% (95% CI ‐3 to 22), P = 0.13 ‐ Blood pressure: no differencec ‐ Cholesterol: no differencec ‐ Smoking status: no differencec | |
| Documentation of provider behaviour diabetes care: ‐ Education (8 items): overall ‘any education’: nurse 84,9% vs medical doctor 42.4% (P < 0.001). With regard to specific items, nurse more education: 4 out of 7 topics: nutrition, weight, exercise, and medication (P < 0.01) ‐ History taken (5 items): no difference ‐ Monitoring (9 items): nurse ordered/carried out more laboratory tests, such as urinalysis (nurse 80.2%, medical doctor 55.9%, P < 0.01) and glycosylated haemoglobin (A1C value) (nurse 81.4, medical doctor 66.1, P < 0.05); nurse reported more frequently height of patients (nurse 91.9%, medical doctor 71.2%, P < 0.01). On other 6 items, no difference ‐ Referral (1 item): no differences | |
| Interventions: ‐ Giving patient education: nurse > doctor; RR (95% CI) 1.76 (1.15 to 2.69), P = 0.009 ‐ Giving psychosocial support: nurse > doctor; RR (95% CI) 3.29 (2.55 to 4.24), P < 0.0001 | |
| Provision of information: ‐ Self‐medication: nurse 22.2% vs GP 13.7%, P < 0.001 ‐ Self‐management: nurse 81.7% vs GP 57.6%, P < 0.001 | |
| Adequate treatment: ‐ Drug treatment: nurses 71%, doctors 75%a ‐ Management of episodes: nurses 69%, doctors 66%a | |
| Lifestyle and medical intervention nurse vs doctor: ‐ Smoking behaviour 8.2% vs 3.2%a ‐ Blood pressure 35.4% vs 26.6% (1.01 to 2.24; P = 0.04) ‐ Lipids 47.1 vs 22.3 (1.98 to 4.43; P < 0.01) ‐ Weight 36.9 vs 7.6 (4.26 to 12.52; P < 0.01) ‐ Exercise 19.4 vs 3.2a ‐ Food intake 14.6 vs 3.2a ‐ Medication 22.3 vs 14.7 (0.99 to 2.59; P = 0.05) ‐ None 22.8 vs 43.2 (1.69 to 3.86; P < 0.01) Asked about the use of medication: nurse vs doctor Group difference 2.12 (1.38 to 3.26; P < 0.01) ‐ Never 57.4 vs 75.4 ‐ Sometimes 20.0 vs 14.4 ‐ Often 22.1 vs 9.7 | |
| Examinations: nurse vs GP: MD 0.19 (95% CI ‐0.03 to 0.71), P = 0.072 | |
| aNo P value reported. bTrial authors reported only the direction of the outcome; it remains unknown whether the difference is statistically significant. cTrial authors reported no effect size or reported effect sizes in graphs (no exact effect sizes extracted). CI: confidence interval. GP: general practitioner. MD: mean difference. RR: risk ratio. *there may be additional data in the Campbell 2014 articles that have not been extracted | |
| Study | Number, length, and frequency of consultations | Numbers of prescriptions, tests, and investigations | Use of other services |
| Referrals: nurse 12%, doctor 14.2%, P = 0.24a | |||
| Compared to qualified doctors Consultation rate: Nurses 3.52 vs qualified doctors 4.03 (P > 0.05) Compared to residents (trainee doctors) Consultation rate: Nurses 3.52 vs residents 2.95 (P < 0.05) | Mean utilisation rate: Compared to qualified doctors Tests & investigations: Lab tests: NP 32.67, doctor 29.46, P > 0.05 Radiological tests (total): NP 1.68. doctor 1.37, P > 0.05 ‐ CT/MRI: NP 0.32, doctor 0.13, P < 0.05 ‐ Ultrasound: NP 0.16, doctor 0.07, P < 0.05 Compared to residents (trainee doctors) Tests & investigations: Lab tests: NP 32.67, doctor 28.26, P > 0.05 ‐ Urinalysis: NP 1.31, doctor 0.99, P < 0.05 ‐ Thyroid function: NP 0.37, doctor 0.19, P < 0.05 Radiological tests: NP 1.68, doctor 1.48, P > 0.05 | Mean utilisation rate: Compared to qualified doctors Hospital admission: NP 0.43, doctor 0.33, P > 0.05 Emergency room visits: NP 1.22, doctor 1.23, P > 0.05 Specialty visits: NP 5.35, doctor 4.26, P > 0.05 Compared to residents (trainee doctors) Hospital admission: NP 0.43, doctor 0.31, P > 0.05 Emergency department visits: NP 1.22, doctor 1.05, P > 0.05 Specialty visits: NP 5.35, doctor 4.21, P > 0.05 | |
| Mean number of visits: nurse 6.1, GP 2.8 (P < 0.0001) Total duration of visits: significantly higher in nurse groupa Consultation of nurses' patients with GP: Median number of these consultations per patient was 1.4 (25 to 75 quartiles: 0.0 to 2.0) with median time of 1.0 (25 to 75 quartiles: 0.0 to 3.3) minute | |||
| Level of resolution by nurses: Nurses led 86.3% (95% CI 83.6 to 88.7) of consultations without referral to GP (referrals according to protocol indication not included) | |||
| Proportion nurse‐led vs doctor‐led: ‐ Cortisone injections in addition to regular rheumatologist monitoring visits (1:0.7; P = 0.463) ‐ Blood tests (1:3.9; P = 0.014) ‐ Radiography (1:1.6; P = 0.162) ‐ Pharmacological therapy (1:1.1; P = 0.029) | Proportion nurse‐led vs doctor‐led: ‐ Additional telephone calls to a rheumatology nurse (1:1.8; P = 0.060) ‐ Additional telephone calls to a rheumatologist (1:1.9; P =0.287) ‐ Additional rheumatologist visits (1:2.4; P = 0.077) ‐ Team rehabilitation in in‐patient settings (0:79; P = 0.086) ‐ Team rehabilitation in out‐patient settings (15:0; P = 0.135) ‐ Occupational therapist treatments (0:3.0; P = 0.162) ‐ Psychosocial treatments (0:1.0; P = 0.152) ‐ Specialist consultations (1:1.0; P = 0.949) | ||
| Impact on GP workload: ‐ Telephone advice from GP: fewer with nurse‐led care, 35% reductionb ‐ Surgery visits: 10% fewer with nurse‐led careb ‐ Home visits: 6% fewer home visits during intervention periodb | Hospital admission within 24 hours: nurse 2%, GP 6.5%, RR 0.31 (95% CI 0.07 to 1.42) Hospital admission within 3 days: nurse 5%, GP 6.5%, RR 0.77 (95% CI 0.26 to 2.28) Emergency department visit: nurse 3%, GP 2%, RR 1.84 (95% CI 0.31 to 10.82) | ||
| Consultation length: doctor 15 minutes, nurse 30 minutesc Consultation rate: doctor 150 visits, nurse 345 visitsc | Days in hospital: doctor 68 days, nurse 45 daysc | ||
| Prescriptions: ‐ Antihypertensives: no difference, P = 0.35a ‐ Lipid lowering: no difference, P = 0.63a ‐ Antiplatelet: nurse 8% (95% CI 1% to 9%) more than GP (P = 0.031) | |||
| Consultation rate: Doctor patients had higher primary care utilisation than nurse | Speciality visits: no differenced, P = 0.61 | ||
| Consultation length: Mean total consultation time: nurse 111 min, doctor 71 mina,b Consultation rate: Patients attending all 5 sessions: nurse 92%, doctor 85%a,b | ‐ Change in medicines: nurse < doctor; RR (95% CI) 0.58 (0.43 to 0.79), P = 0.0006 ‐ Dosage changes: nurse < doctor; RR (95% CI) 0.52 (0.34 to 0.79), P = 0.0020 ‐ Intra‐articular injections: nurse < doctor; RR (95% CI) 0.82 (0.50 to 1.35), P = 0.4400 ‐ Intramusclar injections: nurse < doctor; RR (95% CI) 0.73 (0.45 to 1.19), P = 0.2100 ‐ Non‐protocol bloods: nurse < doctor; RR (95% CI) 1.02 (0.74 to 1.40), P = 0.9100 | ‐ Referral to physiotherapy: nurse < doctor; RR (95% CI) 1.21 (0.62 to 2.39), P = 0.5800 ‐ Referral to occupational therapy: nurse < doctor; RR (95% CI) 1.74 (0.76 to 3.96), P = 0.1900 ‐ Referral to podiatry: nurse < doctor; RR (95% CI) 0.89 (0.37 to 2.14), P = 0.8000 ‐ Conferrals: nurse < doctor; RR (95% CI) 2.92 (1.77 to 4.83), P < 0.0001 ‐ Referral to other consultants: nurse < doctor; RR (95% CI) 0.58 (0.11 to 3.11), P = 0.5200 | |
| Out‐of‐hours calls: nurse 0.9% vs GP 1.8%, P = 0.218 | |||
| Physical examinations: nurse vs GP; MD 0.19 (95% CI ‐0.03 to 0.71), P = 0.072 | |||
| Referred to professional nurse vs doctor: ‐ Dietician 17.0 vs 8.9b ‐ Physiotherapist 3.1 vs 1.9b ‐ Cardiovascular specialist 1.9 vs 6.3b ‐ Visited a cardiovascular specialist 46.3 vs 45.3 (0.84 to 1.79; P = 0.30) ‐ Admission into hospital because of CVD 10.4 vs 13.4 (0.43 to 1.38; P = 0.38) | |||
| aTrial authors reported no effect size or reported effect sizes in graphs (no exact effect sizes extracted). bNo P value reported. cTrial authors reported only the direction of the outcome; it remains unknown whether the difference is statistically significant. dToo many numbers to report. CI: confidence interval. CT: computed tomography. CVD: cardiovascular disease. GP: general practitioner. MRI: magnetic resonance imaging. NP: nurse practitioner. RR: risk ratio. *there may be additional data in the Campbell 2014 articles that have not been extracted | |||
| Study | Costs based on | Cost outcomes |
|
| Total costs: Mean 28‐day cost estimates for primary outcome contacts: Nurses ‐ £75·68 (63·09) GPs ‐ £75·21 (65·45) | |
|
| Costs of medication use: Nurses – mean £35.5 (SD £48.8) Doctors – mean £71.7 (SD £ 63.1) Mean difference (adjusted baseline level): £39.6 (95% CI 24.2 to 55.1); P < 0.001 | |
|
| Total direct healthcare costs: Nurses: €31.94 Doctors: €40.15 Mean difference (95% CI): €8.21 (3.56 to 12.85); P = 0.001 Total direct healthcare costs and productivity: Nurses: €140.40 Doctors: €145.87 Mean difference (95% CI): €1.48 (‐4.94 to 7.90); P = 0.65 Subgroup younger than 65 years: Total direct healthcare costs and productivity: Nurses: €161.57 Doctors: €170.75 Mean difference (95% CI): €9.18 (4.84 to 13.88); P < 0.001 | |
|
| Total annual rheumatology care per patient: Nurse‐led: €14107,70 Doctor‐led: €16274,90 Mean difference (95% CI): −2167.2 (−3757.3 to −641.7) P = 0.004 | |
|
| Annual direct cost:Nurse‐led service: ‐ £81,237 more than doctor‐led service Savings: Generated in reduced hospital and primary care utilisation £94,422 Net reduction in costs:with nurse‐led service £3,728 to £123,824 (determined by sensitivity analysis) | |
|
| Total direct cost per year: Nurses ‐ $3,251 Doctors ‐ $4,199 Average cost per patient per year: Nurses ‐ $98.51 Doctors ‐ $127.24 | |
|
| NHS resources plus out‐of‐pocket expenditures: Nurses ‐ mean £1276 Doctors ‐ mean £2286 (95% CI ‐352 to 1773) P = 0.1872 | |
|
| Average cost per patient per year: Nurses ‐ $297.01 Doctors – $285.67 | |
|
| Total direct cost per consultation: Nurses – mean £18.11 (SD £33.43; range £0.66 to £297.1) Doctors – mean £20.70 (SD £33.43; range £0.78 to £300.6) Mean difference (adjusted age, sex): £2.33 (95% CI 1.62 to 6.28); P = 0.247 | |
| aSpitzer reported an overall reduction in practice costs following the introduction of nurse practitioners, but this finding was based on observational before‐and‐after data. Data obtained from the related randomised controlled trial (reported above) did not support this finding. A&E: accident and emergency. CI: confidence interval. DEXA: dual energy x‐ray absorptiometry. GP: general practitioner. *there may be additional data in the Campbell 2014 articles that have not been extracted | ||
| Focus of other reviews | Differences from our review | ||||
| Does not include meta‐analyses | Includes nurses working as supplements according to our definition | Includes non‐randomised studies | Focusses on particular countries | Has a particular focus on cost outcomes | |
| This literature review assesses the impact of advanced primary care nursing roles, particularly first contact nursing roles, for patients, nurses themselves, and their colleagues. | x | x | x | ||
| This study used the literature search Horrocks 2002 and aims to estimate resource use for a typical same‐day primary care consultation and the cost difference of employing an extra salaried GP or nurse practitioner. | x | UK | x | ||
| This systematic review compares effects of nurse practitioners and doctors providing care at first point on patient satisfaction, health status, process measures, and quality of care. | x | x | Developed countries | ||
| Martínez‐González 2014a; Martínez‐González 2014b; Martínez‐González 2015a; Martínez‐González 2015b; Martínez‐González 2015c Several systematic reviews investigating effects of nurses working as substitutes for doctors in primary care on clinical effectiveness, course of disease, process care, resource utilisation, and costs. | x | ||||
| This systematic review determines the cost‐effectiveness of nurse practitioners delivering primary and specialised ambulatory care. | x | x | |||
| This structured literature review investigates the value of advance practice nurses in delivering primary care, with a particular emphasis on the contributions of nurse practitioners. | x | x | x | ||
| This systematic reviews compares patient outcomes of care by advanced practice registered nurses (APRNs) to care by other providers (doctors or teams without APRNs). | x | x | x | USA | |
| This systematic review includes 10 studies evaluating the cost and quality of care provided by APRNs in primary care. | x | ||||
| APRN: advanced practice registered nurse. | |||||
| Outcome or subgroup title | No. of studies | No. of participants | Statistical method | Effect size |
| 1 Mortality Show forest plot | 8 | 36529 | Risk Ratio (IV, Random, 95% CI) | 0.77 [0.57, 1.03] |
| 2 Physical function (better vs not better) Show forest plot | 3 | 3549 | Risk Ratio (Random, 95% CI) | 1.03 [0.98, 1.09] |
| 3 Pain Show forest plot | 2 | Mean Difference (Random, 95% CI) | 0.76 [‐3.85, 5.38] | |
| 4 Quality of life Show forest plot | 6 | 16002 | Std. Mean Difference (Random, 95% CI) | 0.16 [0.00, 0.31] |
| 5 Systolic blood pressure Show forest plot | 3 | 1023 | Mean Difference (IV, Random, 95% CI) | ‐3.73 [‐6.02, ‐1.44] |
| 6 Diastolic blood pressure Show forest plot | 2 | 562 | Mean Difference (IV, Random, 95% CI) | ‐2.54 [‐4.57, ‐0.52] |
| 7 Total cholesterol Show forest plot | 2 | 702 | Mean Difference (IV, Random, 95% CI) | ‐0.15 [‐0.32, 0.02] |
| 8 HbA1c Show forest plot | 2 | 310 | Mean Difference (IV, Random, 95% CI) | 0.08 [‐0.25, 0.41] |
| 9 Disease Activity Score Show forest plot | 2 | Mean Difference (Random, 95% CI) | 0.04 [‐0.17, 0.24] | |
| 10 Patient satisfaction Show forest plot | 7 | 16993 | Std. Mean Difference (Random, 95% CI) | 0.08 [0.01, 0.15] |
| 11 Length of consultation Show forest plot | 4 | 5848 | Std. Mean Difference (Random, 95% CI) | 0.38 [0.22, 0.54] |
| 12 Scheduled return visits Show forest plot | 3 | 3934 | Risk Ratio (Random, 95% CI) | 1.31 [0.89, 1.94] |
| 13 Attended return visit Show forest plot | 4 | 5064 | Risk Ratio (Random, 95% CI) | 1.19 [1.07, 1.33] |
| 14 Prescription ordered Show forest plot | 4 | 5702 | Risk Ratio (Random, 95% CI) | 0.99 [0.95, 1.03] |
| 15 Investigations Show forest plot | 4 | 3654 | Risk Ratio (Random, 95% CI) | 0.95 [0.59, 1.51] |
| 16 Hospital referral Show forest plot | 4 | 17299 | Risk Ratio (Random, 95% CI) | 0.90 [0.54, 1.49] |
| 17 Attendance at accident and emergency Show forest plot | 6 | 29905 | Risk Ratio (Random, 95% CI) | 1.00 [0.91, 1.09] |
| 18 Hospital admission Show forest plot | 3 | 16466 | Risk Ratio (Random, 95% CI) | 1.04 [0.78, 1.39] |