Cjepivo za sprječavanje gripe u zdravih odraslih osoba
Appendices
Appendix 1. Glossary
Efficacy
The impact of an intervention (drug, vaccines, etc.) on a problem or disease in ideal conditions ‐ in this case the capacity of vaccines to prevent or treat influenza and its complications.
Effectiveness
The impact of an intervention (drug, vaccines, etc.) on a problem or disease in field conditions ‐ in this case the capacity of vaccines to prevent influenza‐like illness and its complications.
Influenza
An acute respiratory infection caused by a virus of the Orthomyxoviridae family. Three serotypes are known (A, B, and C). Influenza causes an acute febrile illness with myalgia, headache, and cough. Although the median duration of the acute illness is three days, cough and malaise can persist for weeks. Complications of influenza include otitis media, pneumonia, secondary bacterial pneumonia, exacerbations of chronic respiratory disease, and bronchiolitis in children. These illnesses may require treatment in a hospital and can be life‐threatening, particularly in 'high‐risk' people, such as the elderly and people suffering from chronic heart disease. Additionally, influenza can cause a range of non‐respiratory complications including febrile convulsions, Reye's syndrome, and myocarditis. The influenza virus is composed of a protein envelope around an RNA core. On the envelope are two antigens: neuraminidase (N antigen) and haemagglutinin (H antigen). Haemagglutinin is an enzyme that facilitates the entry of the virus into cells of the respiratory epithelium, while neuraminidase facilitates the release of newly produced viral particles from infected cells. The influenza virus has a marked propensity to mutate its external antigenic composition to escape the host's immune defences. Given this extreme mutability, a classification of viral subtype A based on H and N typing has been introduced. Additionally, strains are classified on the basis of antigenic type of the nucleoprotein core (A, B), geographical location of first isolation, strain serial number, and year of isolation. Every item is separated by a slash mark (e.g. A/Wuhan/359/95 (H3N2)). Unless otherwise specified such strains are of human origin. The production of antibodies against influenza beyond a conventional quantitative threshold is called seroconversion. Seroconversion in the absence of symptoms is called asymptomatic influenza.
Influenza‐like illness
An acute respiratory illness caused by scores of different viruses (including influenza A and B) presenting with symptoms and signs that are not distinguishable from those of influenza. Influenza‐like illness does not have documented laboratory isolation of the causative agent and is what commonly presents to physicians and patients (also known as 'the flu').
Appendix 2. Search strategies used to identify trials
MEDLINE (PubMed)
#1 "Influenza, Human"[MeSH]
#2 "Influenzavirus A"[MeSH]
#3 "Influenzavirus B"[MeSH]
#4 influenza*[Text Word] OR flu[Text Word]
#5 #1 OR #2 OR #3 OR #4
#6 "Vaccines"[MeSH]
#7 "Immunization"[MeSH]
#8 (vaccin*[Text Word] OR immuni*[Text Word] OR inocula*[Text Word])
#9 #6 OR #7 OR #8
#10 #5 AND #10
#11 "Influenza Vaccines"[MeSH]
#12 #10 OR #11
#13 "Randomized Controlled Trial" [Publication Type]
#14 "Controlled Clinical Trial" [Publication Type]
#15 randomized[Title/Abstract]
#16 placebo[Title/Abstract]
#17 "drug therapy" [Subheading]
#18 randomly[Title/Abstract]
#19 trial[Title/Abstract]
#20 groups[Title/Abstract]
#21 #13 OR #14 OR #15 OR #16 OR #17 OR #18 OR #19 OR #20
#22 ("Animals"[MeSH]) NOT "Humans"[MeSH]
#23 #21 NOT #22
#24 #12 AND #23
Embase (Elsevier)
#1 'influenza vaccine'/de
#2 'influenza'/exp
#3 'influenza virus a'/exp OR 'influenza virus b'/exp
#4 flu:ab,ti OR influenza*:ab,ti
#5 #2 OR #3 OR #4
#6 'vaccine'/de OR 'acellular vaccine'/de OR 'dna vaccine'/de OR 'inactivated vaccine'/de OR 'live vaccine'/de OR 'subunit vaccine'/de OR 'virus vaccine'/de OR 'virosome vaccine'/de OR 'recombinant vaccine'/de
#7 'immunization'/de OR 'vaccination'/de OR 'active immunization'/de OR 'immunoprophylaxis'/de OR 'mass immunization'/de
#8 vaccin*:ab,ti OR immuni*:ab,ti OR inocul*:ab,ti
#9 #6 OR #7 OR #8
#10 #5 AND #9
#11 #1 OR #10
#12 'randomized controlled trial'/exp OR 'single blind procedure'/exp OR 'double blind procedure'/exp OR 'crossover procedure'/exp
#13 random*:ab,ti OR placebo*:ab,ti OR factorial*:ab,ti OR crossover*:ab,ti OR 'cross‐over':ab,ti OR 'cross over':ab,ti OR assign*:ab,ti OR allocat*:ab,ti OR volunteer*:ab,ti OR ((singl* OR doubl*) NEAR/3 (blind* OR mask*)):ab,ti
#14 #12 OR #13
#15 #11 AND #14
WHO ICTRP
vaccine* AND influenza
immuni* AND influenza
inocul* AND influenza
vaccine* AND flu
immuni* AND flu
inocul* AND flu
ClinicalTrials.gov
(vaccine OR vaccines OR vaccinate OR vaccination OR vaccinated OR vaccinating OR immunise OR immunised OR immunising OR immunisation OR immunize OR immunized OR immunizing OR immunization) AND (influenza OR influenza OR flu)
(inoculate OR inoculated OR inoculating OR inoculation) AND (influenza OR influenza OR flu)
Appendix 3. Search strategies used to identify observational study searches (prior to the 2017 update)
MEDLINE (PubMed)
#1 "Influenza Vaccines"[MeSH] OR "Influenza, Human"[MeSH]
#2 (influenza* [Text Word] OR flu[Text Word]) AND (vaccin*[Text Word] OR immuni*[Text Word] OR inocula*[Text Word])
#3 #1 OR #2
#4 (randomized controlled trial [pt] OR controlled clinical trial [pt] OR randomized [tiab] OR placebo [tiab] OR drug therapy [sh] OR randomly [tiab] OR trial [tiab] OR groups [tiab])
#5 ("cross over" OR "crossover" OR "Follow Up") OR ("Cross‐Over Studies"[MeSH] OR "Follow‐Up Studies"[MeSH] OR "Prospective Studies"[MeSH]) OR ("time series" OR "interrupted time series") OR ("Case‐Control Studies"[MeSH] OR (cases[Title/Abstract] AND controls[Title/Abstract])) OR ("Cohort Studies"[MeSH] OR cohort*) OR ("Comparative Study"[Publication Type]) OR ("before after"[Title/Abstract] OR "before‐after"[Title/Abstract] OR "before/after"[Title/Abstract] OR "before and after"[Title/Abstract]) OR (volunteer*[Title/Abstract]) OR (control*[Text Word] AND evaluation[Text Word]) OR (longitudinal[Text Word]) OR (retrospective*[Text Word])
#6 #4 OR #5
#7 #3 OR #6
EMBASE
#1 'influenza vaccine' OR ( influenza OR flu AND ( vaccin* OR immuni* OR inoculat* )) OR 'influenza vaccine' /syn OR ('influenza' /exp AND 'vaccine' /exp)
#2 'case control study' /syn OR 'case control' :de,ab,ti OR ( cases :ab,ti AND controls :ab,ti) OR 'cohort analysis' /syn OR 'cohort study' :de,ab,ti OR 'study cohort' :de,ab,ti OR prospectiv* :ab,ti OR volunteer* :ab,ti OR observational :ab,ti OR 'clinical trial' :it OR 'randomized controlled trial' :it OR 'drug therapy' /exp OR 'drug therapy' :de OR randomized :ab,ti OR randomised :ab,ti OR placebo :ab,ti OR randomly :ab,ti OR trial :ab,ti OR groups :ab,ti
#3 'clinical trial' :it OR 'randomized controlled trial' :it OR 'randomized controlled trial' /exp OR 'randomization' /exp OR 'single blind procedure' /exp OR 'double blind procedure' /exp OR 'clinical trial' /exp OR 'clinical' NEAR/0 'trial' OR 'clinical trial' OR ( singl* OR doubl* OR trebl* OR tripl* AND ( mask* OR blind* )) OR 'placebo' /exp OR placebo* OR random* OR 'control group' /exp OR 'experimental design' /exp OR 'comparative study' /exp OR 'evaluation study' OR 'evaluation studies' /exp OR 'follow up' /exp OR 'prospective study' /exp OR control* OR prospectiv* OR volunteer*
#4 #2 OR #3
#5 #1 AND #4
#6 #1 AND #4 AND [embase]/lim
Appendix 4. Search strategies for 2010 update
MEDLINE (PubMed)
#1 "Influenza Vaccines"[MeSH] OR ("Influenza, Human/complications"[MeSH] OR "Influenza, Human/epidemiology"[MeSH] OR "Influenza, Human/immunology"[MeSH] OR "Influenza, Human/mortality"[MeSH] OR "Influenza, Human/prevention and control"[MeSH] OR "Influenza, Human/transmission"[MeSH])
#2 ((influenza vaccin*[Text Word]) OR ((influenza [Text Word] OR flu[Text Word]) AND (vaccin*[Text Word] OR immuni*[Text Word] OR inoculation*[Text Word] OR efficacy[Text Word] OR effectiveness[Text Word])))
#3 #1 OR #2
#4 randomized controlled trial [pt] OR controlled clinical trial [pt] OR randomized [tiab] OR placebo [tiab] OR drug therapy [sh] OR randomly [tiab] OR trial [tiab] OR groups [tiab]) AND humans [mh]
#5 ("cross over" OR "crossover" OR "Follow Up") OR ("Cross‐Over Studies"[MeSH] OR "Follow‐Up Studies"[MeSH] OR "Prospective Studies"[MeSH]) OR ("time series" OR "interrupted time series") OR (placebo* OR random* OR "double blind" OR "single blind" OR clinical trial* OR trial design) OR ("Case‐Control Studies"[MeSH] OR (cases[Title/Abstract] AND controls[Title/Abstract])) OR ("Cohort Studies"[MeSH] OR cohort*) OR ("Comparative Study"[Publication Type]) OR ("before after"[Title/Abstract] OR "before‐after"[Title/Abstract] OR "before/after"[Title/Abstract] OR "before and after"[Title/Abstract]) OR (volunteer*[Title/Abstract]) OR (control*[Text Word] AND evaluation[Text Word])
#6 #4 OR #5
#7 #3 AND #6
EMBASE
#1 'influenza vaccine' /exp OR 'influenza vaccine' OR ( influenza OR flu AND ( vaccin* OR immuni* OR inoculat* )) OR 'influenza vaccine' /syn OR ( 'influenza' /exp AND 'vaccine' /exp)
#2 'case control study' /syn OR 'case control' :de,ab,ti OR ( cases :ab,ti AND controls :ab,ti) OR 'cohort analysis' /syn OR 'cohort study' :de,ab,ti OR 'study cohort' :de,ab,ti OR prospectiv* :ab,ti OR volunteer* :ab,ti OR observational :ab,ti OR 'clinical trial' :it OR 'randomized controlled trial' :it OR 'drug therapy' /exp OR 'drug therapy' :de OR randomized :ab,ti OR randomised :ab,ti OR placebo :ab,ti OR randomly :ab,ti OR trial :ab,ti OR groups :ab,ti
#3 'clinical trial' :it OR 'randomized controlled trial' :it OR 'drug therapy' /exp OR 'drug therapy' :de OR randomized :ab,ti OR randomised :ab,ti OR placebo :ab,ti OR randomly :ab,ti OR trial :ab,ti OR groups :ab,ti
#4 'clinical trial' :it OR 'randomized controlled trial' :it OR 'randomized controlled trial' /exp OR 'randomization' /exp OR 'single blind procedure' /exp OR 'double blind procedure' /exp OR 'clinical trial' /exp OR 'clinical' NEAR/0 'trial' OR 'clinical trial' OR ( singl* OR doubl* OR trebl* OR tripl* AND ( mask* OR blind* )) OR 'placebo' /exp OR placebo* OR random* OR 'control group' /exp OR 'experimental design' /exp OR 'comparative study' /exp OR 'evaluation study' OR 'evaluation studies' /exp OR 'follow up' /exp OR 'prospective study' /exp OR control* OR prospectiv* OR volunteer* AND [humans]/lim
#5 #2 OR #3 OR #4
#6 #1 AND #5
#7 #1 AND #5 AND [humans]/lim AND [embase]/lim
Appendix 5. MEDLINE search strategy for 2004 update
MEDLINE
#1 ("Influenza Vaccine/administration and dosage"[MeSH] OR "Influenza Vaccine/adverse effects"[MeSH] OR "Influenza Vaccine/contraindications"[MeSH] OR "Influenza Vaccine/immunology"[MeSH] OR "Influenza Vaccine/metabolism"[MeSH] OR "Influenza Vaccine/radiation effects"[MeSH] OR "Influenza Vaccine/therapeutic use"[MeSH] OR "Influenza Vaccine/toxicity"[MeSH]) OR ("Influenza/epidemiology"[MeSH] OR "Influenza/immunology"[MeSH] OR "Influenza/mortality"[MeSH] OR "Influenza/prevention and control"[MeSH] OR "Influenza/transmission"[MeSH])
#2 (influenza vaccin*[Title/Abstract]) OR ((influenza [Title/Abstract] OR flu[Title/Abstract]) AND (vaccin*[Title/Abstract] OR immuni*[Title/Abstract] OR inoculati*[Title/Abstract] OR efficacy[Title/Abstract] OR effectiveness[Title/Abstract])
#3 #1 OR #2
#4 "Randomized Controlled Trial"[Publication Type] OR "Randomized Controlled Trials"[MeSH] OR "Controlled Clinical Trial"[Publication Type] OR "Controlled Clinical Trials"[MeSH] OR "Random Allocation"[MeSH] OR "Double‐Blind Method"[MeSH] OR "Single‐Blind Method"[MeSH]
#5 controlled clinical trial*[Title/Abstract] OR randomised controlled trial*[Title/Abstract] OR clinical trial*[Title/Abstract] OR random allocation[Title/Abstract] OR random*[Title/Abstract] OR placebo[Title/Abstract] OR double ‐ blind[Title/Abstract] OR single ‐ blind[Title/Abstract] OR RCT[Title/Abstract] OR CCT[Title/Abstract] OR allocation[Title/Abstract] OR follow ‐ up[Title/Abstract]
#6 #4 OR #5
#7 #3 AND #6
Appendix 6. Data extraction form
PART 1
Background information and description of study
Reviewer:
Study unique identifier:
Published: Y/N
Journal: (if applicable)
Year of publication:
Period study conducted:
Abstract/full paper
Country or countries of study:
Number of studies included in this paper:
Funding source (delete non‐applicable items):
Government, pharmaceutical, private, unfunded, unclear
Paper/abstract numbers of other studies with which these data are linked:
Reviewer’s assessment of study design (delete non‐applicable items):
| Study category | Study design | ||
| Experimental | RCT/CCT | HCT | Cross‐over RCT |
| Non‐randomised analytical (specifically designed to assess association) | Prospective/retrospective cohort | Case‐control | Cross‐sectional |
| Non‐randomised comparative (not specifically designed to assess association) | Case cross‐over/time series | Ecological study | Indirect comparison (before and after) |
| Non‐comparative | EXCLUDE | ||
Does the study present data distributed by age group/occupation/health status?
| Subgroup distribution | ||
| Yes | No | |
| Age group | ||
| Occupation | ||
| Health status | ||
| Gender | ||
| Risk group | ||
Description of study
Methods
Participants
Interventions/exposure
Outcomes
Notes
PART 2a
Methodological quality assessment
RCTs and CCTs only
| RANDOM SEQUENCE GENERATION Selection bias (biased allocation to interventions) due to inadequate generation of a randomised sequence. | |
| Criteria for a judgement of 'Low risk' of bias | The investigators describe a random component in the sequence generation process such as: ‐ Referring to a random number table ‐ Using a computer random number generator ‐ Coin tossing ‐ Shuffling cards or envelopes ‐ Throwing dice ‐ Drawing of lots ‐ Minimisation* *Minimisation may be implemented without a random element and this is considered to be equivalent to being random |
| Criteria for the judgement of 'High risk' of bias | The investigators describe a non‐random component in the sequence generation process. Usually, the description would involve some systematic, non‐random approach, for example: ‐ Sequence generated by odd or even date of birth ‐ Sequence generated by some rule based on date (or day) of admission ‐ Sequence generated by some rule based on hospital or clinic record number Other non‐random approaches happen much less frequently than the systematic approaches mentioned above and tend to be obvious. They usually involve judgement or some method of non‐random categorisation of participants, for example: ‐ Allocation by judgement of the clinician ‐ Allocation by preference of the participant ‐ Allocation based on the results of a laboratory test or a series of tests ‐ Allocation by availability of the intervention |
| Criteria for the judgement of 'Unclear risk' of bias | Insufficient information about the sequence generation process to permit judgement of 'Low risk' or 'High risk' |
| ALLOCATION CONCEALMENT Selection bias (biased allocation to interventions) due to inadequate concealment of allocations prior to assignment | |
| Criteria for a judgement of 'Low risk' of bias | Participants and investigators enrolling participants could not foresee assignment because one of the following, or an equivalent method, was used to conceal allocation: ‐ Central allocation (including telephone, web‐based and pharmacy‐controlled randomisation) ‐ Sequentially numbered drug containers of identical appearance ‐ Sequentially numbered, opaque, sealed envelopes |
| Criteria for the judgement of 'High risk' of bias | Participants or investigators enrolling participants could possibly foresee assignments and thus introduce selection bias, such as allocation based on: ‐ Using an open random allocation schedule (e.g. a list of random numbers) ‐ Assignment envelopes were used without appropriate safeguards (e.g. if envelopes were unsealed or nonopaque or not sequentially numbered) ‐ Alternation or rotation ‐ Date of birth ‐ Case record number ‐ Any other explicitly unconcealed procedure |
| Criteria for the judgement of 'Unclear risk' of bias | Insufficient information to permit judgement of 'Low risk' or 'High risk'. This is usually the case if the method of concealment is not described or not described in sufficient detail to allow a definite judgement – for example if the use of assignment envelopes is described, but it remains unclear whether envelopes were sequentially numbered, opaque and sealed |
| BLINDING OF PARTICIPANTS AND PERSONNEL Performance bias due to knowledge of the allocated interventions by participants and personnel during the study | |
| Criteria for a judgement of 'Low risk' of bias | Any one of the following: ‐ No blinding or incomplete blinding, but the review authors judge that the outcome is not likely to be influenced by lack of blinding ‐ Blinding of participants and key study personnel ensured, and unlikely that the blinding could have been broken |
| Criteria for the judgement of 'High risk' of bias | Any one of the following: ‐ No blinding or incomplete blinding, and the outcome is likely to be influenced by lack of blinding ‐ Blinding of key study participants and personnel attempted, but likely that the blinding could have been broken, and the outcome is likely to be influenced by lack of blinding |
| Criteria for the judgement of 'Unclear risk' of bias | Any one of the following: ‐ Insufficient information to permit judgement of 'Low risk' or 'High risk' ‐ The study did not address this outcome |
| BLINDING OF OUTCOME ASSESSMENT Detection bias due to knowledge of the allocated interventions by outcome assessors | |
| Criteria for a judgement of 'Low risk' of bias | Any one of the following: ‐ No blinding of outcome assessment, but the review authors judge that the outcome measurement is not likely to be influenced by lack of blinding ‐ Blinding of outcome assessment ensured, and unlikely that the blinding could have been broken |
| Criteria for the judgement of 'High risk' of bias | Any one of the following: ‐ No blinding of outcome assessment, and the outcome measurement is likely to be influenced by lack of blinding ‐ Blinding of outcome assessment, but likely that the blinding could have been broken, and the outcome measurement is likely to be influenced by lack of blinding |
| Criteria for the judgement of 'Unclear risk' of bias | Any one of the following: ‐ Insufficient information to permit judgement of 'Low risk' or 'High risk' ‐ The study did not address this outcome |
| INCOMPLETE OUTCOME DATA Attrition bias due to amount, nature or handling of incomplete outcome data | |
| Criteria for a judgement of 'Low risk' of bias | Any one of the following: ‐ No missing outcome data ‐ Reasons for missing outcome data unlikely to be related to true outcome (for survival data, censoring unlikely to be introducing bias) ‐ Missing outcome data balanced in numbers across intervention groups, with similar reasons for missing data across groups ‐ For dichotomous outcome data, the proportion of missing outcomes compared with observed event risk not enough to have a clinically relevant impact on the intervention effect estimate ‐ For continuous outcome data, plausible effect size (difference in means or standardised difference in means) among missing outcomes not enough to have a clinically relevant impact on observed effect size ‐ Missing data have been imputed using appropriate methods |
| Criteria for the judgement of 'High risk' of bias | Any one of the following: ‐ Reason for missing outcome data likely to be related to true outcome, with either imbalance in numbers or reasons for missing data across intervention groups ‐ For dichotomous outcome data, the proportion of missing outcomes compared with observed event risk enough to induce clinically relevant bias in intervention effect estimate ‐ For continuous outcome data, plausible effect size (difference in means or standardised difference in means) among missing outcomes enough to induce clinically relevant bias in observed effect size ‐ 'As‐treated' analysis done with substantial departure of the intervention received from that assigned at randomisation ‐ Potentially inappropriate application of simple imputation |
| Criteria for the judgement of 'Unclear risk' of bias | Any one of the following: ‐ Insufficient reporting of attrition/exclusions to permit judgement of 'Low risk' or 'High risk' (e.g. number randomised not stated, no reasons for missing data provided) ‐ The study did not address this outcome |
| SELECTIVE REPORTING Reporting bias due to selective outcome reporting | |
| Criteria for a judgement of 'Low risk' of bias | Any of the following: ‐ The study protocol is available and all of the study's prespecified (primary and secondary) outcomes that are of interest in the review have been reported in the prespecified way ‐ The study protocol is not available but it is clear that the published reports include all expected outcomes, including those that were prespecified (convincing text of this nature may be uncommon) |
| Criteria for the judgement of 'High risk' of bias | Any one of the following: ‐ Not all of the study's prespecified primary outcomes have been reported ‐ One or more primary outcomes is reported using measurements, analysis methods or subsets of the data (e.g. subscales) that were not prespecified ‐ One or more reported primary outcomes were not prespecified (unless clear justification for their reporting is provided, such as an unexpected adverse effect) ‐ One or more outcomes of interest in the review are reported incompletely so that they cannot be entered in a meta‐analysis ‐ The study report fails to include results for a key outcome that would be expected to have been reported for such a study |
| Criteria for the judgement of 'Unclear risk' of bias | Insufficient information to permit judgement of 'Low risk' or 'High risk'. It is likely that the majority of studies will fall into this category |
| OTHER BIAS Bias due to problems not covered elsewhere in the table | |
| Criteria for a judgement of 'Low risk' of bias | The study appears to be free of other sources of bias |
| Criteria for the judgement of 'High risk' of bias | There is at least one important risk of bias. For example, the study: ‐ Had a potential source of bias related to the specific study design used or ‐ Has been claimed to have been fraudulent or ‐ Had some other problem |
| Criteria for the judgement of 'Unclear risk' of bias. | There may be a risk of bias, but there is either: ‐ Insufficient information to assess whether an important risk of bias exists or ‐ Insufficient rationale or evidence that an identified problem will introduce bias |
PART 2b
Description of interventions and outcomes
RCT and CCT only
Vaccines used
| Vaccines and composition | Product and manufacturer | Schedule & dosage and status | Route of administration | |
| Arm 1 | ||||
| Arm 2 | ||||
| Arm 3 | ||||
| Arm 4 | ||||
| Placebo |
Rule: index vaccine goes in the Arm 1 line, placebo in the last line
Status: primary, secondary or tertiary immunisation
| Vaccine | Batch numbers |
Details of participants
| Enrolled | Missing | Reasons | Inclusion in analysis | Notes | |
| Active arm 1 | |||||
| Active arm 2 | |||||
| Active arm 3 | |||||
| Active arm 4 | |||||
| Controls |
Outcomes list – effectiveness
| Outcome | How defined | Description/follow‐up/notes |
Outcomes list ‐ safety
| Outcome | How defined | Description/follow‐up/notes |
Investigators to be contacted for more information? Yes/No
Contact details (principal investigator, fill in only if further contact is necessary):
PART 2c
Data extraction and manipulation
(To be used for dichotomous or continuous outcomes)
RCT and CCT only
Comparison
| Outcomes | n/N index arm | n/N comparator |
Notes (for statistical use only)
PART 3a
Description of interventions and outcomes
Non‐randomised longitudinal studies only
Vaccines used
| Vaccines and composition | Product and manufacturer | Schedule & dosage and status | Route of administration | |
| Group 1 | ||||
| Group 2 | ||||
| Group 3 | ||||
| Group 4 | ||||
| Comparator |
Rule: index vaccine goes in the Group 1 line, placebo in the last line
| Vaccine | Batch numbers |
Details of participants
| Enrolled | Missing | Reasons | Inclusion in analysis | Notes | |
| Group1 | |||||
| Group 2 | |||||
| Group 3 | |||||
| Group 4 | |||||
| Comparator |
Outcomes list – effectiveness
| Outcome | How defined (including length of follow‐up) | Description/follow‐up/notes |
Outcomes list ‐ safety
| Outcome | How defined (including length of follow‐up) | Description/follow‐up/notes |
Investigators to be contacted for more information? Yes/No
Contact details (principal investigator, fill in only if further contact is necessary):
PART 3b
Data extraction and manipulation
(To be used for dichotomous outcomes)
Non‐randomised longitudinal studies only
Comparison
| Outcomes | n/N index group | n/N comparator |
Notes (for statistical use only)
PART 3c
Description of studies
Case‐control studies only
Event 1
| How defined | Enrolled | Missing | Reasons | Inclusion in analysis | |
| Cases n = | |||||
| Controls n = |
Exposure
| How defined | How ascertained | Notes | |
| Vaccine exposure 1 | |||
| Vaccine exposure 2 |
Event 2
| How defined | Enrolled | Missing | Reasons | Inclusion in analysis | |
| Cases n = | |||||
| Controls n = |
Exposure
| How defined | How ascertained | Notes | |
| Vaccine exposure 1 | |||
| Vaccine exposure 2 |
Notes (for statistical use only)
Part 3d
Data extraction and manipulation
Case‐control studies only
| Status | Numerator | Denominator |
| Cases | ||
| Control |
Notes (for statistical use only)
Appendix 7. Included studies design
A case‐control study is a prospective or retrospective epidemiological study usually used to investigate the causes of disease. Study participants who have experienced an adverse outcome or disease are compared with participants who have not. Any differences in the presence or absence of hypothesised risk factors are noted.
A cohort study is an epidemiological study where groups of individuals are identified who vary in their exposure to an intervention or hazard and who are then followed to assess outcomes. Association between exposure and outcome are then estimated. Cohort studies are best performed prospectively, but can also be undertaken retrospectively if suitable data records are available.
A randomised controlled trial is any study on humans in which the individuals (or other experimental units) followed in the study were definitely or possibly assigned prospectively to one of two (or more) alternative forms of health care using random allocation.
A quasi‐randomised clinical trial is any study on humans in which the individuals (or other experimental units) followed in the study were definitely or possibly assigned prospectively to one of two (or more) alternative forms of health care using some quasi‐random method of allocation (such as alternation, date of birth, or case record number).
Appendix 8. Methodological quality of non‐randomised studies
Newcastle‐Ottawa quality assessment scale ‐ case‐control studies
Note: a study can be awarded a maximum of one star (i.e.asterisk) for each numbered item within the Selection and Exposure categories. A maximum of two stars can be given for Comparability.
Selection
-
Is the case definition adequate?
-
Yes, with independent validation*
-
Yes, e.g. record linkage or based on self reports
-
No description
-
-
Representativeness of the cases
-
Consecutive or obviously representative series of cases*
-
Potential for selection biases or not stated
-
-
Selection of controls
-
Community controls*
-
Hospital controls
-
No description
-
-
Definition of controls
-
No history of disease (endpoint)*
-
No description of source
-
Comparability
-
Comparability of cases and controls on the basis of the design or analysis
-
Study controls for _______________ (Select the most important factor)*
-
Study controls for any additional factor* (This criterion could be modified to indicate specific control for a second important factor)
-
Exposure
-
Ascertainment of exposure
-
Secure record (e.g. surgical records)*
-
Structured interview where blind to case/control status*
-
Interview not blinded to case/control status
-
Written self report or medical record only
-
No description
-
-
Same method of ascertainment for cases and controls
-
Yes*
-
No
-
-
Non‐response rate
-
Same rate for both groups*
-
Non‐respondents described
-
Rate different and no designation
-
Newcastle‐Ottawa quality assessment scale ‐ cohort studies
Note: a study can be awarded a maximum of one star for each numbered item within the Selection and Outcome categories. A maximum of two stars can be given for Comparability.
Selection
-
Representativeness of the exposed cohort
-
Truly representative of the average _______________ (describe) in the community*
-
Somewhat representative of the average ______________ in the community*
-
Selected group of users, e.g. nurses, volunteers
-
No description of the derivation of the cohort
-
-
Selection of the non‐exposed cohort
-
Drawn from the same community as the exposed cohort*
-
Drawn from a different source
-
No description of the derivation of the non‐exposed cohort
-
-
Ascertainment of exposure
-
Secure record (e.g. surgical records)*
-
Structured interview *
-
Written self report
-
No description
-
-
Demonstration that outcome of interest was not present at start of study
-
Yes*
-
No
-
Comparability
-
Comparability of cohorts on the basis of the design or analysis
-
Study controls for _____________ (select the most important factor)*
-
Study controls for any additional factor* (This criterion could be modified to indicate specific control for a second important factor)
-
Outcome
-
Assessment of outcome
-
Independent blind assessment*
-
Record linkage*
-
Self report
-
No description
-
-
Was follow‐up long enough for outcomes to occur
-
Yes (select an adequate follow‐up period for outcome of interest)*
-
No
-
-
Adequacy of follow‐up of cohorts
-
Complete follow‐up ‐ all participants accounted for*
-
Participants lost to follow‐up unlikely to introduce bias ‐ small number lost ‐ > ____ % (select an adequate %) follow‐up, or description provided of those lost)*
-
Follow‐up rate < ____% (select an adequate %) and no description of those lost
-
No statement
-

Study flow diagram.

'Risk of bias' graph: review authors' judgements about each risk of bias item presented as percentages across all included studies.

'Risk of bias' summary: review authors' judgements about each risk of bias item for each included study.
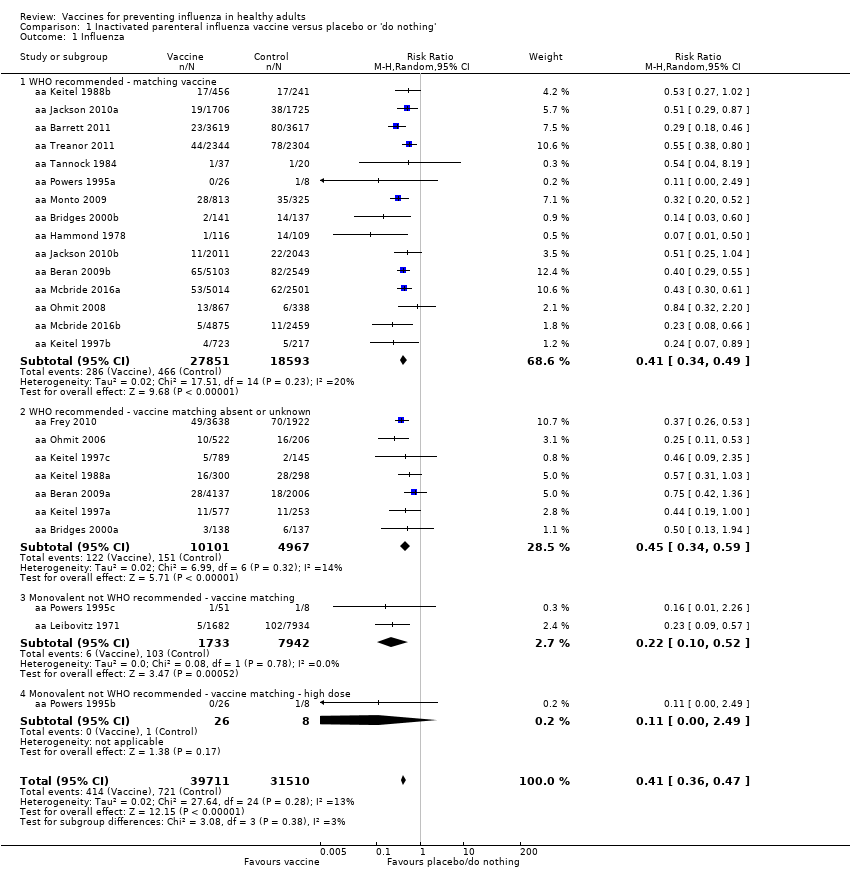
Comparison 1 Inactivated parenteral influenza vaccine versus placebo or 'do nothing', Outcome 1 Influenza.
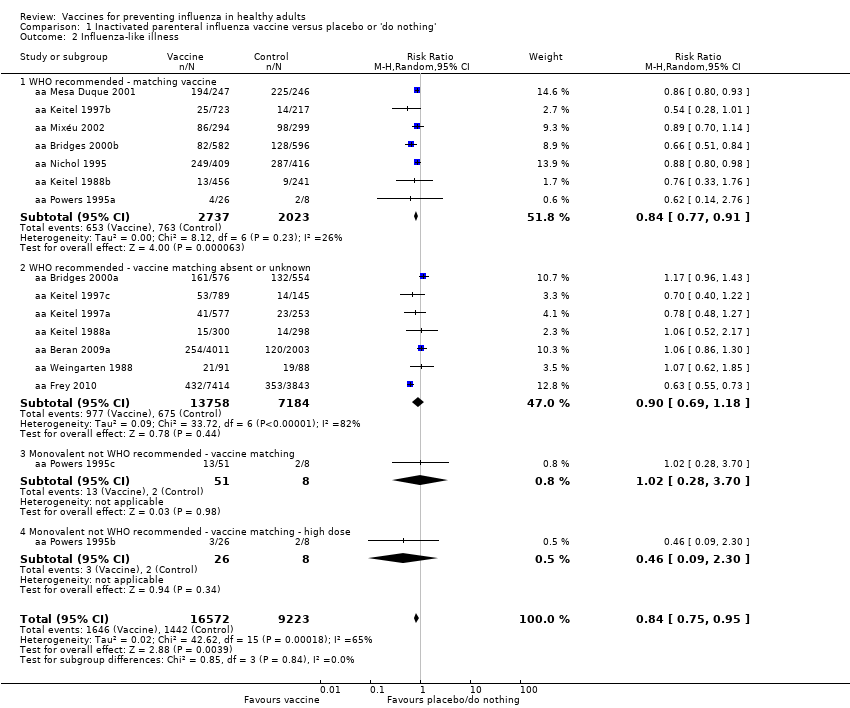
Comparison 1 Inactivated parenteral influenza vaccine versus placebo or 'do nothing', Outcome 2 Influenza‐like illness.
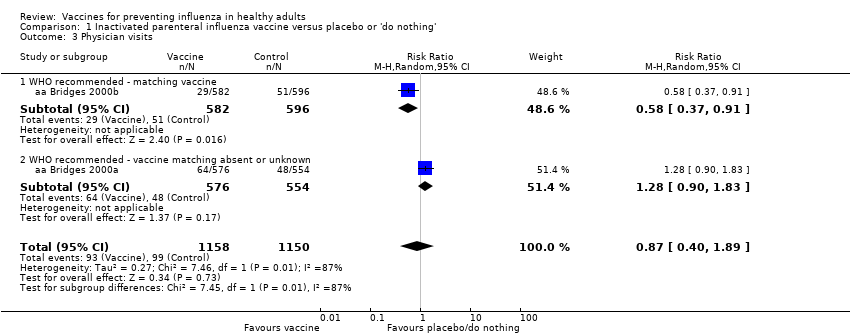
Comparison 1 Inactivated parenteral influenza vaccine versus placebo or 'do nothing', Outcome 3 Physician visits.

Comparison 1 Inactivated parenteral influenza vaccine versus placebo or 'do nothing', Outcome 4 Days ill.

Comparison 1 Inactivated parenteral influenza vaccine versus placebo or 'do nothing', Outcome 5 Times any drugs were prescribed.

Comparison 1 Inactivated parenteral influenza vaccine versus placebo or 'do nothing', Outcome 6 Times antibiotic was prescribed.
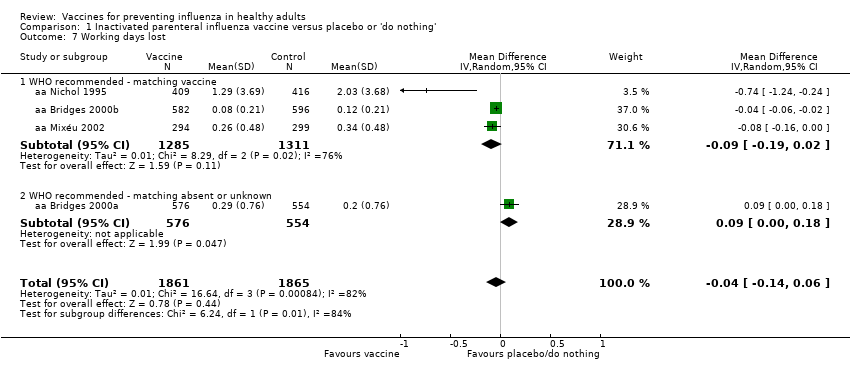
Comparison 1 Inactivated parenteral influenza vaccine versus placebo or 'do nothing', Outcome 7 Working days lost.
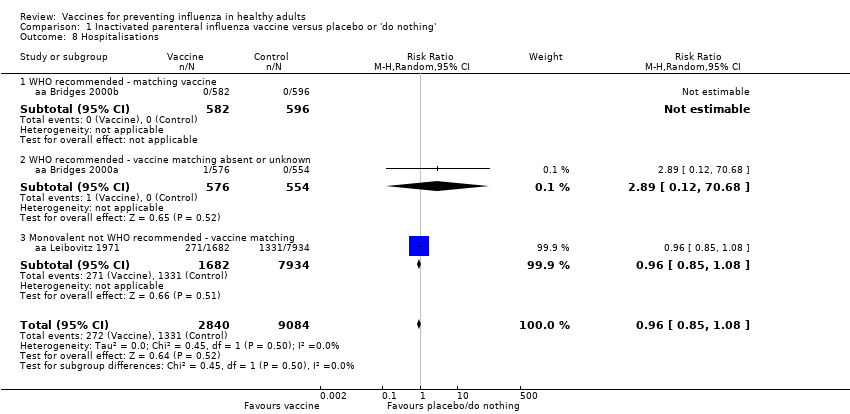
Comparison 1 Inactivated parenteral influenza vaccine versus placebo or 'do nothing', Outcome 8 Hospitalisations.

Comparison 1 Inactivated parenteral influenza vaccine versus placebo or 'do nothing', Outcome 9 Clinical cases (clinically defined without clear definition).
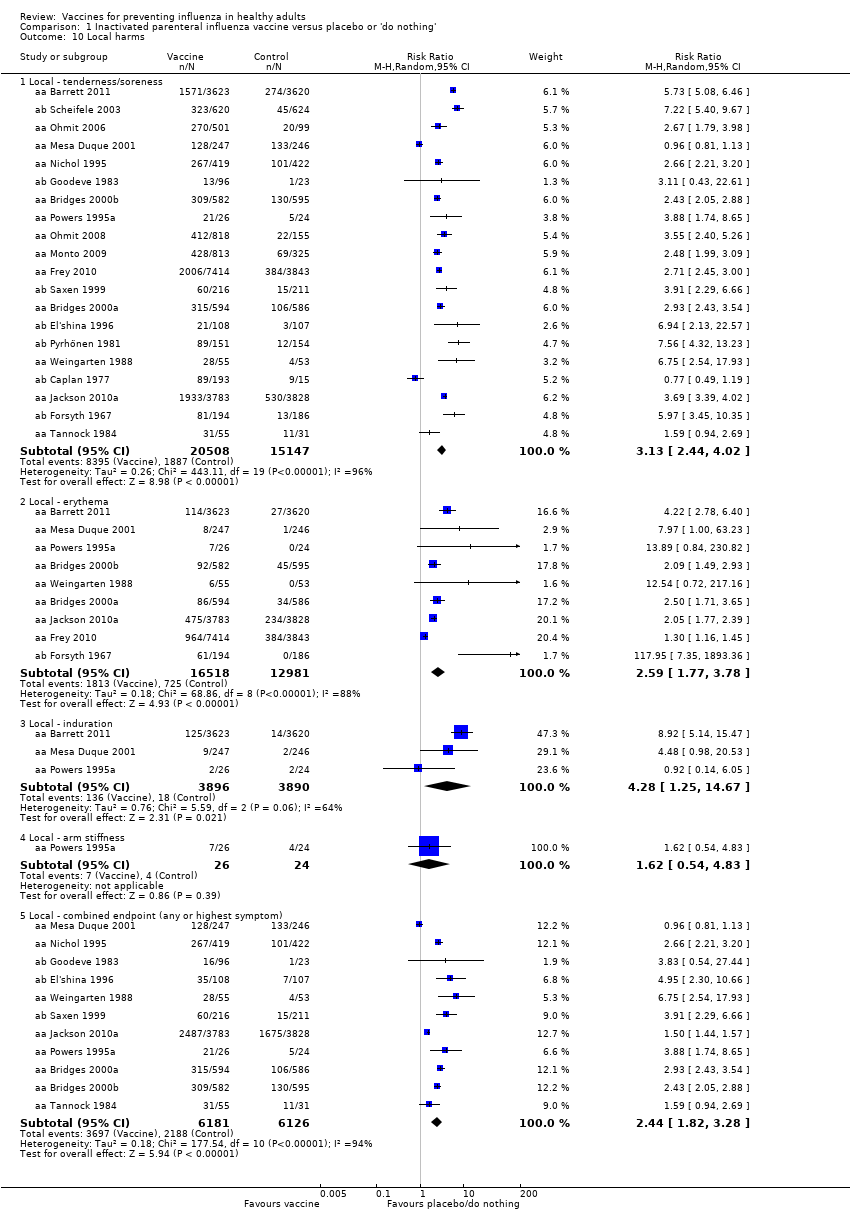
Comparison 1 Inactivated parenteral influenza vaccine versus placebo or 'do nothing', Outcome 10 Local harms.

Comparison 1 Inactivated parenteral influenza vaccine versus placebo or 'do nothing', Outcome 11 Systemic harms.

Comparison 2 Live aerosol influenza vaccine versus placebo or 'do nothing', Outcome 1 Influenza.

Comparison 2 Live aerosol influenza vaccine versus placebo or 'do nothing', Outcome 2 Influenza‐like illness.

Comparison 2 Live aerosol influenza vaccine versus placebo or 'do nothing', Outcome 3 Influenza cases (clinically defined without clear definition).
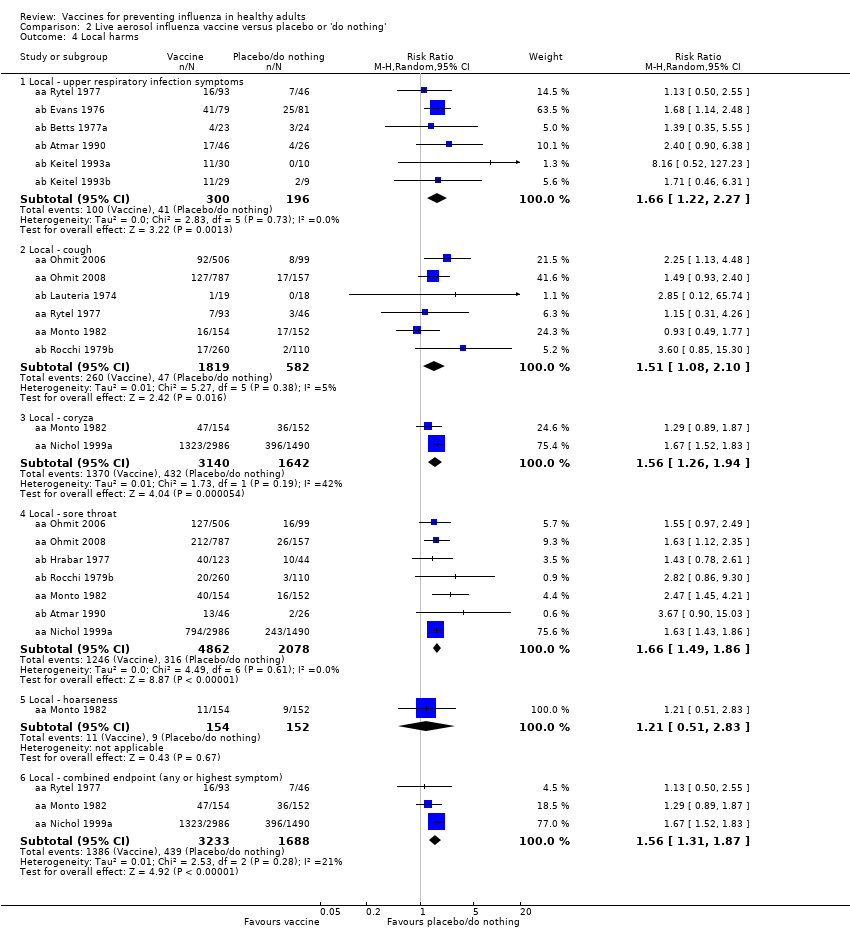
Comparison 2 Live aerosol influenza vaccine versus placebo or 'do nothing', Outcome 4 Local harms.
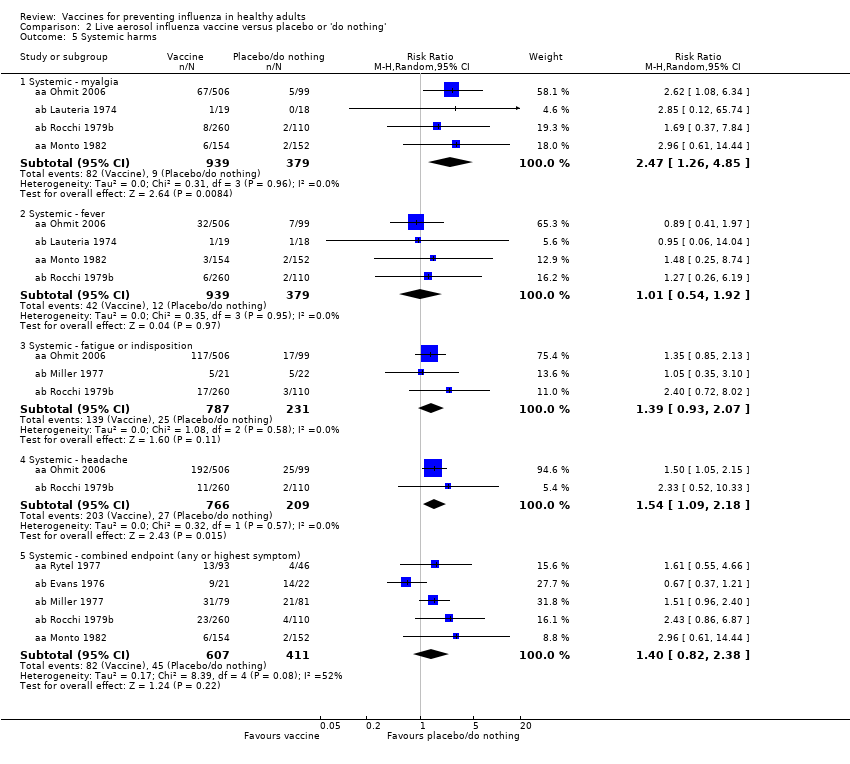
Comparison 2 Live aerosol influenza vaccine versus placebo or 'do nothing', Outcome 5 Systemic harms.
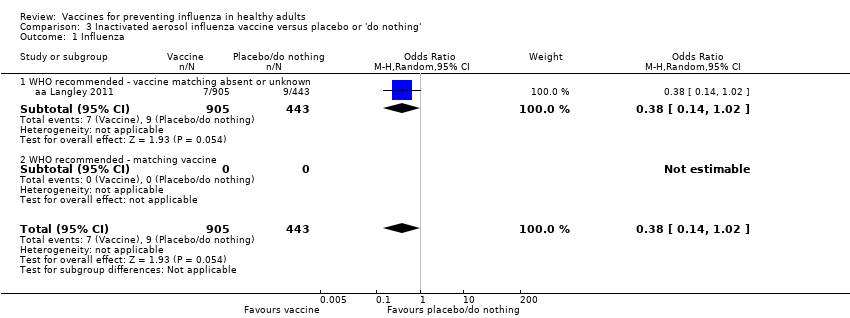
Comparison 3 Inactivated aerosol influenza vaccine versus placebo or 'do nothing', Outcome 1 Influenza.

Comparison 3 Inactivated aerosol influenza vaccine versus placebo or 'do nothing', Outcome 2 Local harms.

Comparison 3 Inactivated aerosol influenza vaccine versus placebo or 'do nothing', Outcome 3 Systemic harms.
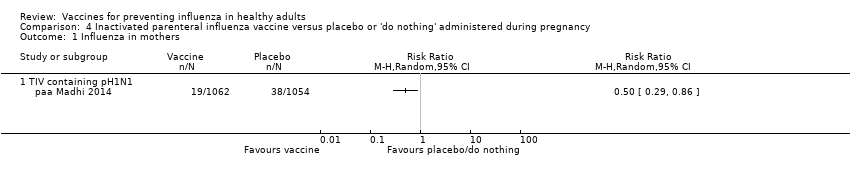
Comparison 4 Inactivated parenteral influenza vaccine versus placebo or 'do nothing' administered during pregnancy, Outcome 1 Influenza in mothers.
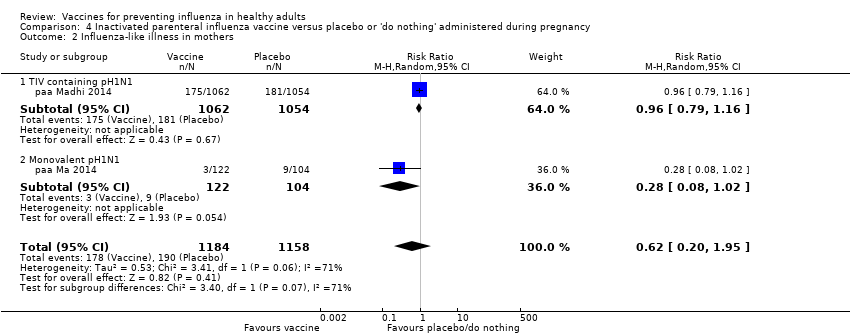
Comparison 4 Inactivated parenteral influenza vaccine versus placebo or 'do nothing' administered during pregnancy, Outcome 2 Influenza‐like illness in mothers.

Comparison 4 Inactivated parenteral influenza vaccine versus placebo or 'do nothing' administered during pregnancy, Outcome 3 Influenza in newborn.

Comparison 4 Inactivated parenteral influenza vaccine versus placebo or 'do nothing' administered during pregnancy, Outcome 4 Influenza‐like illness in newborn.

Comparison 5 Inactivated parenteral influenza vaccine versus placebo ‐ cohort studies, Outcome 1 Seasonal inactivated vaccine effectiveness in mothers ‐ pregnant women.

Comparison 5 Inactivated parenteral influenza vaccine versus placebo ‐ cohort studies, Outcome 2 Seasonal inactivated vaccine effectiveness in newborns ‐ pregnant women.

Comparison 5 Inactivated parenteral influenza vaccine versus placebo ‐ cohort studies, Outcome 3 Seasonal inactivated vaccine effectiveness in newborns ‐ pregnant women.
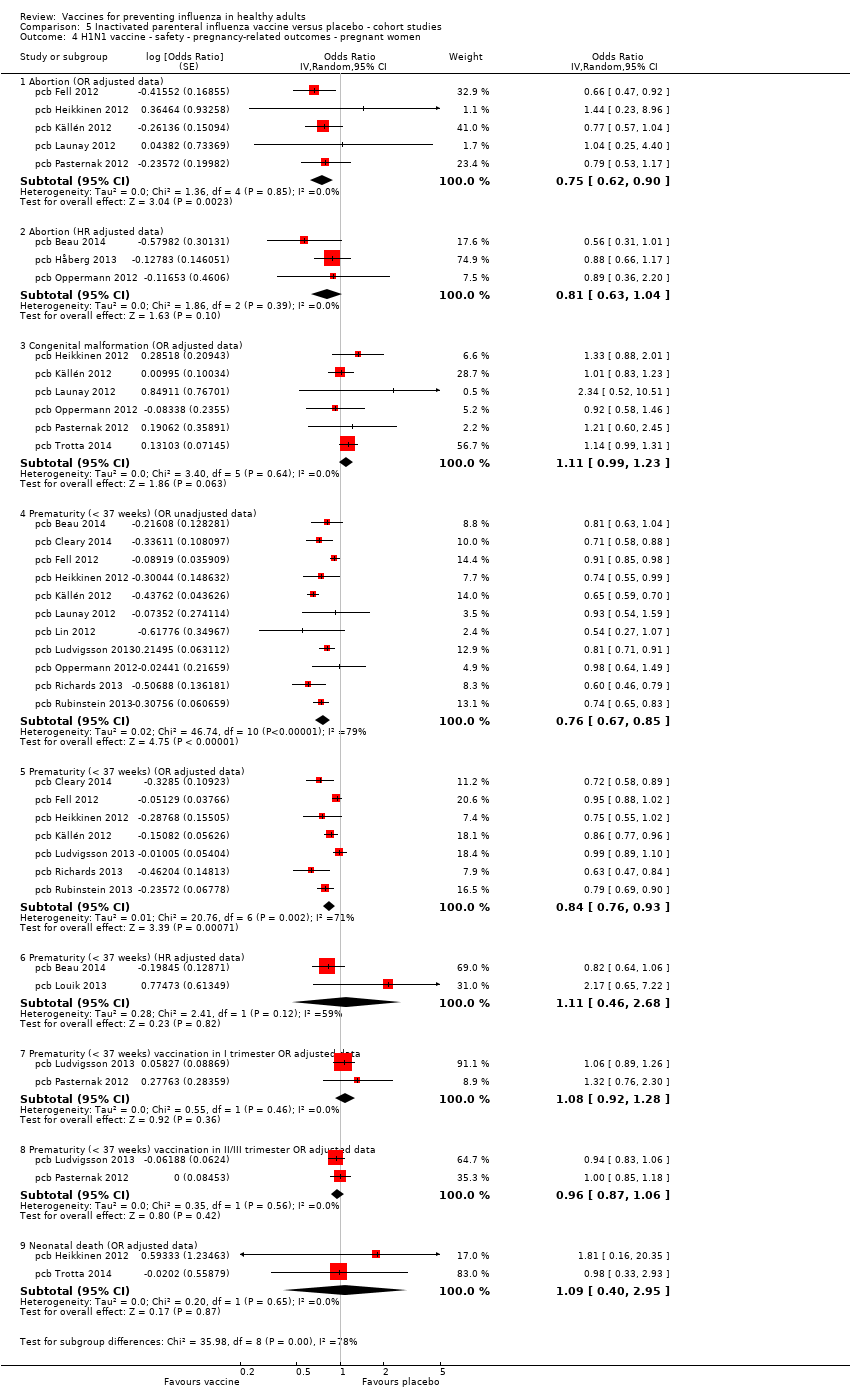
Comparison 5 Inactivated parenteral influenza vaccine versus placebo ‐ cohort studies, Outcome 4 H1N1 vaccine ‐ safety ‐ pregnancy‐related outcomes ‐ pregnant women.
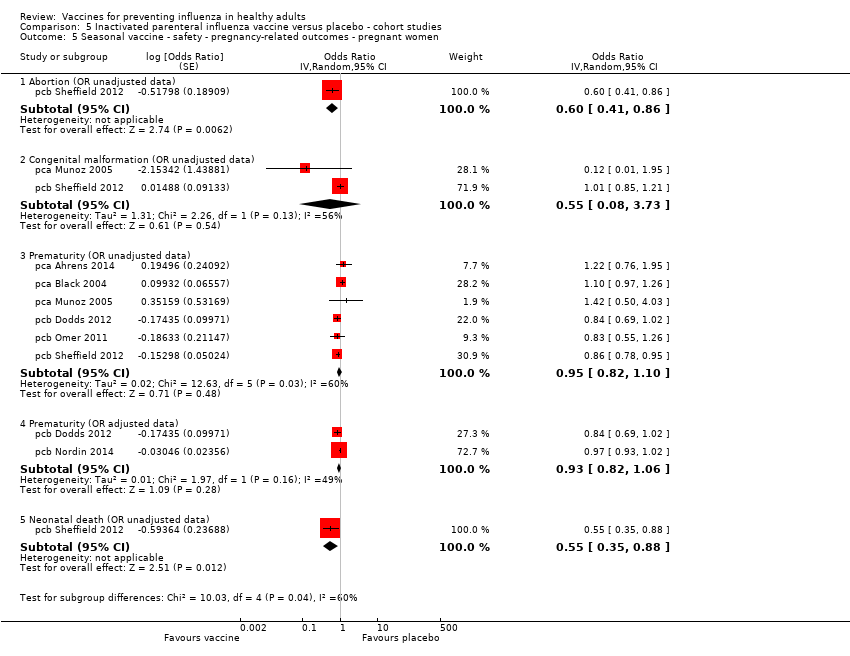
Comparison 5 Inactivated parenteral influenza vaccine versus placebo ‐ cohort studies, Outcome 5 Seasonal vaccine ‐ safety ‐ pregnancy‐related outcomes ‐ pregnant women.
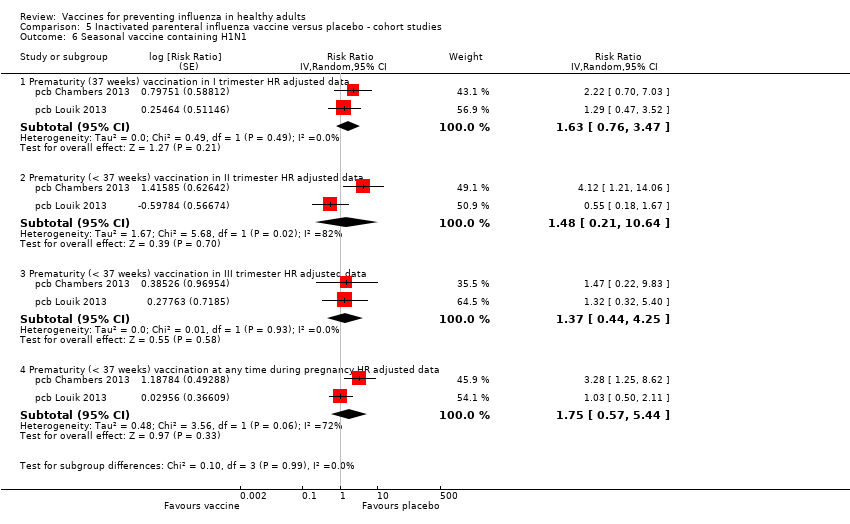
Comparison 5 Inactivated parenteral influenza vaccine versus placebo ‐ cohort studies, Outcome 6 Seasonal vaccine containing H1N1.

Comparison 6 Inactivated parenteral influenza vaccine versus placebo ‐ case‐control studies, Outcome 1 Effectiveness in newborns ‐ pregnant women (adjusted data).

Comparison 6 Inactivated parenteral influenza vaccine versus placebo ‐ case‐control studies, Outcome 2 Seasonal vaccine safety ‐ pregnancy‐related outcomes (adjusted data).
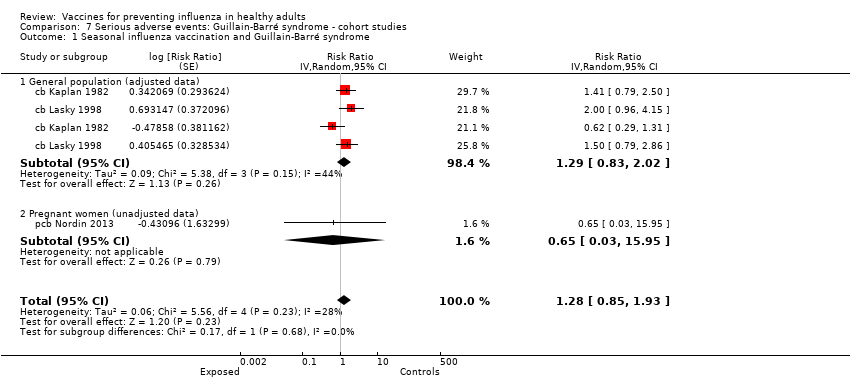
Comparison 7 Serious adverse events: Guillain‐Barré syndrome ‐ cohort studies, Outcome 1 Seasonal influenza vaccination and Guillain‐Barré syndrome.

Comparison 8 Serious adverse events: Guillain‐Barré syndrome ‐ case‐control studies, Outcome 1 2009 to 2010 A/H1N1 ‐ general population (unadjusted data).

Comparison 8 Serious adverse events: Guillain‐Barré syndrome ‐ case‐control studies, Outcome 2 2009 to 2010 A/H1N1 ‐ general population (adjusted data).

Comparison 8 Serious adverse events: Guillain‐Barré syndrome ‐ case‐control studies, Outcome 3 Seasonal influenza vaccination general population (adjusted data).

Comparison 9 Serious adverse events: demyelinating diseases (multiple sclerosis, optic neuritis) ‐ cohort studies, Outcome 1 Influenza vaccination (seasonal) ‐ demyelinating diseases (unadjusted data).
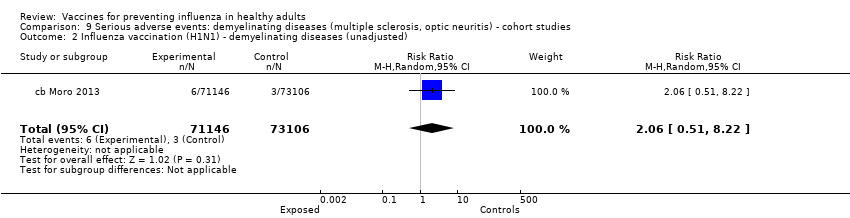
Comparison 9 Serious adverse events: demyelinating diseases (multiple sclerosis, optic neuritis) ‐ cohort studies, Outcome 2 Influenza vaccination (H1N1) ‐ demyelinating diseases (unadjusted).

Comparison 10 Serious adverse events: demyelinating diseases (multiple sclerosis, optic neuritis) ‐ case‐control studies, Outcome 1 Influenza vaccination (seasonal) ‐ general population ‐ demyelinating diseases (unadjusted data).

Comparison 10 Serious adverse events: demyelinating diseases (multiple sclerosis, optic neuritis) ‐ case‐control studies, Outcome 2 Influenza vaccination (seasonal) ‐ general population ‐ multiple sclerosis (adjusted data).
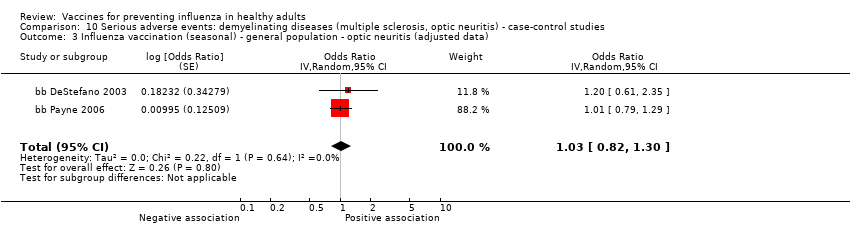
Comparison 10 Serious adverse events: demyelinating diseases (multiple sclerosis, optic neuritis) ‐ case‐control studies, Outcome 3 Influenza vaccination (seasonal) ‐ general population ‐ optic neuritis (adjusted data).

Comparison 11 Serious adverse events: immune thrombocytopenic purpura ‐ cohort studies, Outcome 1 Seasonal influenza vaccine ‐ HR (adjusted data).
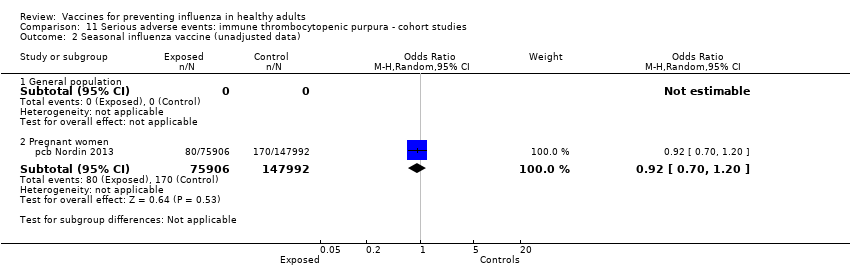
Comparison 11 Serious adverse events: immune thrombocytopenic purpura ‐ cohort studies, Outcome 2 Seasonal influenza vaccine (unadjusted data).

Comparison 12 Serious adverse events: immune thrombocytopenic purpura ‐ case‐control studies, Outcome 1 Seasonal influenza vaccine ‐ general population (adjusted data).

Comparison 12 Serious adverse events: immune thrombocytopenic purpura ‐ case‐control studies, Outcome 2 Seasonal influenza vaccine ‐ general population (unadjusted data).

Comparison 13 1968 to 1969 pandemic: inactivated polyvalent parenteral influenza vaccine versus placebo, Outcome 1 Influenza‐like illness.

Comparison 13 1968 to 1969 pandemic: inactivated polyvalent parenteral influenza vaccine versus placebo, Outcome 2 Influenza.
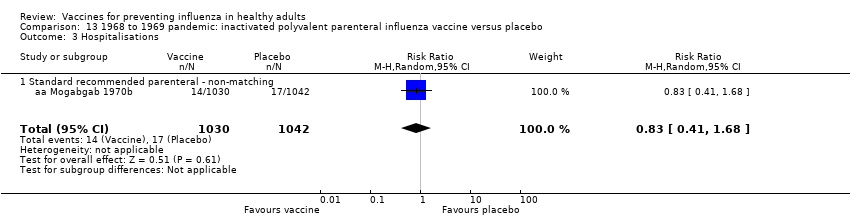
Comparison 13 1968 to 1969 pandemic: inactivated polyvalent parenteral influenza vaccine versus placebo, Outcome 3 Hospitalisations.

Comparison 13 1968 to 1969 pandemic: inactivated polyvalent parenteral influenza vaccine versus placebo, Outcome 4 Pneumonia.

Comparison 14 1968 to 1969 pandemic: inactivated monovalent parenteral influenza vaccine versus placebo, Outcome 1 Influenza‐like illness.

Comparison 14 1968 to 1969 pandemic: inactivated monovalent parenteral influenza vaccine versus placebo, Outcome 2 Influenza.
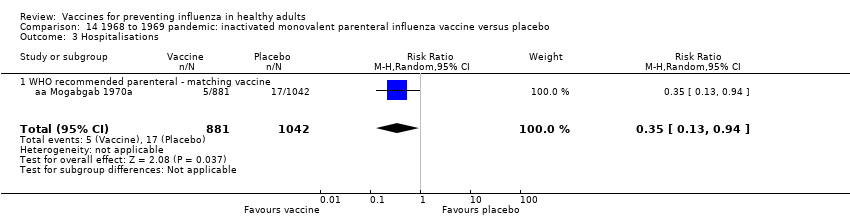
Comparison 14 1968 to 1969 pandemic: inactivated monovalent parenteral influenza vaccine versus placebo, Outcome 3 Hospitalisations.
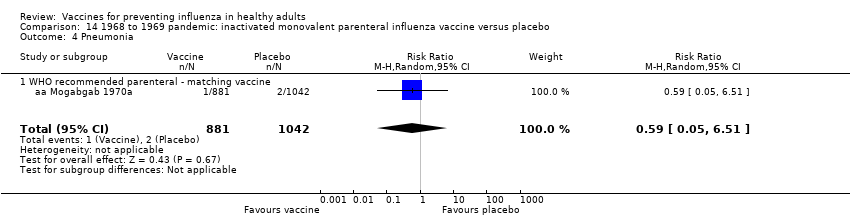
Comparison 14 1968 to 1969 pandemic: inactivated monovalent parenteral influenza vaccine versus placebo, Outcome 4 Pneumonia.

Comparison 14 1968 to 1969 pandemic: inactivated monovalent parenteral influenza vaccine versus placebo, Outcome 5 Working days lost.
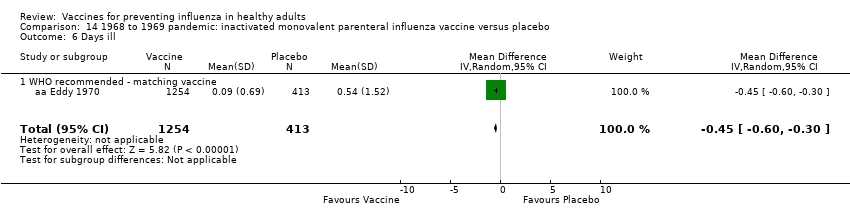
Comparison 14 1968 to 1969 pandemic: inactivated monovalent parenteral influenza vaccine versus placebo, Outcome 6 Days ill.
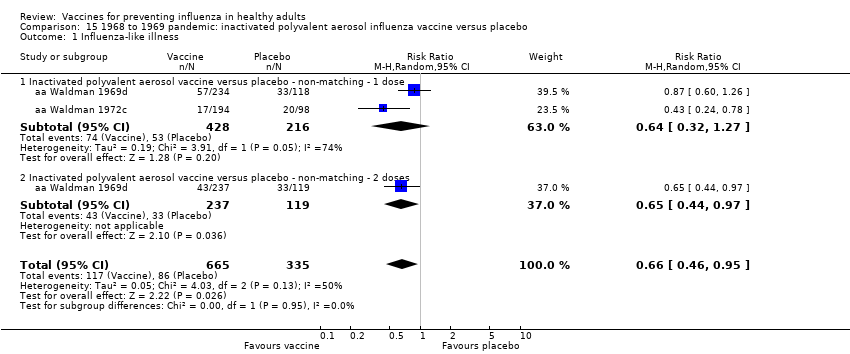
Comparison 15 1968 to 1969 pandemic: inactivated polyvalent aerosol influenza vaccine versus placebo, Outcome 1 Influenza‐like illness.
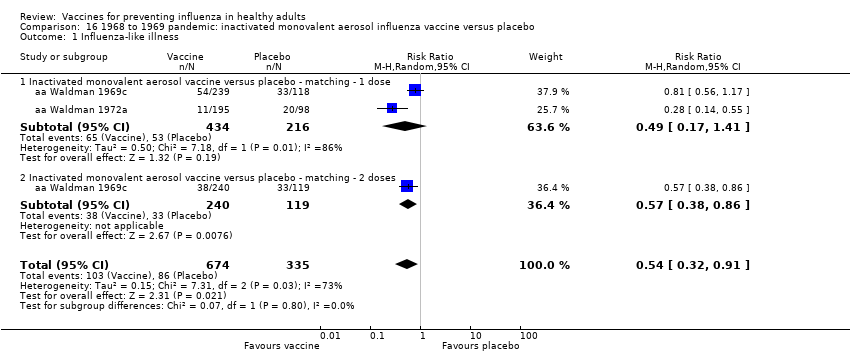
Comparison 16 1968 to 1969 pandemic: inactivated monovalent aerosol influenza vaccine versus placebo, Outcome 1 Influenza‐like illness.
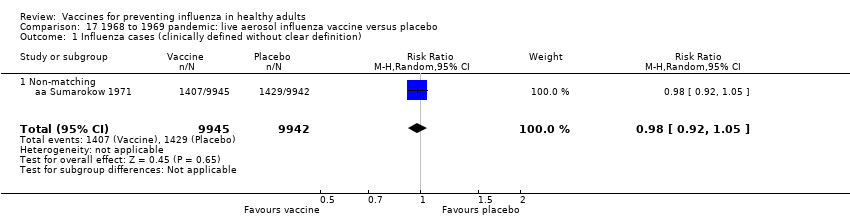
Comparison 17 1968 to 1969 pandemic: live aerosol influenza vaccine versus placebo, Outcome 1 Influenza cases (clinically defined without clear definition).
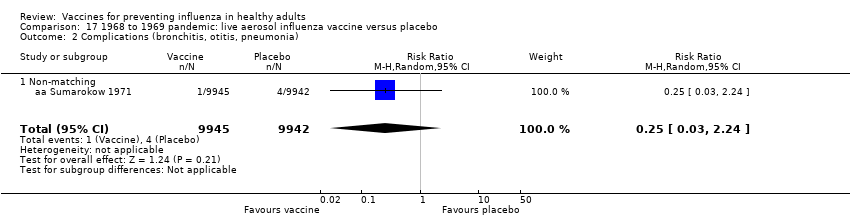
Comparison 17 1968 to 1969 pandemic: live aerosol influenza vaccine versus placebo, Outcome 2 Complications (bronchitis, otitis, pneumonia).
| Inactivated parenteral influenza vaccine compared to placebo or 'do nothing' for preventing influenza in healthy adults | ||||||
| Patient or population: healthy adults | ||||||
| Outcomes | Anticipated absolute effects* (95% CI) | Relative effect | № of participants | Quality of the evidence | Comments | |
| Risk with placebo or 'do nothing' | Risk with inactivated parenteral influenza vaccine | |||||
| Influenza Timing of assessment: most studies tested vaccines over a single influenza season | Study population1 | RR 0.41 | 71,221 | ⊕⊕⊕⊝ | ||
| 23 per 1000 | 9 per 1000 | |||||
| Influenza‐like illness Timing of assessment: most studies tested vaccines over a single influenza season | Low1 | RR 0.84 | 25,795 | ⊕⊕⊕⊝ | ||
| 40 per 1000 | 34 per 1000 | |||||
| Moderate | ||||||
| 215 per 1000 | 181 per 1000 | |||||
| High | ||||||
| 910 per 1000 | 764 per 1000 | |||||
| Hospitalisations Timing of assessment: single influenza season | Study population1 | RR 0.96 | 11,924 | ⊕⊕⊝⊝ | ||
| 147 per 1000 | 141 per 1000 | |||||
| Time off work Timing of assessment: single influenza season | Study population1 | NA | 3726 (4 RCTs) | ⊕⊕⊝⊝ | ||
| Average number of days lost per person ranged from 0.2 to 2 days over the season. | Average reduction in working days lost following vaccination was 0.04 days fewer (0.14 fewer to 0.06 days more) | |||||
| Fever assessed by subjective report Timing of assessment: single influenza season | Study population1 | RR 1.55 | 23,850 | ⊕⊕⊕⊕ | ||
| 15 per 1000 | 23 per 1000 | |||||
| Nausea or vomiting Timing of assessment: single influenza season | Study population1 | RR 1.80 | 6315 | ⊕⊕⊝⊝ | ||
| 37 per 1000 | 66 per 1000 | |||||
| *The risk in the intervention group (and its 95% confidence interval) is based on the assumed risk in the comparison group and the relative effect of the intervention (and its 95% CI). | ||||||
| GRADE Working Group grades of evidence | ||||||
| 1Control group risk calculated as the sum of events over total sample size from the control groups. For the outcome of influenza‐like illness, control group risk was stratified as low, moderate (or median), and high due to variation in risk groups across the studies. For the remaining outcomes, the control group risk was taken as aggregate. | ||||||
| Review version (searches date) | Number of included trials (RCTs/CCTs) | Number of included observational studies | Estimates of effect (RCTs/CCTs only) | Conclusions (1‐2 lines from abstract) |
| Version 1 (6 July 1999) | 20 | 0 | Clinical influenza TIV = 24% (95% CI 15% to 32%) LAIV = 13% (95% CI 5% to 20%) IAV = 40% (95% CI 13% to 59%) Laboratory‐confirmed influenza TIV = 68% (95% CI 49% to 79%) LAIV = 48% (95% CI 24% to 64%) IAV = no evidence | Influenza vaccines are effective in reducing serologically confirmed cases of influenza A. However, they are not as effective in reducing cases of clinical influenza. The use of WHO recommended vaccines appears to enhance their effectiveness in practice. |
| Version 2 (24 May 2004) | 25 | 0 | Clinical influenza TIV = 25% (95% CI 13% to 35%) LAIV = 15% (95% CI 8% to 21%) IAV = 40% (95% CI 13% to 59%) Laboratory‐confirmed influenza TIV = 70% (95% CI 56% to 80%) LAIV = 48% (95% CI 24% to 64%) IAV = no evidence | Influenza vaccines are effective in reducing serologically confirmed cases of influenza. However, they are not as effective in reducing cases of clinical influenza and number of working days lost. Universal immunisation of healthy adults is not supported by the results of this review. |
| Version 3 (16 February 2007) | 38 | 10 (for harms only) | ILI TIV = 30% (95% CI 17% to 41%) LAIV = n.s. IAV = n.s. Influenza TIV = 80% (95% CI 56% to 81%) LAIV = 56% (95% CI 19% to 76%) IAV = no evidence | Influenza vaccines are effective in reducing cases of influenza, especially when the content accurately predicts circulating types and circulation is high. However, they are less effective in reducing cases of influenza‐like illness and have a modest impact on working days lost. There is insufficient evidence to assess their impact on complications. Whole‐virion monovalent vaccines may perform best in a pandemic. |
| Version 4 (15 June 2010) | 40 | 10 (for harms only) | ILI TIV = 30% (95% CI 17% to 41%) LAIV = n.s. IAV = n.s. Influenza TIV = 73% (95% CI 54% to 84%) LAIV = 56% (95% CI 19% to 76%) IAV = no evidence | Influenza vaccines have a modest effect in reducing influenza symptoms and working days lost. There is no evidence that they affect complications, such as pneumonia, or transmission. |
| Version 5 (4 March 2014) | 48 | 42 | ILI TIV = 17% (95% CI 11% to 23%) LAIV = n.s. IAV = n.s. Influenza TIV = 63% (95% CI 55% to 69%) LAIV = 45% (95% CI 18% to 63%) IAV = n.s. | Influenza vaccines have a very modest effect in reducing influenza symptoms and working days lost in the general population, including pregnant women. No evidence of association between influenza vaccination and serious adverse events was found in the comparative studies considered in the review. |
| CCT: controlled clinical trial Effect estimates are from Comparison 02 (At least one vaccine recommended for that year versus placebo or other vaccine). A clinically defined case was assumed as any case definition based on symptoms without further specification. A clinically defined case (specific definition) was defined as:
When more than one definition was given for the same trial, data related to the more specific definition were included. In Analysis 2.1 from versions 1 and 2, studies with both definitions are included. Evidence about effectiveness of aerosol inactivated vaccine comes only from studies carried out during the 1968‐69 pandemic. From version 3 onwards, specific comparisons have been added. Versions 3, 4, 5 Recommended vaccine matching circulating strains. Version 5 Out of the 42 included observational studies, 8 assessed efficacy or effectiveness of vaccine, or both, when administered during pregnancy (6 cohort and 2 case‐control studies). Version 6 (current) In two new RCTs included in this version, vaccination was performed during pregnancy. Regarding efficacy/effectiveness of TIV administered in general population, estimates assessed by applying random‐effects model were 16% (95% CI 9% to 23%) against ILI and 62% (95% CI 52% to 69%) against influenza, respectively. In a previous interim unpublished update before the decision to stabilise the review was made, a further 16 observational studies were included: 3 case‐control and 2 cohort studies assessing the safety of influenza vaccine administration in general population, 10 cohort studies assessing the safety of influenza vaccine administration during pregnancy, and one cohort study assessing efficacy/effectiveness of the vaccine administration during pregnancy. In this 2016 updated review, we included a total of 160 studies (137 data sets), while we no longer updated searches for observational comparative studies. | ||||
| Study design | High risk | Low risk | Unclear risk | Total |
| Case‐control | 3 | 2 | 18 | 23 |
| Cohort | 14 | 8 | 18 | 40 |
| RCT/CCT | 7 | 12 | 55 | 74 |
| Total | 24 | 22 | 91 | 137 |
| CCT: controlled clinical trial This table displays the overall methodological quality assessment of the included studies described in the text and represented in extended form (with all items of the tools) in Figure 1. | ||||
| Study design | Government, institutional, or public | Industry | Mixed | Total |
| Case‐control | 14 | 2 | 2 | 18 |
| Cohort | 33 | 5 | 2 | 40 |
| RCT/CCT | 32 | 15 | 5 | 52 |
| Total | 79 | 22 | 9 | 110 |
| CCT: controlled clinical trial | ||||
| Outcome (analysis) | All studies (primary analysis) | Studies at low risk of bias (sensitivity analysis) |
| Influenza (Analysis 1.1) | RR 0.41 (0.36 to 0.47) | RR 0.34 (0.25 to 0.45) |
| Influenza‐like illness (Analysis 1.2) | RR 0.84 (0.75 to 0.95) | RR 0.82 (0.69 to 0.98) |
| Hospitalisations (Analysis 1.8) | RR 0.96 (0.85 to 1.08) | RR 2.89 (0.12 to 70.68) |
| Fever (Analysis 1.11.2) | RR 1.55 (1.26 to 1.91) | RR 1.59 (1 to 2.53) |
| Nausea/vomiting (Analysis 1.11.5) | RR 1.80 (0.65 to 5.04) | RR 7.05 (1.61 to 30.87) |
| RR: risk ratio | ||
| Outcome or subgroup title | No. of studies | No. of participants | Statistical method | Effect size |
| 1 Influenza Show forest plot | 25 | 71221 | Risk Ratio (M‐H, Random, 95% CI) | 0.41 [0.36, 0.47] |
| 1.1 WHO recommended ‐ matching vaccine | 15 | 46444 | Risk Ratio (M‐H, Random, 95% CI) | 0.41 [0.34, 0.49] |
| 1.2 WHO recommended ‐ vaccine matching absent or unknown | 7 | 15068 | Risk Ratio (M‐H, Random, 95% CI) | 0.45 [0.34, 0.59] |
| 1.3 Monovalent not WHO recommended ‐ vaccine matching | 2 | 9675 | Risk Ratio (M‐H, Random, 95% CI) | 0.22 [0.10, 0.52] |
| 1.4 Monovalent not WHO recommended ‐ vaccine matching ‐ high dose | 1 | 34 | Risk Ratio (M‐H, Random, 95% CI) | 0.11 [0.00, 2.49] |
| 2 Influenza‐like illness Show forest plot | 16 | 25795 | Risk Ratio (M‐H, Random, 95% CI) | 0.84 [0.75, 0.95] |
| 2.1 WHO recommended ‐ matching vaccine | 7 | 4760 | Risk Ratio (M‐H, Random, 95% CI) | 0.84 [0.77, 0.91] |
| 2.2 WHO recommended ‐ vaccine matching absent or unknown | 7 | 20942 | Risk Ratio (M‐H, Random, 95% CI) | 0.90 [0.69, 1.18] |
| 2.3 Monovalent not WHO recommended ‐ vaccine matching | 1 | 59 | Risk Ratio (M‐H, Random, 95% CI) | 1.02 [0.28, 3.70] |
| 2.4 Monovalent not WHO recommended ‐ vaccine matching ‐ high dose | 1 | 34 | Risk Ratio (M‐H, Random, 95% CI) | 0.46 [0.09, 2.30] |
| 3 Physician visits Show forest plot | 2 | 2308 | Risk Ratio (M‐H, Random, 95% CI) | 0.87 [0.40, 1.89] |
| 3.1 WHO recommended ‐ matching vaccine | 1 | 1178 | Risk Ratio (M‐H, Random, 95% CI) | 0.58 [0.37, 0.91] |
| 3.2 WHO recommended ‐ vaccine matching absent or unknown | 1 | 1130 | Risk Ratio (M‐H, Random, 95% CI) | 1.28 [0.90, 1.83] |
| 4 Days ill Show forest plot | 3 | 3133 | Mean Difference (IV, Random, 95% CI) | ‐0.21 [‐0.98, 0.56] |
| 4.1 WHO recommended ‐ matching vaccine | 2 | 2003 | Mean Difference (IV, Random, 95% CI) | ‐0.58 [‐0.85, ‐0.32] |
| 4.2 WHO recommended ‐ matching absent or unknown | 1 | 1130 | Mean Difference (IV, Random, 95% CI) | 0.66 [0.16, 1.16] |
| 5 Times any drugs were prescribed Show forest plot | 2 | 2308 | Mean Difference (IV, Random, 95% CI) | ‐0.01 [‐0.03, 0.01] |
| 5.1 WHO recommended ‐ matching vaccine | 1 | 1178 | Mean Difference (IV, Random, 95% CI) | ‐0.02 [‐0.04, ‐0.00] |
| 5.2 WHO recommended ‐ matching absent or unknown | 1 | 1130 | Mean Difference (IV, Random, 95% CI) | 0.0 [‐0.00, 0.00] |
| 6 Times antibiotic was prescribed Show forest plot | 2 | 2308 | Mean Difference (IV, Random, 95% CI) | ‐0.02 [‐0.03, ‐0.01] |
| 6.1 WHO recommended ‐ matching vaccine | 1 | 1178 | Mean Difference (IV, Random, 95% CI) | ‐0.02 [‐0.03, ‐0.01] |
| 6.2 WHO recommended ‐ matching absent or unknown | 1 | 1130 | Mean Difference (IV, Random, 95% CI) | ‐0.01 [‐0.03, 0.01] |
| 7 Working days lost Show forest plot | 4 | 3726 | Mean Difference (IV, Random, 95% CI) | ‐0.04 [‐0.14, 0.06] |
| 7.1 WHO recommended ‐ matching vaccine | 3 | 2596 | Mean Difference (IV, Random, 95% CI) | ‐0.09 [‐0.19, 0.02] |
| 7.2 WHO recommended ‐ matching absent or unknown | 1 | 1130 | Mean Difference (IV, Random, 95% CI) | 0.09 [0.00, 0.18] |
| 8 Hospitalisations Show forest plot | 3 | 11924 | Risk Ratio (M‐H, Random, 95% CI) | 0.96 [0.85, 1.08] |
| 8.1 WHO recommended ‐ matching vaccine | 1 | 1178 | Risk Ratio (M‐H, Random, 95% CI) | 0.0 [0.0, 0.0] |
| 8.2 WHO recommended ‐ vaccine matching absent or unknown | 1 | 1130 | Risk Ratio (M‐H, Random, 95% CI) | 2.89 [0.12, 70.68] |
| 8.3 Monovalent not WHO recommended ‐ vaccine matching | 1 | 9616 | Risk Ratio (M‐H, Random, 95% CI) | 0.96 [0.85, 1.08] |
| 9 Clinical cases (clinically defined without clear definition) Show forest plot | 3 | 4259 | Risk Ratio (M‐H, Random, 95% CI) | 0.87 [0.72, 1.05] |
| 9.1 WHO recommended ‐ matching vaccine | 2 | 2056 | Risk Ratio (M‐H, Random, 95% CI) | 0.89 [0.64, 1.25] |
| 9.2 WHO recommended ‐ vaccine matching absent or unknown | 1 | 2203 | Risk Ratio (M‐H, Random, 95% CI) | 0.83 [0.69, 0.99] |
| 10 Local harms Show forest plot | 20 | Risk Ratio (M‐H, Random, 95% CI) | Subtotals only | |
| 10.1 Local ‐ tenderness/soreness | 20 | 35655 | Risk Ratio (M‐H, Random, 95% CI) | 3.13 [2.44, 4.02] |
| 10.2 Local ‐ erythema | 9 | 29499 | Risk Ratio (M‐H, Random, 95% CI) | 2.59 [1.77, 3.78] |
| 10.3 Local ‐ induration | 3 | 7786 | Risk Ratio (M‐H, Random, 95% CI) | 4.28 [1.25, 14.67] |
| 10.4 Local ‐ arm stiffness | 1 | 50 | Risk Ratio (M‐H, Random, 95% CI) | 1.62 [0.54, 4.83] |
| 10.5 Local ‐ combined endpoint (any or highest symptom) | 11 | 12307 | Risk Ratio (M‐H, Random, 95% CI) | 2.44 [1.82, 3.28] |
| 11 Systemic harms Show forest plot | 17 | Risk Ratio (M‐H, Random, 95% CI) | Subtotals only | |
| 11.1 Systemic ‐ myalgia | 11 | 35008 | Risk Ratio (M‐H, Random, 95% CI) | 1.74 [1.41, 2.14] |
| 11.2 Systemic ‐ fever | 13 | 23850 | Risk Ratio (M‐H, Random, 95% CI) | 1.55 [1.26, 1.91] |
| 11.3 Systemic ‐ headache | 14 | 35999 | Risk Ratio (M‐H, Random, 95% CI) | 1.14 [0.99, 1.30] |
| 11.4 Systemic ‐ fatigue or indisposition | 12 | 35788 | Risk Ratio (M‐H, Random, 95% CI) | 1.19 [1.05, 1.36] |
| 11.5 Systemic ‐ nausea/vomiting | 4 | 6315 | Risk Ratio (M‐H, Random, 95% CI) | 1.80 [0.65, 5.04] |
| 11.6 Systemic ‐ malaise | 3 | 26111 | Risk Ratio (M‐H, Random, 95% CI) | 1.51 [1.18, 1.92] |
| 11.7 Systemic ‐ combined endpoint (any or highest symptom) | 6 | 2128 | Risk Ratio (M‐H, Random, 95% CI) | 1.16 [0.87, 1.53] |
| Outcome or subgroup title | No. of studies | No. of participants | Statistical method | Effect size |
| 1 Influenza Show forest plot | 9 | 11579 | Risk Ratio (M‐H, Random, 95% CI) | 0.47 [0.35, 0.62] |
| 1.1 WHO recommended ‐ matching vaccine | 4 | 6584 | Risk Ratio (M‐H, Random, 95% CI) | 0.55 [0.37, 0.82] |
| 1.2 WHO recommended ‐ vaccine matching absent or unknown | 3 | 4568 | Risk Ratio (M‐H, Random, 95% CI) | 0.43 [0.27, 0.68] |
| 1.3 Non WHO recommended ‐ vaccine matching absent or unknown | 2 | 427 | Risk Ratio (M‐H, Random, 95% CI) | 0.21 [0.08, 0.56] |
| 2 Influenza‐like illness Show forest plot | 6 | 12688 | Risk Ratio (M‐H, Random, 95% CI) | 0.90 [0.84, 0.96] |
| 2.1 WHO recommended ‐ matching vaccine | 2 | 4254 | Risk Ratio (M‐H, Random, 95% CI) | 0.92 [0.76, 1.12] |
| 2.2 WHO recommended ‐ vaccine matching absent or unknown | 3 | 8150 | Risk Ratio (M‐H, Random, 95% CI) | 0.89 [0.82, 0.97] |
| 2.3 Non WHO recommended ‐ vaccine matching absent or unknown | 1 | 284 | Risk Ratio (M‐H, Random, 95% CI) | 0.92 [0.73, 1.16] |
| 3 Influenza cases (clinically defined without clear definition) Show forest plot | 3 | 23900 | Risk Ratio (M‐H, Random, 95% CI) | 0.89 [0.71, 1.11] |
| 3.1 WHO recommended ‐ matching vaccine | 1 | 1931 | Risk Ratio (M‐H, Random, 95% CI) | 0.63 [0.49, 0.80] |
| 3.2 WHO recommended ‐ vaccine matching absent or unknown | 1 | 2082 | Risk Ratio (M‐H, Random, 95% CI) | 1.05 [0.88, 1.25] |
| 3.3 Non WHO recommended ‐ vaccine matching absent or unknown | 1 | 19887 | Risk Ratio (M‐H, Random, 95% CI) | 0.98 [0.92, 1.05] |
| 4 Local harms Show forest plot | 13 | Risk Ratio (M‐H, Random, 95% CI) | Subtotals only | |
| 4.1 Local ‐ upper respiratory infection symptoms | 6 | 496 | Risk Ratio (M‐H, Random, 95% CI) | 1.66 [1.22, 2.27] |
| 4.2 Local ‐ cough | 6 | 2401 | Risk Ratio (M‐H, Random, 95% CI) | 1.51 [1.08, 2.10] |
| 4.3 Local ‐ coryza | 2 | 4782 | Risk Ratio (M‐H, Random, 95% CI) | 1.56 [1.26, 1.94] |
| 4.4 Local ‐ sore throat | 7 | 6940 | Risk Ratio (M‐H, Random, 95% CI) | 1.66 [1.49, 1.86] |
| 4.5 Local ‐ hoarseness | 1 | 306 | Risk Ratio (M‐H, Random, 95% CI) | 1.21 [0.51, 2.83] |
| 4.6 Local ‐ combined endpoint (any or highest symptom) | 3 | 4921 | Risk Ratio (M‐H, Random, 95% CI) | 1.56 [1.31, 1.87] |
| 5 Systemic harms Show forest plot | 7 | Risk Ratio (M‐H, Random, 95% CI) | Subtotals only | |
| 5.1 Systemic ‐ myalgia | 4 | 1318 | Risk Ratio (M‐H, Random, 95% CI) | 2.47 [1.26, 4.85] |
| 5.2 Systemic ‐ fever | 4 | 1318 | Risk Ratio (M‐H, Random, 95% CI) | 1.01 [0.54, 1.92] |
| 5.3 Systemic ‐ fatigue or indisposition | 3 | 1018 | Risk Ratio (M‐H, Random, 95% CI) | 1.39 [0.93, 2.07] |
| 5.4 Systemic ‐ headache | 2 | 975 | Risk Ratio (M‐H, Random, 95% CI) | 1.54 [1.09, 2.18] |
| 5.5 Systemic ‐ combined endpoint (any or highest symptom) | 5 | 1018 | Risk Ratio (M‐H, Random, 95% CI) | 1.40 [0.82, 2.38] |
| Outcome or subgroup title | No. of studies | No. of participants | Statistical method | Effect size |
| 1 Influenza Show forest plot | 1 | 1348 | Odds Ratio (M‐H, Random, 95% CI) | 0.38 [0.14, 1.02] |
| 1.1 WHO recommended ‐ vaccine matching absent or unknown | 1 | 1348 | Odds Ratio (M‐H, Random, 95% CI) | 0.38 [0.14, 1.02] |
| 1.2 WHO recommended ‐ matching vaccine | 0 | 0 | Odds Ratio (M‐H, Random, 95% CI) | 0.0 [0.0, 0.0] |
| 2 Local harms Show forest plot | 3 | 1578 | Risk Ratio (M‐H, Random, 95% CI) | 0.95 [0.71, 1.27] |
| 2.1 Local ‐ sore throat | 3 | 1500 | Risk Ratio (M‐H, Random, 95% CI) | 0.85 [0.54, 1.33] |
| 2.2 Local ‐ combined endpoint (any or highest symptom) | 1 | 78 | Risk Ratio (M‐H, Random, 95% CI) | 1.03 [0.71, 1.48] |
| 3 Systemic harms Show forest plot | 3 | 1880 | Risk Ratio (M‐H, Random, 95% CI) | 1.07 [0.71, 1.62] |
| 3.1 Systemic ‐ myalgia | 2 | 151 | Risk Ratio (M‐H, Random, 95% CI) | 0.90 [0.36, 2.25] |
| 3.2 Systemic ‐ fatigue or indisposition | 2 | 151 | Risk Ratio (M‐H, Random, 95% CI) | 1.40 [0.52, 3.75] |
| 3.3 Systemic ‐ headache | 2 | 151 | Risk Ratio (M‐H, Random, 95% CI) | 1.52 [0.85, 2.72] |
| 3.4 Systemic ‐ fever | 1 | 1349 | Risk Ratio (M‐H, Random, 95% CI) | 0.49 [0.03, 7.80] |
| 3.5 Systemic ‐ combined endpoint (any or highest symptom) | 1 | 78 | Risk Ratio (M‐H, Random, 95% CI) | 0.36 [0.12, 1.04] |
| Outcome or subgroup title | No. of studies | No. of participants | Statistical method | Effect size |
| 1 Influenza in mothers Show forest plot | 1 | Risk Ratio (M‐H, Random, 95% CI) | Totals not selected | |
| 1.1 TIV containing pH1N1 | 1 | Risk Ratio (M‐H, Random, 95% CI) | 0.0 [0.0, 0.0] | |
| 2 Influenza‐like illness in mothers Show forest plot | 2 | 2342 | Risk Ratio (M‐H, Random, 95% CI) | 0.62 [0.20, 1.95] |
| 2.1 TIV containing pH1N1 | 1 | 2116 | Risk Ratio (M‐H, Random, 95% CI) | 0.96 [0.79, 1.16] |
| 2.2 Monovalent pH1N1 | 1 | 226 | Risk Ratio (M‐H, Random, 95% CI) | 0.28 [0.08, 1.02] |
| 3 Influenza in newborn Show forest plot | 1 | Risk Ratio (M‐H, Random, 95% CI) | Totals not selected | |
| 3.1 TIV containing pH1N1 | 1 | Risk Ratio (M‐H, Random, 95% CI) | 0.0 [0.0, 0.0] | |
| 4 Influenza‐like illness in newborn Show forest plot | 1 | Risk Ratio (M‐H, Random, 95% CI) | Totals not selected | |
| 4.1 TIV containing pH1N1 | 1 | Risk Ratio (M‐H, Random, 95% CI) | 0.0 [0.0, 0.0] | |
| Outcome or subgroup title | No. of studies | No. of participants | Statistical method | Effect size |
| 1 Seasonal inactivated vaccine effectiveness in mothers ‐ pregnant women Show forest plot | 4 | Risk Ratio (M‐H, Random, 95% CI) | Subtotals only | |
| 1.1 H1N1 ‐ vaccine ‐ effectiveness ILI (unadjusted data) | 1 | 7328 | Risk Ratio (M‐H, Random, 95% CI) | 0.11 [0.06, 0.21] |
| 1.2 Seasonal ‐ vaccine ‐ effectiveness ILI ‐ (unadjusted data) | 3 | 50507 | Risk Ratio (M‐H, Random, 95% CI) | 0.54 [0.24, 1.18] |
| 2 Seasonal inactivated vaccine effectiveness in newborns ‐ pregnant women Show forest plot | 2 | Hazard Ratio (Random, 95% CI) | Subtotals only | |
| 2.1 Seasonal vaccine effectiveness ILI (HR adjusted data) | 2 | Hazard Ratio (Random, 95% CI) | 0.96 [0.90, 1.03] | |
| 3 Seasonal inactivated vaccine effectiveness in newborns ‐ pregnant women Show forest plot | 1 | Risk Ratio (Random, 95% CI) | Subtotals only | |
| 3.1 Seasonal vaccine effectiveness ILI (RR adjusted data) | 1 | Risk Ratio (Random, 95% CI) | 0.92 [0.73, 1.16] | |
| 3.2 Seasonal vaccine efficacy influenza ‐ laboratory‐confirmed | 1 | Risk Ratio (Random, 95% CI) | 0.59 [0.37, 0.94] | |
| 4 H1N1 vaccine ‐ safety ‐ pregnancy‐related outcomes ‐ pregnant women Show forest plot | 15 | Odds Ratio (Random, 95% CI) | Subtotals only | |
| 4.1 Abortion (OR adjusted data) | 5 | Odds Ratio (Random, 95% CI) | 0.75 [0.62, 0.90] | |
| 4.2 Abortion (HR adjusted data) | 3 | Odds Ratio (Random, 95% CI) | 0.81 [0.63, 1.04] | |
| 4.3 Congenital malformation (OR adjusted data) | 6 | Odds Ratio (Random, 95% CI) | 1.11 [0.99, 1.23] | |
| 4.4 Prematurity (< 37 weeks) (OR unadjusted data) | 11 | Odds Ratio (Random, 95% CI) | 0.76 [0.67, 0.85] | |
| 4.5 Prematurity (< 37 weeks) (OR adjusted data) | 7 | Odds Ratio (Random, 95% CI) | 0.84 [0.76, 0.93] | |
| 4.6 Prematurity (< 37 weeks) (HR adjusted data) | 2 | Odds Ratio (Random, 95% CI) | 1.11 [0.46, 2.68] | |
| 4.7 Prematurity (< 37 weeks) vaccination in I trimester OR adjusted data | 2 | Odds Ratio (Random, 95% CI) | 1.08 [0.92, 1.28] | |
| 4.8 Prematurity (< 37 weeks) vaccination in II/III trimester OR adjusted data | 2 | Odds Ratio (Random, 95% CI) | 0.96 [0.87, 1.06] | |
| 4.9 Neonatal death (OR adjusted data) | 2 | Odds Ratio (Random, 95% CI) | 1.09 [0.40, 2.95] | |
| 5 Seasonal vaccine ‐ safety ‐ pregnancy‐related outcomes ‐ pregnant women Show forest plot | 7 | Odds Ratio (Random, 95% CI) | Subtotals only | |
| 5.1 Abortion (OR unadjusted data) | 1 | Odds Ratio (Random, 95% CI) | 0.60 [0.41, 0.86] | |
| 5.2 Congenital malformation (OR unadjusted data) | 2 | Odds Ratio (Random, 95% CI) | 0.55 [0.08, 3.73] | |
| 5.3 Prematurity (OR unadjusted data) | 6 | Odds Ratio (Random, 95% CI) | 0.95 [0.82, 1.10] | |
| 5.4 Prematurity (OR adjusted data) | 2 | Odds Ratio (Random, 95% CI) | 0.93 [0.82, 1.06] | |
| 5.5 Neonatal death (OR unadjusted data) | 1 | Odds Ratio (Random, 95% CI) | 0.55 [0.35, 0.88] | |
| 6 Seasonal vaccine containing H1N1 Show forest plot | 2 | Risk Ratio (Random, 95% CI) | Subtotals only | |
| 6.1 Prematurity (37 weeks) vaccination in I trimester HR adjusted data | 2 | Risk Ratio (Random, 95% CI) | 1.63 [0.76, 3.47] | |
| 6.2 Prematurity (< 37 weeks) vaccination in II trimester HR adjusted data | 2 | Risk Ratio (Random, 95% CI) | 1.48 [0.21, 10.64] | |
| 6.3 Prematurity (< 37 weeks) vaccination in III trimester HR adjusted data | 2 | Risk Ratio (Random, 95% CI) | 1.37 [0.44, 4.25] | |
| 6.4 Prematurity (< 37 weeks) vaccination at any time during pregnancy HR adjusted data | 2 | Risk Ratio (Random, 95% CI) | 1.75 [0.57, 5.44] | |
| Outcome or subgroup title | No. of studies | No. of participants | Statistical method | Effect size |
| 1 Effectiveness in newborns ‐ pregnant women (adjusted data) Show forest plot | 2 | Odds Ratio (Random, 95% CI) | 0.24 [0.04, 1.40] | |
| 1.1 Seasonal vaccine ‐ effectiveness ‐ ILI ‐ pregnant women | 2 | Odds Ratio (Random, 95% CI) | 0.24 [0.04, 1.40] | |
| 2 Seasonal vaccine safety ‐ pregnancy‐related outcomes (adjusted data) Show forest plot | 1 | Odds Ratio (Random, 95% CI) | 0.80 [0.36, 1.78] | |
| 2.1 Abortion | 1 | Odds Ratio (Random, 95% CI) | 0.80 [0.36, 1.78] | |
| Outcome or subgroup title | No. of studies | No. of participants | Statistical method | Effect size |
| 1 Seasonal influenza vaccination and Guillain‐Barré syndrome Show forest plot | 3 | Risk Ratio (Random, 95% CI) | 1.28 [0.85, 1.93] | |
| 1.1 General population (adjusted data) | 2 | Risk Ratio (Random, 95% CI) | 1.29 [0.83, 2.02] | |
| 1.2 Pregnant women (unadjusted data) | 1 | Risk Ratio (Random, 95% CI) | 0.65 [0.03, 15.95] | |
| Outcome or subgroup title | No. of studies | No. of participants | Statistical method | Effect size |
| 1 2009 to 2010 A/H1N1 ‐ general population (unadjusted data) Show forest plot | 6 | Odds Ratio (M‐H, Random, 95% CI) | Subtotals only | |
| 1.1 < 7 weeks | 6 | 1528 | Odds Ratio (M‐H, Random, 95% CI) | 2.22 [1.14, 4.31] |
| 1.2 At any time | 6 | 1656 | Odds Ratio (M‐H, Random, 95% CI) | 1.69 [0.87, 3.29] |
| 2 2009 to 2010 A/H1N1 ‐ general population (adjusted data) Show forest plot | 4 | Odds Ratio (Random, 95% CI) | 0.83 [0.39, 1.75] | |
| 2.1 < 7 weeks | 4 | Odds Ratio (Random, 95% CI) | 0.92 [0.35, 2.40] | |
| 2.2 > 6 weeks (i.e. at any time) | 3 | Odds Ratio (Random, 95% CI) | 0.71 [0.22, 2.32] | |
| 3 Seasonal influenza vaccination general population (adjusted data) Show forest plot | 1 | Odds Ratio (Random, 95% CI) | 1.38 [0.18, 10.43] | |
| Outcome or subgroup title | No. of studies | No. of participants | Statistical method | Effect size |
| 1 Influenza vaccination (seasonal) ‐ demyelinating diseases (unadjusted data) Show forest plot | 1 | 223898 | Odds Ratio (M‐H, Random, 95% CI) | 0.16 [0.02, 1.25] |
| 1.1 General population | 0 | 0 | Odds Ratio (M‐H, Random, 95% CI) | 0.0 [0.0, 0.0] |
| 1.2 Pregnant women | 1 | 223898 | Odds Ratio (M‐H, Random, 95% CI) | 0.16 [0.02, 1.25] |
| 2 Influenza vaccination (H1N1) ‐ demyelinating diseases (unadjusted) Show forest plot | 1 | 144252 | Risk Ratio (M‐H, Random, 95% CI) | 2.06 [0.51, 8.22] |
| Outcome or subgroup title | No. of studies | No. of participants | Statistical method | Effect size |
| 1 Influenza vaccination (seasonal) ‐ general population ‐ demyelinating diseases (unadjusted data) Show forest plot | 4 | 8009 | Odds Ratio (M‐H, Random, 95% CI) | 0.96 [0.79, 1.17] |
| 2 Influenza vaccination (seasonal) ‐ general population ‐ multiple sclerosis (adjusted data) Show forest plot | 2 | Odds Ratio (Random, 95% CI) | 0.76 [0.54, 1.08] | |
| 3 Influenza vaccination (seasonal) ‐ general population ‐ optic neuritis (adjusted data) Show forest plot | 2 | Odds Ratio (Random, 95% CI) | 1.03 [0.82, 1.30] | |
| Outcome or subgroup title | No. of studies | No. of participants | Statistical method | Effect size |
| 1 Seasonal influenza vaccine ‐ HR (adjusted data) Show forest plot | 1 | Hazard Ratio (Random, 95% CI) | Subtotals only | |
| 1.1 General population | 0 | Hazard Ratio (Random, 95% CI) | 0.0 [0.0, 0.0] | |
| 1.2 Pregnant women | 1 | Hazard Ratio (Random, 95% CI) | 0.90 [0.68, 1.19] | |
| 2 Seasonal influenza vaccine (unadjusted data) Show forest plot | 1 | Odds Ratio (M‐H, Random, 95% CI) | Subtotals only | |
| 2.1 General population | 0 | 0 | Odds Ratio (M‐H, Random, 95% CI) | 0.0 [0.0, 0.0] |
| 2.2 Pregnant women | 1 | 223898 | Odds Ratio (M‐H, Random, 95% CI) | 0.92 [0.70, 1.20] |
| Outcome or subgroup title | No. of studies | No. of participants | Statistical method | Effect size |
| 1 Seasonal influenza vaccine ‐ general population (adjusted data) Show forest plot | 2 | Odds Ratio (Random, 95% CI) | Subtotals only | |
| 1.1 < 2 months | 2 | Odds Ratio (Random, 95% CI) | 1.87 [0.43, 8.06] | |
| 1.2 < 6 months | 1 | Odds Ratio (Random, 95% CI) | 0.90 [0.55, 1.47] | |
| 1.3 < 12 months | 1 | Odds Ratio (Random, 95% CI) | 0.70 [0.47, 1.04] | |
| 2 Seasonal influenza vaccine ‐ general population (unadjusted data) Show forest plot | 2 | Odds Ratio (M‐H, Random, 95% CI) | Subtotals only | |
| 2.1 < 2 months | 2 | 1926 | Odds Ratio (M‐H, Random, 95% CI) | 1.72 [0.48, 6.15] |
| 2.2 < 6 months | 1 | 1065 | Odds Ratio (M‐H, Random, 95% CI) | 0.92 [0.59, 1.43] |
| 2.3 < 12 months | 1 | 1066 | Odds Ratio (M‐H, Random, 95% CI) | 0.72 [0.50, 1.05] |
| Outcome or subgroup title | No. of studies | No. of participants | Statistical method | Effect size |
| 1 Influenza‐like illness Show forest plot | 3 | 3065 | Risk Ratio (M‐H, Random, 95% CI) | 0.71 [0.57, 0.88] |
| 1.1 Standard recommended parenteral ‐ non‐matching ‐ 1 dose | 3 | 2715 | Risk Ratio (M‐H, Random, 95% CI) | 0.74 [0.57, 0.95] |
| 1.2 Standard recommended parenteral ‐ non‐matching ‐ 2 doses | 1 | 350 | Risk Ratio (M‐H, Random, 95% CI) | 0.66 [0.44, 0.98] |
| 2 Influenza Show forest plot | 1 | 2072 | Risk Ratio (M‐H, Random, 95% CI) | 0.47 [0.26, 0.87] |
| 2.1 Standard recommended parenteral ‐ non‐matching | 1 | 2072 | Risk Ratio (M‐H, Random, 95% CI) | 0.47 [0.26, 0.87] |
| 3 Hospitalisations Show forest plot | 1 | 2072 | Risk Ratio (M‐H, Random, 95% CI) | 0.83 [0.41, 1.68] |
| 3.1 Standard recommended parenteral ‐ non‐matching | 1 | 2072 | Risk Ratio (M‐H, Random, 95% CI) | 0.83 [0.41, 1.68] |
| 4 Pneumonia Show forest plot | 1 | 2072 | Risk Ratio (M‐H, Random, 95% CI) | 1.01 [0.14, 7.17] |
| 4.1 Standard recommended parenteral ‐ non‐matching | 1 | 2072 | Risk Ratio (M‐H, Random, 95% CI) | 1.01 [0.14, 7.17] |
| Outcome or subgroup title | No. of studies | No. of participants | Statistical method | Effect size |
| 1 Influenza‐like illness Show forest plot | 4 | 4580 | Risk Ratio (M‐H, Random, 95% CI) | 0.35 [0.25, 0.48] |
| 1.1 WHO recommended parenteral ‐ matching vaccine ‐ 1 dose | 4 | 4226 | Risk Ratio (M‐H, Random, 95% CI) | 0.35 [0.23, 0.53] |
| 1.2 WHO recommended parenteral ‐ matching vaccine ‐ 2 doses | 1 | 354 | Risk Ratio (M‐H, Random, 95% CI) | 0.35 [0.22, 0.57] |
| 2 Influenza Show forest plot | 1 | 1923 | Risk Ratio (M‐H, Random, 95% CI) | 0.07 [0.02, 0.31] |
| 2.1 WHO recommended parenteral ‐ matching vaccine | 1 | 1923 | Risk Ratio (M‐H, Random, 95% CI) | 0.07 [0.02, 0.31] |
| 3 Hospitalisations Show forest plot | 1 | 1923 | Risk Ratio (M‐H, Random, 95% CI) | 0.35 [0.13, 0.94] |
| 3.1 WHO recommended parenteral ‐ matching vaccine | 1 | 1923 | Risk Ratio (M‐H, Random, 95% CI) | 0.35 [0.13, 0.94] |
| 4 Pneumonia Show forest plot | 1 | 1923 | Risk Ratio (M‐H, Random, 95% CI) | 0.59 [0.05, 6.51] |
| 4.1 WHO recommended parenteral ‐ matching vaccine | 1 | 1923 | Risk Ratio (M‐H, Random, 95% CI) | 0.59 [0.05, 6.51] |
| 5 Working days lost Show forest plot | 1 | 1667 | Mean Difference (IV, Random, 95% CI) | ‐0.45 [‐0.60, ‐0.30] |
| 5.1 WHO recommended parenteral ‐ matching vaccine | 1 | 1667 | Mean Difference (IV, Random, 95% CI) | ‐0.45 [‐0.60, ‐0.30] |
| 6 Days ill Show forest plot | 1 | 1667 | Mean Difference (IV, Random, 95% CI) | ‐0.45 [‐0.60, ‐0.30] |
| 6.1 WHO recommended ‐ matching vaccine | 1 | 1667 | Mean Difference (IV, Random, 95% CI) | ‐0.45 [‐0.60, ‐0.30] |
| Outcome or subgroup title | No. of studies | No. of participants | Statistical method | Effect size |
| 1 Influenza‐like illness Show forest plot | 2 | 1000 | Risk Ratio (M‐H, Random, 95% CI) | 0.66 [0.46, 0.95] |
| 1.1 Inactivated polyvalent aerosol vaccine versus placebo ‐ non‐matching ‐ 1 dose | 2 | 644 | Risk Ratio (M‐H, Random, 95% CI) | 0.64 [0.32, 1.27] |
| 1.2 Inactivated polyvalent aerosol vaccine versus placebo ‐ non‐matching ‐ 2 doses | 1 | 356 | Risk Ratio (M‐H, Random, 95% CI) | 0.65 [0.44, 0.97] |
| Outcome or subgroup title | No. of studies | No. of participants | Statistical method | Effect size |
| 1 Influenza‐like illness Show forest plot | 2 | 1009 | Risk Ratio (M‐H, Random, 95% CI) | 0.54 [0.32, 0.91] |
| 1.1 Inactivated monovalent aerosol vaccine versus placebo ‐ matching ‐ 1 dose | 2 | 650 | Risk Ratio (M‐H, Random, 95% CI) | 0.49 [0.17, 1.41] |
| 1.2 Inactivated monovalent aerosol vaccine versus placebo ‐ matching ‐ 2 doses | 1 | 359 | Risk Ratio (M‐H, Random, 95% CI) | 0.57 [0.38, 0.86] |
| Outcome or subgroup title | No. of studies | No. of participants | Statistical method | Effect size |
| 1 Influenza cases (clinically defined without clear definition) Show forest plot | 1 | 19887 | Risk Ratio (M‐H, Random, 95% CI) | 0.98 [0.92, 1.05] |
| 1.1 Non‐matching | 1 | 19887 | Risk Ratio (M‐H, Random, 95% CI) | 0.98 [0.92, 1.05] |
| 2 Complications (bronchitis, otitis, pneumonia) Show forest plot | 1 | 19887 | Risk Ratio (M‐H, Random, 95% CI) | 0.25 [0.03, 2.24] |
| 2.1 Non‐matching | 1 | 19887 | Risk Ratio (M‐H, Random, 95% CI) | 0.25 [0.03, 2.24] |