Scolaris Content Display Scolaris Content Display

Risk of bias summary: review authors' judgements about each risk of bias item for each included study.
Figuras y tablas -
Figure 1

Risk of bias summary: review authors' judgements about each risk of bias item for each included study.

Risk of bias graph: review authors' judgements about each risk of bias item presented as percentages across all included studies.
Figuras y tablas -
Figure 2

Risk of bias graph: review authors' judgements about each risk of bias item presented as percentages across all included studies.

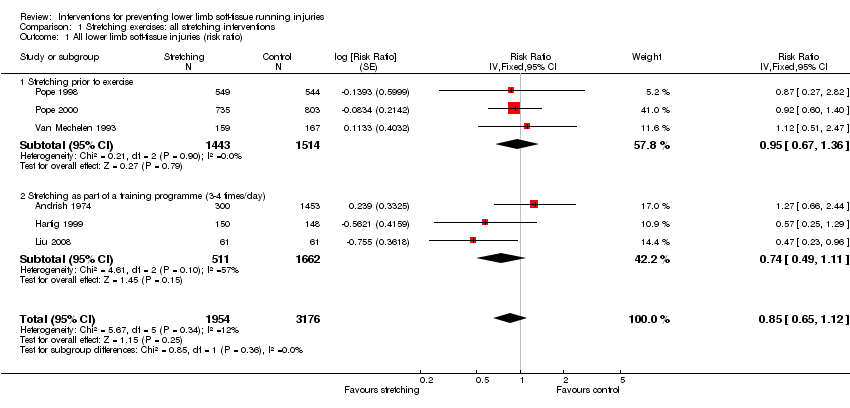
Comparison 1 Stretching exercises: all stretching interventions, Outcome 1 All lower limb soft‐tissue injuries (risk ratio).
Figuras y tablas -
Analysis 1.1

Comparison 1 Stretching exercises: all stretching interventions, Outcome 1 All lower limb soft‐tissue injuries (risk ratio).

Comparison 2 Stretching exercises: major lower limb muscle groups vs control, Outcome 1 All lower limb soft‐tissue injuries (risk ratio).
Figuras y tablas -
Analysis 2.1

Comparison 2 Stretching exercises: major lower limb muscle groups vs control, Outcome 1 All lower limb soft‐tissue injuries (risk ratio).

Comparison 2 Stretching exercises: major lower limb muscle groups vs control, Outcome 2 All lower limb soft‐tissue injuries (rate ratio).
Figuras y tablas -
Analysis 2.2

Comparison 2 Stretching exercises: major lower limb muscle groups vs control, Outcome 2 All lower limb soft‐tissue injuries (rate ratio).

Comparison 3 Stretching exercises: hamstrings vs control, Outcome 1 All lower limb soft‐tissue injuries.
Figuras y tablas -
Analysis 3.1

Comparison 3 Stretching exercises: hamstrings vs control, Outcome 1 All lower limb soft‐tissue injuries.

Comparison 4 Stretching exercises: gastrocnemius and soleus vs control, Outcome 1 All lower limb soft‐tissue injuries.
Figuras y tablas -
Analysis 4.1

Comparison 4 Stretching exercises: gastrocnemius and soleus vs control, Outcome 1 All lower limb soft‐tissue injuries.

Comparison 4 Stretching exercises: gastrocnemius and soleus vs control, Outcome 2 Lower limb soft‐tissue injuries by location.
Figuras y tablas -
Analysis 4.2

Comparison 4 Stretching exercises: gastrocnemius and soleus vs control, Outcome 2 Lower limb soft‐tissue injuries by location.

Comparison 5 Conditioning exercises vs placebo exercises, Outcome 1 All lower limb soft‐tissue injuries.
Figuras y tablas -
Analysis 5.1

Comparison 5 Conditioning exercises vs placebo exercises, Outcome 1 All lower limb soft‐tissue injuries.

Comparison 5 Conditioning exercises vs placebo exercises, Outcome 2 Lower limb soft‐tissue injuries by location.
Figuras y tablas -
Analysis 5.2

Comparison 5 Conditioning exercises vs placebo exercises, Outcome 2 Lower limb soft‐tissue injuries by location.

Comparison 6 Graded running programme vs standard training, Outcome 1 All lower limb soft‐tissue injuries.
Figuras y tablas -
Analysis 6.1

Comparison 6 Graded running programme vs standard training, Outcome 1 All lower limb soft‐tissue injuries.

Comparison 6 Graded running programme vs standard training, Outcome 2 Lower limb soft‐tissue injuries by location.
Figuras y tablas -
Analysis 6.2

Comparison 6 Graded running programme vs standard training, Outcome 2 Lower limb soft‐tissue injuries by location.

Comparison 7 Reduction in training duration (15‐30 minutes/day) vs 45 minutes/day, Outcome 1 All lower limb soft‐tissue injuries.
Figuras y tablas -
Analysis 7.1

Comparison 7 Reduction in training duration (15‐30 minutes/day) vs 45 minutes/day, Outcome 1 All lower limb soft‐tissue injuries.

Comparison 8 Reduction in training frequency (1‐3 days/week) vs 5 days/week, Outcome 1 All lower limb soft‐tissue injuries.
Figuras y tablas -
Analysis 8.1

Comparison 8 Reduction in training frequency (1‐3 days/week) vs 5 days/week, Outcome 1 All lower limb soft‐tissue injuries.

Comparison 9 Reduction in running distance (walking with weights) vs running, Outcome 1 All lower limb soft‐tissue injuries.
Figuras y tablas -
Analysis 9.1

Comparison 9 Reduction in running distance (walking with weights) vs running, Outcome 1 All lower limb soft‐tissue injuries.

Comparison 9 Reduction in running distance (walking with weights) vs running, Outcome 2 Lower limb soft‐tissue injuries by location.
Figuras y tablas -
Analysis 9.2

Comparison 9 Reduction in running distance (walking with weights) vs running, Outcome 2 Lower limb soft‐tissue injuries by location.

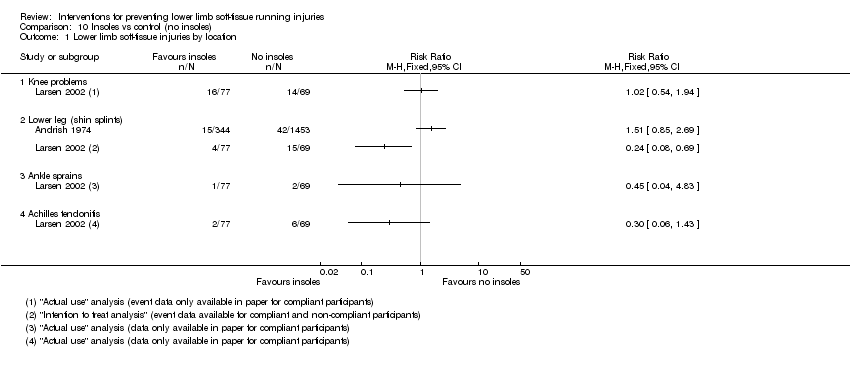
Comparison 10 Insoles vs control (no insoles), Outcome 1 Lower limb soft‐tissue injuries by location.
Figuras y tablas -
Analysis 10.1

Comparison 10 Insoles vs control (no insoles), Outcome 1 Lower limb soft‐tissue injuries by location.

Comparison 10 Insoles vs control (no insoles), Outcome 2 Lower extremity soreness on day 4 in soccer referees.
Figuras y tablas -
Analysis 10.2

Comparison 10 Insoles vs control (no insoles), Outcome 2 Lower extremity soreness on day 4 in soccer referees.

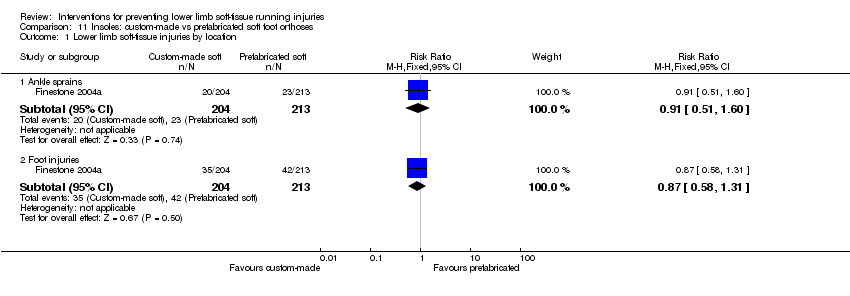
Comparison 11 Insoles: custom‐made vs prefabricated soft foot orthoses, Outcome 1 Lower limb soft‐tissue injuries by location.
Figuras y tablas -
Analysis 11.1

Comparison 11 Insoles: custom‐made vs prefabricated soft foot orthoses, Outcome 1 Lower limb soft‐tissue injuries by location.

Comparison 12 Insoles: custom‐made biomechanical vs prefabricated semi‐rigid foot orthoses, Outcome 1 Lower limb soft‐tissue injuries by location.
Figuras y tablas -
Analysis 12.1

Comparison 12 Insoles: custom‐made biomechanical vs prefabricated semi‐rigid foot orthoses, Outcome 1 Lower limb soft‐tissue injuries by location.

Comparison 13 Insoles: shock‐absorbing polymer vs non shock‐absorbing, Outcome 1 All lower limb soft‐tissue injuries.
Figuras y tablas -
Analysis 13.1

Comparison 13 Insoles: shock‐absorbing polymer vs non shock‐absorbing, Outcome 1 All lower limb soft‐tissue injuries.

Comparison 13 Insoles: shock‐absorbing polymer vs non shock‐absorbing, Outcome 2 Lower limb soft‐tissue injuries by location.
Figuras y tablas -
Analysis 13.2

Comparison 13 Insoles: shock‐absorbing polymer vs non shock‐absorbing, Outcome 2 Lower limb soft‐tissue injuries by location.

Comparison 14 Knee brace vs control (no brace), Outcome 1 Lower limb soft‐tissue injuries by location.
Figuras y tablas -
Analysis 14.1

Comparison 14 Knee brace vs control (no brace), Outcome 1 Lower limb soft‐tissue injuries by location.

Comparison 15 Footwear: tropical combat boot vs leather combat boot, Outcome 1 Lower limb soft‐tissue injuries by location.
Figuras y tablas -
Analysis 15.1

Comparison 15 Footwear: tropical combat boot vs leather combat boot, Outcome 1 Lower limb soft‐tissue injuries by location.

Comparison 16 Footwear: prescription of running shoes based on foot shape vs regular running shoe, Outcome 1 All lower limb soft‐tissue injuries (rate ratio).
Figuras y tablas -
Analysis 16.1

Comparison 16 Footwear: prescription of running shoes based on foot shape vs regular running shoe, Outcome 1 All lower limb soft‐tissue injuries (rate ratio).

Comparison 17 Socks: padded polyester vs regular army sock, Outcome 1 All lower limb soft‐tissue injuries.
Figuras y tablas -
Analysis 17.1

Comparison 17 Socks: padded polyester vs regular army sock, Outcome 1 All lower limb soft‐tissue injuries.

Comparison 17 Socks: padded polyester vs regular army sock, Outcome 2 Lower limb soft‐tissue injuries by location.
Figuras y tablas -
Analysis 17.2

Comparison 17 Socks: padded polyester vs regular army sock, Outcome 2 Lower limb soft‐tissue injuries by location.

Comparison 18 Socks: double layer vs regular army sock, Outcome 1 All lower limb soft‐tissue injuries.
Figuras y tablas -
Analysis 18.1

Comparison 18 Socks: double layer vs regular army sock, Outcome 1 All lower limb soft‐tissue injuries.

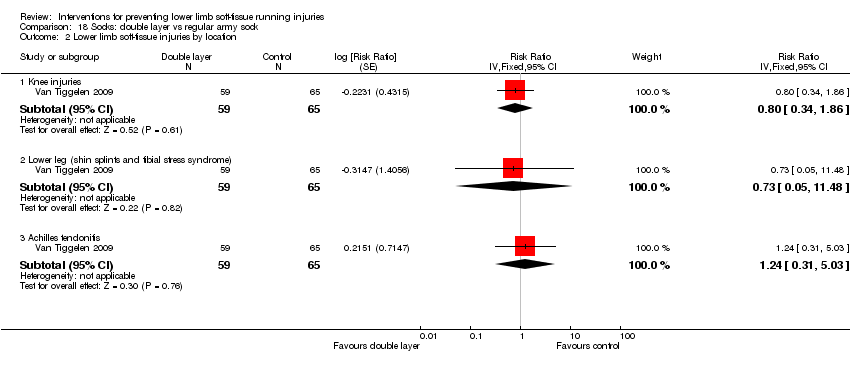
Comparison 18 Socks: double layer vs regular army sock, Outcome 2 Lower limb soft‐tissue injuries by location.
Figuras y tablas -
Analysis 18.2

Comparison 18 Socks: double layer vs regular army sock, Outcome 2 Lower limb soft‐tissue injuries by location.

Comparison 1. Stretching exercises: all stretching interventions

Outcome or subgroup title

No. of studies

No. of participants

Statistical method

Effect size

1 All lower limb soft‐tissue injuries (risk ratio) Show forest plot

6

5130

Risk Ratio (Fixed, 95% CI)

0.85 [0.65, 1.12]

1.1 Stretching prior to exercise

3

2957

Risk Ratio (Fixed, 95% CI)

0.95 [0.67, 1.36]

1.2 Stretching as part of a training programme (3‐4 times/day)

3

2173

Risk Ratio (Fixed, 95% CI)

0.74 [0.49, 1.11]

Figuras y tablas -
Comparison 1. Stretching exercises: all stretching interventions
Comparison 2. Stretching exercises: major lower limb muscle groups vs control

Outcome or subgroup title

No. of studies

No. of participants

Statistical method

Effect size

1 All lower limb soft‐tissue injuries (risk ratio) Show forest plot

1

1538

Risk Ratio (Fixed, 95% CI)

0.92 [0.60, 1.40]

2 All lower limb soft‐tissue injuries (rate ratio) Show forest plot

1

326

Rate Ratio (Fixed, 95% CI)

0.11 [‐0.68, 0.90]

Figuras y tablas -
Comparison 2. Stretching exercises: major lower limb muscle groups vs control
Comparison 3. Stretching exercises: hamstrings vs control

Outcome or subgroup title

No. of studies

No. of participants

Statistical method

Effect size

1 All lower limb soft‐tissue injuries Show forest plot

1

298

Risk Ratio (Fixed, 95% CI)

0.57 [0.25, 1.29]

Figuras y tablas -
Comparison 3. Stretching exercises: hamstrings vs control
Comparison 4. Stretching exercises: gastrocnemius and soleus vs control

Outcome or subgroup title

No. of studies

No. of participants

Statistical method

Effect size

1 All lower limb soft‐tissue injuries Show forest plot

2

Risk Ratio (Fixed, 95% CI)

Subtotals only

1.1 Soft‐tissue injuries + stress fractures

1

122

Risk Ratio (Fixed, 95% CI)

0.47 [0.23, 0.96]

1.2 Soft‐tissue injuries alone

1

1093

Risk Ratio (Fixed, 95% CI)

0.87 [0.27, 2.82]

2 Lower limb soft‐tissue injuries by location Show forest plot

1

Risk Ratio (M‐H, Fixed, 95% CI)

Subtotals only

2.1 Lower leg (shin splints)

1

1753

Risk Ratio (M‐H, Fixed, 95% CI)

1.27 [0.66, 2.43]

Figuras y tablas -
Comparison 4. Stretching exercises: gastrocnemius and soleus vs control
Comparison 5. Conditioning exercises vs placebo exercises

Outcome or subgroup title

No. of studies

No. of participants

Statistical method

Effect size

1 All lower limb soft‐tissue injuries Show forest plot

1

1020

Risk Ratio (Fixed, 95% CI)

1.20 [0.77, 1.87]

2 Lower limb soft‐tissue injuries by location Show forest plot

1

Risk Ratio (Fixed, 95% CI)

Subtotals only

2.1 Knee injuries

1

1020

Risk Ratio (Fixed, 95% CI)

1.17 [0.56, 2.45]

2.2 Medial tibial stress syndrome

1

1020

Risk Ratio (Fixed, 95% CI)

0.93 [0.35, 2.45]

2.3 Achilles tendonitis

1

1020

Risk Ratio (Fixed, 95% CI)

3.04 [0.31, 29.93]

2.4 Ankle sprain

1

1020

Risk Ratio (Fixed, 95% CI)

1.21 [0.37, 3.95]

Figuras y tablas -
Comparison 5. Conditioning exercises vs placebo exercises
Comparison 6. Graded running programme vs standard training

Outcome or subgroup title

No. of studies

No. of participants

Statistical method

Effect size

1 All lower limb soft‐tissue injuries Show forest plot

1

486

Risk Ratio (M‐H, Fixed, 95% CI)

1.02 [0.72, 1.45]

2 Lower limb soft‐tissue injuries by location Show forest plot

1

Risk Ratio (M‐H, Fixed, 95% CI)

Subtotals only

2.1 Lower leg (shin splints)

1

1670

Risk Ratio (M‐H, Fixed, 95% CI)

2.02 [1.11, 3.70]

Figuras y tablas -
Comparison 6. Graded running programme vs standard training
Comparison 7. Reduction in training duration (15‐30 minutes/day) vs 45 minutes/day

Outcome or subgroup title

No. of studies

No. of participants

Statistical method

Effect size

1 All lower limb soft‐tissue injuries Show forest plot

1

69

Risk Ratio (M‐H, Fixed, 95% CI)

0.41 [0.21, 0.79]

Figuras y tablas -
Comparison 7. Reduction in training duration (15‐30 minutes/day) vs 45 minutes/day
Comparison 8. Reduction in training frequency (1‐3 days/week) vs 5 days/week

Outcome or subgroup title

No. of studies

No. of participants

Statistical method

Effect size

1 All lower limb soft‐tissue injuries Show forest plot

1

58

Risk Ratio (M‐H, Fixed, 95% CI)

0.19 [0.06, 0.66]

Figuras y tablas -
Comparison 8. Reduction in training frequency (1‐3 days/week) vs 5 days/week
Comparison 9. Reduction in running distance (walking with weights) vs running

Outcome or subgroup title

No. of studies

No. of participants

Statistical method

Effect size

1 All lower limb soft‐tissue injuries Show forest plot

1

350

Risk Ratio (Fixed, 95% CI)

0.80 [0.51, 1.25]

2 Lower limb soft‐tissue injuries by location Show forest plot

1

Risk Ratio (Fixed, 95% CI)

Subtotals only

2.1 Hamstring, thigh, hip, groin injuries

1

350

Risk Ratio (Fixed, 95% CI)

0.87 [0.19, 4.01]

2.2 Knee injuries

1

350

Risk Ratio (Fixed, 95% CI)

0.47 [0.17, 1.33]

2.3 Lower leg injuries

1

350

Risk Ratio (Fixed, 95% CI)

1.06 [0.19, 5.83]

2.4 Ankle and foot injuries

1

350

Risk Ratio (Fixed, 95% CI)

0.78 [0.30, 2.03]

Figuras y tablas -
Comparison 9. Reduction in running distance (walking with weights) vs running
Comparison 10. Insoles vs control (no insoles)

Outcome or subgroup title

No. of studies

No. of participants

Statistical method

Effect size

1 Lower limb soft‐tissue injuries by location Show forest plot

2

Risk Ratio (M‐H, Fixed, 95% CI)

Totals not selected

1.1 Knee problems

1

Risk Ratio (M‐H, Fixed, 95% CI)

0.0 [0.0, 0.0]

1.2 Lower leg (shin splints)

2

Risk Ratio (M‐H, Fixed, 95% CI)

0.0 [0.0, 0.0]

1.3 Ankle sprains

1

Risk Ratio (M‐H, Fixed, 95% CI)

0.0 [0.0, 0.0]

1.4 Achilles tendonitis

1

Risk Ratio (M‐H, Fixed, 95% CI)

0.0 [0.0, 0.0]

2 Lower extremity soreness on day 4 in soccer referees Show forest plot

1

91

Risk Ratio (M‐H, Fixed, 95% CI)

0.67 [0.53, 0.85]

Figuras y tablas -
Comparison 10. Insoles vs control (no insoles)
Comparison 11. Insoles: custom‐made vs prefabricated soft foot orthoses

Outcome or subgroup title

No. of studies

No. of participants

Statistical method

Effect size

1 Lower limb soft‐tissue injuries by location Show forest plot

1

Risk Ratio (M‐H, Fixed, 95% CI)

Subtotals only

1.1 Ankle sprains

1

417

Risk Ratio (M‐H, Fixed, 95% CI)

0.91 [0.51, 1.60]

1.2 Foot injuries

1

417

Risk Ratio (M‐H, Fixed, 95% CI)

0.87 [0.58, 1.31]

Figuras y tablas -
Comparison 11. Insoles: custom‐made vs prefabricated soft foot orthoses
Comparison 12. Insoles: custom‐made biomechanical vs prefabricated semi‐rigid foot orthoses

Outcome or subgroup title

No. of studies

No. of participants

Statistical method

Effect size

1 Lower limb soft‐tissue injuries by location Show forest plot

1

Risk Ratio (M‐H, Fixed, 95% CI)

Subtotals only

1.1 Ankle sprains

1

352

Risk Ratio (M‐H, Fixed, 95% CI)

1.16 [0.59, 2.28]

1.2 Foot injuries

1

352

Risk Ratio (M‐H, Fixed, 95% CI)

0.68 [0.43, 1.09]

Figuras y tablas -
Comparison 12. Insoles: custom‐made biomechanical vs prefabricated semi‐rigid foot orthoses
Comparison 13. Insoles: shock‐absorbing polymer vs non shock‐absorbing

Outcome or subgroup title

No. of studies

No. of participants

Statistical method

Effect size

1 All lower limb soft‐tissue injuries Show forest plot

2

4032

Risk Ratio (Fixed, 95% CI)

1.02 [0.81, 1.29]

2 Lower limb soft‐tissue injuries by location Show forest plot

2

Risk Ratio (M‐H, Fixed, 95% CI)

Subtotals only

2.1 Thigh injuries

1

1205

Risk Ratio (M‐H, Fixed, 95% CI)

1.30 [0.47, 3.61]

2.2 Knee injuries

2

1760

Risk Ratio (M‐H, Fixed, 95% CI)

1.23 [0.85, 1.80]

2.3 Lower leg injuries

2

1760

Risk Ratio (M‐H, Fixed, 95% CI)

0.90 [0.55, 1.47]

2.4 Ankle injuries

2

1760

Risk Ratio (M‐H, Fixed, 95% CI)

0.91 [0.64, 1.28]

2.5 Achilles tendonitis

2

1760

Risk Ratio (M‐H, Fixed, 95% CI)

1.56 [0.81, 3.01]

2.6 Foot injuries

1

555

Risk Ratio (M‐H, Fixed, 95% CI)

1.09 [0.56, 2.15]

Figuras y tablas -
Comparison 13. Insoles: shock‐absorbing polymer vs non shock‐absorbing
Comparison 14. Knee brace vs control (no brace)

Outcome or subgroup title

No. of studies

No. of participants

Statistical method

Effect size

1 Lower limb soft‐tissue injuries by location Show forest plot

2

Risk Ratio (M‐H, Fixed, 95% CI)

Subtotals only

1.1 Anterior knee pain

2

227

Risk Ratio (M‐H, Fixed, 95% CI)

0.41 [0.24, 0.67]

Figuras y tablas -
Comparison 14. Knee brace vs control (no brace)
Comparison 15. Footwear: tropical combat boot vs leather combat boot

Outcome or subgroup title

No. of studies

No. of participants

Statistical method

Effect size

1 Lower limb soft‐tissue injuries by location Show forest plot

2

Risk Ratio (M‐H, Fixed, 95% CI)

Subtotals only

1.1 Anterior knee pain

1

2841

Risk Ratio (M‐H, Fixed, 95% CI)

0.70 [0.39, 1.24]

1.2 Lower leg (shin splints)

1

2841

Risk Ratio (M‐H, Fixed, 95% CI)

1.14 [0.53, 2.44]

1.3 Achilles tendonitis

2

3627

Risk Ratio (M‐H, Fixed, 95% CI)

1.19 [0.73, 1.95]

1.4 Ankle sprain

2

3627

Risk Ratio (M‐H, Fixed, 95% CI)

0.93 [0.60, 1.44]

1.5 Plantar fascial strain

2

3627

Risk Ratio (M‐H, Fixed, 95% CI)

0.84 [0.33, 2.13]

Figuras y tablas -
Comparison 15. Footwear: tropical combat boot vs leather combat boot
Comparison 16. Footwear: prescription of running shoes based on foot shape vs regular running shoe

Outcome or subgroup title

No. of studies

No. of participants

Statistical method

Effect size

1 All lower limb soft‐tissue injuries (rate ratio) Show forest plot

2

5795

Rate Ratio (Fixed, 95% CI)

1.03 [0.93, 1.14]

1.1 Men

2

4123

Rate Ratio (Fixed, 95% CI)

1.00 [0.88, 1.15]

1.2 Women

2

1672

Rate Ratio (Fixed, 95% CI)

1.06 [0.92, 1.23]

Figuras y tablas -
Comparison 16. Footwear: prescription of running shoes based on foot shape vs regular running shoe
Comparison 17. Socks: padded polyester vs regular army sock

Outcome or subgroup title

No. of studies

No. of participants

Statistical method

Effect size

1 All lower limb soft‐tissue injuries Show forest plot

1

130

Risk Ratio (Fixed, 95% CI)

0.54 [0.27, 1.08]

2 Lower limb soft‐tissue injuries by location Show forest plot

1

Risk Ratio (Fixed, 95% CI)

Subtotals only

2.1 Knee injuries

1

130

Risk Ratio (Fixed, 95% CI)

0.27 [0.07, 1.00]

2.2 Lower leg (shin splints and tibial stress reactions)

1

130

Risk Ratio (Fixed, 95% CI)

1.0 [0.08, 11.81]

2.3 Achilles tendonitis

1

130

Risk Ratio (Fixed, 95% CI)

1.0 [0.23, 4.26]

Figuras y tablas -
Comparison 17. Socks: padded polyester vs regular army sock
Comparison 18. Socks: double layer vs regular army sock

Outcome or subgroup title

No. of studies

No. of participants

Statistical method

Effect size

1 All lower limb soft‐tissue injuries Show forest plot

1

124

Risk Ratio (Fixed, 95% CI)

0.91 [0.53, 1.56]

2 Lower limb soft‐tissue injuries by location Show forest plot

1

Risk Ratio (Fixed, 95% CI)

Subtotals only

2.1 Knee injuries

1

124

Risk Ratio (Fixed, 95% CI)

0.80 [0.34, 1.86]

2.2 Lower leg (shin splints and tibial stress syndrome)

1

124

Risk Ratio (Fixed, 95% CI)

0.73 [0.05, 11.48]

2.3 Achilles tendonitis

1

124

Risk Ratio (Fixed, 95% CI)

1.24 [0.31, 5.03]

Figuras y tablas -
Comparison 18. Socks: double layer vs regular army sock