Медленное увеличение объемов энтерального питания для предотвращения развития некротизирующего энтероколита у детей с очень низкой массой тела при рождении
Abstract
Background
Early enteral feeding practices are potentially modifiable risk factors for necrotising enterocolitis in very preterm or very low birth weight (VLBW) infants. Observational studies suggest that conservative feeding regimens, including slowly advancing enteral feed volumes, reduce the risk of necrotising enterocolitis. However, slow feed advancement may delay establishment of full enteral feeding and be associated with metabolic and infectious morbidities secondary to prolonged exposure to parenteral nutrition.
Objectives
To determine the effect of slow rates of enteral feed advancement on the incidence of necrotising enterocolitis, mortality, and other morbidities in very preterm or VLBW infants.
Search methods
We used the standard search strategy of the Cochrane Neonatal Review Group Specialised Register. We searched the Cochrane Central Register of Controlled Trials (CENTRAL 2014, Issue 8), MEDLINE, EMBASE, and CINAHL (to September 2014), conference proceedings, and previous reviews.
Selection criteria
Randomised or quasi‐randomised controlled trials that assessed the effect of slow (up to 24 ml/kg per day) versus faster rates of advancement of enteral feed volumes upon the incidence of necrotising enterocolitis in very preterm or VLBW infants.
Data collection and analysis
Two review authors independently assessed trial eligibility and risk of bias and undertook data extraction. We analysed the treatment effects in the individual trials and reported the risk ratio and risk difference for dichotomous data and mean difference for continuous data, with respective 95% confidence intervals. We used a fixed‐effect model in meta‐analyses and explored the potential causes of heterogeneity in sensitivity analyses.
Main results
We identified six randomised controlled trials in which a total of 618 infants participated. Most participants were stable preterm infants of birth weight between 1000 g and 1500 g. Few participants were extremely preterm, extremely low birth weight, or growth‐restricted. The trials typically defined slow advancement as daily increments of 15 ml/kg to 20 ml/kg and faster advancement as 30 ml/kg to 35 ml/kg. Meta‐analyses did not detect statistically significant effects on the risk of necrotising enterocolitis (typical risk ratio (RR) 0.96, 95% confidence interval (CI) 0.55 to 1.70) or all‐cause mortality (typical RR 1.57, 95% CI 0.92 to 2.70). Infants who had slow advancement took significantly longer to regain birth weight (reported median differences 2 to 6 days) and to establish full enteral feeding (1 to 5 days).
Authors' conclusions
The available trial data suggest that advancing enteral feed volumes at daily increments of 30 ml/kg to 35 ml/kg does not increase the risk of necrotising enterocolitis in very preterm or VLBW infants. Advancing the volume of enteral feeds at slow rates resulted in several days delay in regaining birth weight and establishing full enteral feeds. The applicability of these findings to extremely preterm, extremely low birth weight, or growth‐restricted infants is limited. Further randomised controlled trials in these populations may be warranted to resolve this uncertainty.
PICO
Резюме на простом языке
Медленное увеличение объема кормлений (молочного питания) не снижает риск развития некротизирующего энтероколита у детей с очень низкой массой тела при рождении
Глубоко недоношенные (рожденные до 32 недель беременности) или дети с очень низкой массой тела при рождении (менее 1500 г) подвержены риску развития тяжелого расстройства кишечника, известного как некротизирующий (некротический) энтероколит. Одним из возможных способов предотвращения этого состояния считают ограничение числа кормлений (молочного питания), которое дети получают каждый день, в течение первых нескольких недель после рождения. Шесть рандомизированных контролируемых испытаний оценили эффект медленного (а не более быстрого) увеличения объема кормлений (молочного питания) у глубоко недоношенных или детей с очень низкой массой тела при рождении. Объединенный анализ этих испытаний не выявил какого‐либо эффекта этого вмешательства на риск развития некротизирующего энтероколита. Дети, которым увеличивали объем питания более медленно, восстанавливали вес при рождении и переходили на полное энтеральное питание на несколько дней позже, чем дети, которым увеличивали объем питания быстрее.
Authors' conclusions
Background
Description of the condition
Necrotising enterocolitis (NEC), a syndrome of acute intestinal necrosis of unknown aetiology, affects about 5% of very preterm (less than 32 weeks) or very low birth weight (VLBW) (less than 1500 g) infants (Holman 1997). Infants who develop NEC experience more nosocomial infections, have lower levels of nutrient intake, grow more slowly, and have longer durations of intensive care and hospital stay than gestation‐comparable infants who do not develop NEC (Bisquera 2002; Guthrie 2003). The associated mortality rate is more than 20%. Compared with their peers, infants who develop NEC have a higher incidence of long‐term neurological disability, which may be a consequence of infection and under‐nutrition during a critical period of brain development (Stoll 2004; Soraisham 2006; Rees 2007; Pike 2012).
Description of the intervention
Short gestational age at birth is the major clinical risk factor for developing NEC (Beeby 1992; Luig 2005). The other putative major risk factor is intrauterine growth restriction, especially if associated with absent or reversed end‐diastolic flow velocities in Doppler studies of the fetal aorta or umbilical artery (Bernstein 2000; Garite 2004; Dorling 2005). Most very preterm or VLBW infants who develop NEC have received enteral milk feeds. Evidence exists that feeding with artificial formula rather than human milk increases the risk of developing NEC (Quigley 2014). Other differences in enteral feeding regimens, such as the timing of introduction of feeds and the size of the daily volume increments, may also contribute to inter‐unit variation in the incidence of NEC. Multicentre benchmarking studies have found that those neonatal centres where enteral feeding is introduced earlier and feeding volumes advanced more quickly tend to have higher incidences of NEC (Uauy 1991). Observational studies have suggested that delaying the introduction of enteral feeds beyond the first few days after birth, or increasing the volume of feeds by less than about 20 ml/kg to 24 ml/kg body weight each day, is associated with a lower risk of developing NEC in very preterm or VLBW infants (Brown 1978; McKeown 1992; Patole 2005; Henderson 2009).
Why it is important to do this review
Potential disadvantages associated with slowing the advancement of enteral feed volumes include delaying the establishment of full enteral nutrition and extending the duration of receipt of parenteral nutrition (Flidel‐Rimon 2004). Prolonged use of parenteral nutrition is associated with infectious and metabolic risks that may have adverse consequences for survival, growth, and development (Stoll 2004). It has been argued that the risk of NEC should not be considered in isolation of these other potential clinical outcomes when determining feeding policies and practice for very preterm or VLBW infants (Flidel‐Rimon 2006; Chauhan 2008; Härtel 2009).
Other Cochrane reviews have addressed the questions of whether delaying the introduction of any enteral milk feeding or restricting feed volumes to trophic levels (minimal enteral nutrition) affect the risk of NEC in very preterm or VLBW infants (Bombell 2009; Morgan 2011). This review focussed on the question of whether advancing feed volumes at slow rates compared to faster rates affects the risk of NEC, mortality, and other morbidities.
Objectives
To determine the effect of slow rates of enteral feed advancement on the incidence of NEC, mortality, and other morbidities in very preterm or VLBW infants.
Methods
Criteria for considering studies for this review
Types of studies
Controlled trials utilising either random or quasi‐random participant allocation.
Types of participants
Enterally fed very preterm (less than 32 weeks) or VLBW (less than 1500 g) newborn infants.
Types of interventions
Advancement of enteral feeds at no more than 24 ml/kg (birth weight or current body weight) per day versus faster rates of feeds advancement. Infants should have received the same type of milk and in both groups the advancement of feed volume should have commenced within five days of introduction of enteral feeds.
Types of outcome measures
Primary outcomes
1. NEC confirmed by at least two of the following features:
-
abdominal radiograph showing pneumatosis intestinalis or gas in the portal venous system or free air in the abdomen;
-
abdominal distension with abdominal radiograph with gaseous distension or frothy appearance of bowel lumen (or both);
-
blood in stool;
-
lethargy, hypotonia, or apnoea (or a combination of these);
or a diagnosis confirmed at surgery or autopsy (Walsh 1986).
2. All‐cause mortality during the neonatal period and prior to hospital discharge.
Secondary outcomes
-
Growth
-
Time to regain birth weight and subsequent rates of weight gain, linear growth, head growth, or skinfold thickness growth up to six months (corrected for preterm birth).
-
Long‐term growth: weight, height, or head circumference (or proportion of infants who remained below the 10th percentile for the index population's distribution) assessed at intervals from six months of age.
-
-
Neurodevelopment
-
Death or severe neurodevelopmental disability defined as any one or a combination of the following: nonambulant cerebral palsy, developmental delay (developmental quotient less than 70), auditory and visual impairment. Each component was to be analysed individually as well as part of the composite outcome.
-
Neurodevelopmental scores in survivors aged greater than or equal to 12 months measured using validated assessment tools.
-
Cognitive and educational outcomes in survivors aged more than five years.
-
-
Time to establish full enteral feeding (independently of parenteral nutrition).
-
Time to establish oral feeding (independently of parenteral nutrition or enteral tube feeding, or both).
-
Feed intolerance (defined as a requirement to cease enteral feeds).
-
Incidence of invasive infection as determined by culture of bacteria or fungus from blood, cerebrospinal fluid, urine, or from a normally sterile body space.
-
Duration of hospital stay (days).
Search methods for identification of studies
We used the standard search strategy of the Cochrane Neonatal Review Group (http://neonatal.cochrane.org/).
Electronic searches
We searched the Cochrane Central Register of Controlled Trials (CENTRAL 2014, Issue 8), MEDLINE (1966 to September 2014), EMBASE (1980 to September 2014), and CINAHL (1982 to September 2014) using a combination of the following text words and MeSH terms: [Infant, Newborn OR Infant, Premature OR Infant, Low Birth Weight OR Infant, Very Low Birth Weight/OR infan* OR neonat* OR preterm OR prem*] AND "Infant‐Nutrition"/all subheadings OR Infant Formula OR milk OR formula OR trophic feeding OR minimal enteral nutrition OR gut priming]. We limited the search outputs with the relevant search filters for clinical trials. We did not apply any language restrictions.
We searched ClinicalTrials.gov for completed or ongoing trials.
Searching other resources
We examined the reference lists of all studies identified as potentially relevant.
We searched the abstracts from the annual meetings of the Pediatric Academic Societies (1993 to 2014), the European Society for Pediatric Research (1995 to 2013), the UK Royal College of Paediatrics and Child Health (2000 to 2014), and the Perinatal Society of Australia and New Zealand (2000 to 2014). Trials reported only as abstracts were eligible if sufficient information was available from the report or from contact with the authors to fulfill the inclusion criteria.
Data collection and analysis
We used the standard methods of the Cochrane Neonatal Review Group (http://neonatal.cochrane.org/).
Selection of studies
Two review authors screened the titles and abstracts of all studies identified by the above search strategy. We assessed the full texts of any potentially eligible reports, and those studies that did not meet all of the inclusion criteria were excluded. We discussed any disagreements until consensus was achieved.
Data extraction and management
We used a data collection form to aid extraction of relevant information from each included study. Two review authors extracted the data separately. Any disagreements were discussed until consensus was achieved. We contacted the investigators for further information if data from the trial reports were insufficient.
Assessment of risk of bias in included studies
We used the criteria and standard methods of The Cochrane Collaboration and the Cochrane Neonatal Group to assess the methodological quality of any included trials (Higgins 2011). We requested additional information from the trial authors to clarify methodology and results as necessary. We evaluated and reported the following issues in the 'Risk of bias' tables:
Sequence generation (the method used to generate the allocation sequence):
-
low risk: any truly random process, e.g. random number table, computer random number generator;
-
high risk: any nonrandom process, e.g. odd or even date of birth, hospital or clinic record number;
-
unclear risk: no or unclear information provided.
Allocation concealment (the method used to conceal the allocation sequence):
-
low risk: e.g. telephone or central randomisation; consecutively numbered, sealed, opaque envelopes;
-
high risk: open random allocation, e.g. unsealed or nonopaque envelopes, alternation, date of birth;
-
unclear: no or unclear information provided.
Blinding (the methods used to ensure blinding of participants, clinicians and caregivers, and outcome assessors):
-
low risk;
-
high risk;
-
unclear.
Incomplete outcome data (completeness of data including attrition and exclusions from the analysis for each outcome and any reasons for attrition or exclusion where reported): We will assess whether missing data are balanced across groups or are related to outcomes. Where sufficient information is reported or supplied by the trial authors, we will reinstate missing data in the analyses. We will categorise completeness as:
-
low risk: adequate (< 10% missing data);
-
high risk: inadequate (> 10% missing data);
-
unclear risk: no or unclear information provided.
Measures of treatment effect
We calculated risk ratio (RR) and risk difference (RD) for dichotomous data and mean difference (MD) for continuous data, with respective 95% confidence intervals (CI). When it was deemed appropriate to combine two or more study arms, we obtained the treatment effects from the combined data using the methods described in the Cochrane Handbook for Systematic Reviews of Interventions (Higgins 2011). We determined the number needed to treat to benefit (NNTB) or harm (NNTH) for a statistically significant difference in the RD.
Unit of analysis issues
The unit of analysis was the participating infant in individually randomised trials and the neonatal unit (or subunit) for cluster randomised trials.
Assessment of heterogeneity
If more than one trial was included in a meta‐analysis, we examined the treatment effects of individual trials and the heterogeneity between trial results by inspecting the forest plots. We calculated the I² statistic for each analysis to quantify inconsistency across studies and to describe the percentage of variability in effect estimates that may be due to heterogeneity rather than sampling error. If we detected substantial (I² greater than 50%) heterogeneity, we explored the possible causes (for example, differences in study design, participants, interventions, or completeness of outcome assessments) in sensitivity analyses.
Data synthesis
We used the fixed‐effect model in RevMan 5 (RevMan 2011) for meta‐analysis.
Subgroup analysis and investigation of heterogeneity
We planned the following subgroup analyses:
-
trials in which most infants were exclusively formula fed;
-
trials in which most infants were at least partially fed with human milk (maternal or donor);
-
trials in which most participants were of extremely low birth weight (ELBW) (< 1000 g) or extremely preterm gestational age (< 28 weeks);
-
trials in which participants were infants with intrauterine growth restriction or infants with absent or reversed end‐diastolic flow velocities detected on antenatal Doppler studies of the fetal aorta or umbilical artery.
Results
Description of studies
Six randomised controlled trials fulfilled the review eligibility criteria: Rayyis 1999; Caple 2004; Salhotra 2004; Krishnamurthy 2010; Karagol 2012; Mukhopadhyay 2014 (see Characteristics of included studies).
Included studies
Population
A total of 618 infants participated in the six included trials. The trials were undertaken in neonatal care centres in North America (Rayyis 1999; Caple 2004), India (Salhotra 2004; Krishnamurthy 2010; Mukhopadhyay 2014), and Turkey (Karagol 2012) within the past 10 to 15 years.
All of the trials specified participant birth weight eligibility criteria:
-
Rayyis 1999 < 1500 g
-
Caple 2004 1000 g to 2000 g
-
Salhotra 2004 < 1250 g
-
Krishnamurthy 2010 1000 g to 1500 g
-
Karagol 2012 750 g to 1250 g
-
Mukhopadhyay 2014 1000 g to 1250 g
Since most participants in Caple 2004 were of birth weight less than 1500 g or gestational age less than 32 weeks, we made a consensus decision to include the trial. Infants born 'small for gestational age' (birth weight less than 10th percentile of the index population's distribution) were not eligible to participate in Caple 2004 but were included in the other trials. More than 95% of the participants in Salhotra 2004 were 'small for gestational age'. One‐third of participants in Karagol 2012 were ELBW infants. All participants in Mukhopadhyay 2014 had antenatal evidence of absent or reversed end‐diastolic flow.
Interventions and comparisons
All trials commenced interval bolus intragastric feeding within one to five days after birth. Infants were randomly allocated to one of two rates of daily increments in enteral feed volume:
-
Rayyis 1999 15 versus 35 ml/kg/day
-
Caple 2004 20 versus 35 ml/kg/day
-
Salhotra 2004 15 versus 30 ml/kg/day
-
Krishnamurthy 2010 20 versus 30 ml/kg/day
-
Karagol 2012 20 versus 30 ml/kg/day
-
Mukhopadhyay 2014 20 versus 30 ml/kg/day
In one trial, only formula‐fed infants were eligible to participate (Rayyis 1999). In Caple 2004, Krishnamurthy 2010, Karagol 2012, and Mukhopadhyay 2014, infants received either expressed breast milk or formula, or a combination of the two. In Salhotra 2004, all participating infants were fed exclusively expressed breast milk. All of the trial protocols specified indications for interrupting or ceasing enteral feeding, such as residual gastric contents of more than about one‐third of the previous feed volume, frequent vomiting, abdominal distention, or detection of blood in the stools (including occult blood).
Outcomes
All of the trials reported the incidence of NEC confirmed radiologically or at surgery or autopsy. The other reported outcomes included time to regain birth weight, time to establish full enteral feeding, duration of hospital stay, and rates of invasive infection.
Excluded studies
Two trials were excluded (Book 1976; Berseth 2003) (see Characteristics of excluded studies). In Book 1976, enteral feeding volumes were advanced at 10 ml/kg/day versus 20 ml/kg/day, that is both groups received 'slow' advancement of feed volumes. In Berseth 2003, infants were randomly allocated to either a stable (not progressively increased) trophic feeding volume or to feed volume advancement at 20 ml/kg/day.
Risk of bias in included studies
The methodological quality of the included trials was generally good. All six trials employed methods to ensure adequate allocation concealment and reported complete or near‐complete assessments of the primary outcomes. None of the trials were able to conceal the feeding strategies from parents, caregivers, or clinical investigators. Three studies clearly masked the assessment of abdominal radiographs (for diagnosis of NEC). In Salhotra 2004 and Karagol 2012, it was unclear whether precautions had been taken to ensure that radiological assessors were blinded to the allocation group.
Effects of interventions
Primary outcomes
Incidence of necrotising enterocolitis (Outcome 1.1)
Meta‐analysis did not detect a statistically significant effect: typical RR 0.96 (95% CI 0.55 to 1.63); typical RD ‐0.00 (95% CI ‐0.04 to 0.04) (6 trials, 618 infants) (Figure 1). There was not any statistical evidence of heterogeneity (I² = 0%).
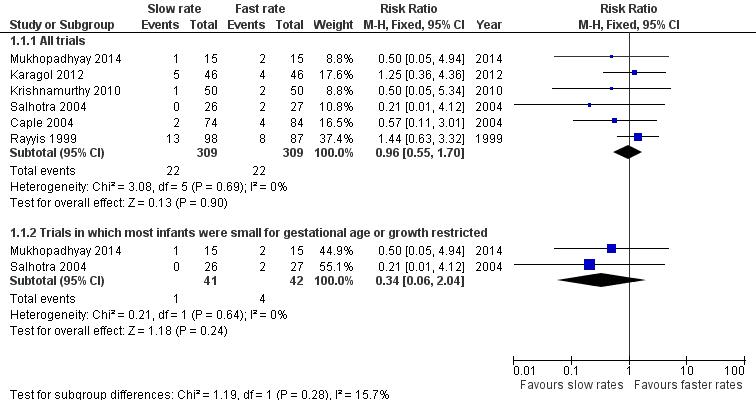
Forest plot of comparison: 1 Slow versus faster rates of feed advancement, outcome: 1.1 Incidence of necrotising enterocolitis.
Mortality (Outcome 1.2)
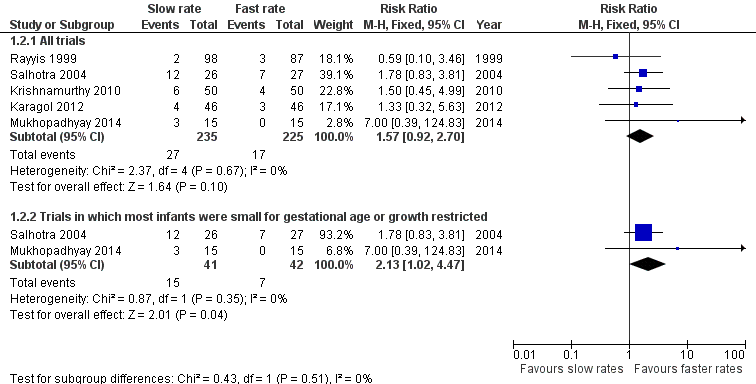
Meta‐analysis did not find a statistically significant difference: typical RR 1.57 (95% CI 0.92 to 2.70); typical RD 0.04 (95% CI ‐0.01 to 0.09) (5 trials, 460 infants) (Figure 2). There was not any statistical evidence of heterogeneity (I² = 0%).

Forest plot of comparison: 1 Slow versus faster rates of feed advancement, outcome: 1.2 Mortality.
Secondary outcomes
Growth
Five trials reported that infants in the slow‐rate‐of‐advancement group took a statistically significantly longer time to regain birth weight:
-
Rayyis 1999 median difference 3 days
-
Caple 2004 mean difference 2 (95% CI 1 to 3) days
-
Salhotra 2004 median difference 5 days
-
Krishnamurthy 2010 median difference 6 days
-
Karagol 2012 mean difference 3.8 (95% CI not given) days
Mukhopadhyay 2014 did not report this outcome.
None of the trials reported longer‐term growth parameters.
Neurodevelopment
None of the trials assessed neurodevelopmental outcomes.
Time to establish full enteral feeding
All of the trials reported that it took statistically significantly longer to establish full enteral feeds in infants in the slow‐rate‐of‐advancement group:
-
Rayyis 1999 median difference 4 days
-
Caple 2004 mean difference 3 (95% CI 2 to 3) days
-
Salhotra 2004 mean difference 4.8 (95% CI not given) days
-
Krishnamurthy 2010 median difference 2 days
-
Karagol 2012 mean difference 3.2 (95% CI not given) days
-
Mukhopadhyay 2014 mean difference 0.6 (95% CI not given) days
Time to establish full oral feeding
Not reported by any of the included trials.
Feeds intolerance (causing interruption of enteral feeding) (Outcome 1.3)
Meta‐analysis of data from four trials (275 infants) did not find a statistically significant difference: typical RR 1.23 (95% CI 0.87 to 1.73); typical RD 0.06 (95% CI ‐0.04 to 0.17) (Figure 3).

Forest plot of comparison: 1 Slow versus faster rates of feed advancement, outcome: 1.3 Feeds intolerance (causing interruption of enteral feeding).
Incidence of invasive infection (Outcome 1.4)
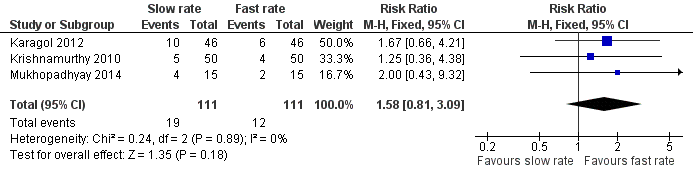
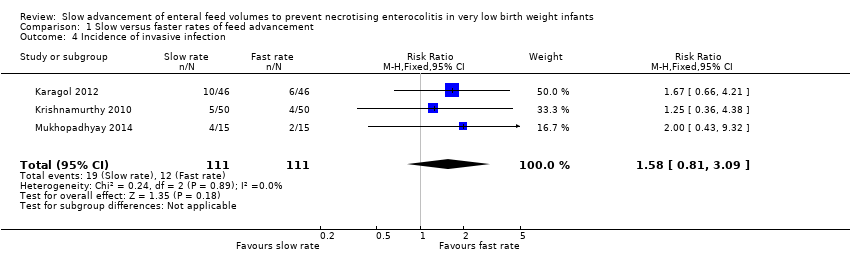
Meta‐analysis of data from three trials (222 infants) did not detect a statistically significant effect: typical RR 1.58 (95% CI 0.81 to 3.09); typical RD 0.06 (95% CI ‐0.03 to 0.15) (Figure 4).

Forest plot of comparison: 1 Slow versus faster rates of feed advancement, outcome: 1.4 Incidence of invasive infection.
Duration of hospital stay
Two trials did not detect a statistically significant difference:
-
Rayyis 1999 median difference 4 days
-
Caple 2004 mean difference 5 (95% CI ‐1 to 8) days
Two trials reported that the duration of hospital stay was statistically significantly longer in infants in the slow‐rate‐of‐advancement group:
-
Krishnamurthy 2010 median difference 1.5 days
-
Karagol 2012 mean difference 6 (95% CI not given) days
Subgroup analyses
1. Exclusively formula‐fed infants (Rayyis 1999). No statistically significant differences:
-
NEC: RR 1.44 (95% CI 0.63 to 3.32); RD 0.04 (95% CI ‐0.05 to 0.13)
-
Mortality: RR 0.59 (95% CI 0.10 to 3.46); RD ‐0.01 (95% CI ‐0.06 to 0.03)
2. Infants at least partially fed with human milk. Subgroup data not available.
3. ELBW or extremely preterm infants. None of the trials recruited predominantly ELBW or extremely preterm infants.
4. Infants with intrauterine growth restriction or absent or reversed end‐diastolic flow velocities (Salhotra 2004; Mukhopadhyay 2014). No statistically significant difference in NEC, but borderline significant increase in mortality in slow group:
Discussion
Summary of main results
The currently available trial data do not suggest that advancing enteral feed volumes at slow rates (typically 15 ml/kg/day to 20 ml/kg/day) compared to faster rates (30 ml/kg/day to 35 ml/kg/day) reduces the risk of NEC in very preterm or VLBW infants. The boundaries of the 95% CI for the estimate of effect are consistent with either four extra or four fewer cases of NEC in every 100 infants who have slow rates of feed advancement. Similarly, a meta‐analysis of data from these trials does not indicate an effect on all‐cause mortality, with the 95% CI boundaries being consistent with either nine extra or one fewer death in every 100 infants who have slow rates of feed advancement. A pre‐specified subgroup analysis showed a borderline statistically significant increase in risk of death with slow feeding in infants with growth restriction or antenatal absent end‐diastolic flow velocities. However, given that this finding was based on data from only two small trials with a total of 83 participants, it should be interpreted cautiously.
Infants who had slow advancement of feed volumes regained their birth weight several days later than infants who had faster rates of advancement of feed volumes. The clinical importance of this effect is unclear as long‐term growth or developmental outcomes have not been assessed. Similarly, infants who had slow advancement of feed volumes established full enteral feeding one to five days later than infants who had faster rates of advancement of feed volumes. Whether this is associated with such important adverse clinical consequences as a higher rate of nosocomial infection secondary to prolonged use of parenteral nutrition is not yet known, as few studies have reported this outcome. Despite the effect on the establishment of enteral feeding, the included trials did not find consistent evidence of an important effect on the duration of hospital admission.
Overall completeness and applicability of evidence
These findings should be applied with caution for several reasons. Few of the trial participants were ELBW or extremely preterm infants. One‐third of the participants in Karagol 2012 were of ELBW, but only a minority of infants in the two larger trials weighed less than 1000 g or were less than 28 weeks gestation at birth, or had evidence of intrauterine growth restriction (Rayyis 1999; Caple 2004). Infants who had severe respiratory distress requiring oxygen supplementation or ventilatory support were not eligible to participate in three of the trials (Salhotra 2004; Krishnamurthy 2010; Karagol 2012). The findings may not be applicable to these populations, which are at highest risk of developing feed intolerance or NEC (Luig 2005).
Fewer than half of all of the participating infants were fed with breast milk. Evidence exists that artificial‐formula feeding increases the risk of feed intolerance and NEC (Quigley 2014). The risk‐benefit balance of enteral feeding strategies may differ between human milk‐fed and formula‐fed very preterm or VLBW infants. It is also unclear whether the findings can be applied to infants who receive continuous infusion of intragastric feeds, as all of the infants in the included trials received enteral feeds as interval boluses. Randomised controlled trials have reported conflicting findings about the effect of continuous enteral infusion on feed tolerance in very preterm or VLBW infants (Premji 2011).
Although the finding that slow enteral feed volume advancement delays the establishment of full enteral feeds may seem intuitive, it is also plausible that advancing feed volumes faster could have resulted in more feed intolerance and therefore a delay in the establishment of full enteral feeding. The included trials pre‐specified definitions of feed intolerance that mandated interrupting or ceasing feed volume advancement, principally the detection of 'gastric residuals' (the gastric content aspirated prior to a planned gastric tube feed) and abdominal distension. However, the trial reports presented only limited data on the frequency of these outcomes. Furthermore, there is only limited evidence that the volume or colour of gastric residuals is predictive of the risk of NEC for infants whose feed volumes are advanced conservatively (Mihatsch 2002; Cobb 2004; Bertino 2009). Similarly, the clinical importance of abdominal distension or bowel loops visible through the abdominal wall (without other features of intra‐abdominal pathology) is unclear, especially in the modern era, when early and prolonged use of continuous positive airway pressure results in intestinal gaseous distension.
Quality of the evidence
The included trials were generally of good methodological quality, but, in common with other trials of feeding interventions in this population, it was not possible to mask caregivers and clinical assessors to the nature of the intervention (Figure 5). Although the lack of blinding may have resulted in surveillance and ascertainment biases, it is more likely to have caused an overestimation of the incidence of feed intolerance and NEC in infants whose feed volumes were advanced faster. The assessment of abdominal radiographs for signs of NEC was masked in most trials to ensure that the diagnosis of severe NEC (confirmed by the radiological detection of gas in the bowel wall or portal tract) was not prone to bias. However, since the microbial generation of gas in the bowel wall is substrate dependent, infants who received more enteral milk (substrate) may have been more likely to demonstrate this radiological sign than infants with equally severe bowel disease who had less intraluminal substrate. This 'substrate effect' is also more likely to cause overascertainment of NEC in the infants who had faster rates of feed volume advancement (Tyson 2007).

Risk of bias graph: review authors' judgements about each risk of bias item presented as percentages across all included studies.
Agreements and disagreements with other studies or reviews
This review focused specifically on the comparison of slow versus faster rates of feed volume advancement and did not compare progressive advancement with enteral fasting or trophic feeding (minimal enteral nutrition). Only one randomised controlled trial has compared trophic feeding with progressive enteral feed volume advancement (at daily increments of 20 ml/kg) (Berseth 2003). Although the trial found the risk of NEC to be statistically significantly higher in the infants whose feed volumes were progressively advanced, this finding should be interpreted cautiously. The trial was stopped early following an interim analysis, therefore the finding of an effect on the incidence of NEC may be spurious (Montori 2005). Caregivers and assessors were not blind to the intervention. As discussed above, this may have resulted in several sources of bias that are likely to cause an overestimation of the incidence of NEC in infants whose feed volumes are being advanced.

Forest plot of comparison: 1 Slow versus faster rates of feed advancement, outcome: 1.1 Incidence of necrotising enterocolitis.
Forest plot of comparison: 1 Slow versus faster rates of feed advancement, outcome: 1.2 Mortality.

Forest plot of comparison: 1 Slow versus faster rates of feed advancement, outcome: 1.3 Feeds intolerance (causing interruption of enteral feeding).
Forest plot of comparison: 1 Slow versus faster rates of feed advancement, outcome: 1.4 Incidence of invasive infection.

Risk of bias graph: review authors' judgements about each risk of bias item presented as percentages across all included studies.

Comparison 1 Slow versus faster rates of feed advancement, Outcome 1 Incidence of necrotising enterocolitis.

Comparison 1 Slow versus faster rates of feed advancement, Outcome 2 Mortality.

Comparison 1 Slow versus faster rates of feed advancement, Outcome 3 Feeds intolerance (causing interruption of enteral feeding).
Comparison 1 Slow versus faster rates of feed advancement, Outcome 4 Incidence of invasive infection.
| Outcome or subgroup title | No. of studies | No. of participants | Statistical method | Effect size |
| 1 Incidence of necrotising enterocolitis Show forest plot | 6 | Risk Ratio (M‐H, Fixed, 95% CI) | Subtotals only | |
| 1.1 All trials | 6 | 618 | Risk Ratio (M‐H, Fixed, 95% CI) | 0.96 [0.55, 1.70] |
| 1.2 Trials in which most infants were small for gestational age or growth restricted | 2 | 83 | Risk Ratio (M‐H, Fixed, 95% CI) | 0.34 [0.06, 2.04] |
| 2 Mortality Show forest plot | 5 | Risk Ratio (M‐H, Fixed, 95% CI) | Subtotals only | |
| 2.1 All trials | 5 | 460 | Risk Ratio (M‐H, Fixed, 95% CI) | 1.57 [0.92, 2.70] |
| 2.2 Trials in which most infants were small for gestational age or growth restricted | 2 | 83 | Risk Ratio (M‐H, Fixed, 95% CI) | 2.13 [1.02, 4.47] |
| 3 Feeds intolerance (causing interruption of enteral feeding) Show forest plot | 4 | 275 | Risk Ratio (M‐H, Fixed, 95% CI) | 1.23 [0.87, 1.73] |
| 4 Incidence of invasive infection Show forest plot | 3 | 222 | Risk Ratio (M‐H, Fixed, 95% CI) | 1.58 [0.81, 3.09] |