Rasurado perineal sistemático al ingreso en trabajo de parto
Appendices
Appendix 1. Methods to be used in future updates
Selection of studies
Two review authors will independently assess for inclusion all the potential studies we identify as a result of the search strategy. We will resolve any disagreement through discussion or, if required, we will consult a third person.
Data extraction and management
We will design a form to extract data. For eligible studies, at least two review authors will extract the data using the agreed form. We will resolve discrepancies through discussion or, if required, we will consult a third person. We will enter data into Review Manager software (RevMan 2014) and check for accuracy.
When information regarding any of the above is unclear, we will attempt to contact authors of the original reports to provide further details.
Assessment of risk of bias in included studies
Two review authors will independently assess risk of bias for each study using the criteria outlined in the Cochrane Handbook for Systematic Reviews of Interventions (Higgins 2011). We will resolve any disagreement by discussion or by involving a third assessor.
(1) Random sequence generation (checking for possible selection bias)
We will describe for each included study the method used to generate the allocation sequence in sufficient detail to allow an assessment of whether it should produce comparable groups.
We will assess the method as:
-
low risk of bias (any truly random process, e.g. random number table; computer random number generator);
-
high risk of bias (any non‐random process, e.g. odd or even date of birth; hospital or clinic record number);
-
unclear risk of bias.
(2) Allocation concealment (checking for possible selection bias)
We will describe for each included study the method used to conceal allocation to interventions prior to assignment and will assess whether intervention allocation could have been foreseen in advance of, or during recruitment, or changed after assignment.
We will assess the methods as:
-
low risk of bias (e.g. telephone or central randomisation; consecutively numbered sealed opaque envelopes);
-
high risk of bias (open random allocation; unsealed or non‐opaque envelopes, alternation; date of birth);
-
unclear risk of bias.
(3.1) Blinding of participants and personnel (checking for possible performance bias)
We will describe for each included study the methods used, if any, to blind study participants and personnel from knowledge of which intervention a participant received. We will consider that studies are at low risk of bias if they were blinded, or if we judge that the lack of blinding would be unlikely to affect results. We will assess blinding separately for different outcomes or classes of outcomes.
We will assess the methods as:
-
low, high or unclear risk of bias for participants;
-
low, high or unclear risk of bias for personnel.
(3.2) Blinding of outcome assessment (checking for possible detection bias)
We will describe for each included study the methods used, if any, to blind outcome assessors from knowledge of which intervention a participant received. We will assess blinding separately for different outcomes or classes of outcomes.
We will assess methods used to blind outcome assessment as:
-
low, high or unclear risk of bias.
(4) Incomplete outcome data (checking for possible attrition bias due to the amount, nature and handling of incomplete outcome data)
We will describe for each included study, and for each outcome or class of outcomes, the completeness of data including attrition and exclusions from the analysis. We will state whether attrition and exclusions were reported and the numbers included in the analysis at each stage (compared with the total randomised participants), reasons for attrition or exclusion where reported, and whether missing data were balanced across groups or were related to outcomes. Where sufficient information is reported, or can be supplied by the trial authors, we will re‐include missing data in the analyses which we undertake.
We will assess methods as:
-
low risk of bias (e.g. no missing outcome data; missing outcome data balanced across groups);
-
high risk of bias (e.g. numbers or reasons for missing data imbalanced across groups; ‘as treated’ analysis done with substantial departure of intervention received from that assigned at randomisation);
-
unclear risk of bias.
(5) Selective reporting (checking for reporting bias)
We will describe for each included study how we investigated the possibility of selective outcome reporting bias and what we found.
We will assess the methods as:
-
low risk of bias (where it is clear that all of the study’s pre‐specified outcomes and all expected outcomes of interest to the review have been reported);
-
high risk of bias (where not all the study’s pre‐specified outcomes have been reported; one or more reported primary outcomes were not pre‐specified; outcomes of interest are reported incompletely and so cannot be used; study fails to include results of a key outcome that would have been expected to have been reported);
-
unclear risk of bias.
(6) Other bias (checking for bias due to problems not covered by (1) to (5) above)
We will describe for each included study any important concerns we have about other possible sources of bias.
We will assess whether each study was free of other problems that could put it at risk of bias:
-
low risk of other bias;
-
high risk of other bias;
-
unclear whether there is risk of other bias.
(7) Overall risk of bias
We will make explicit judgements about whether studies are at high risk of bias, according to the criteria given in the Handbook (Higgins 2011). With reference to (1) to (6) above, we will assess the likely magnitude and direction of the bias and whether we consider it is likely to impact on the findings. We will explore the impact of the level of bias through undertaking sensitivity analyses ‐ see Sensitivity analysis.
We will assess the quality of the evidence using the GRADE approach in order to assess the quality of evidence related to the following key outcomes (maximum of seven) (Schunemann 2009).
-
Postpartum maternal febrile morbidity.
-
Neonatal infection.
-
Wound infection.
-
Maternal satisfaction (continuous data).
GRADE profiler (GRADE 2008) will be used to import data from Review Manager 5.3 (RevMan 2014) in order to create ’Summary of findings’ tables. A summary of the intervention effect and a measure of quality for each of the above outcomes will be produced using the GRADE approach to provide a measure of quality. The GRADE approach uses five considerations (study limitations, consistency of effect, imprecision, indirectness and publication bias) to assess the quality of the body of evidence for each outcome. For assessments of the overall quality of evidence for each outcome the evidence can be downgraded from 'high quality' by one level for serious (or by two levels for very serious) limitations, depending on assessments for risk of bias, indirectness of evidence, serious inconsistency, imprecision of effect estimates or potential publication bias.
Measures of treatment effect
Dichotomous data
For dichotomous data, we will present results as summary risk ratio with 95% confidence intervals.
Continuous data
For continuous data, we will use the mean difference if outcomes are measured in the same way between trials. We will use the standardised mean difference to combine trials that measure the same outcome, but use different methods.
Unit of analysis issues
Cluster‐randomised trials and cross‐over trials will not be eligible for inclusion in this review.
Dealing with missing data
For included studies, we will note levels of attrition. We will explore the impact of including studies with high levels of missing data in the overall assessment of treatment effect by using sensitivity analysis.
For all outcomes, we will carry out analyses, as far as possible, on an intention‐to‐treat basis, i.e. we will attempt to include all participants randomised to each group in the analyses, and all participants will be analysed in the group to which they were allocated, regardless of whether or not they received the allocated intervention. The denominator for each outcome in each trial will be the number randomised minus any participants whose outcomes are known to be missing.
Assessment of heterogeneity
We will assess statistical heterogeneity in each meta‐analysis using the Tau², I² and Chi² statistics. We will regard heterogeneity as substantial if the I² is greater than 30% and either the Tau² is greater than zero, or there is a low P value (less than 0.10) in the Chi² test for heterogeneity.
Assessment of reporting biases
If there are 10 or more studies in the meta‐analysis we will investigate reporting biases (such as publication bias) using funnel plots. We will assess funnel plot asymmetry visually. If asymmetry is suggested by a visual assessment, we will perform exploratory analyses to investigate it.
Data synthesis
We will carry out statistical analysis using the Review Manager software (RevMan 2014). We will use fixed‐effect meta‐analysis for combining data where it is reasonable to assume that studies are estimating the same underlying treatment effect: i.e. where trials are examining the same intervention, and the trials’ populations and methods are judged sufficiently similar. If there is clinical heterogeneity sufficient to expect that the underlying treatment effects differ between trials, or if substantial statistical heterogeneity is detected, we will use random‐effects meta‐analysis to produce an overall summary if an average treatment effect across trials is considered clinically meaningful. The random‐effects summary will be treated as the average of the range of possible treatment effects and we will discuss the clinical implications of treatment effects differing between trials. If the average treatment effect is not clinically meaningful, we will not combine trials.
If we use random‐effects analyses, the results will be presented as the average treatment effect with 95% confidence intervals, and the estimates of Tau² and I².
Subgroup analysis and investigation of heterogeneity
If we identify substantial heterogeneity, we will investigate it using subgroup analyses and sensitivity analyses. We will consider whether an overall summary is meaningful, and if it is, use random‐effects analysis to produce it.
We plan to carry out the following subgroup analyses for subsets of studies by:
-
random sequence generation and allocation concealment;
-
year of publication.
The following outcomes will be used in subgroup analysis:
-
postpartum maternal febrile morbidity, neonatal infection, maternal satisfaction.
We will assess subgroup differences by interaction tests available within RevMan (RevMan 2014). We will report the results of subgroup analyses quoting the Chi² statistic and P value, and the interaction test I² value.
Sensitivity analysis
We will conduct a sensitivity analysis to explore the impact of attrition in trials, with poor quality studies with high levels of missing data being excluded from the analysis.
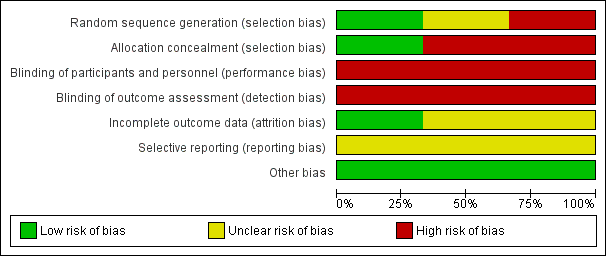
'Risk of bias' graph: review authors' judgements about each risk of bias item presented as percentages across all included studies.
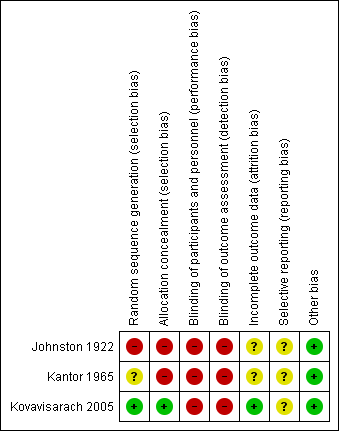
'Risk of bias' summary: review authors' judgements about each risk of bias item for each included study.

Comparison 1 Perineal shaving versus no perineal shaving, Outcome 1 Postpartum maternal febrile morbidity.

Comparison 1 Perineal shaving versus no perineal shaving, Outcome 2 Colonisation.

Comparison 1 Perineal shaving versus no perineal shaving, Outcome 3 Neonatal infection.

Comparison 1 Perineal shaving versus no perineal shaving, Outcome 4 Wound infection.

Comparison 1 Perineal shaving versus no perineal shaving, Outcome 5 Wound dehiscence.

Comparison 1 Perineal shaving versus no perineal shaving, Outcome 11 Maternal satisfaction continuous data.
| Routine perineal shaving before childbirth for women in labour | ||||||
| Population: Women in labour | ||||||
| Outcomes | Illustrative comparative risks* (95% CI) | Relative effect | No of Participants | Quality of the evidence | Comments | |
| Assumed risk | Corresponding risk | |||||
| Control | Routine perineal shaving before childbirth | |||||
| Postpartum maternal febrile morbidity | Study population | RR 1.16 | 997 | ⊕⊝⊝⊝ | ||
| 67 per 1000 | 77 per 1000 | |||||
| Low | ||||||
| 18 per 1000 | 20 per 1000 | |||||
| High | ||||||
| 124 per 1000 | 141 per 1000 | |||||
| Neonatal infection | Study population | Not estimable | 458 | see comment | The outcome was reported with no events. | |
| See comment | See comment | |||||
| Moderate | ||||||
| Wound infection | Study population | RR 1.47 | 458 | ⊕⊕⊝⊝ | ||
| 70 per 1000 | 103 per 1000 | |||||
| Moderate | ||||||
| 70 per 1000 | 103 per 1000 | |||||
| Maternal satisfaction | The mean maternal satisfaction in the control groups was | The mean maternal satisfaction in the intervention groups was | MD 0.00 (‐0.13, 0.13) | 458 | ⊕⊕⊝⊝ | |
| *The basis for the assumed risk (e.g. the median control group risk across studies) is provided in footnotes. The corresponding risk (and its 95% confidence interval) is based on the assumed risk in the comparison group and the relative effect of the intervention (and its 95% CI). | ||||||
| GRADE Working Group grades of evidence | ||||||
| 1 Most studies contributing data had serious design limitations. | ||||||
| Outcome or subgroup title | No. of studies | No. of participants | Statistical method | Effect size |
| 1 Postpartum maternal febrile morbidity Show forest plot | 3 | 997 | Risk Ratio (M‐H, Fixed, 95% CI) | 1.14 [0.73, 1.76] |
| 2 Colonisation Show forest plot | 1 | Risk Ratio (M‐H, Fixed, 95% CI) | Subtotals only | |
| 2.1 Gram‐positive | 1 | 150 | Risk Ratio (M‐H, Fixed, 95% CI) | 1.16 [0.82, 1.64] |
| 2.2 Gram‐negative | 1 | 150 | Risk Ratio (M‐H, Fixed, 95% CI) | 0.83 [0.70, 0.98] |
| 3 Neonatal infection Show forest plot | 1 | 458 | Risk Ratio (M‐H, Fixed, 95% CI) | 0.0 [0.0, 0.0] |
| 4 Wound infection Show forest plot | 1 | 458 | Risk Ratio (M‐H, Fixed, 95% CI) | 1.47 [0.80, 2.70] |
| 5 Wound dehiscence Show forest plot | 1 | 458 | Risk Ratio (M‐H, Fixed, 95% CI) | 0.33 [0.01, 8.00] |
| 6 Need for wound resuturing | 0 | 0 | Risk Ratio (M‐H, Fixed, 95% CI) | 0.0 [0.0, 0.0] |
| 7 Discomfort | 0 | 0 | Risk Ratio (M‐H, Fixed, 95% CI) | 0.0 [0.0, 0.0] |
| 8 Pain | 0 | 0 | Risk Ratio (M‐H, Fixed, 95% CI) | 0.0 [0.0, 0.0] |
| 9 Maternal embarrassment | 0 | 0 | Risk Ratio (M‐H, Fixed, 95% CI) | 0.0 [0.0, 0.0] |
| 10 Maternal satisfaction | 0 | 0 | Risk Ratio (M‐H, Fixed, 95% CI) | 0.0 [0.0, 0.0] |
| 11 Maternal satisfaction continuous data Show forest plot | 1 | 458 | Mean Difference (IV, Fixed, 95% CI) | 0.0 [‐0.13, 0.13] |