Farmacoterapia para el trastorno de ansiedad social (TAnS)
Información
- DOI:
- https://doi.org/10.1002/14651858.CD001206.pub3Copiar DOI

- Base de datos:
-
- Cochrane Database of Systematic Reviews
- Versión publicada:
-
- 19 octubre 2017see what's new
- Tipo:
-
- Intervention
- Etapa:
-
- Review
- Grupo Editorial Cochrane:
-
Grupo Cochrane de Trastornos mentales comunes
- Copyright:
-
- Copyright © 2019 The Cochrane Collaboration. Published by John Wiley & Sons, Ltd.
Cifras del artículo
Altmetric:
Citado por:
Autores
Contributions of authors
Dan Stein, Taryn Williams and Jonathan Ipser co‐ordinated the work on the update of this review. Jonathan Ipser and Taryn Williams compiled the updated version of the review, including rechecking all studies for eligibility and risk of bias, completing all GRADE tables, analysing the data, and updating the Abstract, Results, Discussion and Authors' conclusion sections of the review. Catherine Kariuki, Sean Tromp, and Coenraad Hattingh reviewed the final draft and made comments where relevant.
Sources of support
Internal sources
-
No sources of support supplied
External sources
-
MRC Research Unit on Anxiety and Stress Disorders, Cape Town, South Africa.
Declarations of interest
Dan Stein has received research grants and/or consultancy honoraria from AMBRF, Biocodex, Cipla, Lundbeck, National Responsible Gambling Foundation, Novartis, Servier, and Sun.
Taryn Williams: none known.
Jonathan Ipser: none known.
Coenraad J Hattingh: none known.
Catherine M Kariuki: none known.
Sean A Tromp: none known.
Anton J van Balkom: none known.
Acknowledgements
We would like to thank the Medical Research Council (Cape Town, South Africa) for its financial support, Lize van der Merwe for statistical guidance, as well as Satoshi Asakura, David Baldwin, Jonathan RT Davidson, Tomas Furmark, Richard G Heimberg, Moritz Muehlbacher, Franklin R Schneier, and John R Walker for additional trial data. The authors would also like to thank the Cochrane internal and external reviewers for comments on an earlier draft and for providing advice on the process of a Cochrane Review. We are also grateful to Dr Tamara Kredo for her continuous support.
CRG Funding Acknowledgement: the National Institute for Health Research (NIHR) is the largest single funder of the Cochrane Depression, Anxiety and Neurosis Group.
Disclaimer: the views and opinions expressed therein are those of the authors and do not necessarily reflect those of the NIHR, NHS or the Department of Health.
Version history
| Published | Title | Stage | Authors | Version |
| 2017 Oct 19 | Pharmacotherapy for social anxiety disorder (SAnD) | Review | Taryn Williams, Coenie J Hattingh, Catherine M Kariuki, Sean A Tromp, Anton J van Balkom, Jonathan C Ipser, Dan J Stein | |
| 2004 Oct 18 | Pharmacotherapy for social anxiety disorder | Review | Dan J Stein, Jonathan C Ipser, Anton J van Balkom | |
| 1999 Jan 25 | Pharmacotherapy for social phobia | Protocol | Geoffrey JH van der Linden, B alkom van, JLM, N Zung‐dirwayi, D J Stein | |
Differences between protocol and review
We did not conduct a survival analysis to obtain time‐to‐event data or hazard ratios.
We included post hoc additional comparisons involving 5HT partial agonists, anticonvulsants with and without GABAs, antipsychotics, NARIs, NaSSAs, and SARIs.
We conducted a post hoc analysis for all medications for the treatment of SAnD, with the removal of three studies. We also conducted a post hoc analysis for the RIMA moclobemide given that brofaromine is no longer available.
We included mean change scores, where provided, for the LSAS outcome for symptom reduction, rather than the approach taken in the previous version of this review of conducting separate analyses of endpoint and change scores.
This review incorporates the GRADE approach with 'Summary of findings' tables.
We have moved treatment tolerability (i.e. dropouts due to side effects) to a primary outcome for this review. This is in keeping with recommendations from section 4.5 of the Cochrane Handbook for Systematic Reviews of Interventions that primary outcomes of a review should include negative as well as positive outcomes (Higgins 2011).
We added subgroup analyses (i.e. multicentre compared to single centre trials; generalised SAnD compared to inclusive SAnD; industry funding compared to no industry funding; and whether or not the sample included or excluded patients diagnosed with major depressive disorder (MDD)) and sensitivity analyses (worst case versus best case: support for robustness of evidence).
Keywords
MeSH
Medical Subject Headings (MeSH) Keywords
- Anticonvulsants [therapeutic use];
- Chronic Disease;
- Monoamine Oxidase Inhibitors [therapeutic use];
- Phobia, Social [*drug therapy];
- Randomized Controlled Trials as Topic;
- Selective Serotonin Reuptake Inhibitors [therapeutic use];
- Serotonin and Noradrenaline Reuptake Inhibitors [therapeutic use];
- Venlafaxine Hydrochloride [therapeutic use];
Medical Subject Headings Check Words
Adult; Aged; Humans; Middle Aged; Young Adult;
PICO
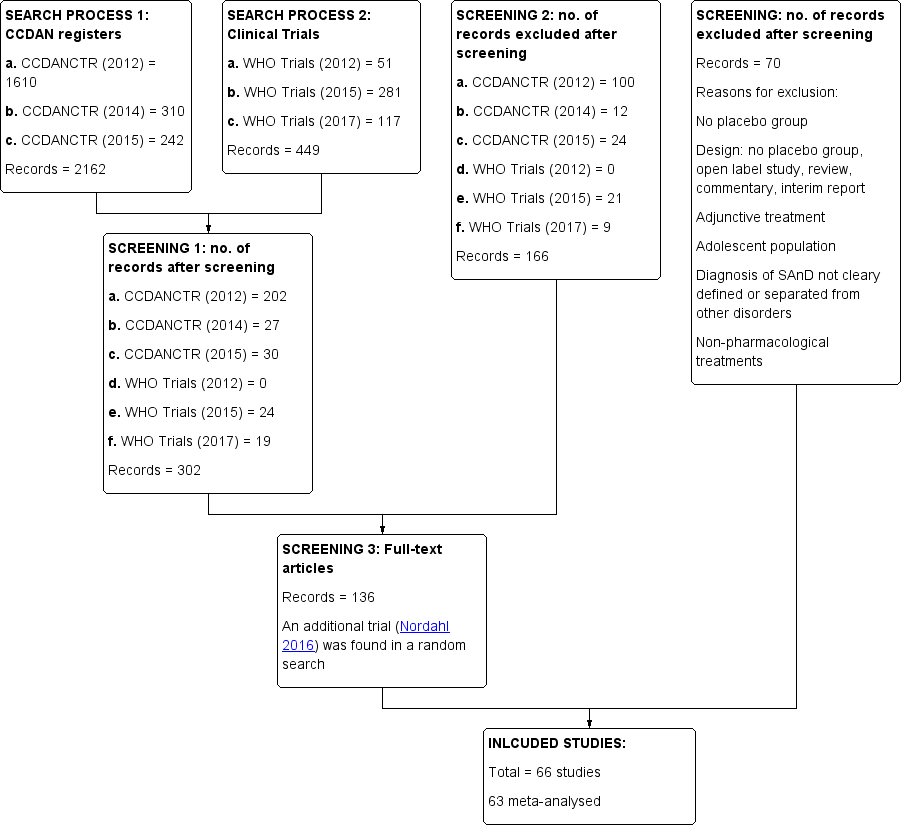
Study flow diagram.
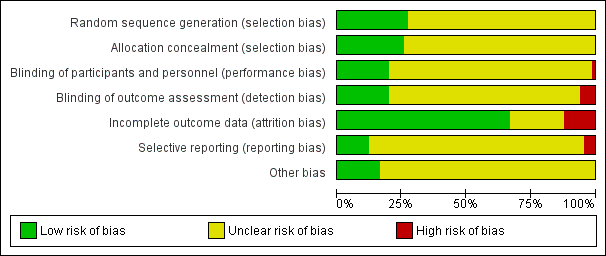
Risk of bias graph: review authors' judgements about each risk of bias item presented as percentages across all included studies.
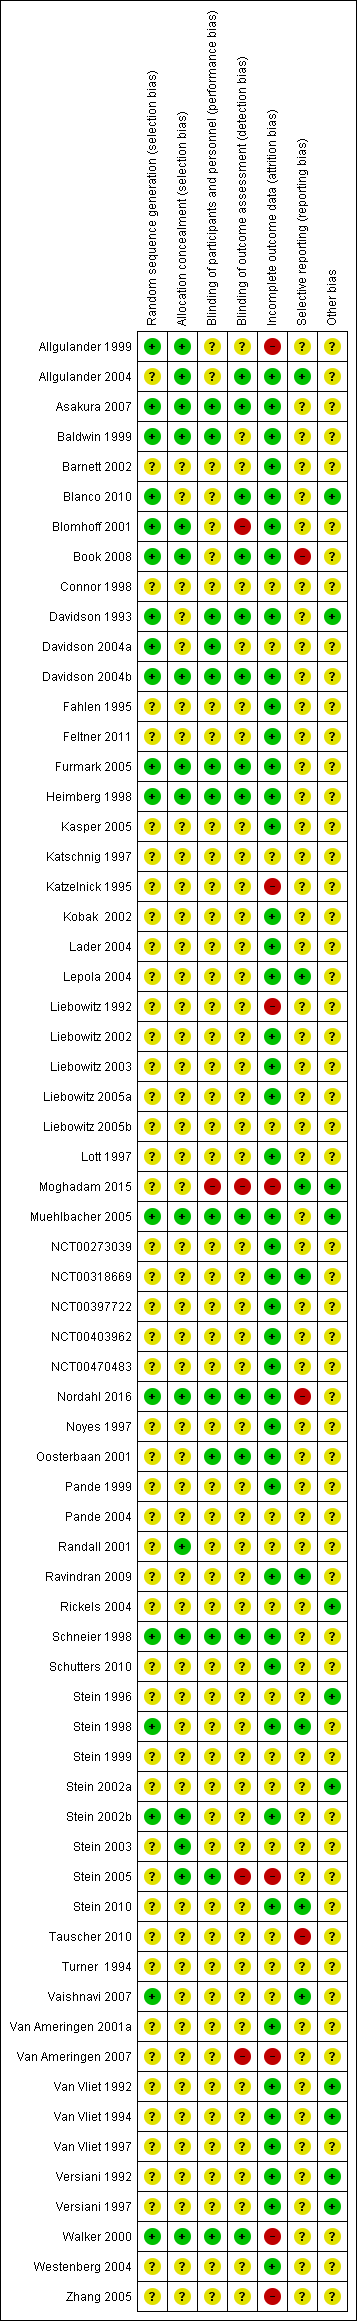
Risk of bias summary: review authors' judgements about each risk of bias item for each included study.

Contour enhanced funnel plot for treatment response on the CGI‐I for all medication trials
Filled circles = trial effect estimates; empty circles = trim and fill generated missing study estimates
Contours in light‐gray, gray and dark gray correspond to increasing stringent statistical boundaries (alpha = 0.1, 0.05, and 0.01, respectively). White corresponds to regions of statistical non‐significance.

Contour enhanced funnel plot for treatment response on the CGI‐I for SSRI trials
Filled circles = trial effect estimates; empty circles = trim and fill generated missing study estimates
Contours in light‐gray, gray and dark gray correspond to increasing stringent statistical boundaries (alpha = 0.1, 0.05, and 0.01, respectively). White corresponds to regions of statistical non‐significance.

Comparison 1 Comparison 1: 5HT1A partial agonists versus placebo, Outcome 1 Clinical Global Impressions ‐ Improvement (CGI‐I) or similar scale (acute phase).

Comparison 1 Comparison 1: 5HT1A partial agonists versus placebo, Outcome 2 Adverse events (acute phase).
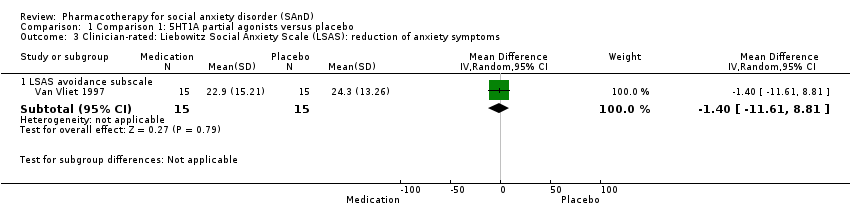
Comparison 1 Comparison 1: 5HT1A partial agonists versus placebo, Outcome 3 Clinician‐rated: Liebowitz Social Anxiety Scale (LSAS): reduction of anxiety symptoms.

Comparison 1 Comparison 1: 5HT1A partial agonists versus placebo, Outcome 4 Clinician‐rated: Hamilton Depression scale (HAM‐D) (or similar scale).

Comparison 1 Comparison 1: 5HT1A partial agonists versus placebo, Outcome 5 All‐cause dropouts (acute phase).

Comparison 2 Comparison 2: anticonvulsants/GABAs versus placebo, Outcome 1 Clinical Global Impressions ‐ Improvement (CGI‐I) or similar scale (acute phase).
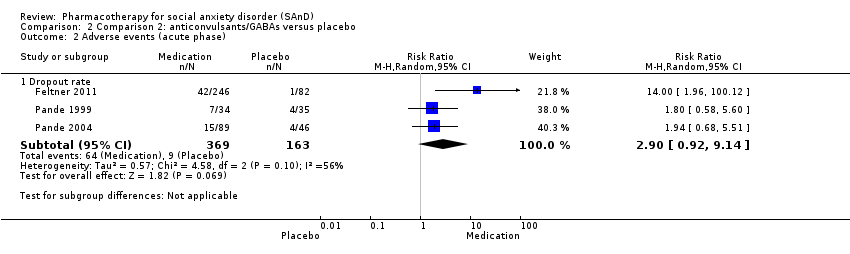
Comparison 2 Comparison 2: anticonvulsants/GABAs versus placebo, Outcome 2 Adverse events (acute phase).
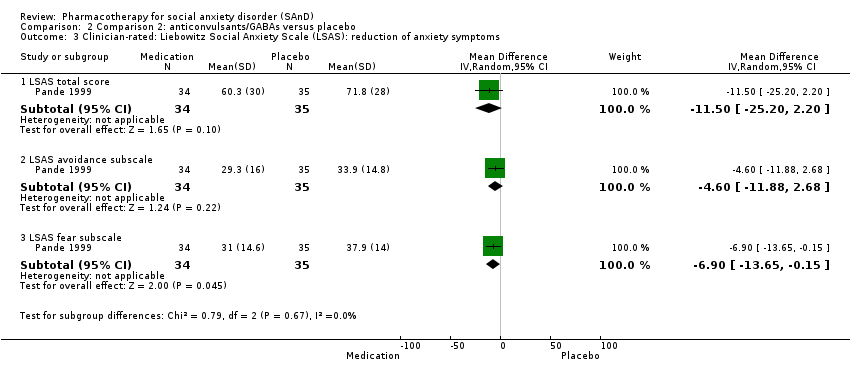
Comparison 2 Comparison 2: anticonvulsants/GABAs versus placebo, Outcome 3 Clinician‐rated: Liebowitz Social Anxiety Scale (LSAS): reduction of anxiety symptoms.

Comparison 2 Comparison 2: anticonvulsants/GABAs versus placebo, Outcome 4 Clinician‐rated: Hamilton Depression scale (HAM‐D) (or similar scale).
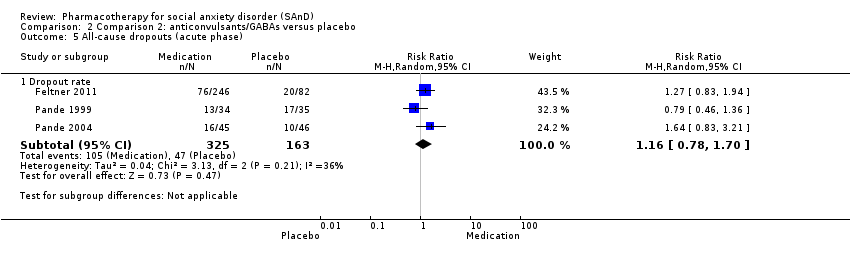
Comparison 2 Comparison 2: anticonvulsants/GABAs versus placebo, Outcome 5 All‐cause dropouts (acute phase).

Comparison 3 Comparison 3: anticonvulsant levetiracetam versus placebo, Outcome 1 Clinical Global Impressions ‐ Improvement (CGI‐I) or similar scale (acute phase).
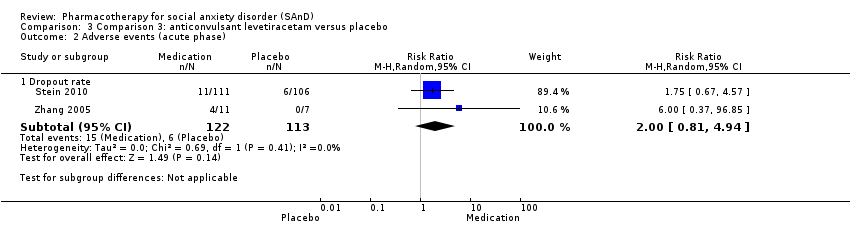
Comparison 3 Comparison 3: anticonvulsant levetiracetam versus placebo, Outcome 2 Adverse events (acute phase).
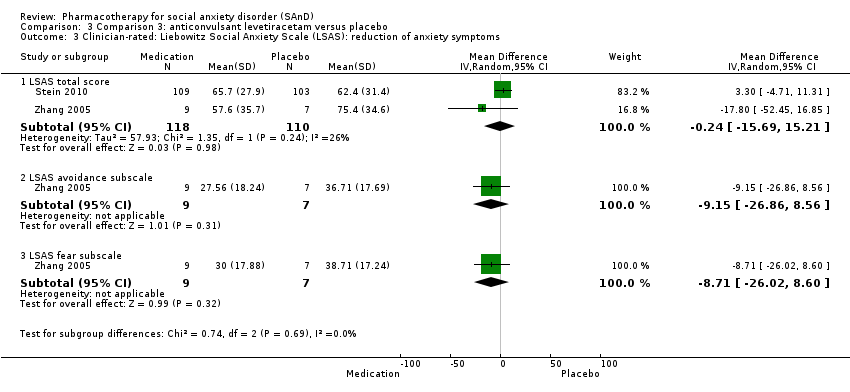
Comparison 3 Comparison 3: anticonvulsant levetiracetam versus placebo, Outcome 3 Clinician‐rated: Liebowitz Social Anxiety Scale (LSAS): reduction of anxiety symptoms.
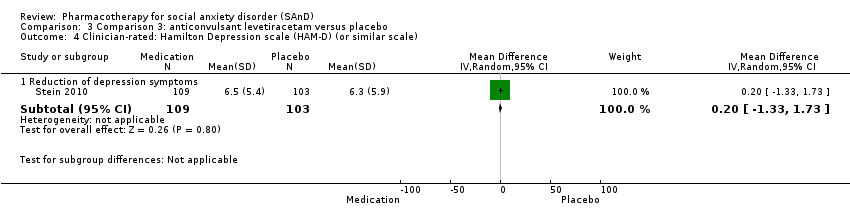
Comparison 3 Comparison 3: anticonvulsant levetiracetam versus placebo, Outcome 4 Clinician‐rated: Hamilton Depression scale (HAM‐D) (or similar scale).
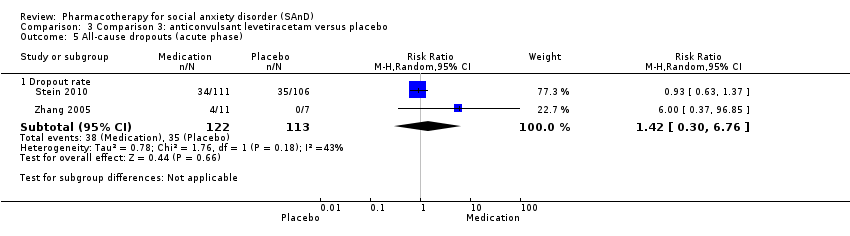
Comparison 3 Comparison 3: anticonvulsant levetiracetam versus placebo, Outcome 5 All‐cause dropouts (acute phase).

Comparison 4 Comparison 4: antipsychotics versus placebo, Outcome 1 Clinical Global Impressions ‐ Improvement (CGI‐I) or similar scale (acute phase).
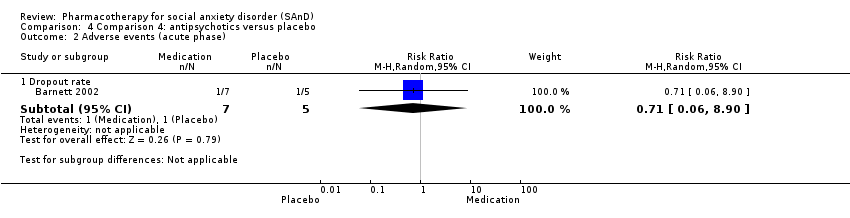
Comparison 4 Comparison 4: antipsychotics versus placebo, Outcome 2 Adverse events (acute phase).
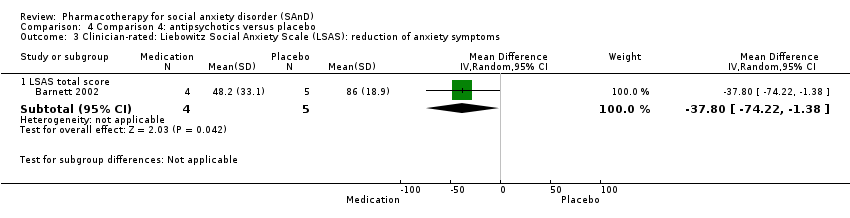
Comparison 4 Comparison 4: antipsychotics versus placebo, Outcome 3 Clinician‐rated: Liebowitz Social Anxiety Scale (LSAS): reduction of anxiety symptoms.

Comparison 4 Comparison 4: antipsychotics versus placebo, Outcome 4 All‐cause dropouts (acute phase).

Comparison 5 Comparison 5: benzodiazepines versus placebo, Outcome 1 Clinical Global Impressions ‐ Improvement (CGI‐I) or similar scale (acute phase).

Comparison 5 Comparison 5: benzodiazepines versus placebo, Outcome 2 Relapse rate.

Comparison 5 Comparison 5: benzodiazepines versus placebo, Outcome 3 Adverse events (acute phase).
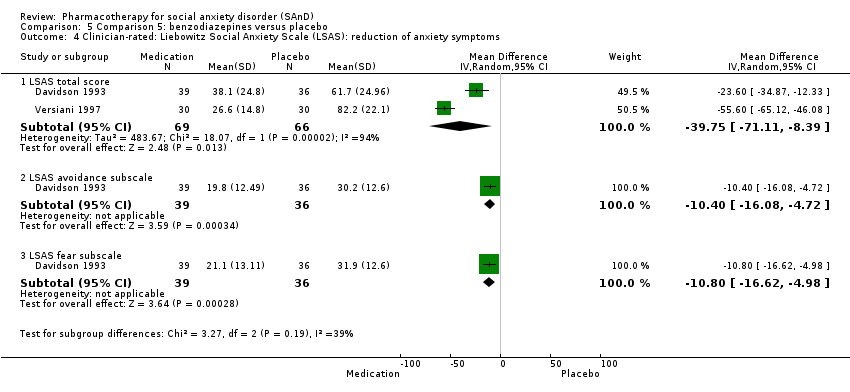
Comparison 5 Comparison 5: benzodiazepines versus placebo, Outcome 4 Clinician‐rated: Liebowitz Social Anxiety Scale (LSAS): reduction of anxiety symptoms.
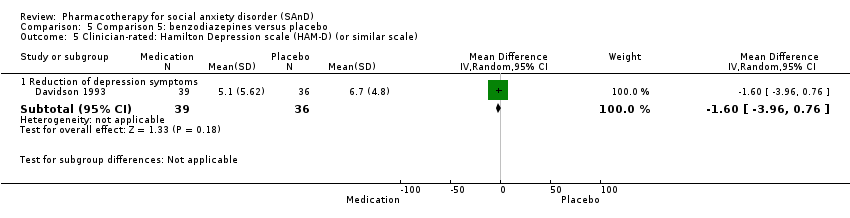
Comparison 5 Comparison 5: benzodiazepines versus placebo, Outcome 5 Clinician‐rated: Hamilton Depression scale (HAM‐D) (or similar scale).
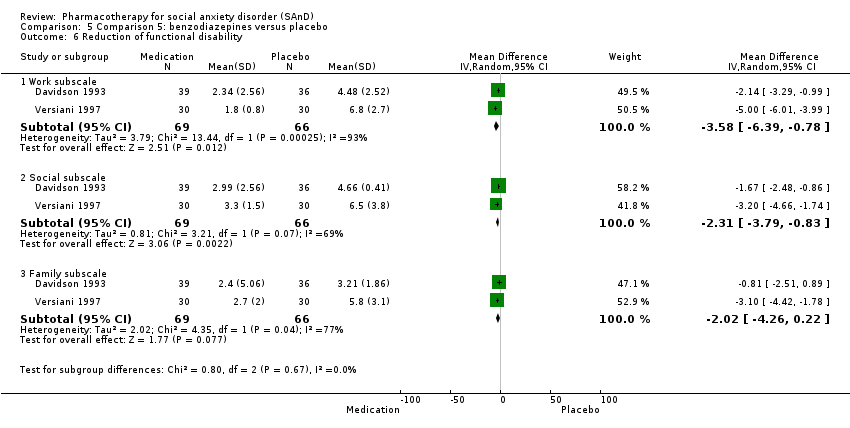
Comparison 5 Comparison 5: benzodiazepines versus placebo, Outcome 6 Reduction of functional disability.

Comparison 5 Comparison 5: benzodiazepines versus placebo, Outcome 7 All‐cause dropouts (acute phase).

Comparison 6 Comparison 6: beta‐blockers versus placebo, Outcome 1 Clinical Global Impressions ‐ Improvement (CGI‐I) or similar scale (acute phase).

Comparison 6 Comparison 6: beta‐blockers versus placebo, Outcome 2 Clinician‐rated: Hamilton Depression scale (HAM‐D) (or similar scale).
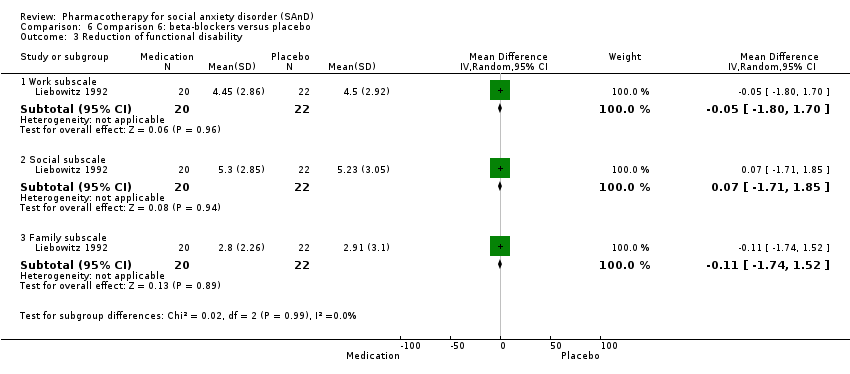
Comparison 6 Comparison 6: beta‐blockers versus placebo, Outcome 3 Reduction of functional disability.

Comparison 6 Comparison 6: beta‐blockers versus placebo, Outcome 4 All‐cause dropouts (acute phase).
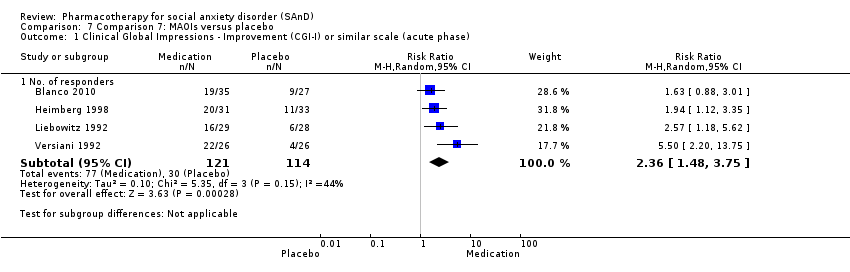
Comparison 7 Comparison 7: MAOIs versus placebo, Outcome 1 Clinical Global Impressions ‐ Improvement (CGI‐I) or similar scale (acute phase).

Comparison 7 Comparison 7: MAOIs versus placebo, Outcome 2 Clinician‐rated: Liebowitz Social Anxiety Scale (LSAS): reduction of anxiety symptoms.

Comparison 7 Comparison 7: MAOIs versus placebo, Outcome 3 Clinician‐rated: Hamilton Depression scale (HAM‐D) (or similar scale).

Comparison 7 Comparison 7: MAOIs versus placebo, Outcome 4 Reduction of functional disability.

Comparison 7 Comparison 7: MAOIs versus placebo, Outcome 5 All‐cause dropouts (acute phase).
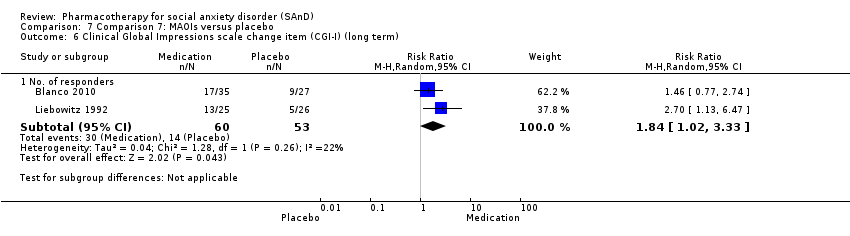
Comparison 7 Comparison 7: MAOIs versus placebo, Outcome 6 Clinical Global Impressions scale change item (CGI‐I) (long term).

Comparison 8 Comparison 8: NARIs versus placebo, Outcome 1 Clinical Global Impressions ‐ Improvement (CGI‐I) or similar scale (acute phase).

Comparison 8 Comparison 8: NARIs versus placebo, Outcome 2 Adverse events (acute phase).

Comparison 8 Comparison 8: NARIs versus placebo, Outcome 3 Clinician‐rated: Liebowitz Social Anxiety Scale (LSAS): reduction of anxiety symptoms.

Comparison 8 Comparison 8: NARIs versus placebo, Outcome 4 Clinician‐rated: Hamilton Depression scale (HAM‐D) (or similar scale).

Comparison 8 Comparison 8: NARIs versus placebo, Outcome 5 All‐cause dropouts (acute phase).

Comparison 9 Comparison 9: NaSSAs versus placebo, Outcome 1 Clinical Global Impressions ‐ Improvement (CGI‐I) or similar scale (acute phase).

Comparison 9 Comparison 9: NaSSAs versus placebo, Outcome 2 Adverse events (acute phase).
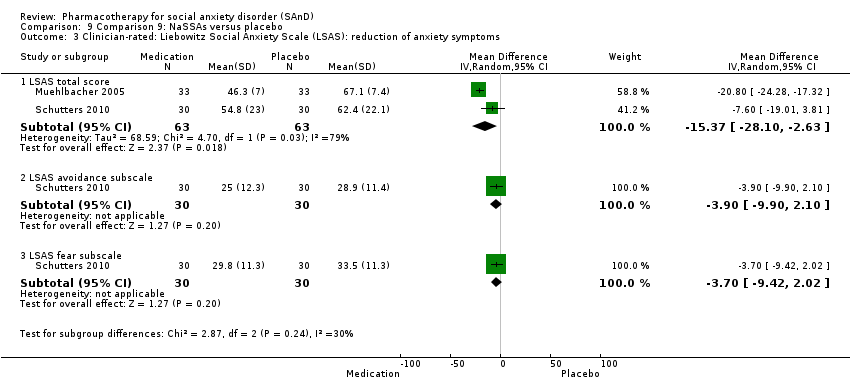
Comparison 9 Comparison 9: NaSSAs versus placebo, Outcome 3 Clinician‐rated: Liebowitz Social Anxiety Scale (LSAS): reduction of anxiety symptoms.

Comparison 9 Comparison 9: NaSSAs versus placebo, Outcome 4 All‐cause dropouts (acute phase).

Comparison 10 Comparison 10: RIMAs versus placebo, Outcome 1 Clinical Global Impressions ‐ Improvement (CGI‐I) or similar scale (acute phase).
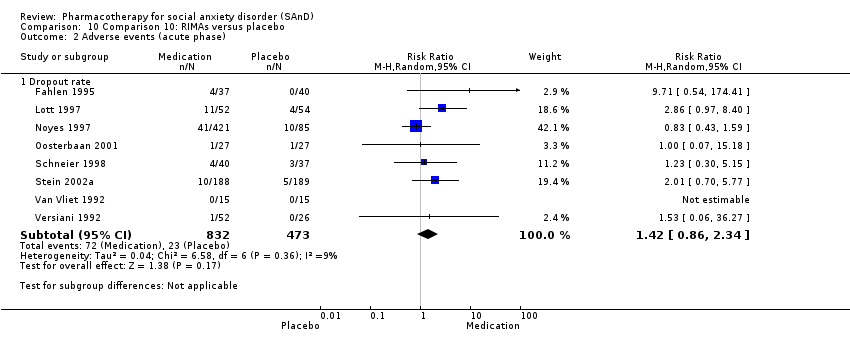
Comparison 10 Comparison 10: RIMAs versus placebo, Outcome 2 Adverse events (acute phase).

Comparison 10 Comparison 10: RIMAs versus placebo, Outcome 3 Clinician‐rated: Liebowitz Social Anxiety Scale (LSAS): reduction of anxiety symptoms.

Comparison 10 Comparison 10: RIMAs versus placebo, Outcome 4 Clinician‐rated: Hamilton Depression scale (HAM‐D) (or similar scale).

Comparison 10 Comparison 10: RIMAs versus placebo, Outcome 5 Reduction of functional disability.

Comparison 10 Comparison 10: RIMAs versus placebo, Outcome 6 All‐cause dropouts (acute phase).
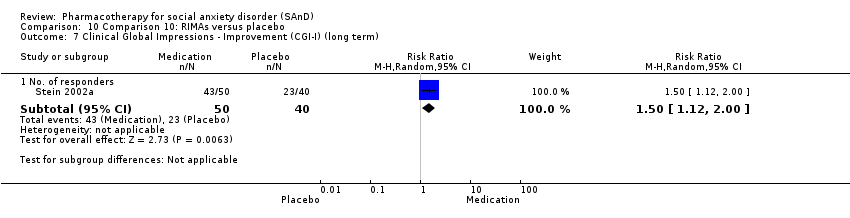
Comparison 10 Comparison 10: RIMAs versus placebo, Outcome 7 Clinical Global Impressions ‐ Improvement (CGI‐I) (long term).

Comparison 11 Comparison 11: SARIs versus placebo, Outcome 1 Clinician‐rated: Liebowitz Social Anxiety Scale (LSAS): reduction of anxiety symptoms.

Comparison 11 Comparison 11: SARIs versus placebo, Outcome 2 Clinician‐rated: Hamilton Depression scale (HAM‐D) (or similar scale).

Comparison 11 Comparison 11: SARIs versus placebo, Outcome 3 Reduction of functional disability.

Comparison 11 Comparison 11: SARIs versus placebo, Outcome 4 All‐cause dropouts (acute phase).

Comparison 12 Comparison 12: SNRIs versus placebo, Outcome 1 Clinical Global Impressions ‐ Improvement (CGI‐I) or similar scale (acute phase).

Comparison 12 Comparison 12: SNRIs versus placebo, Outcome 2 Adverse events (acute phase).
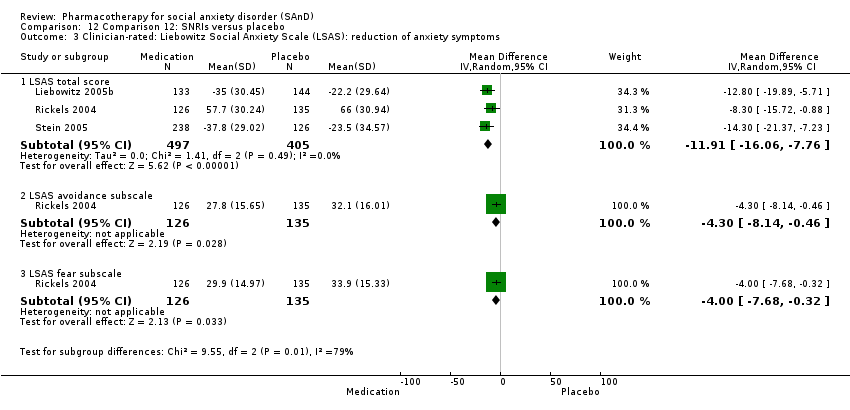
Comparison 12 Comparison 12: SNRIs versus placebo, Outcome 3 Clinician‐rated: Liebowitz Social Anxiety Scale (LSAS): reduction of anxiety symptoms.

Comparison 12 Comparison 12: SNRIs versus placebo, Outcome 4 All‐cause dropouts (acute phase).
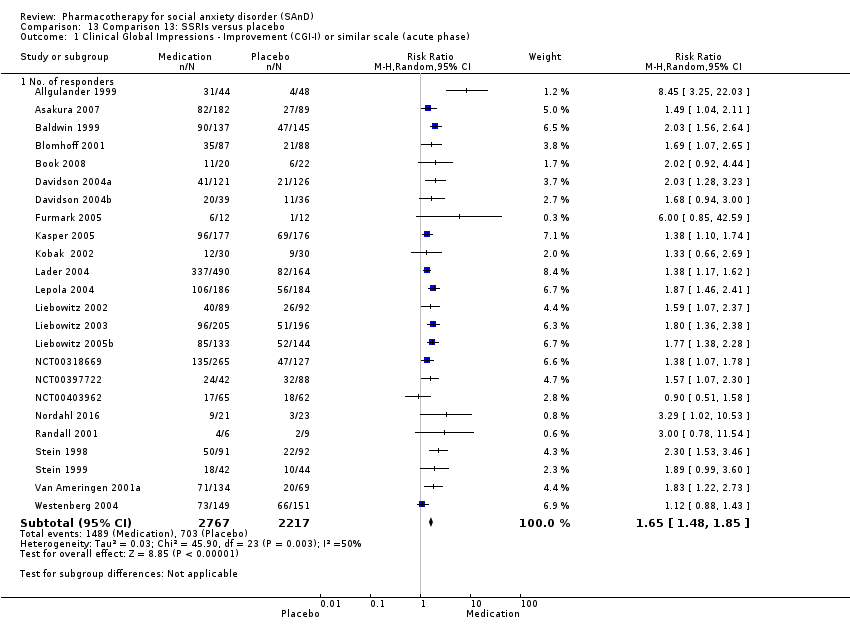
Comparison 13 Comparison 13: SSRIs versus placebo, Outcome 1 Clinical Global Impressions ‐ Improvement (CGI‐I) or similar scale (acute phase).
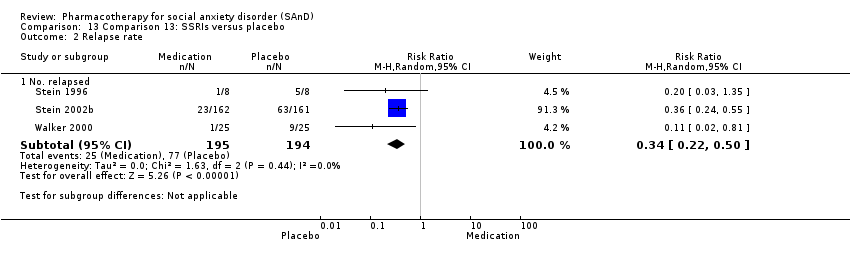
Comparison 13 Comparison 13: SSRIs versus placebo, Outcome 2 Relapse rate.

Comparison 13 Comparison 13: SSRIs versus placebo, Outcome 3 Adverse events (acute phase).

Comparison 13 Comparison 13: SSRIs versus placebo, Outcome 4 Clinician‐rated: Liebowitz Social Anxiety Scale (LSAS): reduction of anxiety symptoms.

Comparison 13 Comparison 13: SSRIs versus placebo, Outcome 5 Clinician‐rated: Hamilton Depression scale (HAM‐D) (or similar scale).

Comparison 13 Comparison 13: SSRIs versus placebo, Outcome 6 Reduction of functional disability.

Comparison 13 Comparison 13: SSRIs versus placebo, Outcome 7 All‐cause dropouts (acute phase).

Comparison 13 Comparison 13: SSRIs versus placebo, Outcome 8 Clinical Global Impressions scale change item (CGI‐I) (long term).

Comparison 13 Comparison 13: SSRIs versus placebo, Outcome 9 Adverse events (long term).
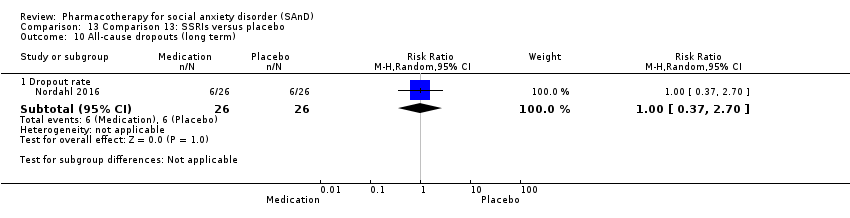
Comparison 13 Comparison 13: SSRIs versus placebo, Outcome 10 All‐cause dropouts (long term).
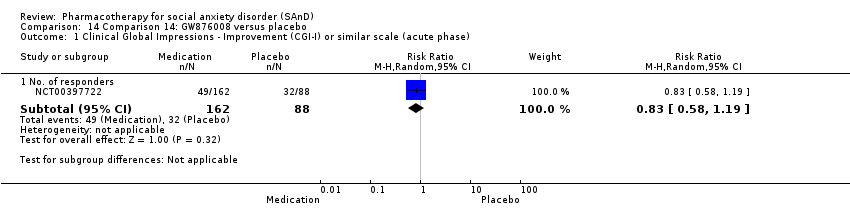
Comparison 14 Comparison 14: GW876008 versus placebo, Outcome 1 Clinical Global Impressions ‐ Improvement (CGI‐I) or similar scale (acute phase).
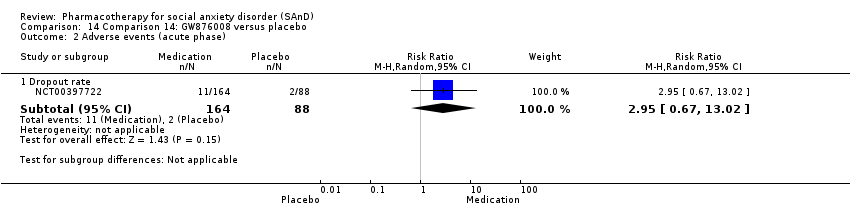
Comparison 14 Comparison 14: GW876008 versus placebo, Outcome 2 Adverse events (acute phase).

Comparison 14 Comparison 14: GW876008 versus placebo, Outcome 3 All‐cause dropouts (acute phase).
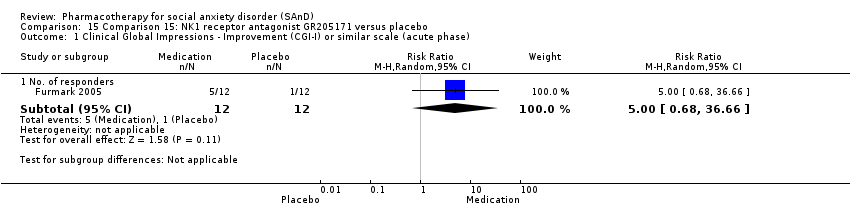
Comparison 15 Comparison 15: NK1 receptor antagonist GR205171 versus placebo, Outcome 1 Clinical Global Impressions ‐ Improvement (CGI‐I) or similar scale (acute phase).

Comparison 15 Comparison 15: NK1 receptor antagonist GR205171 versus placebo, Outcome 2 Adverse events (acute phase).

Comparison 15 Comparison 15: NK1 receptor antagonist GR205171 versus placebo, Outcome 3 Clinician‐rated: Liebowitz Social Anxiety Scale (LSAS): reduction of anxiety symptoms.

Comparison 15 Comparison 15: NK1 receptor antagonist GR205171 versus placebo, Outcome 4 All‐cause dropouts (acute phase).

Comparison 16 Comparison 16: LY686017 versus placebo, Outcome 1 Clinician‐rated: Liebowitz Social Anxiety Scale (LSAS): reduction of anxiety symptoms.

Comparison 17 Comparison 17: total effect of medication compared to placebo for the treatment of SAnD, Outcome 1 Clinical Global Impressions ‐ Improvement (CGI‐I) or similar) scale: no. of responders (acute phase).
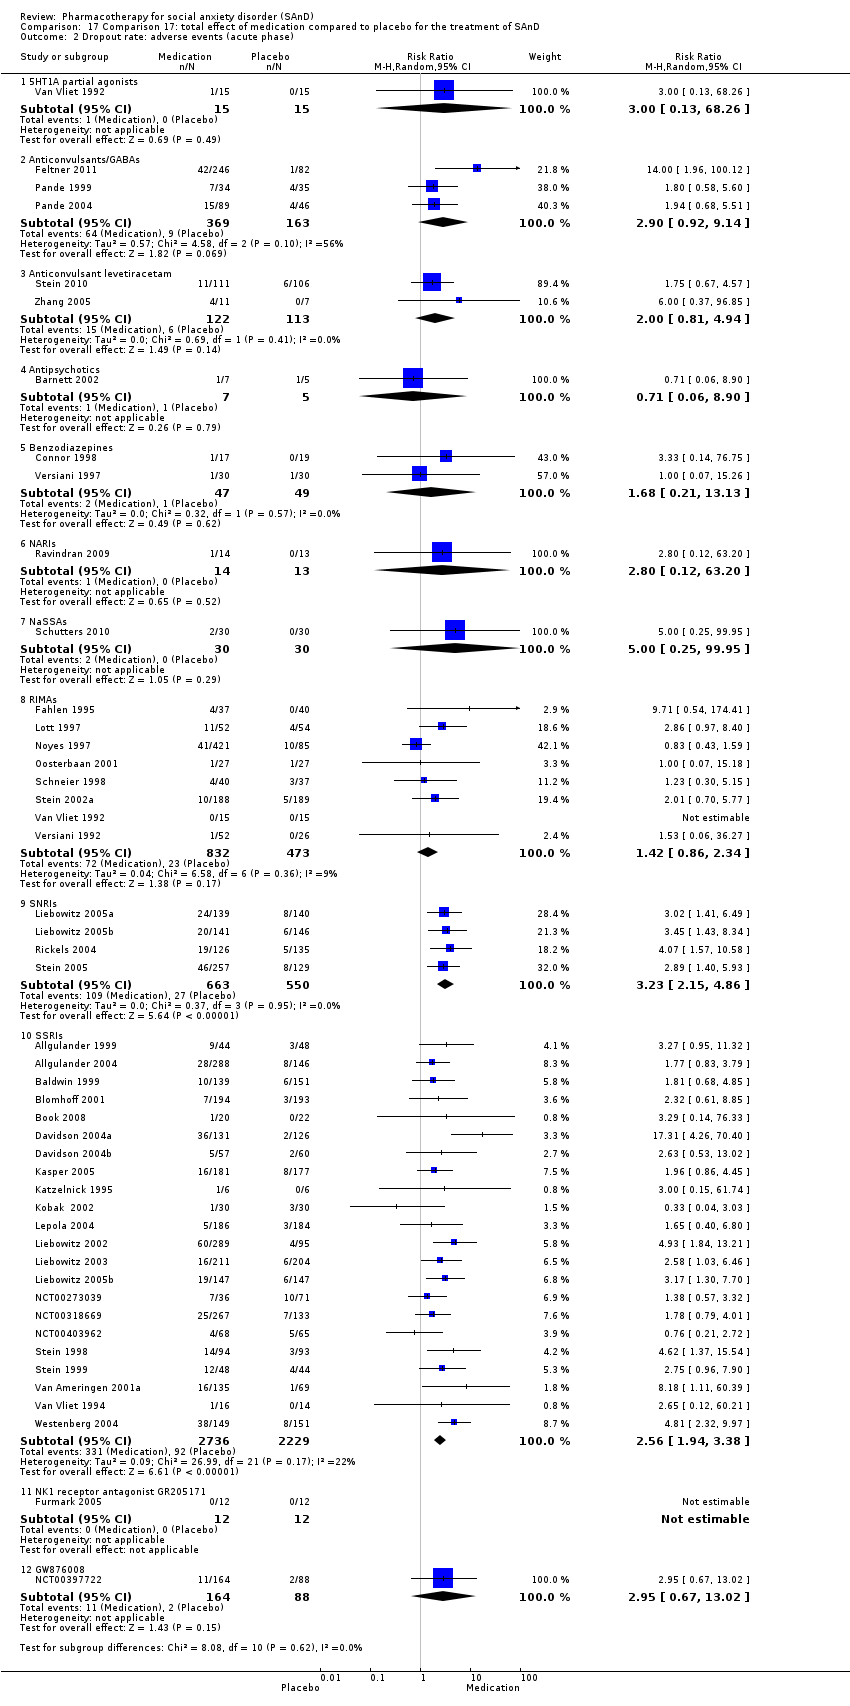
Comparison 17 Comparison 17: total effect of medication compared to placebo for the treatment of SAnD, Outcome 2 Dropout rate: adverse events (acute phase).

Comparison 17 Comparison 17: total effect of medication compared to placebo for the treatment of SAnD, Outcome 3 Dropout rate: all‐cause dropouts (acute phase).

Comparison 18 Subgroup analysis: multicentre versus single‐centre trials, Outcome 1 Clinical Global Impressions ‐ Improvement (CGI‐I) or similar scale: no. of responders (acute phase).
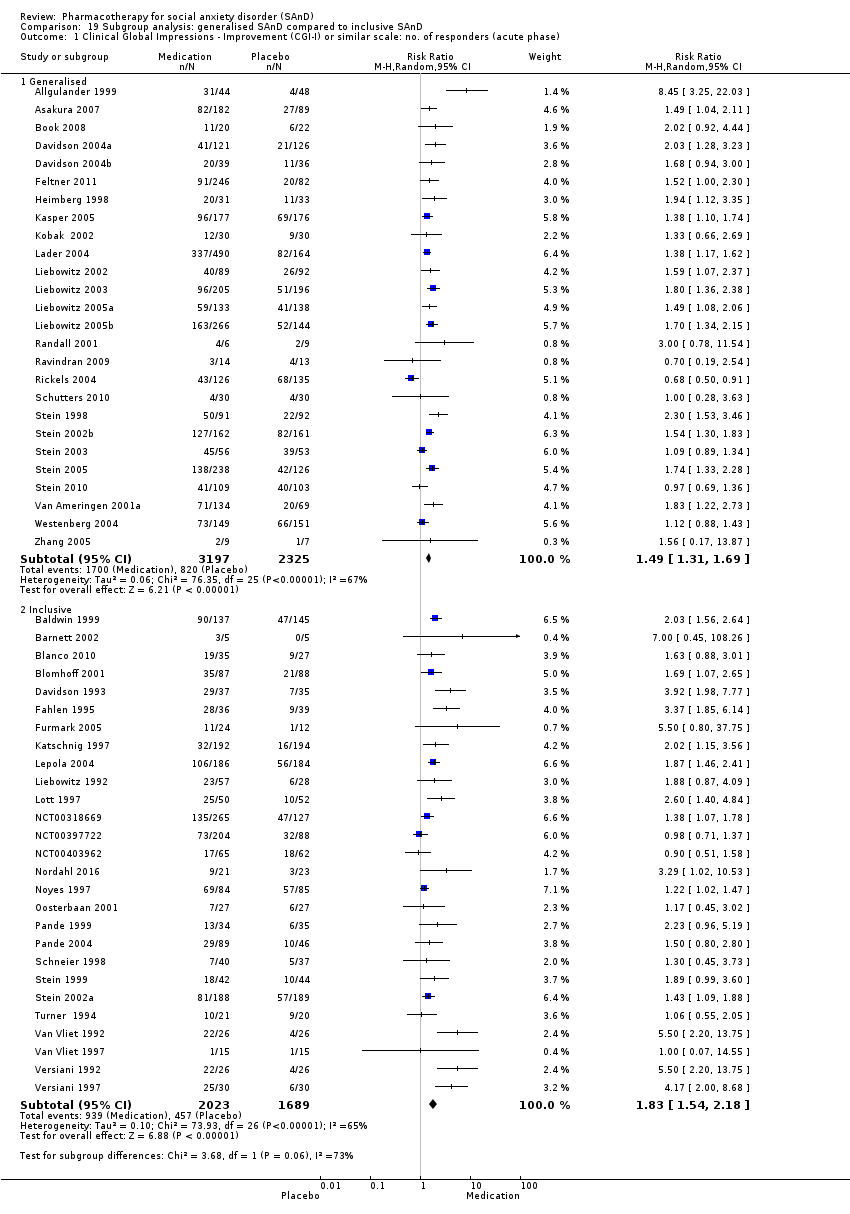
Comparison 19 Subgroup analysis: generalised SAnD compared to inclusive SAnD, Outcome 1 Clinical Global Impressions ‐ Improvement (CGI‐I) or similar scale: no. of responders (acute phase).

Comparison 20 Subgroup analysis: industry funding compared to no industry funding, Outcome 1 Clinical Global Impressions ‐ Improvement (CGI‐I) or similar scale: no. of responders (acute phase).

Comparison 21 Subgroup analysis: trials that included MDD compared to no MDD, Outcome 1 Clinical Global Impressions ‐ Improvement (CGI‐I) or similar scale: no. of responders (acute phase).
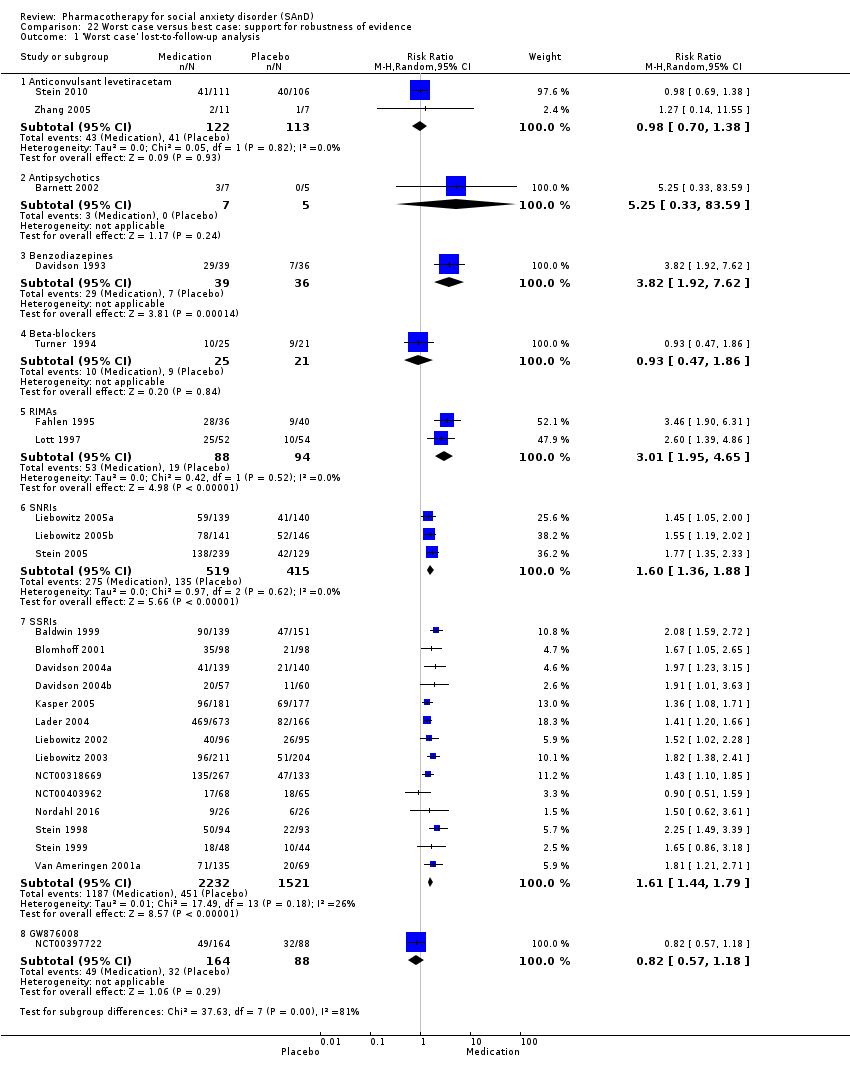
Comparison 22 Worst case versus best case: support for robustness of evidence, Outcome 1 'Worst case' lost‐to‐follow‐up analysis.

Comparison 22 Worst case versus best case: support for robustness of evidence, Outcome 2 'Best case' lost‐to‐follow‐up analysis.
| Comparison 1: 5HT1A partial agonists versus placebo for social anxiety disorder (SAnD) | ||||||
| Patient or population: adults with SAnD | ||||||
| Outcomes | Illustrative comparative risks* (95% CI) | Relative effect | No. of participants | Quality of the evidence | Comments | |
| Assumed risk | Corresponding risk | |||||
| With placebo | With 5HT1A partial agonists | |||||
| Global Impressions scale change item (CGI‐I or similar): no. of responders (acute phase) | Study population | RR 1.00 | 30 | ⊕⊝⊝⊝ | There was no evidence of an effect on the number of participants in the 5HT1A partial agonist group compared to the placebo group who responded 'Very Much Improved' or 'Much Improved' on the CGI‐I scale (P = 1.00). | |
| 67 per 1000 | 67 per 1000 | |||||
| Moderate | ||||||
| 67 per 1000 | 67 per 1000 | |||||
| Dropouts due to adverse events (acute phase) | Study population | RR 3.00 | 30 | ⊕⊝⊝⊝ | Dropout rates due to adverse events were low in the 5HT1A partial agonist group (1/30, 3%). No participants withdrew from the placebo group. | |
| 0 per 1000 | 0 per 1000 | |||||
| Moderate | ||||||
| 0 per 1000 | 0 per 1000 | |||||
| Reduction of of anxiety symptoms ‐ Clinician‐rated: LSAS avoidance subscale | The mean anxiety score for the control group was 24.3 | The mean reduction of anxiety symptoms (clinician‐rated: LSAS avoidance) in the intervention groups was 1.4 points lower (11.61 lower to 8.81 higher) | 30 | ⊕⊝⊝⊝ | The mean LSAS avoidance anxiety score for the 5HT1A partial agonist intervention group was 22.9 which suggests 'low' social phobia. | |
| *The basis for the assumed risk (e.g. the median control group risk across studies) is provided in footnotes. The corresponding risk (and its 95% confidence interval) is based on the assumed risk in the comparison group and the relative effect of the intervention (and its 95% CI). | ||||||
| GRADE Working Group grades of evidence | ||||||
| aDowngraded one level due to serious risk of bias (concerns with randomisation procedures). | ||||||
| Comparison 2: anticonvulsants/GABAs versus placebo for social anxiety disorder (SAnD) | ||||||
| Patient or population: adults with SAnD | ||||||
| Outcomes | Illustrative comparative risks* (95% CI) | Relative effect | No. of participants | Quality of the evidence | Comments | |
| Assumed risk | Corresponding risk | |||||
| With placebo | With anticonvulsants/GABAs | |||||
| Global Impressions scale change item (CGI‐I or similar): no. of responders (acute phase) | Study population | RR 1.60 | 532 | ⊕⊕⊕⊝ | There was evidence of benefit on the number of participants with SAnD who responded to treatment (P = 0.004). A RR score greater than 1 and 95% CI that does not overlap with 1 indicates that there were a statistically significantly greater number of people in the anticonvulsant/GABA groups compared to the placebo groups who responded 'Very Much Improved' or 'Much Improved' on the CGI‐I scale. | |
| 221 per 1000 | 353 per 1000 | |||||
| Moderate | ||||||
| 217 per 1000 | 347 per 1000 | |||||
| Dropouts due to adverse events (acute phase) | Study population | RR 2.90 | 532 | ⊕⊝⊝⊝ | Dropout rates due to adverse events were high in the anticonvulsant/GABA groups (64/369, 17%) relative to placebo (9/163, 6%). | |
| 55 per 1000 | 160 per 1000 | |||||
| Moderate | ||||||
| 87 per 1000 | 252 per 1000 | |||||
| Reduction of of anxiety symptoms ‐ Clinician‐rated: LSAS total score | The mean anxiety score for the control group was 71.8 | The mean reduction of anxiety symptoms (clinician‐rated: LSAS total score) in the intervention groups was 11.50 lower | 69 | ⊕⊕⊝⊝ | The mean LSAS total anxiety score for the anticonvulsant/GABA intervention group was 60.3 which suggests 'moderate' social phobia. | |
| Reduction of of anxiety symptoms ‐ Clinician‐rated: LSAS avoidance subscale | The mean anxiety score for the control group was 33.9 | The mean reduction of anxiety symptoms (clinician‐rated: LSAS avoidance) in the intervention groups was 4.60 points lower (11.88 lower to 2.68 higher) | 69 | ⊕⊕⊝⊝ | The mean LSAS avoidance anxiety score for the anticonvulsant/GABA intervention group was 29.3 which suggests 'low' social phobia. | |
| Reduction of of anxiety symptoms ‐ Clinician‐rated: LSAS fear subscale | The mean anxiety score for the control group was 37.9 | The mean reduction of anxiety symptoms (clinician‐rated: LSAS fear) in the intervention groups was 6.90 points lower (13.65 lower to 0.15 lower) | 69 | ⊕⊕⊝⊝ | The mean LSAS fear anxiety score for the anticonvulsant/GABA intervention group was 31.0 which suggests 'low' social phobia. | |
| *The basis for the assumed risk (e.g. the median control group risk across studies) is provided in footnotes. The corresponding risk (and its 95% confidence interval) is based on the assumed risk in the comparison group and the relative effect of the intervention (and its 95% CI). | ||||||
| GRADE Working Group grades of evidence | ||||||
| aDowngraded one level due to serious risk of bias (concerns with randomisation procedures). | ||||||
| Comparison 3: levetiracetam versus placebo for social anxiety disorder (SAnD) | ||||||
| Patient or population: adults with SAnD | ||||||
| Outcomes | Illustrative comparative risks* (95% CI) | Relative effect | No. of participants | Quality of the evidence | Comments | |
| Assumed risk | Corresponding risk | |||||
| With placebo | Wtih levetiracetam | |||||
| Global Impressions scale change item (CGI‐I or similar): no. of responders (acute phase) | Study population | RR 0.98 | 228 | ⊕⊕⊕⊝ | There was no evidence of an effect on the number of participants in the anticonvulsant levetiracetam groups compared to the placebo groups who responded 'Very Much Improved' or 'Much Improved' on the CGI‐I scale (P = 0.90). | |
| 373 per 1000 | 365 per 1000 | |||||
| Moderate | ||||||
| 266 per 1000 | 261 per 1000 | |||||
| Dropouts due to adverse events (acute phase) | Study population | RR 2.00 | 235 | ⊕⊝⊝⊝ | The proportion of dropouts due to adverse events was high in participants receiving the anticonvulsant levetiracetam (15/122, 12%) relative to placebo (6/113, 5%). There was no evidence of a difference between the number of participants that dropped out due to adverse events (P = 0.14). | |
| 53 per 1000 | 106 per 1000 | |||||
| Moderate | ||||||
| 28 per 1000 | 56 per 1000 | |||||
| Reduction of of anxiety symptoms ‐ Clinician‐rated: LSAS total score | The mean anxiety score ranged across control groups from 62.4 to 75.4 | The mean reduction of anxiety symptoms (clinician‐rated: LSAS total score) in the intervention groups was 0.24 points lower (15.69 lower to 15.21 higher) | 228 | ⊕⊝⊝⊝ | The mean LSAS total anxiety score for the anticonvulsant levetiracetam intervention groups ranged from 55 to 65 which suggests 'moderate' social phobia. | |
| Reduction of of anxiety symptoms ‐ Clinician‐rated: LSAS avoidance subscale | The mean anxiety score for the control group was 36.71 | The mean reduction of anxiety symptoms (clinician‐rated: LSAS avoidance) in the intervention groups was 9.15 points lower | 16 | ⊕⊝⊝⊝ | The mean LSAS avoidance anxiety score for the anticonvulsant levetiracetam intervention group was 27.56 which suggests 'low' social phobia. | |
| Reduction of of anxiety symptoms ‐ Clinician‐rated: LSAS fear subscale | The mean anxiety score for the control group was 38.71 | The mean reduction of anxiety symptoms (clinician‐rated: LSAS fear) in the intervention groups was | 16 | ⊕⊝⊝⊝ | The mean LSAS fear anxiety score for the anticonvulsant levetiracetam intervention group was 30.0 which suggests 'low' social phobia. | |
| *The basis for the assumed risk (e.g. the median control group risk across studies) is provided in footnotes. The corresponding risk (and its 95% confidence interval) is based on the assumed risk in the comparison group and the relative effect of the intervention (and its 95% CI). | ||||||
| GRADE Working Group grades of evidence | ||||||
| aDowngraded one level due to serious risk of bias (concerns with randomisation procedures). | ||||||
| Comparison 4: antipsychotics versus placebo for social anxiety disorder (SAnD) | ||||||
| Patient or population: adults with SAnD | ||||||
| Outcomes | Illustrative comparative risks* (95% CI) | Relative effect | No. of participants | Quality of the evidence | Comments | |
| Assumed risk | Corresponding risk | |||||
| With placebo | With antipsychotics | |||||
| Global Impressions scale change item (CGI‐I or similar): no. of responders (acute phase) | Study population | RR 7.00 | 10 | ⊕⊝⊝⊝ | There was no evidence of an effect on the number of participants in the antipsychotic group compared to the placebo group who responded 'Very Much Improved' or 'Much Improved' on the CGI‐I scale (P = 0.16). | |
| 0 per 1000 | 0 per 1000 | |||||
| Moderate | ||||||
| 0 per 1000 | 0 per 1000 | |||||
| Dropouts due to adverse events (acute phase) | Study population | RR 0.71 | 12 | ⊕⊝⊝⊝ | There was no difference on the number of participants who withdrew due to adverse events (P = 0.79). | |
| 200 per 1000 | 142 per 1000 | |||||
| Moderate | ||||||
| 200 per 1000 | 142 per 1000 | |||||
| Reduction of of anxiety symptoms ‐ Clinician‐rated: LSAS total score | The mean anxiety score for the control group was 86.0 | The mean reduction of anxiety symptoms (clinician‐rated: LSAS total score) in the intervention groups was 37.80 points lower | — | 9 | ⊕⊝⊝⊝ | The mean LSAS total anxiety score for the antipsychotic intervention group was 48.2 which suggests 'low' social phobia. |
| *The basis for the assumed risk (e.g. the median control group risk across studies) is provided in footnotes. The corresponding risk (and its 95% confidence interval) is based on the assumed risk in the comparison group and the relative effect of the intervention (and its 95% CI). | ||||||
| GRADE Working Group grades of evidence | ||||||
| aDowngraded one level due to serious risk of bias (concerns with randomisation procedures). | ||||||
| Comparison 5: benzodiazepines versus placebo for social anxiety disorder (SAnD) | ||||||
| Patient or population: adults with SAnD | ||||||
| Outcomes | Illustrative comparative risks* (95% CI) | Relative effect | No. of participants | Quality of the evidence | Comments | |
| Assumed risk | Corresponding risk | |||||
| With placebo | With benzodiazepines | |||||
| Global Impressions scale change item (CGI‐I or similar): no. of responders (acute phase) | Study population | RR 4.03 | 132 | ⊕⊕⊝⊝ | There was evidence of a large effect on the number of participants with SAnD who responded to treatment (P < 0.00001). A RR score greater than 1 and 95% CI that does not overlap with 1 indicates that there were a statistically significantly greater number of people in the benzodiazepine groups compared to the placebo groups who responded 'Very Much Improved' or 'Much Improved' on the CGI‐I scale. | |
| 200 per 1000 | 806 per 1000 | |||||
| Moderate | ||||||
| 200 per 1000 | 806 per 1000 | |||||
| Relapse rate ‐ no. relapsed | Study population | RR 0.12 | 36 | ⊕⊕⊝⊝ | There was no evidence on the number of treatment responders who subsequently relapsed (P = 0.15). | |
| 211 per 1000 | 25 per 1000 | |||||
| Moderate | ||||||
| 211 per 1000 | 25 per 1000 | |||||
| Dropouts due to adverse events (acute phase) | Study population | RR 1.68 | 96 | ⊕⊝⊝⊝ | Dropout rates due to adverse events were low in the benzodiazepine groups (2/47; 4%) and did not differ from the placebo groups (P = 0.62). | |
| 20 per 1000 | 34 per 1000 | |||||
| Moderate | ||||||
| 17 per 1000 | 29 per 1000 | |||||
| Reduction of of anxiety symptoms ‐ Clinician‐rated: LSAS total score | The mean anxiety score ranged across control groups from 61.7 to 82.2 | The mean reduction of anxiety symptoms (clinician‐rated: LSAS total score) in the intervention groups was 39.75 points lower | 135 | ⊕⊝⊝⊝ | The mean LSAS total anxiety score for the benzodiazepine intervention groups ranged from 26.6 to 38.1 which suggests 'low' social phobia. | |
| Reduction of of anxiety symptoms ‐ Clinician‐rated: LSAS avoidance subscale | The mean anxiety score for the control group was 30.2 | The mean reduction of anxiety symptoms (clinician‐rated: LSAS avoidance) in the intervention groups was 10.40 points lower (16.08 lower to 4.72 lower) | 75 | ⊕⊕⊝⊝ | The mean LSAS avoidance anxiety score for the benzodiazepine intervention group was 19.8 which suggests 'low' social phobia. | |
| Reduction of of anxiety symptoms ‐ Clinician‐rated: LSAS fear subscale | The mean anxiety score for the control group was 31.9 | The mean reduction of anxiety symptoms (clinician‐rated: LSAS fear) in the intervention groups was 10.80 points lower (16.62 lower to 4.98 lower) | 75 | ⊕⊕⊝⊝ | The mean LSAS fear anxiety score for the benzodiazepine intervention group was 21.1 which suggests 'low' social phobia. | |
| *The basis for the assumed risk (e.g. the median control group risk across studies) is provided in footnotes. The corresponding risk (and its 95% confidence interval) is based on the assumed risk in the comparison group and the relative effect of the intervention (and its 95% CI). | ||||||
| GRADE Working Group grades of evidence | ||||||
| aDowngraded one level due to serious risk of bias (concerns with randomisation procedures). | ||||||
| Comparison 6: beta‐blockers versus placebo for social anxiety disorder (SAnD) | ||||||
| Patient or population: adults with SAnD | ||||||
| Outcomes | Illustrative comparative risks* (95% CI) | Relative effect | No. of participants | Quality of the evidence | Comments | |
| Assumed risk | Corresponding risk | |||||
| With placebo | With beta‐blockers | |||||
| Global Impressions scale change item (CGI‐I or similar): no. of responders (acute phase) | Study population | RR 1.09 | 97 | ⊕⊝⊝⊝ | There was no evidence of an effect on the number of participants in the beta‐blocker groups compared to the placebo groups who responded 'Very Much Improved' or 'Much Improved' on the CGI‐I scale (P = 0.75). | |
| 312 per 1000 | 341 per 1000 | |||||
| Moderate | ||||||
| 332 per 1000 | 362 per 1000 | |||||
| *The basis for the assumed risk (e.g. the median control group risk across studies) is provided in footnotes. The corresponding risk (and its 95% confidence interval) is based on the assumed risk in the comparison group and the relative effect of the intervention (and its 95% CI). | ||||||
| GRADE Working Group grades of evidence | ||||||
| aDowngraded one level due to serious risk of bias (concerns with randomisation procedures). | ||||||
| Comparison 7: MAOIs versus placebo for social anxiety disorder (SAnD) | ||||||
| Patient or population: adults with SAnD | ||||||
| Outcomes | Illustrative comparative risks* (95% CI) | Relative effect | No. of participants | Quality of the evidence | Comments | |
| Assumed risk | Corresponding risk | |||||
| With placebo | With MAOIs | |||||
| Global Impressions scale change item (CGI‐I or similar): no. of responders (acute phase) | Study population | RR 2.36 | 235 | ⊕⊕⊝⊝ | There was evidence of an effect on the number of participants with SAnD who responded to treatment (P = 0.0003). A RR score greater than 1 and 95% CI that does not overlap with 1 indicates that there were a statistically significantly greater number of people in the MAOI groups compared to the placebo groups who responded 'Very Much Improved' or 'Much Improved' on the CGI‐I scale. | |
| 263 per 1000 | 621 per 1000 | |||||
| Moderate | ||||||
| 274 per 1000 | 647 per 1000 | |||||
| Reduction of of anxiety symptoms ‐ Clinician‐rated: LSAS total score | The mean anxiety score ranged across control groups from 4.05 to 63.29 | The mean reduction of anxiety symptoms (clinician‐rated: LSAS total score) in the intervention groups was 16.39 points lower | 218 | ⊕⊝⊝⊝ | The mean LSAS total anxiety score for the MAOI intervention groups ranged from 14.0 to 47.8 which suggests 'low' social phobia. | |
| Reduction of of anxiety symptoms ‐ Clinician‐rated: LSAS avoidance subscale | The mean anxiety score for the control group was 24.54 | The mean reduction of anxiety symptoms (clinician‐rated: LSAS avoidance) in the intervention groups was 5.42 points lower | 51 | ⊕⊝⊝⊝ | The mean LSAS avoidance anxiety score for the MAOI intervention group was 19.12 which suggests 'low' social phobia. | |
| Reduction of of anxiety symptoms ‐ Clinician‐rated: LSAS fear subscale | The mean anxiety score for the control group was 27.31 | The mean reduction of of anxiety symptoms (clinician‐rated: LSAS fear) in the intervention groups was 5.23 points lower (13.97 lower to 3.51 higher) | 51 | ⊕⊝⊝⊝ | The mean LSAS fear anxiety score for the MAOI intervention group was 22.08 which suggests 'low' social phobia. | |
| Clinical Global Impressions scale change item (CGI‐I):no. of responders (long term) Post‐treatment: 6 months | Study population | RR 1.84 | 113 | ⊕⊝⊝⊝ | There was data indicating greater efficacy over the long term on the number of participants with SAnD who responded to treatment (P = 0.04). A RR score greater than 1 and 95% CI that does not overlap with 1 indicates that there were a statistically significantly greater number of people in the MAOI groups compared to the placebo groups who responded 'Very Much Improved' or 'Much Improved' on the CGI‐I scale. | |
| 264 per 1000 | 486 per 1000 | |||||
| Moderate | ||||||
| 263 per 1000 | 484 per 1000 | |||||
| *The basis for the assumed risk (e.g. the median control group risk across studies) is provided in footnotes. The corresponding risk (and its 95% confidence interval) is based on the assumed risk in the comparison group and the relative effect of the intervention (and its 95% CI). | ||||||
| GRADE Working Group grades of evidence | ||||||
| aDowngraded one level due to serious risk of bias (concerns with randomisation procedures). | ||||||
| Comparison 8: NARIs versus placebo for social anxiety disorder (SAnD) | ||||||
| Patient or population: adults with SAnD | ||||||
| Outcomes | Illustrative comparative risks* (95% CI) | Relative effect | No. of participants | Quality of the evidence | Comments | |
| Assumed risk | Corresponding risk | |||||
| With placebo | With NARIs | |||||
| Global Impressions scale change item (CGI‐I or similar): no. of responders (acute phase) | Study population | RR 0.70 | 27 | ⊕⊝⊝⊝ | There was no evidence of an effect on the number of participants in the NARI group compared to the placebo group who responded 'Very Much Improved' or 'Much Improved' on the CGI‐I scale (P = 0.58). | |
| 308 per 1000 | 215 per 1000 | |||||
| Moderate | ||||||
| 308 per 1000 | 216 per 1000 | |||||
| Dropouts due to adverse events (acute phase) | Study population | RR 2.80 | 27 | ⊕⊝⊝⊝ | Only 1 of 14 (7%) participants withdrew during 10 weeks of NARI treatment. There was no evidence for a difference in the number of participants who withdrew due to adverse events (P = 0.52). | |
| 0 per 1000 | 0 per 1000 | |||||
| Moderate | ||||||
| 0 per 1000 | 0 per 1000 | |||||
| Reduction of of anxiety symptoms ‐ Clinician‐rated: LSAS total score | The mean anxiety score for the control group was 70.8 | The mean reduction of anxiety symptoms (clinician‐rated: LSAS total score) in the intervention groups was 2.60 points higher (15.43 lower to 20.63 higher) | 26 | ⊕⊝⊝⊝ | The mean LSAS total anxiety score for the NARI intervention group was 73.4 which suggests 'marked' social phobia. | |
| *The basis for the assumed risk (e.g. the median control group risk across studies) is provided in footnotes. The corresponding risk (and its 95% confidence interval) is based on the assumed risk in the comparison group and the relative effect of the intervention (and its 95% CI). | ||||||
| GRADE Working Group grades of evidence | ||||||
| aDowngraded one level due to serious risk of bias (concerns with randomisation procedures). | ||||||
| Comparison 9: NaSSAs compared to placebo for social anxiety disorder (SAnD) | ||||||
| Patient or population: adults with SAnD | ||||||
| Outcomes | Illustrative comparative risks* (95% CI) | Relative effect | No. of participants | Quality of the evidence | Comments | |
| Assumed risk | Corresponding risk | |||||
| With placebo | With NaSSAs | |||||
| Global Impressions scale change item (CGI‐I or similar): no. of responders (acute phase) | Study population | RR 1.00 | 60 | ⊕⊝⊝⊝ | An equal number of participants (4/30, 13%) responded to treatment in both the NaSSA and placebo groups, however this difference was not statistically significant (P = 1.00). | |
| 133 per 1000 | 133 per 1000 | |||||
| Moderate | ||||||
| 133 per 1000 | 133 per 1000 | |||||
| Dropouts due to adverse events (acute phase) | Study population | RR 5.00 | 60 | ⊕⊝⊝⊝ | A small proportion of participants receiving NaSSAs dropped out due to adverse events (2/30, 7%). Although, the difference was not statistically significant (P = 0.29). | |
| 0 per 1000 | 0 per 1000 | |||||
| Moderate | ||||||
| 0 per 1000 | 0 per 1000 | |||||
| Reduction of of anxiety symptoms ‐ Clinician‐rated: LSAS total score | The mean anxiety score ranged across control groups from 62.4 to 67.1 | The mean reduction of anxiety symptoms (clinician‐rated: LSAS total score) in the intervention groups was 15.37 points lower | 126 | ⊕⊝⊝⊝ | The mean LSAS total anxiety score for the NaSSA intervention groups ranged from 46.3 to 54.8 which suggests 'low' social phobia. | |
| Reduction of of anxiety symptoms ‐ Clinician‐rated: LSAS avoidance subscale | The mean anxiety score for the control group was 28.9 | The mean reduction of anxiety symptoms (clinician‐rated: LSAS avoidance) in the intervention groups was 3.90 points lower (9.90 lower to 2.10 higher) | 60 | ⊕⊕⊝⊝ | The mean LSAS avoidance anxiety score for the NaSSA intervention group was 25.0 which suggests 'low' social phobia. | |
| Reduction of of anxiety symptoms ‐ Clinician‐rated: LSAS fear subscale | The mean anxiety score for the control group was 33.5 | The mean reduction of anxiety symptoms (clinician‐rated: LSAS fear) in the intervention groups was 3.70 points lower (9.42 lower to 2.02 higher) | 60 | ⊕⊕⊝⊝ | The mean LSAS fear anxiety score for the NaSSA intervention group was 29.8 which suggests 'low' social phobia. | |
| *The basis for the assumed risk (e.g. the median control group risk across studies) is provided in footnotes. The corresponding risk (and its 95% confidence interval) is based on the assumed risk in the comparison group and the relative effect of the intervention (and its 95% CI). | ||||||
| GRADE Working Group grades of evidence | ||||||
| aDowngraded one level due to serious risk of bias (concerns with randomisation procedures). | ||||||
| Comparison 10: RIMAs versus placebo for social anxiety disorder (SAnD) | ||||||
| Patient or population: adults with SAnD | ||||||
| Outcomes | Illustrative comparative risks* (95% CI) | Relative effect | No. of participants | Quality of the evidence | Comments | |
| Assumed risk | Corresponding risk | |||||
| With placebo | With RIMAs | |||||
| Global Impressions scale change item (CGI‐I or similar): no. of responders (acute phase) | Study population | RR 1.83 | 1270 | ⊕⊕⊝⊝ | There was evidence of benefit on the number of participants with SAnD who responded to treatment (P = 0.0003). A RR score greater than 1 and 95% CI that does not overlap with 1 indicates that there were a statistically significantly greater number of people in the RIMA groups compared to the placebo groups who responded 'Very Much Improved' or 'Much Improved' on the CGI‐I scale. | |
| 254 per 1000 | 465 per 1000 | |||||
| Moderate | ||||||
| 207 per 1000 | 379 per 1000 | |||||
| Dropouts due to adverse events (acute phase) | Study population | RR 1.42 | 1305 | ⊕⊝⊝⊝ | Dropout rates due to adverse events were low in the RIMA groups and equivalent to those observed in the placebo groups (72/83; 9%). | |
| 49 per 1000 | 69 per 1000 | |||||
| Moderate | ||||||
| 32 per 1000 | 45 per 1000 | |||||
| Reduction of of anxiety symptoms ‐ Clinician‐rated: LSAS total score | The mean anxiety score ranged across control groups from 54.4 to 79.3 | The mean reduction of anxiety symptoms (clinician‐rated: LSAS total score) in the intervention groups was 12.17 points lower (23.51 lower to 0.84 lower) | 1163 | ⊕⊝⊝⊝ | The mean LSAS total anxiety score for the RIMA intervention groups ranged from 27.0 to 62.6 which suggests low to 'moderate' social phobia. | |
| Reduction of of anxiety symptoms ‐ Clinician‐rated: LSAS avoidance subscale | The mean anxiety score ranged across control groups from 23.3 to 39.2 | The mean reduction of anxiety symptoms (clinician‐rated: LSAS avoidance) in the intervention groups was | 695 | ⊕⊕⊝⊝ | The mean LSAS avoidance anxiety score for the RIMA intervention groups ranged from 15.3 to 30.7 which suggests 'low' social phobia. | |
| Reduction of of anxiety symptoms ‐ Clinician‐rated: LSAS fear subscale | The mean anxiety score ranged across control groups from 29.4 to 40.1 | The mean reduction of anxiety symptoms (clinician‐rated: LSAS fear) in the intervention groups was 5.40 points lower (8.92 lower to 1.88 lower) | 724 | ⊕⊝⊝⊝ | The mean LSAS fear anxiety score for the RIMA intervention groups ranged from 19.1 to 33.3 which suggests 'low' social phobia. | |
| Clinical Global Impressions scale change item (CGI‐I): no. of responders (long term) Post‐treatment: 1‐15 months | Study population | RR 1.50 | 90 | ⊕⊕⊕⊝ | There was evidence of a long‐term effect on treatment efficacy in participants with SAnD who responded to treatment (P = 0.006). A RR score greater than 1 and 95% CI that does not overlap with 1 indicates that there were a statistically significantly greater number of people in the RIMA group compared to the placebo group who responded 'Very Much Improved' or 'Much Improved' on the CGI‐I scale. | |
| 575 per 1000 | 862 per 1000 | |||||
| Moderate | ||||||
| 575 per 1000 | 862 per 1000 | |||||
| *The basis for the assumed risk (e.g. the median control group risk across studies) is provided in footnotes. The corresponding risk (and its 95% confidence interval) is based on the assumed risk in the comparison group and the relative effect of the intervention (and its 95% CI). | ||||||
| GRADE Working Group grades of evidence | ||||||
| aDowngraded one level due to serious risk of bias (concerns with randomisation procedures). | ||||||
| Comparison 11: SARIs versus placebo for social anxiety disorder (SAnD) | ||||||
| Patient or population: adults with SAnD | ||||||
| Outcomes | Illustrative comparative risks* (95% CI) | Relative effect | No. of participants | Quality of the evidence | Comments | |
| Assumed risk | Corresponding risk | |||||
| With placebo | With SARIs | |||||
| Reduction of of anxiety symptoms ‐ Clinician‐rated: LSAS total score | The mean anxiety score for the control group was 71.2 | The mean reduction of anxiety symptoms (clinician‐rated: LSAS total score) in the intervention groups was 6.10 points lower (16.55 lower to 4.35 higher) | 102 | ⊕⊝⊝⊝ | The mean LSAS total anxiety score for the SARI intervention group was 65.1 which suggests 'marked' social phobia. | |
| *The basis for the assumed risk (e.g. the median control group risk across studies) is provided in footnotes. The corresponding risk (and its 95% confidence interval) is based on the assumed risk in the comparison group and the relative effect of the intervention (and its 95% CI). | ||||||
| GRADE Working Group grades of evidence | ||||||
| aDowngraded one level due to serious risk of bias (concerns with randomisation procedures). | ||||||
| Comparison 12: SNRIs compared to placebo for social anxiety disorder (SAnD) | ||||||
| Patient or population: adults with SAnD | ||||||
| Outcomes | Illustrative comparative risks* (95% CI) | Relative effect | No. of participants | Quality of the evidence | Comments | |
| Assumed risk | Corresponding risk | |||||
| With placebo | With SNRIs | |||||
| Global Impressions scale change item (CGI‐I or similar): no. of responders (acute phase) | Study population | RR 1.30 | 1173 | ⊕⊕⊝⊝ | There was no evidence of an effect on the number of participants in the SNRI groups compared to the placebo groups who responded 'Very Much Improved' or 'Much Improved' on the CGI‐I scale (P = 0.22). | |
| 374 per 1000 | 486 per 1000 | |||||
| Moderate | ||||||
| 347 per 1000 | 451 per 1000 | |||||
| Dropouts due to adverse events (acute phase) | Study population | RR 3.23 | 1213 | ⊕⊕⊕⊝ | The proportion of dropouts due to adverse events was more than three times as high in participants receiving SNRIs (109/663, 16%) compared to placebo (27/550, 5%), a statistically significant difference (P < 0.00001). | |
| 49 per 1000 | 159 per 1000 | |||||
| Moderate | ||||||
| 49 per 1000 | 158 per 1000 | |||||
| Reduction of of anxiety symptoms ‐ Clinician‐rated: LSAS total score | The mean anxiety score ranged across control groups from ‐22.2 to 66.0 | The mean reduction of anxiety symptoms (clinician‐rated: LSAS total score) in the intervention groups was 11.91 points lower (16.06 lower to 7.76 lower) | 902 | ⊕⊕⊕⊝ | The mean LSAS total anxiety score for the SNRI intervention groups ranged from ‐35.0 to 57.7 which suggests 'low' to 'moderate' social phobia. | |
| Reduction of of anxiety symptoms ‐ Clinician‐rated: LSAS avoidance subscale | The mean anxiety score for the control group was 32.1 | The mean reduction of anxiety symptoms (clinician‐rated: LSAS avoidance) in the intervention groups was 4.30 points lower (8.14 lower to 0.46 lower) | 261 | ⊕⊕⊝⊝ | The mean LSAS avoidance anxiety score for the SNRI intervention group was 27.8 which suggests 'low' social phobia. | |
| Reduction of of anxiety symptoms ‐ Clinician‐rated: LSAS fear subscale | The mean anxiety score for the control group was 33.9 | The mean reduction of anxiety symptoms (clinician‐rated: LSAS fear) in the intervention groups was 4.00 points lower (7.68 lower to 0.32 lower) | 261 | ⊕⊕⊝⊝ | The mean LSAS fear anxiety score for the SNRI intervention group was 29.9 which suggests 'low' social phobia. | |
| *The basis for the assumed risk (e.g. the median control group risk across studies) is provided in footnotes. The corresponding risk (and its 95% confidence interval) is based on the assumed risk in the comparison group and the relative effect of the intervention (and its 95% CI). | ||||||
| GRADE Working Group grades of evidence | ||||||
| aDowngraded one level due to serious risk of bias (concerns with randomisation procedures). | ||||||
| Comparison 13: SSRIs versus placebo for social anxiety disorder (SAnD) | ||||||
| Patient or population: adults with SAnD | ||||||
| Outcomes | Illustrative comparative risks* (95% CI) | Relative effect | No. of participants | Quality of the evidence | Comments | |
| Assumed risk | Corresponding risk | |||||
| With placebo | With SSRIs | |||||
| Global Impressions scale change item (CGI‐I or similar): no. of responders (acute phase) | Study population | RR 1.65 | 4984 | ⊕⊝⊝⊝ | There was evidence of benefit on the number of participants with SAnD who responded to treatment (P < 0.00001). A RR score greater than 1 and 95% CI that does not overlap with 1 indicates that there were a statistically significantly greater number of people in the SSRI groups compared to the placebo groups who responded 'Very Much Improved' or 'Much Improved' on the CGI‐I scale. | |
| 317 per 1000 | 523 per 1000 | |||||
| Moderate | ||||||
| 290 per 1000 | 476 per 1000 | |||||
| Relapse rate ‐ no. relapsed | Study population | RR 0.34 | 389 | ⊕⊕⊕⊝ | There was evidence that SSRIs prevented relapse compared to placebo (P < 0.00001). | |
| 397 per 1000 | 135 per 1000 | |||||
| Moderate | ||||||
| 391 per 1000 | 133 per 1000 | |||||
| Dropouts due to adverse events (acute phase) | Study population | RR 2.59 | 5131 | ⊕⊕⊝⊝ | The proportion of dropouts due to adverse events was approximately three times higher amongst participants receiving SSRIs compared to placebo ((P < 0.00001). | |
| 40 per 1000 | 105 per 1000 | |||||
| Moderate | ||||||
| 37 per 1000 | 96 per 1000 | |||||
| Reduction of of anxiety symptoms ‐ Clinician‐rated: LSAS total score | The mean anxiety score ranged across control groups from ‐7.8 to 69.88 | The mean reduction of anxiety symptoms (clinician‐rated: LSAS total score) in the intervention groups was 10.14 points lower (14.05 to 6.22 lower) | 1990 | ⊕⊕⊝⊝ | The mean LSAS total anxiety score for the SSRI intervention groups ranged from 14.7 to 60.3 which suggests 'low' to 'moderate' social phobia. | |
| Reduction of of anxiety symptoms ‐ Clinician‐rated: LSAS avoidance subscale | The mean anxiety score ranged across control groups from 24.2 to 34.8 | The mean reduction of anxiety symptoms (clinician‐rated: LSAS avoidance) in the intervention groups was 7.01 points lower (10.21 to 3.80 lower) | 1173 | ⊕⊕⊝⊝ | The mean LSAS avoidance anxiety score for the SSRI intervention groups ranged from 17.09 to 26.11 which suggests 'low' social phobia. | |
| Reduction of of anxiety symptoms ‐ Clinician‐rated: LSAS fear subscale | The mean anxiety score ranged across control groups from 29.83 to 37.4 | The mean reduction of anxiety symptoms (clinician‐rated: LSAS fear) in the intervention groups was 7.28 points lower (10.86 to 3.71 lower) | 1173 | ⊕⊕⊝⊝ | The mean LSAS fear anxiety score for the SSRI intervention groups ranged from 19.84 to 32.79 which suggests 'low' social phobia. | |
| Clinical Global Impressions scale change item (CGI‐I): no. of responders (long term) Post‐treatment: 1‐4 months | Study population | RR 1.27 | 806 | ⊕⊕⊝⊝ | There was evidence for a response to long‐term treatment compared to placebo in participants with SAnD (P = 0.007). A RR score greater than 1 and 95% CI that does not overlap with 1 indicates that there were a statistically significantly greater number of people in the SSRI groups compared to the placebo groups who responded 'Very Much Improved' or 'Much Improved' on the CGI‐I scale. | |
| 579 per 1000 | 735 per 1000 | |||||
| Moderate | ||||||
| 584 per 1000 | 742 per 1000 | |||||
| Dropouts due to adverse events (long term) Post‐treatment: 1‐4 months | Study population | RR 1.17 | 1274 | ⊕⊝⊝⊝ | We found no difference in dropout rates due to adverse events between the SSRI and control groups (P = 0.76). | |
| 52 per 1000 | 61 per 1000 | |||||
| Moderate | ||||||
| 50 per 1000 | 58 per 1000 | |||||
| *The basis for the assumed risk (e.g. the median control group risk across studies) is provided in footnotes. The corresponding risk (and its 95% confidence interval) is based on the assumed risk in the comparison group and the relative effect of the intervention (and its 95% CI). | ||||||
| GRADE Working Group grades of evidence | ||||||
| aDowngraded one level due to serious risk of bias (concerns with randomisation procedures). | ||||||
| Comparison 14: GW876008 versus placebo for social anxiety disorder (SAnD) | ||||||
| Patient or population: adults with SAnD | ||||||
| Outcomes | Illustrative comparative risks* (95% CI) | Relative effect | No of Participants | Quality of the evidence | Comments | |
| Assumed risk | Corresponding risk | |||||
| Control | Comparison 14: GW876008 versus placebo | |||||
| Global Impressions scale change item (CGI‐I or similar): no. of responders (acute phase) | Study population | RR 0.83 | 250 | ⊕⊕⊕⊝ | There was no evidence of an effect on the number of participants in the GW876008 group compared to the placebo group who responded 'Very Much Improved' or 'Much Improved' on the CGI‐I scale (P = 0.32). | |
| 364 per 1000 | 302 per 1000 | |||||
| Moderate | ||||||
| 364 per 1000 | 302 per 1000 | |||||
| Dropouts due to adverse events (acute phase) | Study population | RR 2.95 | 252 | ⊕⊕⊝⊝ | The proportion of dropouts due to adverse events was approximately three times higher amongst participants receiving GW876008 (11/164, 7%) compared to placebo (2/88, 2%), though this difference was not statistically significant (P = 0.15). | |
| 23 per 1000 | 67 per 1000 | |||||
| Moderate | ||||||
| 23 per 1000 | 68 per 1000 | |||||
| *The basis for the assumed risk (e.g. the median control group risk across studies) is provided in footnotes. The corresponding risk (and its 95% confidence interval) is based on the assumed risk in the comparison group and the relative effect of the intervention (and its 95% CI). | ||||||
| GRADE Working Group grades of evidence | ||||||
| a Downgraded one level due to serious risk of bias (concerns with randomisation procedures). c Response is defined as the number of participants with SAnD who responded to treatment, as assessed by the CGI‐I or similar. | ||||||
| Comparison 15: NK1 receptor antagonist GR205171 versus placebo for social anxiety disorder (SAnD) | ||||||
| Patient or population: adults with SAnD | ||||||
| Outcomes | Illustrative comparative risks* (95% CI) | Relative effect | No of Participants | Quality of the evidence | Comments | |
| Assumed risk | Corresponding risk | |||||
| Control | Comparison 15: NK1 receptor antagonist GR205171 versus placebo | |||||
| Global Impressions scale change item (CGI‐I or similar): no. of responders (acute phase) | Study population | RR 5 | 24 | ⊕⊝⊝⊝ | There was no evidence of an effect on the number of participants in the NK1 receptor antagonist GR205171 group compared to the placebo group who responded 'Very Much Improved' or 'Much Improved' on the CGI‐I scale (P = 0.11). | |
| 83 per 1000 | 417 per 1000 | |||||
| Moderate | ||||||
| 83 per 1000 | 415 per 1000 | |||||
| Dropouts due to adverse events (acute phase) | See comment | See comment | Not estimable | 24 | ⊕⊕⊕⊝ | No participants withdrew due to adverse events. |
| Reduction of of anxiety symptoms ‐ Clinician‐rated: LSAS total score | The mean anxiety score for the control group was 4.1 | The mean clinician‐rated: liebowitz social anxiety scale (lsas): reduction of anxiety symptoms ‐ lsas total score in the intervention groups was 0.5 points lower (1.35 lower to 0.35 higher) | 24 | ⊕⊝⊝⊝ | The mean LSAS total anxiety score for the NK1 receptor antagonist GR205171 intervention group was 3.6 which suggests 'low' social phobia. | |
| *The basis for the assumed risk (e.g. the median control group risk across studies) is provided in footnotes. The corresponding risk (and its 95% confidence interval) is based on the assumed risk in the comparison group and the relative effect of the intervention (and its 95% CI). | ||||||
| GRADE Working Group grades of evidence | ||||||
| a Downgraded one level due to serious risk of bias (concerns with randomisation procedures). c Response is defined as the number of participants with SAnD who responded to treatment, as assessed by the CGI‐I or similar. | ||||||
| Comparison 16: LY686017 versus placebo for social anxiety disorder (SAnD) | ||||||
| Patient or population: adults with SAnD | ||||||
| Outcomes | Illustrative comparative risks* (95% CI) | Relative effect | No of Participants | Quality of the evidence | Comments | |
| Assumed risk | Corresponding risk | |||||
| Control | Comparison 16: LY686017 versus placebo | |||||
| Reduction of of anxiety symptoms ‐ Clinician‐rated: LSAS total score | The mean anxiety score for the control group was ‐22.59 | The mean clinician‐rated: liebowitz social anxiety scale (lsas): reduction of anxiety symptoms ‐ lsas total score in the intervention groups was 1.8 points higher (6.92 lower to 10.52 higher) | 99 | ⊕⊝⊝⊝ | The mean LSAS total anxiety score for the LY686017 intervention group was ‐20.79 which suggests 'low' social phobia. | |
| *The basis for the assumed risk (e.g. the median control group risk across studies) is provided in footnotes. The corresponding risk (and its 95% confidence interval) is based on the assumed risk in the comparison group and the relative effect of the intervention (and its 95% CI). | ||||||
| GRADE Working Group grades of evidence | ||||||
| a Downgraded two levels due to serious risk of bias (concerns with randomisation procedures). | ||||||
| Outcome or subgroup title | No. of studies | No. of participants | Statistical method | Effect size |
| 1 Clinical Global Impressions ‐ Improvement (CGI‐I) or similar scale (acute phase) Show forest plot | 1 | Risk Ratio (M‐H, Random, 95% CI) | Subtotals only | |
| 1.1 No. of responders | 1 | 30 | Risk Ratio (M‐H, Random, 95% CI) | 1.0 [0.07, 14.55] |
| 2 Adverse events (acute phase) Show forest plot | 1 | Risk Ratio (M‐H, Random, 95% CI) | Subtotals only | |
| 2.1 Dropout rate | 1 | 30 | Risk Ratio (M‐H, Random, 95% CI) | 3.0 [0.13, 68.26] |
| 3 Clinician‐rated: Liebowitz Social Anxiety Scale (LSAS): reduction of anxiety symptoms Show forest plot | 1 | Mean Difference (IV, Random, 95% CI) | Subtotals only | |
| 3.1 LSAS avoidance subscale | 1 | 30 | Mean Difference (IV, Random, 95% CI) | ‐1.40 [‐11.61, 8.81] |
| 4 Clinician‐rated: Hamilton Depression scale (HAM‐D) (or similar scale) Show forest plot | 1 | Mean Difference (IV, Random, 95% CI) | Subtotals only | |
| 4.1 Reduction of depression symptoms | 1 | 27 | Mean Difference (IV, Random, 95% CI) | ‐0.60 [‐2.86, 1.66] |
| 5 All‐cause dropouts (acute phase) Show forest plot | 1 | Risk Ratio (M‐H, Random, 95% CI) | Subtotals only | |
| 5.1 Dropout rate | 1 | 30 | Risk Ratio (M‐H, Random, 95% CI) | 0.14 [0.01, 2.55] |
| Outcome or subgroup title | No. of studies | No. of participants | Statistical method | Effect size |
| 1 Clinical Global Impressions ‐ Improvement (CGI‐I) or similar scale (acute phase) Show forest plot | 3 | Risk Ratio (M‐H, Random, 95% CI) | Subtotals only | |
| 1.1 No. of responders | 3 | 532 | Risk Ratio (M‐H, Random, 95% CI) | 1.60 [1.16, 2.20] |
| 2 Adverse events (acute phase) Show forest plot | 3 | Risk Ratio (M‐H, Random, 95% CI) | Subtotals only | |
| 2.1 Dropout rate | 3 | 532 | Risk Ratio (M‐H, Random, 95% CI) | 2.90 [0.92, 9.14] |
| 3 Clinician‐rated: Liebowitz Social Anxiety Scale (LSAS): reduction of anxiety symptoms Show forest plot | 1 | Mean Difference (IV, Random, 95% CI) | Subtotals only | |
| 3.1 LSAS total score | 1 | 69 | Mean Difference (IV, Random, 95% CI) | ‐11.5 [‐25.20, 2.20] |
| 3.2 LSAS avoidance subscale | 1 | 69 | Mean Difference (IV, Random, 95% CI) | ‐4.60 [‐11.88, 2.68] |
| 3.3 LSAS fear subscale | 1 | 69 | Mean Difference (IV, Random, 95% CI) | ‐6.90 [‐13.65, ‐0.15] |
| 4 Clinician‐rated: Hamilton Depression scale (HAM‐D) (or similar scale) Show forest plot | 1 | Mean Difference (IV, Random, 95% CI) | Subtotals only | |
| 4.1 Reduction of depression symptoms | 1 | 69 | Mean Difference (IV, Random, 95% CI) | ‐2.3 [‐4.78, 0.18] |
| 5 All‐cause dropouts (acute phase) Show forest plot | 3 | Risk Ratio (M‐H, Random, 95% CI) | Subtotals only | |
| 5.1 Dropout rate | 3 | 488 | Risk Ratio (M‐H, Random, 95% CI) | 1.16 [0.78, 1.70] |
| Outcome or subgroup title | No. of studies | No. of participants | Statistical method | Effect size |
| 1 Clinical Global Impressions ‐ Improvement (CGI‐I) or similar scale (acute phase) Show forest plot | 2 | Risk Ratio (M‐H, Random, 95% CI) | Subtotals only | |
| 1.1 No. of responders | 2 | 228 | Risk Ratio (M‐H, Random, 95% CI) | 0.98 [0.70, 1.37] |
| 2 Adverse events (acute phase) Show forest plot | 2 | Risk Ratio (M‐H, Random, 95% CI) | Subtotals only | |
| 2.1 Dropout rate | 2 | 235 | Risk Ratio (M‐H, Random, 95% CI) | 2.00 [0.81, 4.94] |
| 3 Clinician‐rated: Liebowitz Social Anxiety Scale (LSAS): reduction of anxiety symptoms Show forest plot | 2 | Mean Difference (IV, Random, 95% CI) | Subtotals only | |
| 3.1 LSAS total score | 2 | 228 | Mean Difference (IV, Random, 95% CI) | ‐0.24 [‐15.69, 15.21] |
| 3.2 LSAS avoidance subscale | 1 | 16 | Mean Difference (IV, Random, 95% CI) | ‐9.15 [‐26.86, 8.56] |
| 3.3 LSAS fear subscale | 1 | 16 | Mean Difference (IV, Random, 95% CI) | ‐8.71 [‐26.02, 8.60] |
| 4 Clinician‐rated: Hamilton Depression scale (HAM‐D) (or similar scale) Show forest plot | 1 | Mean Difference (IV, Random, 95% CI) | Subtotals only | |
| 4.1 Reduction of depression symptoms | 1 | 212 | Mean Difference (IV, Random, 95% CI) | 0.20 [‐1.33, 1.73] |
| 5 All‐cause dropouts (acute phase) Show forest plot | 2 | Risk Ratio (M‐H, Random, 95% CI) | Subtotals only | |
| 5.1 Dropout rate | 2 | 235 | Risk Ratio (M‐H, Random, 95% CI) | 1.42 [0.30, 6.76] |
| Outcome or subgroup title | No. of studies | No. of participants | Statistical method | Effect size |
| 1 Clinical Global Impressions ‐ Improvement (CGI‐I) or similar scale (acute phase) Show forest plot | 1 | Risk Ratio (M‐H, Random, 95% CI) | Subtotals only | |
| 1.1 No. of responders | 1 | 10 | Risk Ratio (M‐H, Random, 95% CI) | 7.0 [0.45, 108.26] |
| 2 Adverse events (acute phase) Show forest plot | 1 | Risk Ratio (M‐H, Random, 95% CI) | Subtotals only | |
| 2.1 Dropout rate | 1 | 12 | Risk Ratio (M‐H, Random, 95% CI) | 0.71 [0.06, 8.90] |
| 3 Clinician‐rated: Liebowitz Social Anxiety Scale (LSAS): reduction of anxiety symptoms Show forest plot | 1 | Mean Difference (IV, Random, 95% CI) | Subtotals only | |
| 3.1 LSAS total score | 1 | 9 | Mean Difference (IV, Random, 95% CI) | ‐37.8 [‐74.22, ‐1.38] |
| 4 All‐cause dropouts (acute phase) Show forest plot | 1 | Risk Ratio (M‐H, Random, 95% CI) | Subtotals only | |
| 4.1 Dropout rate | 1 | 12 | Risk Ratio (M‐H, Random, 95% CI) | 1.07 [0.27, 4.23] |
| Outcome or subgroup title | No. of studies | No. of participants | Statistical method | Effect size |
| 1 Clinical Global Impressions ‐ Improvement (CGI‐I) or similar scale (acute phase) Show forest plot | 2 | Risk Ratio (M‐H, Random, 95% CI) | Subtotals only | |
| 1.1 No. of responders | 2 | 132 | Risk Ratio (M‐H, Random, 95% CI) | 4.03 [2.45, 6.65] |
| 2 Relapse rate Show forest plot | 1 | Risk Ratio (M‐H, Random, 95% CI) | Subtotals only | |
| 2.1 No. relapsed | 1 | 36 | Risk Ratio (M‐H, Random, 95% CI) | 0.12 [0.01, 2.14] |
| 3 Adverse events (acute phase) Show forest plot | 2 | Risk Ratio (M‐H, Random, 95% CI) | Subtotals only | |
| 3.1 Dropout rate | 2 | 96 | Risk Ratio (M‐H, Random, 95% CI) | 1.68 [0.21, 13.13] |
| 4 Clinician‐rated: Liebowitz Social Anxiety Scale (LSAS): reduction of anxiety symptoms Show forest plot | 2 | Mean Difference (IV, Random, 95% CI) | Subtotals only | |
| 4.1 LSAS total score | 2 | 135 | Mean Difference (IV, Random, 95% CI) | ‐39.75 [‐71.11, ‐8.39] |
| 4.2 LSAS avoidance subscale | 1 | 75 | Mean Difference (IV, Random, 95% CI) | ‐10.40 [‐16.08, ‐4.72] |
| 4.3 LSAS fear subscale | 1 | 75 | Mean Difference (IV, Random, 95% CI) | ‐10.80 [‐16.62, ‐4.98] |
| 5 Clinician‐rated: Hamilton Depression scale (HAM‐D) (or similar scale) Show forest plot | 1 | Mean Difference (IV, Random, 95% CI) | Subtotals only | |
| 5.1 Reduction of depression symptoms | 1 | 75 | Mean Difference (IV, Random, 95% CI) | ‐1.60 [‐3.96, 0.76] |
| 6 Reduction of functional disability Show forest plot | 2 | Mean Difference (IV, Random, 95% CI) | Subtotals only | |
| 6.1 Work subscale | 2 | 135 | Mean Difference (IV, Random, 95% CI) | ‐3.58 [‐6.39, ‐0.78] |
| 6.2 Social subscale | 2 | 135 | Mean Difference (IV, Random, 95% CI) | ‐2.31 [‐3.79, ‐0.83] |
| 6.3 Family subscale | 2 | 135 | Mean Difference (IV, Random, 95% CI) | ‐2.02 [‐4.26, 0.22] |
| 7 All‐cause dropouts (acute phase) Show forest plot | 3 | Risk Ratio (M‐H, Random, 95% CI) | Subtotals only | |
| 7.1 Dropout rate | 3 | 171 | Risk Ratio (M‐H, Random, 95% CI) | 0.79 [0.41, 1.52] |
| Outcome or subgroup title | No. of studies | No. of participants | Statistical method | Effect size |
| 1 Clinical Global Impressions ‐ Improvement (CGI‐I) or similar scale (acute phase) Show forest plot | 2 | Risk Ratio (M‐H, Random, 95% CI) | Subtotals only | |
| 1.1 No. of responders | 2 | 97 | Risk Ratio (M‐H, Random, 95% CI) | 1.09 [0.63, 1.88] |
| 2 Clinician‐rated: Hamilton Depression scale (HAM‐D) (or similar scale) Show forest plot | 1 | Mean Difference (IV, Random, 95% CI) | Subtotals only | |
| 2.1 Reduction of depression symptoms | 1 | 46 | Mean Difference (IV, Random, 95% CI) | 1.82 [‐1.38, 5.02] |
| 3 Reduction of functional disability Show forest plot | 1 | Mean Difference (IV, Random, 95% CI) | Subtotals only | |
| 3.1 Work subscale | 1 | 42 | Mean Difference (IV, Random, 95% CI) | ‐0.05 [‐1.80, 1.70] |
| 3.2 Social subscale | 1 | 42 | Mean Difference (IV, Random, 95% CI) | 0.07 [‐1.71, 1.85] |
| 3.3 Family subscale | 1 | 42 | Mean Difference (IV, Random, 95% CI) | ‐0.11 [‐1.74, 1.52] |
| 4 All‐cause dropouts (acute phase) Show forest plot | 1 | Risk Ratio (M‐H, Random, 95% CI) | Subtotals only | |
| 4.1 Dropout rate | 1 | 46 | Risk Ratio (M‐H, Random, 95% CI) | 3.36 [0.41, 27.80] |
| Outcome or subgroup title | No. of studies | No. of participants | Statistical method | Effect size |
| 1 Clinical Global Impressions ‐ Improvement (CGI‐I) or similar scale (acute phase) Show forest plot | 4 | Risk Ratio (M‐H, Random, 95% CI) | Subtotals only | |
| 1.1 No. of responders | 4 | 235 | Risk Ratio (M‐H, Random, 95% CI) | 2.36 [1.48, 3.75] |
| 2 Clinician‐rated: Liebowitz Social Anxiety Scale (LSAS): reduction of anxiety symptoms Show forest plot | 4 | Mean Difference (IV, Random, 95% CI) | Subtotals only | |
| 2.1 LSAS total score | 4 | 218 | Mean Difference (IV, Random, 95% CI) | ‐16.39 [‐32.27, ‐0.51] |
| 2.2 LSAS avoidance subscale | 1 | 51 | Mean Difference (IV, Random, 95% CI) | ‐5.42 [‐14.69, 3.85] |
| 2.3 LSAS fear subscale | 1 | 51 | Mean Difference (IV, Random, 95% CI) | ‐5.23 [‐13.97, 3.51] |
| 3 Clinician‐rated: Hamilton Depression scale (HAM‐D) (or similar scale) Show forest plot | 4 | Std. Mean Difference (IV, Random, 95% CI) | Subtotals only | |
| 3.1 Reduction of depression symptoms | 4 | 216 | Std. Mean Difference (IV, Random, 95% CI) | ‐0.40 [‐1.11, 0.31] |
| 4 Reduction of functional disability Show forest plot | 2 | Mean Difference (IV, Random, 95% CI) | Subtotals only | |
| 4.1 Work subscale | 2 | 95 | Mean Difference (IV, Random, 95% CI) | ‐2.84 [‐4.40, ‐1.28] |
| 4.2 Social subscale | 2 | 94 | Mean Difference (IV, Random, 95% CI) | ‐3.26 [‐7.25, 0.72] |
| 4.3 Family subscale | 2 | 95 | Mean Difference (IV, Random, 95% CI) | ‐2.20 [‐5.34, 0.95] |
| 5 All‐cause dropouts (acute phase) Show forest plot | 4 | Risk Ratio (M‐H, Random, 95% CI) | Subtotals only | |
| 5.1 Dropout rate | 4 | 235 | Risk Ratio (M‐H, Random, 95% CI) | 1.33 [0.71, 2.48] |
| 6 Clinical Global Impressions scale change item (CGI‐I) (long term) Show forest plot | 2 | Risk Ratio (M‐H, Random, 95% CI) | Subtotals only | |
| 6.1 No. of responders | 2 | 113 | Risk Ratio (M‐H, Random, 95% CI) | 1.84 [1.02, 3.33] |
| Outcome or subgroup title | No. of studies | No. of participants | Statistical method | Effect size |
| 1 Clinical Global Impressions ‐ Improvement (CGI‐I) or similar scale (acute phase) Show forest plot | 1 | Risk Ratio (M‐H, Random, 95% CI) | Subtotals only | |
| 1.1 No. of responders | 1 | 27 | Risk Ratio (M‐H, Random, 95% CI) | 0.70 [0.19, 2.54] |
| 2 Adverse events (acute phase) Show forest plot | 1 | Risk Ratio (M‐H, Random, 95% CI) | Subtotals only | |
| 2.1 Dropout rate | 1 | 27 | Risk Ratio (M‐H, Random, 95% CI) | 2.8 [0.12, 63.20] |
| 3 Clinician‐rated: Liebowitz Social Anxiety Scale (LSAS): reduction of anxiety symptoms Show forest plot | 1 | Mean Difference (IV, Random, 95% CI) | Subtotals only | |
| 3.1 LSAS total score | 1 | 26 | Mean Difference (IV, Random, 95% CI) | 2.60 [‐15.43, 20.63] |
| 4 Clinician‐rated: Hamilton Depression scale (HAM‐D) (or similar scale) Show forest plot | 1 | Mean Difference (IV, Random, 95% CI) | Subtotals only | |
| 4.1 Reduction of depression symptoms | 1 | 26 | Mean Difference (IV, Random, 95% CI) | ‐0.10 [‐2.73, 2.53] |
| 5 All‐cause dropouts (acute phase) Show forest plot | 1 | Risk Ratio (M‐H, Random, 95% CI) | Subtotals only | |
| 5.1 Dropout rate | 1 | 27 | Risk Ratio (M‐H, Random, 95% CI) | 0.93 [0.23, 3.81] |
| Outcome or subgroup title | No. of studies | No. of participants | Statistical method | Effect size |
| 1 Clinical Global Impressions ‐ Improvement (CGI‐I) or similar scale (acute phase) Show forest plot | 1 | Risk Ratio (M‐H, Random, 95% CI) | Subtotals only | |
| 1.1 No. of responders | 1 | 60 | Risk Ratio (M‐H, Random, 95% CI) | 1.0 [0.28, 3.63] |
| 2 Adverse events (acute phase) Show forest plot | 1 | Risk Ratio (M‐H, Random, 95% CI) | Subtotals only | |
| 2.1 Dropout rate | 1 | 60 | Risk Ratio (M‐H, Random, 95% CI) | 5.0 [0.25, 99.95] |
| 3 Clinician‐rated: Liebowitz Social Anxiety Scale (LSAS): reduction of anxiety symptoms Show forest plot | 2 | Mean Difference (IV, Random, 95% CI) | Subtotals only | |
| 3.1 LSAS total score | 2 | 126 | Mean Difference (IV, Random, 95% CI) | ‐15.37 [‐28.10, ‐2.63] |
| 3.2 LSAS avoidance subscale | 1 | 60 | Mean Difference (IV, Random, 95% CI) | ‐3.90 [‐9.90, 2.10] |
| 3.3 LSAS fear subscale | 1 | 60 | Mean Difference (IV, Random, 95% CI) | ‐3.70 [‐9.42, 2.02] |
| 4 All‐cause dropouts (acute phase) Show forest plot | 1 | Risk Ratio (M‐H, Random, 95% CI) | Subtotals only | |
| 4.1 Dropout rate | 1 | 60 | Risk Ratio (M‐H, Random, 95% CI) | 2.0 [0.19, 20.90] |
| Outcome or subgroup title | No. of studies | No. of participants | Statistical method | Effect size |
| 1 Clinical Global Impressions ‐ Improvement (CGI‐I) or similar scale (acute phase) Show forest plot | 8 | Risk Ratio (M‐H, Random, 95% CI) | Subtotals only | |
| 1.1 No. of responders | 8 | 1270 | Risk Ratio (M‐H, Random, 95% CI) | 1.83 [1.32, 2.55] |
| 2 Adverse events (acute phase) Show forest plot | 8 | Risk Ratio (M‐H, Random, 95% CI) | Subtotals only | |
| 2.1 Dropout rate | 8 | 1305 | Risk Ratio (M‐H, Random, 95% CI) | 1.42 [0.86, 2.34] |
| 3 Clinician‐rated: Liebowitz Social Anxiety Scale (LSAS): reduction of anxiety symptoms Show forest plot | 9 | Mean Difference (IV, Random, 95% CI) | Subtotals only | |
| 3.1 LSAS total score | 6 | 1163 | Mean Difference (IV, Random, 95% CI) | ‐12.17 [‐23.51, ‐0.84] |
| 3.2 LSAS avoidance subscale | 5 | 695 | Mean Difference (IV, Random, 95% CI) | ‐5.05 [‐7.91, ‐2.18] |
| 3.3 LSAS fear subscale | 6 | 724 | Mean Difference (IV, Random, 95% CI) | ‐5.40 [‐8.92, ‐1.88] |
| 4 Clinician‐rated: Hamilton Depression scale (HAM‐D) (or similar scale) Show forest plot | 7 | Std. Mean Difference (IV, Random, 95% CI) | Subtotals only | |
| 4.1 Reduction of depression symptoms | 7 | 765 | Std. Mean Difference (IV, Random, 95% CI) | ‐0.28 [‐0.55, ‐0.00] |
| 5 Reduction of functional disability Show forest plot | 5 | Mean Difference (IV, Random, 95% CI) | Subtotals only | |
| 5.1 Work subscale | 5 | 660 | Mean Difference (IV, Random, 95% CI) | ‐0.61 [‐1.89, 0.68] |
| 5.2 Social subscale | 5 | 660 | Mean Difference (IV, Random, 95% CI) | ‐1.14 [‐2.32, 0.05] |
| 5.3 Family subscale | 5 | 660 | Mean Difference (IV, Random, 95% CI) | ‐0.51 [‐1.45, 0.44] |
| 6 All‐cause dropouts (acute phase) Show forest plot | 6 | Risk Ratio (M‐H, Random, 95% CI) | Subtotals only | |
| 6.1 Dropout rate | 6 | 512 | Risk Ratio (M‐H, Random, 95% CI) | 0.80 [0.60, 1.08] |
| 7 Clinical Global Impressions ‐ Improvement (CGI‐I) (long term) Show forest plot | 1 | Risk Ratio (M‐H, Random, 95% CI) | Subtotals only | |
| 7.1 No. of responders | 1 | 90 | Risk Ratio (M‐H, Random, 95% CI) | 1.50 [1.12, 2.00] |
| Outcome or subgroup title | No. of studies | No. of participants | Statistical method | Effect size |
| 1 Clinician‐rated: Liebowitz Social Anxiety Scale (LSAS): reduction of anxiety symptoms Show forest plot | 1 | Mean Difference (IV, Random, 95% CI) | Subtotals only | |
| 1.1 LSAS total score | 1 | 102 | Mean Difference (IV, Random, 95% CI) | ‐6.10 [‐16.55, 4.35] |
| 2 Clinician‐rated: Hamilton Depression scale (HAM‐D) (or similar scale) Show forest plot | 1 | Mean Difference (IV, Random, 95% CI) | Subtotals only | |
| 2.1 Reduction of depression symptoms | 1 | 102 | Mean Difference (IV, Random, 95% CI) | 0.80 [‐2.10, 3.70] |
| 3 Reduction of functional disability Show forest plot | 1 | Mean Difference (IV, Random, 95% CI) | Subtotals only | |
| 3.1 Work subscale | 1 | 102 | Mean Difference (IV, Random, 95% CI) | ‐0.90 [‐1.87, 0.07] |
| 3.2 Social subscale | 1 | 102 | Mean Difference (IV, Random, 95% CI) | ‐1.0 [‐1.97, ‐0.03] |
| 3.3 Family subscale | 1 | 102 | Mean Difference (IV, Random, 95% CI) | ‐0.20 [‐1.06, 0.66] |
| 4 All‐cause dropouts (acute phase) Show forest plot | 1 | Risk Ratio (M‐H, Random, 95% CI) | Subtotals only | |
| 4.1 Dropout rate | 1 | 105 | Risk Ratio (M‐H, Random, 95% CI) | 2.18 [0.97, 4.92] |
| Outcome or subgroup title | No. of studies | No. of participants | Statistical method | Effect size |
| 1 Clinical Global Impressions ‐ Improvement (CGI‐I) or similar scale (acute phase) Show forest plot | 4 | Risk Ratio (M‐H, Random, 95% CI) | Subtotals only | |
| 1.1 No. of responders | 4 | 1173 | Risk Ratio (M‐H, Random, 95% CI) | 1.30 [0.85, 1.99] |
| 2 Adverse events (acute phase) Show forest plot | 4 | Risk Ratio (M‐H, Random, 95% CI) | Subtotals only | |
| 2.1 Dropout rate | 4 | 1213 | Risk Ratio (M‐H, Random, 95% CI) | 3.23 [2.15, 4.86] |
| 3 Clinician‐rated: Liebowitz Social Anxiety Scale (LSAS): reduction of anxiety symptoms Show forest plot | 3 | Mean Difference (IV, Random, 95% CI) | Subtotals only | |
| 3.1 LSAS total score | 3 | 902 | Mean Difference (IV, Random, 95% CI) | ‐11.91 [‐16.06, ‐7.76] |
| 3.2 LSAS avoidance subscale | 1 | 261 | Mean Difference (IV, Random, 95% CI) | ‐4.30 [‐8.14, ‐0.46] |
| 3.3 LSAS fear subscale | 1 | 261 | Mean Difference (IV, Random, 95% CI) | ‐4.0 [‐7.68, ‐0.32] |
| 4 All‐cause dropouts (acute phase) Show forest plot | 4 | Risk Ratio (M‐H, Random, 95% CI) | Subtotals only | |
| 4.1 Dropout rate | 4 | 1224 | Risk Ratio (M‐H, Random, 95% CI) | 0.90 [0.76, 1.07] |
| Outcome or subgroup title | No. of studies | No. of participants | Statistical method | Effect size |
| 1 Clinical Global Impressions ‐ Improvement (CGI‐I) or similar scale (acute phase) Show forest plot | 24 | Risk Ratio (M‐H, Random, 95% CI) | Subtotals only | |
| 1.1 No. of responders | 24 | 4984 | Risk Ratio (M‐H, Random, 95% CI) | 1.65 [1.48, 1.85] |
| 2 Relapse rate Show forest plot | 3 | Risk Ratio (M‐H, Random, 95% CI) | Subtotals only | |
| 2.1 No. relapsed | 3 | 389 | Risk Ratio (M‐H, Random, 95% CI) | 0.34 [0.22, 0.50] |
| 3 Adverse events (acute phase) Show forest plot | 24 | Risk Ratio (M‐H, Random, 95% CI) | Subtotals only | |
| 3.1 Dropout rate | 24 | 5131 | Risk Ratio (M‐H, Random, 95% CI) | 2.59 [1.97, 3.39] |
| 4 Clinician‐rated: Liebowitz Social Anxiety Scale (LSAS): reduction of anxiety symptoms Show forest plot | 15 | Mean Difference (IV, Random, 95% CI) | Subtotals only | |
| 4.1 LSAS total score | 14 | 1990 | Mean Difference (IV, Random, 95% CI) | ‐10.14 [‐14.05, ‐6.22] |
| 4.2 LSAS avoidance subscale | 7 | 1173 | Mean Difference (IV, Random, 95% CI) | ‐7.01 [‐10.21, ‐3.80] |
| 4.3 LSAS fear subscale | 7 | 1173 | Mean Difference (IV, Random, 95% CI) | ‐7.28 [‐10.86, ‐3.71] |
| 5 Clinician‐rated: Hamilton Depression scale (HAM‐D) (or similar scale) Show forest plot | 6 | Std. Mean Difference (IV, Random, 95% CI) | Subtotals only | |
| 5.1 Reduction of depression symptoms | 6 | 960 | Std. Mean Difference (IV, Random, 95% CI) | ‐0.26 [‐0.48, ‐0.03] |
| 6 Reduction of functional disability Show forest plot | 5 | Mean Difference (IV, Random, 95% CI) | Subtotals only | |
| 6.1 Work subscale | 5 | 854 | Mean Difference (IV, Random, 95% CI) | ‐0.81 [‐1.18, ‐0.45] |
| 6.2 Social subscale | 5 | 854 | Mean Difference (IV, Random, 95% CI) | ‐0.87 [‐1.26, ‐0.47] |
| 6.3 Family subscale | 5 | 854 | Mean Difference (IV, Random, 95% CI) | ‐0.45 [‐0.75, ‐0.15] |
| 7 All‐cause dropouts (acute phase) Show forest plot | 26 | Risk Ratio (M‐H, Random, 95% CI) | Subtotals only | |
| 7.1 Dropout rate | 26 | 5208 | Risk Ratio (M‐H, Random, 95% CI) | 1.01 [0.90, 1.14] |
| 8 Clinical Global Impressions scale change item (CGI‐I) (long term) Show forest plot | 4 | Risk Ratio (M‐H, Random, 95% CI) | Subtotals only | |
| 8.1 No. of responders | 4 | 806 | Risk Ratio (M‐H, Random, 95% CI) | 1.27 [1.07, 1.51] |
| 9 Adverse events (long term) Show forest plot | 3 | Risk Ratio (M‐H, Random, 95% CI) | Subtotals only | |
| 9.1 Dropout rate | 3 | 1274 | Risk Ratio (M‐H, Random, 95% CI) | 1.17 [0.43, 3.18] |
| 10 All‐cause dropouts (long term) Show forest plot | 1 | Risk Ratio (M‐H, Random, 95% CI) | Subtotals only | |
| 10.1 Dropout rate | 1 | 52 | Risk Ratio (M‐H, Random, 95% CI) | 1.0 [0.37, 2.70] |
| Outcome or subgroup title | No. of studies | No. of participants | Statistical method | Effect size |
| 1 Clinical Global Impressions ‐ Improvement (CGI‐I) or similar scale (acute phase) Show forest plot | 1 | Risk Ratio (M‐H, Random, 95% CI) | Subtotals only | |
| 1.1 No. of responders | 1 | 250 | Risk Ratio (M‐H, Random, 95% CI) | 0.83 [0.58, 1.19] |
| 2 Adverse events (acute phase) Show forest plot | 1 | Risk Ratio (M‐H, Random, 95% CI) | Subtotals only | |
| 2.1 Dropout rate | 1 | 252 | Risk Ratio (M‐H, Random, 95% CI) | 2.95 [0.67, 13.02] |
| 3 All‐cause dropouts (acute phase) Show forest plot | 1 | Risk Ratio (M‐H, Random, 95% CI) | Subtotals only | |
| 3.1 Dropout rate | 1 | 252 | Risk Ratio (M‐H, Random, 95% CI) | 0.77 [0.50, 1.20] |
| Outcome or subgroup title | No. of studies | No. of participants | Statistical method | Effect size |
| 1 Clinical Global Impressions ‐ Improvement (CGI‐I) or similar scale (acute phase) Show forest plot | 1 | Risk Ratio (M‐H, Random, 95% CI) | Subtotals only | |
| 1.1 No. of responders | 1 | 24 | Risk Ratio (M‐H, Random, 95% CI) | 5.0 [0.68, 36.66] |
| 2 Adverse events (acute phase) Show forest plot | 1 | Risk Ratio (M‐H, Random, 95% CI) | Subtotals only | |
| 2.1 Dropout rate | 1 | 24 | Risk Ratio (M‐H, Random, 95% CI) | 0.0 [0.0, 0.0] |
| 3 Clinician‐rated: Liebowitz Social Anxiety Scale (LSAS): reduction of anxiety symptoms Show forest plot | 1 | Mean Difference (IV, Random, 95% CI) | Subtotals only | |
| 3.1 LSAS total score | 1 | 24 | Mean Difference (IV, Random, 95% CI) | ‐0.50 [‐1.35, 0.35] |
| 4 All‐cause dropouts (acute phase) Show forest plot | 1 | Risk Ratio (M‐H, Random, 95% CI) | Subtotals only | |
| 4.1 Dropout rate | 1 | 24 | Risk Ratio (M‐H, Random, 95% CI) | 0.0 [0.0, 0.0] |
| Outcome or subgroup title | No. of studies | No. of participants | Statistical method | Effect size |
| 1 Clinician‐rated: Liebowitz Social Anxiety Scale (LSAS): reduction of anxiety symptoms Show forest plot | 1 | Mean Difference (IV, Random, 95% CI) | Subtotals only | |
| 1.1 LSAS total score | 1 | 99 | Mean Difference (IV, Random, 95% CI) | 1.80 [‐6.92, 10.52] |
| Outcome or subgroup title | No. of studies | No. of participants | Statistical method | Effect size |
| 1 Clinical Global Impressions ‐ Improvement (CGI‐I) or similar) scale: no. of responders (acute phase) Show forest plot | 51 | Risk Ratio (M‐H, Random, 95% CI) | Subtotals only | |
| 1.1 5HT1A partial agonists | 1 | 30 | Risk Ratio (M‐H, Random, 95% CI) | 1.0 [0.07, 14.55] |
| 1.2 Anticonvulsants/GABAs | 3 | 532 | Risk Ratio (M‐H, Random, 95% CI) | 1.60 [1.16, 2.20] |
| 1.3 Anticonvulsant levetiracetam | 2 | 228 | Risk Ratio (M‐H, Random, 95% CI) | 0.98 [0.70, 1.37] |
| 1.4 Antipsychotics | 1 | 10 | Risk Ratio (M‐H, Random, 95% CI) | 7.0 [0.45, 108.26] |
| 1.5 Benzodiazepines | 2 | 132 | Risk Ratio (M‐H, Random, 95% CI) | 4.03 [2.45, 6.65] |
| 1.6 Beta‐blockers | 2 | 97 | Risk Ratio (M‐H, Random, 95% CI) | 1.09 [0.63, 1.88] |
| 1.7 MAOIs | 3 | 178 | Risk Ratio (M‐H, Random, 95% CI) | 2.37 [1.26, 4.45] |
| 1.8 NARIs | 1 | 27 | Risk Ratio (M‐H, Random, 95% CI) | 0.70 [0.19, 2.54] |
| 1.9 NaSSAs | 1 | 60 | Risk Ratio (M‐H, Random, 95% CI) | 1.0 [0.28, 3.63] |
| 1.10 RIMAs | 8 | 1270 | Risk Ratio (M‐H, Random, 95% CI) | 1.83 [1.32, 2.55] |
| 1.11 SNRIs | 4 | 1173 | Risk Ratio (M‐H, Random, 95% CI) | 1.30 [0.85, 1.99] |
| 1.12 SSRIs | 21 | 4553 | Risk Ratio (M‐H, Random, 95% CI) | 1.65 [1.46, 1.87] |
| 1.13 NK1 receptor antagonist GR205171 | 1 | 24 | Risk Ratio (M‐H, Random, 95% CI) | 5.0 [0.68, 36.66] |
| 1.14 GW876008 | 1 | 250 | Risk Ratio (M‐H, Random, 95% CI) | 0.83 [0.58, 1.19] |
| 2 Dropout rate: adverse events (acute phase) Show forest plot | 45 | Risk Ratio (M‐H, Random, 95% CI) | Subtotals only | |
| 2.1 5HT1A partial agonists | 1 | 30 | Risk Ratio (M‐H, Random, 95% CI) | 3.0 [0.13, 68.26] |
| 2.2 Anticonvulsants/GABAs | 3 | 532 | Risk Ratio (M‐H, Random, 95% CI) | 2.90 [0.92, 9.14] |
| 2.3 Anticonvulsant levetiracetam | 2 | 235 | Risk Ratio (M‐H, Random, 95% CI) | 2.00 [0.81, 4.94] |
| 2.4 Antipsychotics | 1 | 12 | Risk Ratio (M‐H, Random, 95% CI) | 0.71 [0.06, 8.90] |
| 2.5 Benzodiazepines | 2 | 96 | Risk Ratio (M‐H, Random, 95% CI) | 1.68 [0.21, 13.13] |
| 2.6 NARIs | 1 | 27 | Risk Ratio (M‐H, Random, 95% CI) | 2.8 [0.12, 63.20] |
| 2.7 NaSSAs | 1 | 60 | Risk Ratio (M‐H, Random, 95% CI) | 5.0 [0.25, 99.95] |
| 2.8 RIMAs | 8 | 1305 | Risk Ratio (M‐H, Random, 95% CI) | 1.42 [0.86, 2.34] |
| 2.9 SNRIs | 4 | 1213 | Risk Ratio (M‐H, Random, 95% CI) | 3.23 [2.15, 4.86] |
| 2.10 SSRIs | 22 | 4965 | Risk Ratio (M‐H, Random, 95% CI) | 2.56 [1.94, 3.38] |
| 2.11 NK1 receptor antagonist GR205171 | 1 | 24 | Risk Ratio (M‐H, Random, 95% CI) | 0.0 [0.0, 0.0] |
| 2.12 GW876008 | 1 | 252 | Risk Ratio (M‐H, Random, 95% CI) | 2.95 [0.67, 13.02] |
| 3 Dropout rate: all‐cause dropouts (acute phase) Show forest plot | 54 | Risk Ratio (M‐H, Random, 95% CI) | Subtotals only | |
| 3.1 5HT1A partial agonists | 1 | 30 | Risk Ratio (M‐H, Random, 95% CI) | 0.14 [0.01, 2.55] |
| 3.2 Anticonvulsants/GABAs | 3 | 488 | Risk Ratio (M‐H, Random, 95% CI) | 1.16 [0.78, 1.70] |
| 3.3 Anticonvulsant levetiracetam | 2 | 235 | Risk Ratio (M‐H, Random, 95% CI) | 1.42 [0.30, 6.76] |
| 3.4 Antipsychotics | 1 | 12 | Risk Ratio (M‐H, Random, 95% CI) | 1.07 [0.27, 4.23] |
| 3.5 Benzodiazepines | 3 | 171 | Risk Ratio (M‐H, Random, 95% CI) | 0.79 [0.41, 1.52] |
| 3.6 Beta‐blockers | 1 | 46 | Risk Ratio (M‐H, Random, 95% CI) | 3.36 [0.41, 27.80] |
| 3.7 MAOIs | 4 | 235 | Risk Ratio (M‐H, Random, 95% CI) | 1.33 [0.71, 2.48] |
| 3.8 NARIs | 1 | 27 | Risk Ratio (M‐H, Random, 95% CI) | 0.93 [0.23, 3.81] |
| 3.9 NaSSAs | 1 | 60 | Risk Ratio (M‐H, Random, 95% CI) | 2.0 [0.19, 20.90] |
| 3.10 RIMAs | 6 | 512 | Risk Ratio (M‐H, Random, 95% CI) | 0.80 [0.60, 1.08] |
| 3.11 SARIs | 1 | 105 | Risk Ratio (M‐H, Random, 95% CI) | 2.18 [0.97, 4.92] |
| 3.12 SNRIs | 4 | 1224 | Risk Ratio (M‐H, Random, 95% CI) | 0.90 [0.76, 1.07] |
| 3.13 SSRIs | 25 | 5078 | Risk Ratio (M‐H, Random, 95% CI) | 1.01 [0.89, 1.14] |
| 3.14 NK1 receptor antagonist GR205171 | 1 | 24 | Risk Ratio (M‐H, Random, 95% CI) | 0.0 [0.0, 0.0] |
| 3.15 GW876008 | 1 | 252 | Risk Ratio (M‐H, Random, 95% CI) | 0.77 [0.50, 1.20] |
| Outcome or subgroup title | No. of studies | No. of participants | Statistical method | Effect size |
| 1 Clinical Global Impressions ‐ Improvement (CGI‐I) or similar scale: no. of responders (acute phase) Show forest plot | 53 | Risk Ratio (M‐H, Random, 95% CI) | Subtotals only | |
| 1.1 Single‐centre | 20 | 1332 | Risk Ratio (M‐H, Random, 95% CI) | 2.24 [1.67, 3.02] |
| 1.2 Multicentre | 35 | 8274 | Risk Ratio (M‐H, Random, 95% CI) | 1.47 [1.34, 1.62] |
| Outcome or subgroup title | No. of studies | No. of participants | Statistical method | Effect size |
| 1 Clinical Global Impressions ‐ Improvement (CGI‐I) or similar scale: no. of responders (acute phase) Show forest plot | 53 | Risk Ratio (M‐H, Random, 95% CI) | Subtotals only | |
| 1.1 Generalised | 26 | 5522 | Risk Ratio (M‐H, Random, 95% CI) | 1.49 [1.31, 1.69] |
| 1.2 Inclusive | 27 | 3712 | Risk Ratio (M‐H, Random, 95% CI) | 1.83 [1.54, 2.18] |
| Outcome or subgroup title | No. of studies | No. of participants | Statistical method | Effect size |
| 1 Clinical Global Impressions ‐ Improvement (CGI‐I) or similar scale: no. of responders (acute phase) Show forest plot | 50 | Risk Ratio (M‐H, Random, 95% CI) | Subtotals only | |
| 1.1 Industry funded trials | 34 | 6643 | Risk Ratio (M‐H, Random, 95% CI) | 1.60 [1.44, 1.77] |
| 1.2 Non‐industry funded trials | 16 | 1780 | Risk Ratio (M‐H, Random, 95% CI) | 1.99 [1.43, 2.77] |
| Outcome or subgroup title | No. of studies | No. of participants | Statistical method | Effect size |
| 1 Clinical Global Impressions ‐ Improvement (CGI‐I) or similar scale: no. of responders (acute phase) Show forest plot | 53 | Risk Ratio (M‐H, Random, 95% CI) | Subtotals only | |
| 1.1 Trials including MDD participants | 20 | 2654 | Risk Ratio (M‐H, Random, 95% CI) | 1.77 [1.44, 2.18] |
| 1.2 Trials excluding MDD participants | 34 | 6765 | Risk Ratio (M‐H, Random, 95% CI) | 1.51 [1.35, 1.70] |
| Outcome or subgroup title | No. of studies | No. of participants | Statistical method | Effect size |
| 1 'Worst case' lost‐to‐follow‐up analysis Show forest plot | 25 | Risk Ratio (M‐H, Random, 95% CI) | Subtotals only | |
| 1.1 Anticonvulsant levetiracetam | 2 | 235 | Risk Ratio (M‐H, Random, 95% CI) | 0.98 [0.70, 1.38] |
| 1.2 Antipsychotics | 1 | 12 | Risk Ratio (M‐H, Random, 95% CI) | 5.25 [0.33, 83.59] |
| 1.3 Benzodiazepines | 1 | 75 | Risk Ratio (M‐H, Random, 95% CI) | 3.82 [1.92, 7.62] |
| 1.4 Beta‐blockers | 1 | 46 | Risk Ratio (M‐H, Random, 95% CI) | 0.93 [0.47, 1.86] |
| 1.5 RIMAs | 2 | 182 | Risk Ratio (M‐H, Random, 95% CI) | 3.01 [1.95, 4.65] |
| 1.6 SNRIs | 3 | 934 | Risk Ratio (M‐H, Random, 95% CI) | 1.60 [1.36, 1.88] |
| 1.7 SSRIs | 14 | 3753 | Risk Ratio (M‐H, Random, 95% CI) | 1.61 [1.44, 1.79] |
| 1.8 GW876008 | 1 | 252 | Risk Ratio (M‐H, Random, 95% CI) | 0.82 [0.57, 1.18] |
| 2 'Best case' lost‐to‐follow‐up analysis Show forest plot | 25 | Risk Ratio (M‐H, Random, 95% CI) | Subtotals only | |
| 2.1 Anticonvulsant levetiracetam | 2 | 228 | Risk Ratio (M‐H, Random, 95% CI) | 0.98 [0.70, 1.37] |
| 2.2 Antipsychotics | 1 | 10 | Risk Ratio (M‐H, Random, 95% CI) | 7.0 [0.45, 108.26] |
| 2.3 Benzodiazepines | 1 | 72 | Risk Ratio (M‐H, Random, 95% CI) | 3.92 [1.98, 7.77] |
| 2.4 Beta‐blockers | 1 | 41 | Risk Ratio (M‐H, Random, 95% CI) | 1.06 [0.55, 2.05] |
| 2.5 RIMAs | 2 | 177 | Risk Ratio (M‐H, Random, 95% CI) | 2.97 [1.93, 4.58] |
| 2.6 SNRIs | 3 | 912 | Risk Ratio (M‐H, Random, 95% CI) | 1.63 [1.39, 1.91] |
| 2.7 SSRIs | 14 | 3577 | Risk Ratio (M‐H, Random, 95% CI) | 1.64 [1.46, 1.85] |
| 2.8 GW876008 | 1 | 250 | Risk Ratio (M‐H, Random, 95% CI) | 0.83 [0.58, 1.19] |