Apoyo a la lactancia materna en madres sanas con lactantes sanos nacidos a término
Resumen
Antecedentes
Existe mucha evidencia de importantes riesgos para la salud de los lactantes y las madres relacionados con no amamantar. En 2003, la Organización Mundial de la Salud recomendó que los lactantes sean alimentados exclusivamente con leche materna hasta los seis meses de vida y que la lactancia materna continúe como parte importante de la dieta del lactante hasta que tenga por lo menos dos años de edad. Sin embargo, las actuales tasas de lactancia materna en muchos países no reflejan esta recomendación.
Objetivos
1. Describir los tipos de apoyo a la lactancia materna para madres sanas con lactantes sanos nacidos a término.
2. Examinar la efectividad de los diferentes tipos de intervenciones de apoyo a la lactancia materna en función de si ofrecían solo apoyo a la lactancia materna o apoyo a la lactancia materna en combinación con una intervención más amplia de salud materno‐infantil (apoyo «lactancia materna plus»).
3. Examinar la efectividad de las siguientes características de la intervención sobre el apoyo a la lactancia materna:
a. tipo de apoyo (p. ej., presencial, telefónico, tecnologías digitales, apoyo grupal o individual, proactivo o reactivo);
b. intensidad del apoyo (es decir, número de contactos posnatales);
c. persona que realiza la intervención (p. ej., un profesional sanitario o persona no sanitaria);
d. examinar si el impacto del apoyo varía entre los países de ingresos altos y los de ingresos bajos y medios.
Métodos de búsqueda
Se hicieron búsquedas en el registro de ensayos del Grupo Cochrane de Embarazo y parto (Cochrane Pregnancy and Childbirth) (que incluye resultados de búsquedas en CENTRAL, MEDLINE, Embase, CINAHL, ClinicalTrials.gov, la Plataforma de registros internacionales de ensayos clínicos [ICTRP] de la OMS) (11 de mayo de 2021) y en las listas de referencias de los estudios identificados.
Criterios de selección
Ensayos controlados aleatorizados o cuasialeatorizados que comparen el apoyo adicional a las madres sanas que amamantan a sus hijos sanos a término con la atención materna habitual. El apoyo podía prestarse de manera presencial, telefónica o con el uso de tecnologías digitales. Todos los estudios debían cumplir los criterios de fiabilidad.
Obtención y análisis de los datos
Se utilizaron los métodos estándar del Grupo Cochrane de Embarazo y parto. Dos autores de la revisión, de forma independiente, seleccionaron los ensayos, extrajeron los datos y evaluaron el riesgo de sesgo y la fiabilidad de los estudios. La certeza de la evidencia se evaluó según el método GRADE.
Resultados principales
Esta revisión actualizada incluye 116 ensayos, de los cuales 103 aportan datos a los análisis. En total se incluyeron más de 98 816 parejas de madres y lactantes.
Existe evidencia de certeza moderada que indicó que el apoyo «solo a la lactancia materna» probablemente redujo el número de mujeres que dejaron de amamantar para todos los desenlaces principales: dejar de amamantar a los seis meses (razón de riesgos [RR] 0,93; intervalo de confianza [IC] del 95%: 0,89 a 0,97); interrupción de la lactancia materna exclusiva a los seis meses (RR 0,90; IC del 95%: 0,88 a 0,93); interrupción de cualquier lactancia materna a las cuatro a seis semanas (RR 0,88; IC del 95%: 0,79 a 0,97); e interrupción de la lactancia materna exclusiva a las cuatro a seis semanas (RR 0,83; IC del 95%: 0,76 a 0,90). Se obtuvieron resultados similares para los desenlaces secundarios de la lactancia materna, excepto en el caso de la lactancia materna a los dos y a los 12 meses, en el que la evidencia fue incierta con respecto a si el apoyo «solo a la lactancia materna» contribuyó a reducir el número de mujeres que dejaban de amamantar.
La evidencia acerca de la «lactancia materna plus» fue menos consistente. Para los desenlaces principales hubo cierta evidencia de que el apoyo «lactancia materna plus» probablemente redujo el número de mujeres que dejaron de amamantar (RR 0,94; IC del 95%: 0,91 a 0,97; evidencia de certeza moderada) o la lactancia materna exclusiva a los seis meses (RR 0,79; IC del 95%: 0,70 a 0,90). Las intervenciones de «lactancia materna plus» podrían tener un efecto beneficioso en la reducción del número de mujeres que interrumpen la lactancia materna exclusiva a las cuatro a seis semanas, pero la evidencia es muy incierta (RR 0,73; IC del 95%: 0,57 a 0,95). La evidencia indica que el apoyo «lactancia materna plus» probablemente da lugar a poca o ninguna diferencia en el número de mujeres que dejan de amamantar a las cuatro a seis semanas (RR 0,94; IC del 95%: 0,82 a 1,08; evidencia de certeza moderada). En cuanto a los desenlaces secundarios, no se sabe si el apoyo «lactancia materna plus» contribuyó a reducir el número de mujeres que dejaron de amamantar algo o de manera exclusiva en algún momento.
La síntesis narrativa de los desenlaces al margen de los de la lactancia materna (satisfacción materna con la atención, satisfacción materna con el método de alimentación, morbilidad infantil y salud mental materna) no arrojó resultados consistentes, salvo una posible reducción de la diarrea en los lactantes de la intervención.
Se consideró que el riesgo general de sesgo de los ensayos incluidos en la revisión fue variado. El cegamiento de las participantes y del personal no es factible en este tipo de intervenciones y, como los estudios utilizaron datos autoinformados sobre la lactancia materna, también existe un riesgo de sesgo en la evaluación de los desenlaces.
Se realizó una metarregresión para explorar la heterogeneidad sustancial de los desenlaces principales utilizando las siguientes categorías: persona que presta la atención; modo de prestación; intensidad de la ayuda; y nivel de ingresos del país. Es posible que los niveles moderados (definidos como cuatro a ocho visitas) de apoyo «solo a la lactancia materna» se asocien con un efecto más beneficioso sobre la lactancia materna exclusiva a las cuatro a seis semanas y a los seis meses. El apoyo «solo a la lactancia materna» también podría ser más eficaz para reducir el número de mujeres de los países de ingresos bajos y medios (PIBM) que dejan de amamantar exclusivamente a los seis meses, en comparación con las mujeres de los países de ingresos altos (PIA). Sin embargo, no se encontraron otros efectos diferenciales, por lo que la heterogeneidad sigue sin explicarse en gran medida. La metarregresión indicó que no hubo efectos diferenciales con respecto a la persona que proporcionaba el apoyo o el modo de prestación; sin embargo, la potencia estadística fue limitada.
Conclusiones de los autores
Cuando se ofrece a las mujeres un apoyo «solo a la lactancia materna», es probable que aumente la duración y, en particular, la exclusividad de la lactancia. El apoyo también podría ser más eficaz para reducir el número de mujeres que dejan de amamantar a los tres o cuatro meses en comparación con momentos posteriores. En el caso de las intervenciones de «lactancia materna plus», la certeza de la evidencia es menor. El apoyo pueden ofrecerlo profesionales, personal no profesional/otras madres, o una combinación de ambos. El apoyo también puede ofrecerse en formato presencial, telefónico, a través tecnologías digitales, o una combinación de ambos, y podría ser más eficaz cuando se ofrece en un programa de cuatro a ocho visitas. Es necesario seguir trabajando para identificar los componentes de las intervenciones eficaces y realizarlas a mayor escala.
PICO
Resumen en términos sencillos
Apoyo para la lactancia materna
¿Cuál es el problema?
La Organización Mundial de la Salud recomienda que los lactantes sean alimentados exclusivamente con leche materna hasta los seis meses de vida y que la lactancia materna continúe como parte importante de la dieta del lactante hasta que tenga por lo menos dos años de edad. Se sabe que la lactancia materna es buena para la salud a corto y largo plazo tanto de los lactantes como de sus madres. Los bebés son menos propensos a desarrollar infecciones pulmonares o intestinales. También es menos probable que tengan sobrepeso y que desarrollen diabetes en el futuro. Las madres son menos propensas a desarrollar diabetes y a sufrir cáncer de mama u ovario. Es posible que muchas madres dejen de amamantar antes de lo que les gustaría como resultado de los problemas que encuentran. Una buena atención y un buen apoyo podrían ayudar a las mujeres a superar las dificultades y a ganar confianza para poder seguir amamantando.
Esta revisión analizó si la prestación de apoyo organizado adicional a las madres que dan el pecho las ayudaría a continuar amamantando en comparación con la atención materna estándar. Esta revisión se centró en el apoyo de profesionales sanitarios, incluidas matronas, enfermeras y médicas, o de trabajadores no técnicos formados, como los trabajadores y voluntarios no técnicos de la comunidad.
¿Por qué es esto importante?
Sabiendo qué tipo de apoyo se puede proporcionar para ayudar a las madres con la lactancia, es posible ayudarlas a seguir amamantando durante el tiempo que quieran, dondequiera que vivan. Abandonar la lactancia antes de tiempo podría causar decepción, depresión y angustia duraderas en las madres y problemas de salud para ellas y sus hijos. El apoyo puede proporcionarse dando confianza, elogios, información y la posibilidad de que las mujeres comenten sus dudas y hagan las preguntas que consideren necesarias.
¿Qué evidencia se encontró?
Se hicieron búsquedas de evidencia el 11 mayo de 2021. Esta revisión actualizada incluye ahora 116 estudios controlados aleatorizados, de los cuales 103 ensayos han contribuido a los análisis, procedentes de 42 países y en los que participaron 98 816 mujeres y sus bebés. Alrededor del 55% de las mujeres procedían de países de ingresos altos, el 37% de países de ingresos medios y el 8% de países de ingresos bajos.
En esta actualización de la revisión, las intervenciones se agruparon en dos categorías diferentes. El primer grupo, «solo a la lactancia materna», incluyó las intervenciones que solo contenían apoyo a la lactancia. En el segundo grupo, el apoyo a la lactancia materna fue una parte de una intervención más amplia que también tenía como objetivo proporcionar otros beneficios para la salud de la madre o del bebé (p. ej., vacunas, cuidado del recién nacido). A estas intervenciones se les llamó «lactancia materna plus».
En general, estos ensayos mostraron que es probable que menos mujeres que recibieron una intervención de apoyo «solo a la lactancia materna» abandonaran la lactancia materna exclusiva en cualquier momento hasta los seis meses inclusive. El efecto fue mayor entre las cuatro a seis semanas y los tres a cuatro meses, donde se calcula que probablemente un 17% y un 19% menos de mujeres dejarían la lactancia materna exclusiva. El efecto fue menor a los seis meses, donde se calcula que un 10% menos de mujeres probablemente dejaría de amamantar exclusivamente.
Las pruebas también indican que las mujeres que reciben apoyo «solo a la lactancia materna» probablemente tengan menos probabilidades de interrumpir la lactancia materna hasta los seis meses inclusive. De nuevo, el efecto fue mayor entre las cuatro a seis semanas y los tres a cuatro meses, donde se calcula que probablemente un 12% y un 13% menos de mujeres abandonaría cualquier lactancia materna. A los seis meses se calcula que un 7% menos de mujeres dejaría de amamantar. No hubo suficientes estudios para mostrar si las intervenciones de apoyo «solo a la lactancia materna» podían reducir el número de mujeres que dejan de dar el pecho a los nueve o a los 12 meses.
En el caso de las mujeres que recibieron intervenciones de «lactancia materna plus», las pruebas son menos claras. Las mujeres que reciben apoyo «lactancia materna plus» podrían tener un 27% menos de probabilidades de dejar la lactancia materna exclusiva a las cuatro a seis semanas (evidencia de certeza muy baja). Asimismo, los datos indican que un 21% menos de mujeres podrían dejar la lactancia materna exclusiva a los seis meses. El efecto sobre cualquier tipo de lactancia materna fue menor, ya que se calcula que un 6% menos de mujeres probablemente dejó de dar el pecho a los seis meses. No está claro si las intervenciones de «lactancia materna plus» reducen el número de mujeres que abandonan cualquier tipo de lactancia materna o la lactancia materna exclusiva en los otros momentos examinados.
Faltan pruebas claras sobre los factores que podrían ayudar a las mujeres a dar el pecho durante más tiempo. Sin embargo, un programa específico de entre cuatro y ocho contactos podría ayudar a aumentar el número de mujeres que dan el pecho de forma exclusiva a las cuatro a seis semanas o a los seis meses cuando reciben una intervención de «solo a la lactancia materna».
En el caso de las intervenciones de apoyo «solo a la lactancia materna», en general se consideró que las pruebas eran de certeza moderada. Esto significa que existe una confianza moderada en los resultados. En el caso de las intervenciones de apoyo «lactancia materna plus», la calidad de las pruebas fue más contradictoria y la certeza varió entre moderada y muy baja.
¿Qué significa esto?
Proporcionar a las mujeres un apoyo adicional organizado les ayuda a dar el pecho a sus hijos durante más tiempo. El apoyo a la lactancia materna podría ser más útil si se programan de cuatro a ocho visitas. No parece haber diferencias con respecto a quién proporciona el apoyo (es decir, profesional o no profesional) ni cómo se proporciona (en persona, por teléfono, con tecnologías digitales o combinado). De hecho, es posible que se necesiten diferentes tipos de apoyo en diferentes puntos geográficos para satisfacer las necesidades de las personas que se encuentran en ese lugar. Es necesario seguir trabajando para identificar los componentes de las intervenciones eficaces y realizarlas a mayor escala.
Authors' conclusions
Summary of findings
| Breastfeeding support only compared to usual care | ||||||
| Patient or population: healthy breastfeeding women with healthy term babies | ||||||
| Outcomes | Anticipated absolute effects* (95% CI) | Relative effect | № of participants | Certainty of the evidence | Comments | |
|---|---|---|---|---|---|---|
| Risk with Usual care | Risk with Support | |||||
| Stopping breastfeeding (any) at 6 months | 600 per 1000 | 558 per 1000 | RR 0.93 | 14610 | ⊕⊕⊕⊝ | |
| Stopping exclusive breastfeeding at 6 months | 847 per 1000 | 763 per 1000 | RR 0.90 | 16332 | ⊕⊕⊕⊝ | |
| Stopping breastfeeding (any) at 4‐6 weeks | 308 per 1000 | 271 per 1000 | RR 0.88 | 11413 | ⊕⊕⊕⊝ | |
| Stopping exclusive breastfeeding at 4‐6 weeks | 518 per 1000 | 430 per 1000 | RR 0.83 | 14544 | ⊕⊕⊕⊝ | |
| Stopping breastfeeding (any) at 2 months | 384 per 1000 | 357 per 1000 | RR 0.93 | 3169 | ⊕⊕⊝⊝ | |
| Stopping exclusive breastfeeding at 2 months | 607 per 1000 | 491 per 1000 | RR 0.81 | 4317 | ⊕⊕⊕⊝ | |
| Stopping breastfeeding (any) at 3‐4 months | 462 per 1000 | 402 per 1000 | RR 0.87 | 12054 | ⊕⊕⊕⊝ | |
| Stopping exclusive breastfeeding at 3‐4 months | 731 per 1000 | 592 per 1000 | RR 0.81 | 11575 | ⊕⊕⊕⊝ | |
| Stopping breastfeeding at 9 months | 758 per 1000 | 660 per 1000 | RR 0.87 | 552 | ⊕⊕⊝⊝ | |
| Stopping breastfeeding at 12 months | 891 per 1000 | 846 per 1000 | RR 0.95 | 1311 | ⊕⊕⊝⊝ | |
| *The risk in the intervention group (and its 95% confidence interval) is based on the assumed risk in the comparison group and the relative effect of the intervention (and its 95% CI). | ||||||
| GRADE Working Group grades of evidence | ||||||
| See interactive version of this table: https://gdt.gradepro.org/presentations/#/isof/isof_question_revman_web_431686173574519163. | ||||||
| a We downgraded 1 level for serious concerns about inconsistency. Evidence of substantial unexplained heterogeneity. | ||||||
| Support plus compared to usual care for healthy breastfeeding women with healthy term babies | ||||||
| Patient or population: healthy breastfeeding women with healthy term babies | ||||||
| Outcomes | Anticipated absolute effects* (95% CI) | Relative effect | № of participants | Certainty of the evidence | Comments | |
|---|---|---|---|---|---|---|
| Risk with usual care | Risk with Support plus | |||||
| Stopping breastfeeding (any) at 6 months | 541 per 1000 | 508 per 1000 | RR 0.94 | 4879 | ⊕⊕⊕⊝ | |
| Stopping exclusive breastfeeding at 6 months | 685 per 1000 | 541 per 1000 | RR 0.79 | 7650 | ⊕⊕⊝⊝ | |
| Stopping breastfeeding (any) at 4‐6 weeks | 433 per 1000 | 407 per 1000 | RR 0.94 | 2325 | ⊕⊕⊕⊝ | |
| Stopping exclusive breastfeeding at 4‐6 weeks | 542 per 1000 | 396 per 1000 | RR 0.73 | 2402 | ⊕⊝⊝⊝ | |
| Stopping breastfeeding (any) at 2 months | 363 per 1000 | 334 per 1000 | RR 0.92 | 2089 | ⊕⊕⊕⊝ | |
| Stopping exclusive breastfeeding at 2 months | 425 per 1000 | 382 per 1000 | RR 0.90 | 4537 | ⊕⊝⊝⊝ | |
| Stopping breastfeeding (any) at 3‐4 months | 386 per 1000 | 374 per 1000 | RR 0.97 | 2064 | ⊕⊕⊝⊝ | |
| Stopping exclusive breastfeeding at 3‐4 months | 587 per 1000 | 505 per 1000 | RR 0.86 | 4766 | ⊕⊕⊝⊝ | |
| Stopping breastfeeding (any) at 12 months | 858 per 1000 | 823 per 1000 | RR 0.96 | 1431 | ⊕⊕⊕⊝ | |
| Stopping breastfeeding (any) at 9 months ‐ not reported | ‐ | ‐ | ‐ | ‐ | ‐ | |
| *The risk in the intervention group (and its 95% confidence interval) is based on the assumed risk in the comparison group and the relative effect of the intervention (and its 95% CI). | ||||||
| GRADE Working Group grades of evidence | ||||||
| See interactive version of this table: https://gdt.gradepro.org/presentations/#/isof/isof_question_revman_web_431754481798286092. | ||||||
| a We downgraded 1 level for serious concerns on risk of bias. Studies at risk of selection bias due to unclear allocation concealment. | ||||||
Background
Description of the condition
Breastfeeding has a fundamental impact on the short‐, medium‐ and long‐term health of children and has an important impact on women’s health (Victora 2016). For children, good‐quality evidence demonstrates that in both low‐, middle‐ and high‐income settings not breastfeeding contributes to mortality due to infectious diseases (Sankar 2015; Li 2022) and necrotising enterocolitis (Li 2022), hospitalisation for preventable diseases such as gastroenteritis, and respiratory disease (Horta 2013), otitis media (Bowatte 2015), increased rates of childhood diabetes and obesity (Horta 2015a), and increased dental disease (Peres 2015; Tham 2015). For women, there is good‐quality evidence that not breastfeeding is associated with increased risks of breast and ovarian cancer, diabetes (Chowdhury 2015; Rameez 2019), hypertension (Rameez 2019), and increased cardiovascular risk (Tschiderer 2022). Bartick 2017 in the USA attributed 3340 annual excess deaths to suboptimal breastfeeding, 78% of which were maternal due to myocardial infarction, breast cancer and diabetes; 721 excess paediatric deaths were due mainly to Sudden Infant Death Syndrome and necrotising enterocolitis. Lactational amenorrhoea is associated with exclusive/predominant breastfeeding and increases birth spacing when other forms of contraception are not available (Chowdhury 2015). Not being breastfed has an adverse impact on intelligence quotient (IQ), and educational and behavioural outcomes for the child (Heikkilä 2014; Heikkilä 2011; Horta 2015b; Quigley 2012). For many outcomes a dose‐response relationship exists, with the greatest benefit resulting from breastfeeding exclusively, with no added food or fluids, for around six months, with breastfeeding continuing thereafter as an important component of the infant’s diet (Kramer 2012). The negative impact of not breastfeeding has been demonstrated in a range of settings and population groups, though the balance of risks and benefits varies from setting to setting; for example, gastroenteritis will result in much higher mortality in low‐income countries (Horta 2013).
Few health behaviours have such a broad‐spectrum and long‐lasting impact on population health, with the potential to improve life chances, health and well‐being. Victora 2016 estimated that each year, 823,000 deaths in children under five years and 20,000 deaths from breast cancer could be prevented by near universal breastfeeding. The cost burden of not breastfeeding was estimated by Rollins 2016 to represent 0.49% of world gross domestic product. The cost burden includes the cost of caring for children and women with chronic disease as well as short‐term illness (Bartick 2010; Smith 2010). Bartick 2017 estimated that in the USA, 79% of $3 billion medical costs associated with suboptimal breastfeeding were maternal.
The established negative impact on a population of not breastfeeding has resulted in global and national support for encouraging the initiation and continuation of breastfeeding. The World Health Organization (WHO) recommends that, wherever possible, infants should be fed exclusively on breast milk until six months of age (WHO 2003), with breastfeeding continuing as an important part of the infant’s diet until at least two years of age. Other agencies and countries have endorsed the recommendation to breastfeed exclusively to around six months of age (EFSA Panel 2009; National Center for Health Statistics 2012).
Due to the lack of standardised infant feeding indicators in high‐income countries, it is difficult to compare rates of breastfeeding across high‐income countries, or between high‐income, and low‐ and middle‐income countries. Therefore, reported rates of breastfeeding need to be treated with caution. Victora 2016 suggested that, in general, there is an inverse relationship between breastfeeding rates and national wealth, though this relationship does not necessarily hold at the level of population subgroups. In high‐income countries, for example, the relationship is often seen to be the opposite, with rates higher amongst more affluent women (McAndrew 2012).
Although some high‐income countries such as, Norway and Finland have high rates of both initiation and continuation of breastfeeding (Cattaneo 2010), rates in many high‐income countries are low. Initiation rates have risen in some high‐income countries in recent years (NHS England 2014; U.S. Department of Health and Human Services 2011), but there remains a marked decline in breastfeeding within the first few weeks after initiation, and exclusive breastfeeding to six months is rare (Cattaneo 2010; McAndrew 2012; Scottish Information Services Division 2019).
Data from UNICEF 2021 show that in 2020 the average rate of exclusive breastfeeding for children nought to five months was 44% ranging from 26% in North America to 57% in South Asia (UNICEF 2021). This represents an increase from 37% reported in Victora 2016. However, rates of exclusive breastfeeding for children younger than six months vary widely; Peru and Rwanda reported rates of 65.3% and 80.9%, respectively (UNICEF 2021), while in Nigeria in 2018 the rate was only reported to be 28.7%. In some low‐ and middle‐income countries, cultural practices such as prelacteal feeds, and giving water or teas alongside breastfeeding, account for the low rates of exclusive breastfeeding (Kimani‐Murage 2011). This is particularly important as when breastfeeding continues for long periods of time, infant and young child mortality are reduced in the second year of life in low‐ and middle‐income countries (Victora 2016).
Infant feeding is strongly related to inequalities in health, and, far from being an individual decision made by each woman, is influenced most strongly by structural determinants of health. The range of different rates of initiation and continuation of breastfeeding in different settings globally demonstrates that the key factors influencing infant feeding rates are likely to be sociocultural and related to societal and subgroup norms, public policy, and the availability of appropriate care and support, both professional and lay (EU Project on Promotion of Breastfeeding 2004; Rollins 2016). In high‐income countries, for example, young mothers and women in low‐income groups, or women who ceased full‐time education at an early age, are least likely either to start breastfeeding or to continue for a period of time sufficient to benefit from the greatest health gain (McAndrew 2012). Migrant women have been shown to adopt breastfeeding practices that are more similar to the country in which they live, than the country of their birth (McLachlan 2006).
The early discontinuation of breastfeeding is not a decision that is taken lightly by women; it is associated with a high prevalence of problems such as painful breasts and nipples, concern about adequacy of milk supply and about the baby’s behaviour, and, in some settings, embarrassment related to breastfeeding in public. Many mothers report distress related to the decision to discontinue breastfeeding (McAndrew 2012) and poor mental health (Brown 2016; Gregory 2015), even in cultures where breastfeeding rates are high (Almqvist‐Tangen 2012). A key factor is the widespread lack of appropriate education for health professionals in the prevention and treatment of breastfeeding problems, which means that in a wide range of settings women commonly do not receive the quality of care needed from the health services (Cattaneo 2010; Renfrew 2006). Enkin 2000 notes that industrial societies, on the whole, do not provide women with the opportunity to observe other breastfeeding women before they attempt breastfeeding themselves. In such societies, where breastfeeding is not normative behaviour and women may find it socially challenging to breastfeed, women are at particular risk of finding a serious lack of support to continue breastfeeding.
Description of the intervention
‘Support’ is complex and can include several elements such as emotional and esteem‐building support (including reassurance and praise), practical help, informational support (including the opportunity to discuss and respond to women’s questions) and social support (including signposting women to support groups and networks) (Dykes 2006; Schmied 2011). Support also can include education and/or counselling (McFadden 2019). It can be offered in a range of ways, by health professionals or lay people, trained or untrained, in hospital and community settings. It can be offered to groups of women or one‐to‐one, it can involve mother‐to‐mother support, and it can include family members (typically fathers or grandmothers) and wider communities. Support can be offered proactively by contacting women directly, or reactively, by waiting for women to get in touch. It can be provided face‐to‐face, by telephone or new to this update, using digital technologies. It can involve only one contact or regular, ongoing contact over several months.
Support is a complex intervention that tackles the multifaceted challenge of enabling women to breastfeed, and it should not be surprising that it varies from setting to setting and from study to study. However, it is likely that different forms of support in different contexts will be differentially effective. The global Baby Friendly Hospital Initiative (Baby Friendly Initiative in some countries), which is a complex intervention incorporating 10 steps to successful breastfeeding, has been shown to be associated with increased breastfeeding rates (Labbok 2012; Pérez‐Escamilla 2016; Venancio 2011). An updated guideline and guidance for implementing The Baby Friendly Hospital Initiative was published in 2018 (WHO 2018).
In many settings, the health professionals who provide standard maternity care lack in‐depth knowledge of the prevention and treatment of breastfeeding problems. Therefore, training and education of health professionals and others who provide breastfeeding support is critical.
How the intervention might work
Support for breastfeeding women can work in different ways for different women. Timely, skilled support will help women to avoid or overcome breastfeeding problems that may lead to cessation of breastfeeding (WHO 2018a, Sinha 2015). In settings where breastfeeding is not the social norm, support can increase women’s belief in breastfeeding, and give them confidence to continue breastfeeding in the face of societal and family pressures that might undermine breastfeeding (MacVicar 2015). In settings where exclusive breastfeeding is rare, support can dispel myths about the need for additional foods or fluids alongside breastfeeding to meet babies’ nutritional needs (WHO 2018).
Why it is important to do this review
It is fundamentally important to examine the support that mothers receive when breastfeeding to determine what might be effective in helping women continue to breastfeed, whatever setting they live in. There is evidence that effective breastfeeding support interventions are cost‐effective and likely to realise a return on investment within a few years (Bartick 2017; Renfrew 2012a; Rollins 2016).
The purpose of this review is to examine interventions which provide extra support for mothers who are breastfeeding or considering breastfeeding, and to assess their impact on breastfeeding duration and exclusivity and, where recorded, on health outcomes and maternal satisfaction. This review is an update of the previously published version (McFadden 2017). The focus of this review is support for mothers and babies who are part of the general healthy population of their countries; mothers of premature and sick babies and mothers with some medical conditions have additional issues with breastfeeding, and interventions to support these mothers need to be reviewed separately. For this update, we have modified the eligibility criteria in two ways. First, we have included studies of breastfeeding support for women who experience caesarean birth to take account of increasing rates of caesarean births globally and to include women who are at increased risk of not breastfeeding (Prior 2012; Yisma 2019). Secondly, we have included support interventions provided using digital technologies in recognition that such technologies are increasingly accessible and available (Senbekov 2020). In addition, we have now also included perinatal mental health as a secondary outcome, due to the increasing evidence which suggests that perinatal mental health indicators influence breastfeeding outcomes (Dalga 2021). A Cochrane Review of breastfeeding education and support for mothers with multiple pregnancies is published and found a lack of randomised controlled trials (Whitford 2017). Whilst many support interventions include breastfeeding education for mothers, our review excludes interventions described as solely educational in nature and interventions with no postnatal component. A Cochrane Review of antenatal breastfeeding education for increasing breastfeeding duration has been published (Lumbiganon 2016), and one of interventions to promote the initiation of breastfeeding (Balogun 2016).
Specific objectives of this review are to describe forms of support which have been evaluated in controlled studies, and the settings in which they have been used. Given the heterogenous nature of the breastfeeding support interventions identified in the previous versions of the review, for this update we split the support interventions into two separate comparisons depending on whether they provided only breastfeeding support or if breastfeeding support was one component of a wider maternal and child health intervention (e.g. also providing services such as immunisations, intrapartum care, mental health support). We also wanted to better understand the characteristics of effective interventions via meta‐regression, and we received input from stakeholders in determining which categories should be included in this. Finally, it is important to note that the support interventions offered were in addition to standard care, which varied from setting to setting, though there are few settings in which standard care is consistently offered by people with training and skill in enabling women to breastfeed.
Objectives
-
To describe types of breastfeeding support for healthy breastfeeding women with healthy term babies.
-
To examine the effectiveness of different types of breastfeeding support interventions focusing on breastfeeding support provided on its own or breastfeeding support in combination with a wider maternal and child health intervention.
-
To examine the effectiveness of the following intervention characteristics on breastfeeding support:
-
type of support (e.g. face‐to‐face, telephone, digital technologies, group or individual support, proactive or reactive);
-
intensity of support (i.e. number of postnatal contacts);
-
person delivering the intervention (e.g. healthcare professional, lay person);
-
to examine whether the impact of support varied between high‐, and low‐ and middle‐income countries.
-
Methods
Criteria for considering studies for this review
Types of studies
All randomised or quasi‐randomised controlled trials, with or without blinding. Cluster‐randomised controlled trials were also eligible for inclusion.
Types of participants
Participants were healthy pregnant women considering or intending to breastfeed or healthy women who were breastfeeding healthy babies. Healthy women and babies were considered those who did not require additional medical care. Studies of women requiring additional medical care e.g. women with diabetes, women with HIV/AIDs, overweight or obese women were excluded. The inclusion criteria were amended in this update to include women undergoing caesarean section. Studies which focused specifically on women with additional care needs were excluded.
Types of interventions
Contact with an individual or individuals (either professional or volunteer) offering support which is supplementary to the standard care offered in that setting. Interventions could be delivered as either standalone breastfeeding support interventions (breastfeeding only), or breastfeeding support could be delivered as part of a wider maternal and newborn health intervention (breastfeeding plus) where additional services are also provided (e.g. vaccination, intrapartum care, well baby clinics). Contact with an individual or individuals (either professional or volunteer) offering support which is supplementary to the standard care offered in that setting
‘Support’ interventions eligible for this review could include elements such as reassurance, praise, information, and the opportunity to discuss and to respond to the mother’s questions, and could also include staff training to improve the supportive care given to women. It could be offered by health professionals or lay people, trained or untrained, in hospital and community settings. It could be offered to groups of women or one‐to‐one, including mother‐to‐mother support, and it could be offered proactively by contacting women directly, or reactively, by waiting for women to get in touch. This update now also includes support provided via digital technologies as well as support provided over the phone. Support could involve only one contact or regular, ongoing contact over several months. Studies were included if the intervention occurred in the postnatal period alone or also included an antenatal component. Interventions taking place in the antenatal period alone were excluded from this review, as were interventions described as solely educational in nature.
Types of outcome measures
The previous versions of the review measured women stopping any or exclusive breastfeeding at or before pre‐defined time points. However, this meant that studies which had relatively short follow‐ups (e.g. two months), were included in the stopping any or exclusive breastfeeding at six months outcomes. This led to heterogeneity in outcome measurement and does not reflect how breastfeeding is measured in the literature (i.e. at specific time points). For this version of the review, we have therefore amended the outcomes to measure the number of women stopping any or exclusive at the specific time point, rather than up to or before.
The previous version of this review (McFadden 2017) included only primary outcomes as the work had to be completed in a short period to inform the WHO guideline: Protecting, promoting and supporting breastfeeding in facilities providing maternity and newborn services. This update includes all outcomes which were included in Renfrew 2012b and also includes a new secondary outcome, maternal mental health.
Primary outcomes
-
Stopping any breastfeeding at six months postpartum.
-
Stopping exclusive breastfeeding at six months postpartum.
-
Stopping any breastfeeding at four to six weeks postpartum.
-
Stopping exclusive breastfeeding at four to six weeks postpartum.
Secondary outcomes
-
Stopping any breastfeeding at two, three‐four, nine and 12 months postpartum
-
Stopping exclusive breastfeeding at two, and three‐four, months postpartum
-
Maternal satisfaction with care
-
Maternal satisfaction with feeding method
-
All‐cause infant or neonatal morbidity (including infectious illness rates)
-
Maternal mental health
Search methods for identification of studies
The following methods section of this review is based on a standard template used by Cochrane Pregnancy and Childbirth.
Electronic searches
For this update, we searched Cochrane Pregnancy and Childbirth’s Trials Register by contacting their Information Specialist (11 May 2021).
The Register is a database containing over 34,000 reports of controlled trials in the field of pregnancy and childbirth. It represents over 30 years of searching.
Briefly, Cochrane Pregnancy and Childbirth’s Trials Register is maintained by their Information Specialist and contains trials identified from:
-
monthly searches of the Cochrane Central Register of Controlled Trials (CENTRAL) which contains results of Cochrane's centralised search of searched ClinicalTrials.gov and the WHO International Clinical Trials Registry Platform (ICTRP) ;
-
weekly searches of MEDLINE (Ovid);
-
weekly searches of Embase (Ovid);
-
monthly searches of CINAHL (EBSCO);
-
handsearches of 30 journals and the proceedings of major conferences;
-
weekly current awareness alerts for a further 44 journals plus monthly BioMed Central email alerts.
These search results are screened by two people who review the full text of all relevant trial reports identified through the searching activities described above. Based on the intervention described, each trial report is assigned a number that corresponds to a specific Pregnancy and Childbirth review topic (or topics), and is then added to the Register. The Information Specialist searches the Register for each review using this topic number rather than keywords. This results in a more specific search set that has been fully accounted for in the relevant review sections (Included studies; Excluded studies; Studies awaiting classification; Ongoing studies).
For full current search methods used to populate Pregnancy and Childbirth’s Trials Register including the detailed search strategies for CENTRAL, MEDLINE, Embase and CINAHL; the list of handsearched journals and conference proceedings, and the list of journals reviewed via the current awareness service, please follow this link.
Searching other resources
We searched the reference lists of retrieved studies.
We did not apply any language or date restrictions.
Data collection and analysis
For methods used in the previous version of this review, see McFadden 2017.
For this update the following methods were used for assessing the 561 reports that were identified as a result of the updated search.
Selection of studies
The results of the search were imported into Covidence. Two review authors independently assessed all the potential studies identified as a result of the search strategy for inclusion. We resolved any disagreement through discussion and consulted a third review author if required.
Screening eligible studies for scientific integrity/trustworthiness
Two review authors independently assessed for inclusion all the potential studies identified as a result of the search strategy. Any disagreements were resolved through discussion and when required, bt consulting a third reviewer.
A study flow diagram was created to map out the number of records identified, included, excluded or awaiting classification.
Screening eligible studies for scientific integrity/ trustworthiness
All studies meeting our inclusion criteria were also evaluated by two review authors against predefined criteria to select studies that, based on available information, are deemed to be sufficiently trustworthy to be included in the analysis. This included studies identified by the updated search and all studies included in previous versions of the review. The criteria are the following.
Research governance
• No prospective trial registration for studies published after 2010 without plausible explanation.
• When requested, trial authors refuse to provide/share the protocol and/or ethics approval letter.
• Trial authors refuse to engage in communication with the Cochrane Review authors.
• Trial authors refuse to provide individual patient data (IPD) data upon request with no justifiable reason.
Baseline characteristics
• Characteristics of the study participants being too similar (distribution of mean (standard deviation (SD)) excessively narrow or excessively wide, as noted by Carlisle 2017).
Feasibility
• Implausible numbers (e.g. 500 women with severe cholestasis of pregnancy recruited in 12 months).
• (Close to) zero losses to follow‐up without plausible explanation.
Results
• Implausible results (e.g. massive risk reduction for main outcomes with small ‐sample size).
• Unexpectedly even numbers of women ‘randomised’ including a mismatch between the numbers and the methods e.g. if they say no blocking was used but still end up with equal numbers, or they say they used blocks of 4, but the final numbers differ by 6.
Studies assessed as being potentially ‘high risk’ will be not be included in the review. Where a study is classified as ‘high risk’ for one or more of the above criteria we attempted to contact the study authors to address any possible lack of information/concerns. If adequate information remains unavailable, the study remained in ‘awaiting classification’ and the reasons and communications with the author (or lack of) described in detail.
The process is described fully in Figure 1.

Applying the trustworthiness screening tool criteria
Abstracts
Data from abstracts will only be included if, in addition to the trustworthiness assessment, the study authors have confirmed in writing that the data to be included in the review have come from the final analysis and will not change. If such information is not available/provided, the study will remain in, ‘awaiting classification’ (as above).
Data extraction and management
We designed and piloted a form to extract data using Covidence. For eligible studies, two review authors independently extracted information using the agreed form. We resolved discrepancies through discussion. Data were entered into RevMan Web software (RevMan Web 2020), and checked for accuracy.
When information regarding study methods and results was unclear, we attempted to contact authors of the original reports to provide further details.
Assessment of risk of bias in included studies
Two review authors independently assessed risk of bias for each study using the criteria outlined in the Cochrane Handbook for Systematic Reviews of Interventions (the Handbook) (Higgins 2011). Any disagreement was resolved by discussion or by involving a third assessor.
(1) Random sequence generation (checking for possible selection bias)
For each included study, we described the method used to generate the allocation sequence in sufficient detail to allow an assessment of whether it should produce comparable groups.
We assessed the method as:
-
low risk of bias (any truly random process, e.g. random number table; computer random number generator);
-
high risk of bias (any non‐random process, e.g. odd or even date of birth; hospital or clinic record number);
-
unclear risk of bias.
(2) Allocation concealment (checking for possible selection bias)
For each included study, we described the method used to conceal allocation to interventions prior to assignment and assessed whether intervention allocation could have been foreseen in advance of, or during recruitment, or changed after assignment.
We assessed the methods as:
-
low risk of bias (e.g. telephone or central randomisation; consecutively numbered sealed opaque envelopes);
-
high risk of bias (open random allocation; unsealed or non‐opaque envelopes, alternation; date of birth);
-
unclear risk of bias.
(3.1) Blinding of participants and personnel (checking for possible performance bias)
For each included study, we described the method used, if any, to blind study participants and personnel from knowledge of which intervention a participant received. We considered that studies were at low risk of bias if they were blinded, or if we judged that the lack of blinding unlikely to affect results. We assessed blinding separately for different outcomes or classes of outcomes.
We assessed the methods as:
-
low, high or unclear risk of bias for participants;
-
low, high or unclear risk of bias for personnel.
(3.2) Blinding of outcome assessment (checking for possible detection bias)
For each included study, we described the method used, if any, to blind outcome assessors from knowledge of which intervention a participant received. We assessed blinding separately for different outcomes or classes of outcomes.
We assessed methods used to blind outcome assessment as:
-
low, high or unclear risk of bias.
(4) Incomplete outcome data (checking for possible attrition bias due to the amount, nature and handling of incomplete outcome data)
For each included study, and for each outcome or class of outcomes, we described the completeness of data including attrition and exclusions from the analysis. We stated whether attrition and exclusions were reported and the numbers included in the analysis at each stage (compared with the total randomised participants), reasons for attrition or exclusion where reported, and whether missing data were balanced across groups or were related to outcomes. Where sufficient information was reported, or could be supplied by the trial authors, we planned to re‐include missing data in the analyses that we undertook.
We assessed methods as:
-
low risk of bias (e.g. no missing outcome data; missing outcome data balanced across groups);
-
high risk of bias (e.g. numbers or reasons for missing data imbalanced across groups; ‘as treated’ analysis done with substantial departure of intervention received from that assigned at randomisation);
-
unclear risk of bias.
(5) Selective reporting (checking for reporting bias)
For each included study, we described how we investigated the possibility of selective outcome reporting bias and what we found.
We assessed the methods as:
-
low risk of bias (where it is clear that all of the study’s prespecified outcomes and all expected outcomes of interest to the review have been reported);
-
high risk of bias (where not all the study’s prespecified outcomes have been reported; one or more reported primary outcomes were not prespecified; outcomes of interest are reported incompletely and so cannot be used; study fails to include results of a key outcome that would have been expected to have been reported);
-
unclear risk of bias.
(6) Other bias (checking for bias due to problems not covered by (1) to (5) above)
We described for each included study any important concerns we had about other possible sources of bias.
(7) Overall risk of bias
We made explicit judgements about whether studies were at high risk of bias, according to the criteria given in the Handbook (Higgins 2011).
Overall findings for our assessment of risk of bias in the included studies are set out in Figure 2 and Figure 3.

Risk of bias graph: review authors' judgements about each risk of bias item presented as percentages across all included studies

Risk of bias summary: review authors' judgements about each risk of bias item for each included study.
Measures of treatment effect
Dichotomous data
For dichotomous data, we presented results as summary risk ratios with 95% confidence intervals.
Continuous data
There are no continuous data in this review.
Unit of analysis issues
Cluster‐randomised trials
Sample sizes were adjusted using the methods described in the Handbook and by Donner 2000 incorporating an estimate of the intra‐cluster correlation coefficient (ICC) derived from the trial (if possible). Where cluster‐adjusted confidence limits were presented but not the ICC, the design effect was estimated from comparison with limits based on the raw numbers. We have synthesised the findings from individually‐ and cluster‐randomised trials provided that there was little heterogeneity between the study designs and the interaction between the effect of intervention and the choice of randomisation unit was considered to be unlikely. Sensitivity analyses were conducted to investigate the effect of including cluster‐randomised trials where no adjustment was possible.
Trials with multiple groups
In order to avoid 'double counting' in studies involving one control group and two different interventions groups, we split the control group number of events and participants in half, so that we could include two independent comparisons, as per methods described the Handbook [section16.5.4] (Higgins 2011).
Dealing with missing data
For all outcomes, analyses were carried out, as far as possible, on an intention‐to‐treat basis (i.e. all participants randomised to each group were included in the analyses). We followed one of the options outlined in the Cochrane handbook to deal with missing data (Deeks 2022), whereby all women randomised were included as the denominator. For missing participants we imputed an assumed worst‐case outcome (i.e. not breastfeeding). Sensitivity analyses were conducted to investigate the effect of excluding studies with high levels of attrition.
Assessment of heterogeneity
We assessed statistical heterogeneity in each meta‐analysis using the Tau², I² and Chi² statistics. We regarded heterogeneity as substantial if the I² was greater than 30% and either the Tau² was greater than zero, or there was a low P value (less than 0.10) in the Chi² test for heterogeneity. Heterogeneity was explored via meta‐regression.
Assessment of reporting biases
For all outcomes where there are at least 10 studies, funnel plots were generated. We examined plots visually to see whether there was any evidence of asymmetry that might suggest different treatment effects in smaller studies, which may indicate publication bias (Harbord 2006). If there was funnel plot asymmetry in the presence of high levels of heterogeneity, we planned to compare the findings of our random‐effects model with a fixed‐effect model (Sterne 2011). If the random‐effects model showed a more beneficial effect, we would have considered this as being suggestive as the intervention was being more effective in smaller studies. If it did not show a beneficial effect, we considered that asymmetry may be a result of high levels of heterogeneity.
Data synthesis
The effectiveness of these characteristics was examined in relation to ‘breastfeeding only’ and ‘breastfeeding plus’ interventions. ‘Breastfeeding only’ interventions were dedicated breastfeeding support interventions, and ‘breastfeeding plus’ interventions were interventions with a broader focus that included breastfeeding support as a component. A categorisation of interventions based on the reported behaviour change techniques was attempted to enable effectiveness comparisons across single‐ and multi‐component breastfeeding support interventions, however, this grouping was considered insufficiently informative to establish effectiveness comparison due to a lack of breastfeeding support interventions using only one behaviour change technique.
We carried out statistical analysis using RevMan Web (RevMan Web 2020). At the outset, we had anticipated that there would be some heterogeneity between studies in terms of the interventions and the populations studied, we therefore decided to use random‐effects meta‐analysis for combining data. Random‐effects meta‐analysis estimates the average treatment effect, and this may not always be clinically meaningful. Furthermore, where there is high heterogeneity the applicability of the overall effect estimate is likely to vary in different settings, and we therefore advise caution in the interpretation of results. The random‐effects summary was treated as the average of the range of possible treatment effects, and we discuss the clinical implications of treatment effects differing between trials. If the average treatment effect was not clinically meaningful, we planned not to combine trials. Since we used random‐effects analyses, the results were presented as the average treatment effect with 95% confidence intervals, and the estimates of Tau² and I².
Subgroup analysis and investigation of heterogeneity
Meta‐regression was used to further assess statistical heterogeneity for the four primary outcomes when there was a sufficient number of studies included in the analyses (i.e. at least 10 observations per characteristic modelled (Deeks 2022)).
As the likelihood of false‐positives increases with the number of studies included in a meta‐analysis (Deeks 2022), the maximum number of characteristics included was four. The specific categories examined were determined prior to the meta‐analyses being conducted, but as this review is an update, it cannot be considered truly pre‐specified. The categories were selected in conjunction with stakeholders who were provided with a list of seven categories and were asked to consider which four they felt would be of most use. This list comprised of the six subgroups from the previous version of the review (McFadden 2017) and an additional category of income status of country (high‐income country versus low‐ and middle‐income countries), was selected as it is well‐established that breastfeeding rates are lower in high‐income countries (Victora 2016), and support tends to have a greater effect in middle‐ and low‐income countries (Haroon 2013; Jolly 2012b). Based on the findings of the subgroup analyses from the previous version (McFadden 2017), and knowledge of the evidence and practice, the review team and stakeholders were in agreement that the following four categories were of most use for the meta‐regression.
-
By type of supporter (professional versus lay person, or both).
-
By type of support (face‐to‐face versus telephone support versus digital versus combination).
-
By intensity of support (low (<4) versus moderate (4 to 8) versus high (9 or more)).
-
By income status of country (high‐income country (HIC) versus middle‐income country (MIC), and low‐income country) (LIC).
Whilst we had planned to analyse intensity of support as a continuous variable, the nature and reporting of interventions meant this was not possible. Many interventions did not specify a specific number of contacts and instead, a range of contacts with the women was reported (e.g. 10 to 14 contacts). We therefore categorised them using the categories from previous versions of the review.
Univariable meta regression models were used to investigate the association between outcomes of any or exclusive breastfeeding at four to six weeks and at six months with who provided the support (professional, non‐professional or both), the intensity of support (graded as low, moderate or high), the type of support (F2F, F2f+phone, F2F+phone+digital, phone alone or digital alone) and the income of the country (HIC versus low‐and middle‐income countries L(MICs)). Interventions aimed at breastfeeding only were separated from those for breastfeeding plus as per the main analyses. In many of the subcategories there were few studies providing data and the results should be viewed accordingly. We aimed to show trends rather than give definitive results and these analyses should be viewed as primarily exploratory. All regressions were determined a‐priori. R version 4.1.1 metareg command was used for the meta regression analyses (Viechtbauer 2010).
Sensitivity analysis
We performed sensitivity analyses based on risk of bias. First, we separated studies at low risk of bias for allocation concealment from studies at high or unclear risk. Secondly, we separated studies at low risk of bias from incomplete outcome data from studies at high or unclear risk to assess the impact of attrition on our findings (Deeks 2022). Finally, sensitivity analyses were conducted to investigate the effect of including cluster‐randomised trials where no adjustment was possible.
Summary of findings and assessment of the certainty of the evidence
The certainty of the evidence was assessed using the GRADE approach as outlined in the GRADE handbook in order to assess the quality of the body of evidence relating to the following outcomes.
-
Stopping any breastfeeding at four to six weeks, two months, three to four months,six months, nine months and 12 months.
-
Stopping exclusive breastfeeding at four to six weeks, two months, three to four months and six months.
The outcomes used to evaluate the following comparisons were:
-
breastfeeding support only versus usual care (summary of findings Table 1);
-
breastfeeding support plus versus usual care (summary of findings Table 2).
We used GRADEpro Guideline Development Tool to import data from RevMan Web (RevMan Web 2020) to create summary of findings tables. A summary of the intervention effect and a measure of certainty for each of the above outcomes were produced using the GRADE approach. The GRADE approach uses five considerations (study limitations, consistency of effect, imprecision, indirectness and publication bias) to assess the certainty of the body of evidence for each outcome. The evidence can be downgraded from 'high certainty' by one level for serious (or by two levels for very serious) limitations, depending on assessments for risk of bias, indirectness of evidence, serious inconsistency, imprecision of effect estimates or potential publication bias.
Results
Description of studies
Results of the search
For this 2021 update, we assessed 560 new trial reports plus the 10 trials (16 reports) that were awaiting classification and the eight ongoing studies in the previous version of the review (McFadden 2017). Due to the change in the inclusion criteria, we reassessed six studies that had been previously excluded from McFadden 2017. Therefore, in total 590 trial reports were assessed as part of this review update.
On assessment of these 590 trial reports we found the following:
-
72 new studies (in 142 reports) that met the revised inclusion criteria;
-
68 ongoing studies (in 75 reports);
-
16 studies in 20 reports that would require classification at a later date;
-
24 secondary trial reports of previously included studies;
-
190 irrelevant studies;
-
110 studies in 139 reports that did not meet the included criteria and were therefore excluded (see Excluded studies).
See: Figure 4 (study flow diagram)

Study flow diagram
Screening eligible studies for trustworthiness
All studies (100 previously included and 72 newly identified studies) were assessed against Cochrane’s criteria for trustworthiness. Of the 100 previously included studies, we requested further information for 38 studies, and for the new studies identified in this update, we required clarification for 43 studies.
In total, we received satisfactory responses for 27 studies. In total 54 studies were re‐classified to awaiting classification. Twenty‐six studies were not included for the following single reasons.
-
Ten studies, published after 2010, did not appear to have a prospective trial registration and evidence of their approved protocol was not provided on our request (Cangol 2017; Chan 2016; Efrat 2015; Gu 2016; Khresheh 2011; Maslowsky 2016; McQueen 2009; McQueen 2011; Talungchit 2020 ;Yilmaz 2019).
-
Five studies were retrospectively registered with a clinical trial database, and we did not receive evidence that the study protocol had ethical approval before recruitment commenced (Ara 2018; Chaves 2019; Hu 2020; Khan 2017; de Rocha 2021).
-
Three studies reported results which required clarification (Froozani 1999; Graffy 2004Haider 2000).
-
Three studies reported no loss to follow‐up (Pugh 2002 ; Shariat 2018), or did not provide enough data for loss to follow‐up to be confirmed (Winterburn 2003).
-
Two studies had not fully explained their randomisation process; therefore, we are unable to confirm how equal numbers of participants were randomised to each arm of the trial (Lynch 1986; Wolfberg 2004).
-
One study did not report the demographics of their study population (Sjolin 1979), and a further study reported the demographic of the whole study population rather than by allocation (Jones 1985), therefore we were unable to assess if randomisation had successfully produced study groups that were not too similar.
-
One study had reported preliminary results, as confirmed by the author and therefore, will not contribute data to this review (Demirci 2020a)
The remaining 28 studies raised more than one concern when assessed using the trustworthiness checklist. Due to the high number of combinations of concerns identified we have grouped together studies with two concerns, three concerns and more than three concerns.
-
Sixteen studies had two issues that required further explanation (Bortolini 2012; Bayati 2020; Caldeira 2008; Chen 1993; Gupta 2019; Hall 1978; Howell 2014; Huang 2019; Parsa 2020; Rotheram‐Fuller 2017; Serafino‐Cross 1992; Simonetti 2012; Srinivas 2015; Sun 2017; Wilhelm 2015; Wu 2014).
-
Seven studies had three reasons identified (Bloom 1982; Bueno 2020; Kohan 2017; Kojuri 2009; Li 2018; Parsa 2018; Pugh 1998).
-
Five studies had more than three areas of concern (Gabida 2015; Jenner 1988; Kuppuswamy 2016; Vidas 2011; Whalen 2011).
Numerous attempts were made to contact all lead authors for the above studies; however, we failed to contact several authors. A full breakdown of the assessment for each reclassified study can be found in Characteristics of studies awaiting classification.
Included studies
This updated review includes 116 trials (83 individually‐randomised trials and 33 cluster‐randomised trials). Of which 103 studies contribute data (77 individually‐randomised trials and 26 cluster‐randomised trials). More than 98,816 mother‐infant pairs are included in the review.
Description of included studies (n = 116)
Of the 116 studies meeting the inclusion criteria in the 2021 update, 103 contributed data to the review. Thirteen studies did not contribute data to the meta‐analysis for the following reasons. First, cluster‐randomised studies used cross‐sectional data to measure breastfeeding rates in infants of differing ages rather than at a specific follow‐up point (Greenland 2016; Menon 2016a ; Menon 2016b; Nguyen 2017; Kurdi 2020; Cresswell 2019). Secondly, four studies did not report the data in a way that could be used in a meta‐analysis (Ransjo‐Arvidson 1998; Reeder 2014; Wasser 2017; McKeever 2002). Thirdly, Nikiema 2017, reported exclusive breastfeeding in all infants aged 0‐5 months rather than at a specific time point. Fourthly, Ellis 1984 measured breastfeeding in a way that could not be interpreted. Ekstrom 2006 only contributed data to a non‐breastfeeding outcome and thus does not contribute data to the meta‐analysis.
It should be noted that three publications present findings for more than one study (Bonuck 2014; Menon 2016 and Tylleskar 2011). Bonuck 2014 reports one trial called the BINGO trial and the other called the PAIRING trial. In order to differentiate between these two trials in this review the BINGO trial is identified via the reference Bonuck 2014a and the PAIRING trial via the reference Bonuck 2014b. Menon 2016 reports the findings of trials conducted in two countries. Therefore, for the purpose of this review, Menon 2016a is the reference for the trial conducted in Bangladesh and Menon 2016b refers to the Vietnam trial. Similarly, Tylleskar 2011 reports the findings of trials from three countries; Burkina Faso (Tylleskar 2011a), Uganda (Tylleskar 2011b), and South Africa (Tylleskar 2011c). Finally, nine studies contained two studied intervention arms (Aidam 2005; Bonuck 2014a; Fu 2014; Gross 1998; Sellen 2014; M'Liria 2020; McLachlan 2016; Taylor 2017; Yotebieng 2015).
The total number of mother‐infant pairs included in the analysis of this review is 98,816. This total was 74,656 in the previous version of this review (McFadden 2017).
Participants living in 42 countries are included in the review, an increase from the previously reported 29 countries. Using the World Bank classification of countries by income, 21 of the new included studies in the review were conducted in high‐income countries (HICs), six in upper middle‐income countries (UMICs), 16 in lower middle‐income countries (LMICs), and five in low‐income countries (LICs). Although most included studies continue to be conducted in high‐income countries, the proportion of studies from LMICs has increased from 5% to 17%. All countries classifications are based on their classification on the day of access as opposed to their classification when the trial was conducted (https://data.worldbank.org/?locations=XM-XN-XT-XD, accessed 18 March 2022).
-
Eight studies with 7645 participants (7.7% of the total number of participants) were conducted in LICs (Burkina Faso, Cresswell 2019; Daniele 2018; Nikiema 2017; Tylleskar 2011a; Ethiopia, Abdulahi 2021; Syria, Bashour 2008; and Uganda, Tylleskar 2011b; and Yemen, Kurdi 2020) .
-
Twenty‐two studies with 14,326 participants (14.5%) were conducted in LMICs (Bangladesh, Menon 2016a; Nguyen 2017; the Democratic Republic of the Congo, Yotebieng 2015; Ghana, Aidam 2005; India, Bhandari 2003; Nair 2017; Patel 2018; Iran, Araban 2018; Salehi Manzar 2019; Kenya, Sellen 2014; Kimani‐Murage 2017; Kimani‐Murage 2021; M'Liria 2020; Mituki‐Mungiria 2020; Ochola 2013; Unger 2018; Nigeria, Ogaji 2020; Pakistan, Sikander 2015; Vietnam, Huynh 2018;Menon 2016b; and Zambia, Greenland 2016 ;Ransjo‐Arvidson 1998).
-
Seventeen studies with 22,654 participants (22.9%) were conducted in upper‐middle income countries (Belarus, Kramer 2001; Brazil, Albernaz 2003; Barros 1994; Cavalcanti 2019; Coutinho 2005; de Oliveira 2006; Leite 2005; Santiago 2003; China, Ke 2018; Wu 2020; Lebanon, Nabulsi 2019; Malaysia, Tahir 2013; Mexico, Morrow 1999; South Africa, Tylleskar 2011c; Thailand, Kupratakul 2010; Prasitwattanaseree 2019; Turkey, Aksu 2011).
-
Sixty‐five studies with 54,191 participants (54.8%) were conducted in HICs (Australia, Elliott‐Rudder 2014; Forster 2018; McDonald 2010; McLachlan 2016; Quinlivan 2003; Redman 1995; Wen 2011; Canada, Abbass‐Dick 2015; Dennis 2002; Ellis 1984; Gagnon 2002; Laliberte 2016; McKeever 2002; Mongeon 1995; Porteous 2000; Chile, Lucchini 2013; Croatia, Puharic 2020; Denmark, Kronborg 2007; Nilsson 2017; France, Labarere 2005; Germany, Hoffmann 2019; Hong Kong, Fu 2014; Lok 2021; Italy, Di Napoli 2004; Japan, Hongo 2020; the Netherlands, Kools 2005; Mejdoubi 2014; New Zealand, Taylor 2017; Singapore, Su 2007; Spain, Balaguer Martinez 2018; Franco‐Antonio 2019; Gonzalez‐Darias 2020; Sweden, Ekstrom 2006; UK, Barnes 2017; Clarke 2020; Hoddinott 2009; Hoddinott 2012; Jolly 2012a; Morrell 2000; Muirhead 2006; Stockdale 2008; USA, Ahmed 2020; Anderson 2005; Chapman 2004; Cloutier 2018; Bonuck 2005; Bonuck 2014a; Bonuck 2014b; Brent 1995; Bunik 2010; Chapman 2004; Di Meglio 2010; Edwards 2013; Frank 1987; Gross 1998; Gross 2016; Grossman 1990; Hans 2018; Hopkinson 2009; Linares 2019; Lutenbacher 2018; Martinez‐Brockman 2018; Paul 2012; Petrova 2009; Pugh 2010; Reeder 2014; Uscher‐Pines 2020; Wambach 2009; Wrenn 1997).
Methods used in trials
The 116 studies include 83 individually‐randomised trials and 33 cluster‐randomised trials. Most are two‐arm randomised control trials, however 20 studies are either three‐ or four‐ arm randomised control trials. The following decisions on which arms to include in the review have been made for these studies.
-
Six of the three‐arm studies contribute two interventions to the review (Aidam 2005; Fu 2014; Sellen 2014; M'Liria 2020; McLachlan 2016; Yotebieng 2015).
-
Three of the four‐arm studies contribute two interventions to the review (Bonuck 2014a; Gross 1998; Taylor 2017), with the third arm not included in the analysis as it is a non‐breastfeeding support intervention
-
Four studies have a non‐breastfeeding support intervention which has been excluded from the analysis (Ochola 2013; Salehi Manzar 2019; Su 2007; Unger 2018).
-
Four studies have two similar breastfeeding support intervention arms which have been combined for analysis to be evaluated against the control arm of the study (Bashour 2008; Frank 1987; Morrow 1999; Santiago 2003).
-
Two studies evaluated the intervention against an active and non‐active control arm. For this review the active control has been included as the comparator (Puharic 2020; Wambach 2009).
-
One study does not contribute data to the review (Reeder 2014)
Participants and setting
Socioeconomic and health status
Participants were women from the general healthy population of their countries. However, 52 studies recruited women from groups at high risk of health inequalities or health inequities within their country. Most of these were conducted in high‐income countries (HICs); 23 are USA studies and 10 from other HICs (Balaguer Martinez 2018; Barnes 2017; Clarke 2020; Forster 2018; Hoddinott 2009; Hoddinott 2012; McLachlan 2016; Mejdoubi 2014; Quinlivan 2003; Wen 2011).
Of the 33 studies from HICs, 18 recruited women defined as low‐income or as living in a disadvantaged area (Balaguer Martinez 2018; Bonuck 2005; Bonuck 2014a; Bonuck 2014b; Brent 1995; Clarke 2020; Cloutier 2018; Forster 2018; Gross 1998; Grossman 1990; Hoddinott 2009; Hoddinott 2012 Martinez‐Brockman 2018; McLachlan 2016; Petrova 2009; Pugh 2010; Reeder 2014; Wen 2011). Nine studies recruited women from non‐white ethnic backgrounds (Anderson 2005; Bunik 2010; Chapman 2004; Edwards 2013; Gross 2016; Hopkinson 2009; Linares 2019; Lutenbacher 2018; Wasser 2017). Six studies recruited teenage or young mothers (Barnes 2017; Hans 2018; Mejdoubi 2014; Di Meglio 2010; Quinlivan 2003; Wambach 2009).
Two studies from the upper‐middle income country, Brazil (Barros 1994; Leite 2005) recruited low‐income women, with the third Brazilian study (Coutinho 2005) describing the recruitment area to be one of “widespread poverty”. Tylleskar 2011c recruited in the poorest rural area in South Africa.
Participants in the remaining 15 studies were recruited from areas described to be of high poverty, deprivation, and poor child health outcomes. Participants came from five sub‐Saharan Africa countries (Cresswell 2019; Greenland 2016; Sellen 2014; Kimani‐Murage 2017; M'Liria 2020; Mituki‐Mungiria 2020; Ochola 2013; Tylleskar 2011a; Tylleskar 2011b); three countries in South Asia (Bhandari 2003; Menon 2016a; Patel 2018; Sikander 2015); Vietnam (Menon 2016b), and Yemen (Kurdi 2020).
Wrenn 1997 from the USA, recruited women with a partner serving in the armed forces.
Inclusion criteria of studies
Most participants were recruited either during pregnancy or in the early postnatal period. Four cluster‐randomised trials recruited both pregnant and postnatal women (Cloutier 2018; Kurdi 2020; Hoddinott 2009; Morrow 1999). Bhandari 2003 recruited participants based on the birth of a child. However, three studies do not report if recruitment was aimed at pregnant or postnatal women (Menon 2016a; Menon 2016b and McLachlan 2016), rather recruitment was all eligible women living within geographical clusters.
The majority of the studies in the review recruited both primiparous and multiparous women, however 28 studies recruited only first‐time mothers, women who would have no previous experience of breastfeeding (Abbass‐Dick 2015; Araban 2018; Aksu 2011; Brent 1995; Bunik 2010; Chapman 2004; Clarke 2020; Coutinho 2005; Dennis 2002; de Oliveira 2006; Forster 2018; Fu 2014; Gonzalez‐Darias 2020; Huynh 2018; Ke 2018; Lok 2021; McDonald 2010; Mejdoubi 2014;Prasitwattanaseree 2019; Puharic 2020; Quinlivan 2003; Redman 1995; Salehi Manzar 2019; Stockdale 2008; Wambach 2009; Wen 2011; Wrenn 1997; Wu 2020).
Caesarean section births
Previously, breastfeeding interventions designed to support women who had given birth by birth caesarean section were excluded from this review. This exclusion criteria was removed for this update and previously excluded studies were re‐screened. However, we found no new studies to include in the review focussed on supporting breastfeeding women after a caesarean section birth.
However, only eight studies in the review have birth by caesarean section as an exclusion criterion (Aksu 2011; Daniele 2018; Franco‐Antonio 2019; Gonzalez‐Darias 2020; Prasitwattanaseree 2019; Edwards 2013; Ransjo‐Arvidson 1998; Tahir 2013), therefore, women who gave birth by caesarean section are included in this review. We are unable to accurately confirm how many of the remaining studies do include women who gave birth by caesarean section as this information has not been routinely documented.
Interventions
From the 116 studies, 125 interventions have been analysed in this review. Nine studies in the review evaluated two breastfeeding support interventions against a control arm of standard care. For the purposes of this review they are identified as:
-
Aidam 2005 (pre‐ peri‐ and post‐natal) and Aidam 2005 (peri‐ and post‐natal)
-
Bonuck 2014a (lactation consultant (LC)) and Bonuck 2014a (LC and electronic prompt (EP))
-
Gross 1998 (Peer) and Gross 1998 (Peer and video)
-
Sellen 2014 (cell phone based peer support(CPS)) and Sellen 2014 (peer‐led support groups (PSG))
-
M'Liria 2020 (mother‐to‐mother support group with education and support (MES)) and M'Liria 2020 (mother‐to‐mother support group with education and support and income generating activities (MESIGA))
-
McLachlan 2016 (hHealth visitor (HV) only) and McLachlan 2016 (HV and drop in)
-
Taylor 2017 (food, physical activity and breastfeeding (FAB) and Taylor 2017 (Combo)
-
Yotebieng 2015 (Baby Friendly Initiative (BFI 1‐9) and Yotebieng 2015 (BFI 1‐10)
For further explanation of these additional interventions please see the Characteristics of included studies.
Intervention components: Breastfeeding only/Breastfeeding plus
Of the 125 interventions included in the review, 91 interventions comprised only breastfeeding support components. The remaining 34 interventions aimed to increase breastfeeding rates as part of a multi‐component intervention, which aimed to improve other aspects of child health, such as vaccination rates, or sleep.
-
Eight interventions included components on maternal nutrition and child feeding practices (e.g. complementary feeding; Bhandari 2003; Kimani‐Murage 2017; Kimani‐Murage 2021; Menon 2016a; Menon 2016b; Nguyen 2017; Nikiema 2017; Patel 2018).
-
Six interventions were part of community‐based post‐partum care packages (Bashour 2008; Laliberte 2016; Morrell 2000; Paul 2012; Quinlivan 2003; Ransjo‐Arvidson 1998).
-
Five interventions were focused on obesity prevention (Cloutier 2018; Hoffmann 2019; Taylor 2017; Wasser 2017; Wen 2011).
-
Two interventions were evaluations of the Family Nurse Partnership (Barnes 2017; Mejdoubi 2014), and a further one intervention was an evaluation of a similar home visiting programme in which vulnerable women receive additional support during pregnancy and post‐partum (Lutenbacher 2018).
-
Two studies were evaluations of interventions of maternity care more generally (Daniele 2018; Hans 2018).
-
Two interventions provided maternal nutritional supplementation (Huynh 2018; Nguyen 2017).
-
Two interventions provided support for wider care issues (e.g. hygiene, illnesses; Kurdi 2020; Nair 2017).
-
Two interventions provided financial incentives in addition to breastfeeding support and maternal nutrition support (Kurdi 2020; M'Liria 2020 MESIGA arm only).
-
Two interventions also provided support for family planning (Redman 1995; Unger 2018).
-
One intervention was doula support (support provided by a person who is not a healthcare professional) during pregnancy, birth and post‐partum (Edwards 2013).
-
One intervention considered different components of diarrhoea control (Greenland 2016).
-
One intervention included a sleep component (Taylor 2017).
Level of the intervention
Interventions in the review generally supported women directly, with 103 interventions designed to be received by either pregnant and postnatal women, or postnatal women only. Three additional interventions included the woman and a supporter of the woman’s choice (Abbass‐Dick 2015; Daniele 2018; Wasser 2017) and three encompassed community engagement through activities such as mass media campaigns and community meetings (Greenland 2016; Menon 2016a and Menon 2016b). Nine interventions were designed to include components for both women and staff (training or guidance); five cluster‐randomised trials (Cresswell 2019; Elliott‐Rudder 2014;Kimani‐Murage 2017; Kimani‐Murage 2021; Nikiema 2017); and three individually‐randomised trials (Bonuck 2014a (LC & EP); Brent 1995; Di Napoli 2004; Ellis 1984).
Six interventions evaluated the impact of additional training or materials for staff providing breastfeeding support; four cluster‐randomised trials (Bhandari 2003; Ekstrom 2006; Kramer 2001; Yotebieng 2015 (BFI 1‐9) and Yotebieng 2015 (BFI 1‐10)), and one individually‐randomised trial; (Santiago 2003). One cluster‐randomised trial evaluated a policy of providing breastfeeding support groups (Hoddinott 2009).
Breastfeeding support: proactive/indirect
Women received breastfeeding support proactively in 85 interventions. In 32 studies women had access to both proactive and reactive support (Albernaz 2003; Anderson 2005; Bonuck 2005; Chapman 2004; Dennis 2002; Di Meglio 2010; Ellis 1984; Frank 1987; Gagnon 2002; Gross 1998 (peer support); Gross 1998 (peer support + motivational video); Grossman 1990; Hongo 2020; Hopkinson 2009; Ke 2018; Kimani‐Murage 2021; Linares 2019; Lok 2021; M'Liria 2020 (MES); M'Liria 2020 (MESIG); McLachlan 2016 (HV + drop in); Muirhead 2006; Ogaji 2020; Petrova 2009; Porteous 2000; Pugh 2010; Redman 1995; Salehi Manzar 2019;Stockdale 2008).
In six studies support was reactive only (Ahmed 2020; Cavalcanti 2019; Sellen 2014 (CPS); Gonzalez‐Darias 2020; Uscher‐Pines 2020; Wu 2020). Two interventions delivered additional support during routine visits (Kools 2005 and Kramer 2001).
One‐to‐one/group support
One‐to‐one contact between the breastfeeding supporter and the breastfeeding mother was available in 115 of the 125 interventions. In 19 of these 115 interventions, additional group support was also available to women (Aidam 2005 (pre‐ perinatal and post‐natal); Aidam 2005 (perinatal and post‐natal); Araban 2018; Cresswell 2019; de Oliveira 2006; Ellis 1984; Gross 1998 (peer support); Gross 1998 (peer support and motivational interview); Gross 2016, Huynh 2018, Kimani‐Murage 2021; Kurdi 2020; Kupratakul 2010; Menon 2016b; Nair 2017; Redman 1995; Salehi Manzar 2019; Stockdale 2008; Wambach 2009).
The interventions evaluated by Abbass‐Dick 2015 and Daniele 2018 offered individual support to women and their partners. In Daniele 2018, the intervention provided additional group support for the partners only.
Eight interventions were group‐support interventions (Barnes 2017; Cavalcanti 2019; Ekstrom 2006; Greenland 2016; Hoddinott 2009; Sellen 2014 (GPS); M'Liria 2020 (MES); M'Liria 2020 2019 (MESIG)).
Breastfeeding support from professional/lay supporters
In the previous version of this review, the people providing breastfeeding support were categorised as 'professional', 'lay and professional' or 'lay'. By continuing to use those categories, the 125 interventions in this update comprise 74 interventions with professional support, 14 of lay and professional support, and 35 of lay support. In two studies we were unable to classify the people providing the support.
In view of the growing body of work evaluating breastfeeding peer support, we have distinguished between this and other kinds of lay support, following the definition by Dennis 2002: “Peer support is provided by lay individuals who are not part of the client’s own embedded network, who possess experiential knowledge of the targeted behaviour (i.e. successful breastfeeding skills) and similar qualities (i.e. age, socioeconomic status, ethnicity, residency etc.) in order to aid the client during a time of actual or potential stress (i.e. the initiation and continuation of breastfeeding).
The person providing support is considered further via meta‐regression Subgroup analysis and investigation of heterogeneity.
Professional
In 74 interventions professional support was provided by a variety of medical, midwifery, nursing and allied health professionals (for example, nutritionists, lactation consultants and researchers).
Professional and lay
Professionals provided breastfeeding support with other community health workers or volunteers in seven interventions (Bhandari 2003; Coutinho 2005; Cresswell 2019; Menon 2016a; Mituki‐Mungiria 2020; Nair 2017; Nguyen 2017). Seven further interventions combined professional support with peer support (Linares 2019; Lucchini 2013; McLachlan 2016 (HV + drop in); Nabulsi 2019; Pugh 2010; Wambach 2009; Wasser 2017).
Lay
Lay people provided breastfeeding support in 35 studies. In 29 of these, the lay people were peer supporters. In the remaining six studies lay support was provided by doulas (Hans 2018); social assistants (Barros 1994); trained breastfeeding counsellors (Frank 1987); postnatal support workers (Morrell 2000); community health workers (Kurdi 2020) ,and outreach workers (Lutenbacher 2018).
Training in breastfeeding support
Overall, 97 of the 116 studies reported that the people delivering the intervention had been trained to provide breastfeeding support (58/69 professional, 11/13 professional and lay, and 32/32 peer/lay). In the two studies where the skill level of the support provider was unclear, training was provided in one (Cloutier 2018) and in the other it was unclear what training had been provided (Salehi Manzar 2019).
Of the 58 studies where professionals provided breastfeeding support, 34 received additional training in breastfeeding support. Whereas 29 studies relied on the existing knowledge and training of the professional breastfeeding supporter. In 18 of the 24 studies, the professional supporters were International Board Certified Lactation Consultants (IBCLC) (Ahmed 2020; Bonuck 2005; Bonuck 2014a; Bonuck 2014b; Brent 1995; de Oliveira 2006; Fu 2014; Grossman 1990; Huynh 2018; Kools 2005; Laliberte 2016; McKeever 2002; Patel 2018; Petrova 2009; Redman 1995; Su 2007; Tahir 2013; Uscher‐Pines 2020). The training received in the remaining six studies was unclear (Bunik 2010; Cavalcanti 2019; Kupratakul 2010; Ogaji 2020; Prasitwattanaseree 2019; Taylor 2017).
Eleven of the 13 studies providing professional and lay support reported training. In two studies the professionals were lactation consultants (Linares 2019; Nabulsi 2019), and in three studies the lay supporter was a trained community health worker (Bhandari 2003; Coutinho 2005; Nair 2017). Four studies do not detail the training provided (Menon 2016a; Cresswell 2019; Nguyen 2017; Wambach 2009). The remaining studies provided three days (Mituki‐Mungiria 2020) and 100 hours of training (Wasser 2017).
Peer supporters were provided training in all but one study (31/32) (Greenland 2016). Five studies did not detail the training given (Barros 1994; Di Megelio 2010; Frank 1987 and Sellen 2014 and Morrow 1999). The amount of training received varied greatly in the remaining studies. Peer supporters received less than a day of training in three studies (Dennis 2002; Forster 2018 and Gonzalez‐Darias 2020). In seven studies training was between one and 3threedays (Aksu 2011; Clarke 2020; Hongo 2020; Leite 2005; Lok 2021; M'Liria 2020; Mongeon 1995). Aksu 2011, Jolly 2012a; and Leite 2005 trained peer supporters using the WHO training manual (18hours). Abdulahi 2021 also based training on the WHO manual however their training extended to five days. Other established breastfeeding training was utilised; La Leche League 30 hours (Chapman 2004) and UNICEF 40 hours (Lutenbacher 2018 and Ochola 2013). Peer support workers received a week of training in three studies (Tylleskar 2011a; Tylleskar 2011b; Tylleskar 2011c). Six days of nutritional education formed part of a 12‐day training course for peer supporters in Kurdi 2020. In one study, women, infants, and children (WIC)training lasted five weeks (Gross 1998), and postnatal support workers required eight weeks of training. In Hans 2018 and Edwards 2013, doulas provided the support and had received extensive training as a requirement of their role.
Three studies provided initial training with additional follow‐up training or supervision (Hopkinson 2009; Martinez‐Brockman 2018; Muirhead 2006).
Mode of support (face‐to‐face/telephone/SMS or digital)
Breastfeeding support was delivered face‐to‐face in 104 of the 125 interventions; in 64 of the 104 interventions, face‐to‐face support was the only mode of support available. Face‐to‐face interventions tended to be delivered one‐to‐one, with only six out of the 64 being conducted in a group setting (Barnes 2017; Greenland 2016; Hoddinott 2009; Sellen 2014 (GPS); M'Liria 2020 (MES) and M'Liria 2020(MESIG)). All 64 interventions, apart from Kramer 2001, were proactive. Additional reactive support was also available in seven interventions (Cresswell 2019; Gagnon 2002 Kimani‐Murage 2021; Kramer 2001; McLachlan 2016 (HV +drop in); M'Liria 2020(MES); M'Liria 2020 (MESIG); Stockdale 2008). All eight studies conducted in low‐income countries evaluated interventions that offered only face‐to‐face support.
In 36 interventions, face‐to‐face support was complemented with telephone support. The telephone element in these 36 interventions was mostly proactive; with only 11 of the 36 interventions offering reactive telephone support (Albernaz 2003; Anderson 2005; Chapman 2004; Ellis 1984; Grossman 1990; Hopkinson 2009; Linares 2019; Nabulsi 2019). Most telephone support was scheduled after face‐to‐face support, however, in two studies, telephone contact was made before face‐to‐face contact occurred (Brent 1995; Nilsson 2017). Seven interventions offered women telephone support throughout the face‐to‐face phase of the intervention (Bonuck 2005; Gross 1998 (peer support); Gross 1998 (peer support + motivational interview); McDonald 2010; Muirhead 2006; Porteous 2000; Pugh 2010).
Clarke 2020 evaluated an intervention that delivered support face‐to‐face and by telephone and SMS messaging. In Ke 2018, support was available face‐to‐face, by telephone and through an online messaging service. Lok 2021 offered support by all four modes; face‐to‐face, telephone, SMS and online messages. It is unclear if additional support methods were offered by Ekstrom 2006.
Telephone support alone was evaluated in 14 studies (Balaguer Martinez 2018; Bunik 2010; Dennis 2002; Di Meglio 2010; Forster 2018; Hoddinott 2012; Hongo 2020; Sellen 2014; Mongeon 1995; Ogaji 2020; Patel 2018; Puharic 2020; Reeder 2014; Tahir 2013). All but three of these studies (Balaguer Martinez 2018; Sellen 2014; Tahir 2013) were conducted in high‐income countries.
Five interventions combined proactive and reactive telephone support (Dennis 2002; Di Meglio 2010; Forster 2018; Hongo 2020; Ogaji 2020). Only Sellen 2014 (CPS) offered fully reactive telephone support that women could access as required.
In contrast, the five fully digital interventions provided reactive support (Ahmed 2020; Cavalcanti 2019; Gonzalez‐Darias 2020; Uscher‐Pines 2020; Wu 2020). Cavalcanti 2019 was the only study that explored on‐line group breastfeeding support. Gonzalez‐Darias 2020 was the only study that provided on‐line peer support. All studies were conducted in high‐income (Ahmed 2020; Gonzalez‐Darias 2020 and Uscher‐Pines 2020) or upper‐middle income countries (Cavalcanti 2019 and Wu 2020).
Two studies, Martinez‐Brockman 2018 and Unger 2018 evaluated proactive breastfeeding support by SMS two‐way messaging. Martinez‐Brockman 2018 was conducted in a high‐income setting but targeted low‐income women, and delivered by professional supporters. Unger 2018 was conducted in a lower‐middle income country with support delivered by peer supporters.
Mode of support is considered further via meta‐regression Subgroup analysis and investigation of heterogeneity.
Support with an antenatal component
Over half of the studies (63/116) recruited women during their pregnancy. All these studies included an antenatal element in the evaluated intervention apart from two studies (Quinlivan 2003; Su 2007). Su 2007, a three‐arm randomised trial; the third arm evaluated antenatal education, but as there was not a postnatal support element in this arm of the intervention, it has been excluded from analysis.
Three cluster‐randomised trials (Menon 2016a; Menon 2016b; Greenland 2016 ) recruited mothers of young infants living in specified cluster communities and it is therefore likely that pregnant women would have been amongst the participants. Nguyen 2017 recruited both pregnant and postnatal women, however due to the data collection methods used in this study, the recruited pregnant women would not have received the intervention by the data collection endpoint, and therefore these data were not included in this review.
Three one‐to‐one interventions were offered to both pregnant and women in the early postnatal period (Cloutier 2018; Morrow 1999, ;Kurdi 2020) and, in the one study of breastfeeding support in groups (Hoddinott 2009), pregnant women and breastfeeding mothers could be invited to attend groups.
Intensity of the intervention
Intervention intensity was grouped as follows: low intensity (three or fewer contacts); moderate intensity (four to eight contacts); high intensity (nine or more contacts). Twenty‐one interventions were specified as low intensity, 41 as moderate intensity, and 44 interventions were specified as high intensity. The remaining 19 did not specify the intensity of the intervention.
See Included studies for further details. Intensity of the intervention is considered further via meta‐regression Subgroup analysis and investigation of heterogeneity.
Control group care
Nine of the 116 studies were undertaken in hospital settings with Baby‐friendly accreditation (Aksu 2011; Cavalcanti 2019; Chapman 2004; Coutinho 2005; de Oliveira 2006; Linares 2019; Ogaji 2020; Stockdale 2008; Tahir 2013). In two community‐based cluster‐randomised trials (Hoddinott 2009; Kronborg 2007), most of the maternity hospitals in which the participants had given birth had Baby Friendly accreditation and in a third, Morrow 1999, around 50% of the hospitals were accredited. In two further studies, Baby‐friendly accreditation was being worked towards in the recruiting sites and therefore this may have influenced the intervention success (Patel 2018 and McDonald 2010). Araban 2018 reported that the over 80% of Iranian hospitals had gained Baby Friendly accreditation however, it is not clear if recruiting sites were accredited.
In three studies the intervention was either the implementation of the Baby‐friendly Hospital Initiative (BFHI) (Yotebieng 2015) or based on the Baby Friendly philosophy (Kimani‐Murage 2021; Kramer 2001); in these studies the control group did not access this level of care.
Twenty‐seven studies recruited in sites that were not accredited, however, due to fewer than 40% (45/116) of included studies reporting on the Baby‐friendly accreditation status their recruiting sites it is unclear if the remaining studies were conducted in areas where BFHI is standard or not.
In 97 studies, the control groups were described to receive the standard care for the study population. Current care provision may differ from what was offered within the study period and due to the large differences in standard care provision both between and within countries a description of control group care has been included in the Characteristics of included studies table.
In six studies the care received by the control group is either not reported or unclear (Kurdi 2020; Kools 2005; Kramer 2001;Mongeon 1995; Morrow 1999; Nilsson 2017)
Thirteen studies compared the study intervention either against an active control arm (Puharic 2020; Wambach 2009) or a control group which offered participants additional care to the standard care available to non‐participants (Aidam 2005; Anderson 2005; Cavalcanti 2019; Hoddinott 2012; Lutenbacher 2018; Nair 2017; Ransjo‐Arvidson 1998; Salehi Manzar 2019; Sikander 2015; Tylleskar 2011c;Wasser 2017).
Please see Characteristics of included studies table for further details.
Outcomes
We performed meta‐analysis to assess the effectiveness of 'breastfeeding only' interventions for the four primary outcomes (Analysis 1.1; Analysis 1.2; Analysis 1.3; Analysis 1.4) and five of the secondary outcomes (Analysis 1.5; Analysis 1.6; Analysis 1.7; Analysis 1.8; Analysis 1.10). Meta‐analysis was performed to assess the effectiveness of 'breastfeeding plus' interventions for the four primary outcomes(Analysis 2.1; Analysis 2.2; Analysis 2.3; Analysis 2.4) and four of the secondary outcomes (Analysis 2.5; Analysis 2.6; Analysis 2.7; Analysis 2.8).
There was considerable heterogeneity in how and when the non‐breastfeeding secondary outcomes were measured and consequently meta‐analysis was not appropriate. A narrative summary of the results is presented instead.
Duration of any and/or exclusive breastfeeding
For the studies that contribute data, the most commonly reported outcome was the secondary outcome of stopping exclusive breastfeeding at three to four months (59 interventions). For the primary outcomes the most commonly reported outcome was stopping exclusive breastfeeding at six months (58 studies). For the other primary outcomes, 46 studies measured stopping any breastfeeding at six months, 45 studies measured stopping any breastfeeding at 4‐6x weeks, and 52 measured stopping exclusive breastfeeding at 4‐6 weeks. For the other secondary outcomes, 20 studies measured stopping any breastfeeding at two months, 28 measured stopping exclusive breastfeeding at two months, 41 measured stopping any breastfeeding at three to four months, one measured stopping any breastfeeding at nine months and four measured stopping any breastfeeding at 12 months.
When data on both seven‐day and 24‐hour recall were provided, we selected the data for 24‐hour recall.
Non‐breastfeeding outcomes
In this update, a total of 35 studies reported non‐breastfeeding outcomes by intervention group. Twelve studies measured maternal satisfaction with care (Abbass‐Dick 2015; Bashour 2008; Clarke 2020; Ekstrom 2006; Kools 2005; Jolly 2012a; Laliberte 2016; Morrow 1999; Patel 2018; Paul 2012; Stockdale 2008; Wrenn 1997). Sixteen studies measured maternal satisfaction with feeding method (Ahmed 2020; Bashour 2008; Bunik 2010; Dennis 2002; de Oliveira 2006; Ekstrom 2006; Hoddinott 2009; Hongo 2020; Hopkinson 2009; Jolly 2012a; Labarere 2005; Nilsson 2017 Patel 2018; Petrova 2009; Puharic 2020; Uscher‐Pines 2020; Wrenn 1997). Twenty‐one studies measured a range of outcomes related to infant morbidity (Abdulahi 2021 Anderson 2005; Bashour 2008; Bhandari 2003; Bunik 2010; Chapman 2004; Frank 1987; Hans 2018; Kramer 2001; Laliberte 2016; Morrow 1999; Nair 2017; Ogaji 2020; Nilsson 2017; Paul 2012; Petrova 2009; Puharic 2020; Quinlivan 2003; Tylleskar 2011a; Tylleskar 2011b; Tylleskar 2011c; Wrenn 1997; Yotebieng 2015). Finally, new to this update, seven studies measured outcomes relating to perinatal mental health (Ahmed 2020; Barnes 2017; Clarke 2020; Hans 2018; Laliberte 2016; Lutenbacher 2018; Paul 2012).
Dates of study
The included studies were conducted between 1984 and 2020. Six studies commenced in the 1980s; 14 in the 1990s; 38 are from the 2000’s and 47 were conducted between 2010 and 2020. Eleven studies did not report their study dates. The publication dates of these studies are one in the 1980’s; two in the 1990’s; one in the 2000s and seven between 2010 and 2019.
Funding sources
Forty‐nine trials received funding from a national funding agency and 18 received funding from a regional funder, who funded research in a specific locality. International funding agencies support 12 trials in the review as did charity or philanthropist funders.
Four trials received funding from commercial organisations (Franco‐Antonio 2019; Huynh 2018; Ochola 2013; Kronborg 2007), two of which are involved in the infant formula industry (Huynh 2018; Ochola 2013).
Two studies are the published results of funded PhD studies (Elliott‐Rudder 2014; Santiago 2003), and one was funded by the US Air Force (Wrenn 1997).
Eighteen trials have not reported their funding source, or we did not receive this information in the translation of the paper.
Full details of funders are given in theCharacteristic of included studies table.
Declarations of interest
In 47 studies the authors declared that they had no conflicts of interest.
Unfortunately, 65 studies do not include any statement regarding potential conflicts of interest, either in published results or in the translation we received.
Four authors declared that they had competing demands. In one study the authors declared their belief that breastfeeding is best for babies, but confirmed they have no other competing interests (Muirhead 2006). Jolly 2012a declared that study funders had been involved in the recruitment and management of peer supporters. The authors of Clarke 2020 declared funding they had received to conduct additional breastfeeding support research. Finally, the authors of Huynh 2018, declared that they were employees of the commercial funder of the research.
Excluded studies
The previous version of this review excluded 147 studies. Five previously excluded studies were re‐screened for this update due to the change inclusion criteria: three studies evaluating a digital‐based intervention (Ahmed 2020, Edwards 2013a, Giglia 2015), and two studies targeting women after a caesarean section birth (Sakha 2008 and Sakkaki 2013). On screening, two of the five studies remain excluded (Edwards 2013a; Sakha 2008), two have been moved to Studies awaiting classification (Giglia 2015; Sakkaki 2013), one was included (Ahmed 2020). In addition, two previously excluded reports were commentaries on included studies which have now been linked to their primary studies (Fu 2014; Relton 2018). One final study which hs been excluded as "not a research paper" has been re‐classified as "awaiting classification" as we are unable to link this paper to a primary study (Rowe 1990). We have excluded a further 110 studies.
Thus, 249 studies have been excluded with reasons (see Characteristics of excluded studies).
We excluded 136 trials because the intervention was not relevant to this review. Excluded studies include those that examined educational interventions where the focus was on instruction rather than on supporting breastfeeding women to continue breastfeeding; studies of more general interventions in the postnatal period and interventions carried out in the antenatal period only with no postnatal support component.
Any studies that were not a randomised controlled trials was excluded. A total of 53 studies were excluded for this reason.
We excluded 49 studies as they did not focus on healthy mothers with healthy, term infants. For example, several trials were designed to support the breastfeeding of premature babies; low birthweight babies; multiples or babies with additional health complications. Likewise, studies that recruited mothers with health concerns that may impact on their ability to breastfeeding were also excluded. Finally, studies that recruited only partners of breastfeeding mothers were excluded.
Of the remaining trials, 11 were excluded because the comparator was not either standard care or an alternative non‐breastfeeding intervention. Four references were excluded as they were not research papers.
Further details of these, and other excluded studies, can be found in the Characteristics of excluded studies.
Risk of bias in included studies
Each trial was assessed for risk of bias as outlined in the Methods section (see Figure 2 and Figure 3).
Allocation
Random sequence generation: We assessed random sequence generation as ‘low risk of bias’ in almost 75% of the studies; 85 out of 116 studies included in the review. We deemed 27 of the studies to be of unclear risk and just 4 out of 116 studies to be high risk (de Oliveira 2006; Grossman 1990; Redman 1995; Wrenn 1997). Most of these studies were deemed high risk due to the methods of randomisation being inadequate and easily anticipated.
We assessed that just under half the included studies were low risk for allocation concealment; 56 out of 116 studies. A further 51 studies were deemed as unclear risk of allocation concealment. Only 9 out of 116 included studies in the review were assessed as high risk for allocation concealment/selection bias (Aidam 2005; de Oliveira 2006; Grossman 1990; Ke 2018; Menon 2016a; Menon 2016b; Nikiema 2017; Nilsson 2017; Wrenn 1997). Most of these studies were deemed high risk as the method of concealment could have been subject to manipulation.
Blinding
Blinding participants and personnel: with interventions of this type, it is very difficult to assess risk of bias associated with blinding. Both the mothers and the staff providing care would probably be aware that they were either receiving or delivering an intervention. In studies where there was randomisation at the clinic level, all women may have been exposed to the same intervention, and contamination between groups would thereby be reduced, but there may still have been a risk of response bias if outcomes were reported to staff providing care. We therefore assessed 84 out of 116 included studies to be at high risk of bias associated with blinding (performance bias and detection bias). The remaining 32 studies were considered as unclear risk of bias for blinding, this was mostly due to lack of information reported in the studies regarding blinding of participants and personnel.
Blinding of outcome assessment: We deemed that as most of the studies had asked women to report on their breastfeeding in the last 24 hours, regardless of control or intervention, it was not possible for participants to be truly blinded to outcome assessments. Therefore, we assessed no studies as being at a low risk of bias for this domain and all studies were assessed as high risk.
Incomplete outcome data
We deemed just under half of the included studies to be low risk of bias for incomplete outcome data; 56 out of 116 studies. The remaining studies were almost evenly split between high‐risk and unclear risk of attrition bias; 29 and 31, respectively. Loss to follow‐up was a particular problem in studies where women were recruited in the antenatal period.
Selective reporting
We assessed that just over a quarter of the studies, 32 out of 116, were low risk for selective reporting bias. Only 16 studies were considered high risk for selective outcome reporting. The majority, 68 out of 116, were deemed to be of unclear risk. Most of these, 45 out of 68, were pre‐2010 when there were fewer requirements for the publication of a protocol. The trustworthiness checklist required that we contact authors who published studies after 2010 and did not have a prospectively registered trial. In the case of 23 studies, the authors did provide some evidence of a protocol, but there was insufficient information on data collection and outcomes to judge this domain and these were categorised as unclear risk of bias.
Other potential sources of bias
We have noted any other concerns about bias (including any apparent baseline imbalance between randomised groups) in the Characteristics of included studies tables along with further information about the judgements we made about risk of bias for each included study. We deemed just over half the studies to have unclear risk of other potential sources of bias; 59 of 116 studies. Forty‐three studies were considered low risk and 14 assessed as high risk. The main reasons for high risk of bias in this domain are as follows: concerns around baseline imbalances (Cloutier 2018; Elliott‐Rudder 2014; Franco‐Antonio 2019; Hoddinott 2012; Kurdi 2020; Nabulsi 2019; Patel 2018; Wu 2020); concerns around clustering (Cloutier 2018; M'Liria 2020; Patel 2018); industry funding (Huynh 2018; Ochola 2013); concerns around additional interventions which can aid breastfeeding (Lucchini 2013); and not implementing the intervention fully in the groups (Fu 2014)
Effects of interventions
See: Summary of findings 1 Summary of findings table ‐ Breastfeeding support only compared to usual care; Summary of findings 2 Summary of findings table ‐ Support plus compared to usual care for healthy breastfeeding women with healthy term babies
Interventions to support breastfeeding versus usual care: 108 studies
Comparison 1. Breastfeeding only support interventions versus usual care
Outcome 1.1: Stopping any breastfeeding at six months postpartum
Thirty studies (reporting on 33 interventions) with 14,610 women measured cessation of any breastfeeding at six months post‐partum Analysis 1.1.
'Breastfeeding only' interventions probably has a small beneficial effect on the number of women who continue breastfeeding beyond six months, with fewer women in the groups that receive support stopping breastfeeding by this time (average risk ratio (RR) 0.93, 95% confidence interval (CI) 0.89 to 0.97; moderate ‐certainty evidence). However, there was high heterogeneity for this outcome and results should therefore be interpreted with caution (Tau² = 0.01, I² = 63%, Chi² = 85.6116.09, P < 0.00001).
Sensitivity analysis using only studies assessed as having a low risk of bias for allocation concealment demonstrated a similar positive treatment effect on breastfeeding at up to six months (RR 0.94, 95% CI 0.89 to 0.99). Sensitivity analysis using only studies assessed as having a low risk of bias for incomplete outcome data showed a more beneficial treatment effect (RR 0.86, 95% CI 0.79 to 0.93).
Visual examination of a funnel plot for this outcome suggested asymmetry Figure 5. However, due to the high levels of heterogeneity this needs to be interpreted with caution. To explore this further, we compared the random‐effects estimate with the fixed‐effect estimate. The fixed‐effect estimate was very similar (RR 0.94, 95% CI 0.91 to 0.96), which suggests that asymmetry may be a result of between study heterogeneity, rather than a small‐study effect.

Funnel plot of comparison: 1 Breastfeeding only support versus usual care, outcome: 1.1 Stopping breastfeeding (any) at 6 months
Meta‐regression demonstrated no differences between explanatory variables (person providing intervention, intensity, type of support or income status of country) see Table 1.
| Factor | Number of studies | Number of women | RR (95% CI) | P value | Total model statistics | ||||
| Tau2 | Chi2 | df | P value | I2 | |||||
|
| 33 |
|
|
|
|
|
|
|
|
| PERSON: |
|
|
|
| 0.0074 | 83.1435 | 30 | <0.0001 | 58.56 |
| Professional | 22 | 10214 | 1 |
|
|
|
|
|
|
| Non‐Professional | 8 | 3366 | 0.958 (0.866, 1.060) | 0.406 |
|
|
|
|
|
| Prof + Non‐prof | 3 | 1030 | 1.037 (0.911, 1.181) | 0.583 |
|
|
|
|
|
| Unspecified | 0 | ‐ | ‐ |
|
|
|
|
|
|
|
|
|
|
|
|
|
|
|
|
|
| INTENSITY: |
|
|
|
| 0.0060 | 74.3190 | 29 | <0.0001 | 52.73 |
| Low | 5 | 2159 | 1 |
|
|
|
|
|
|
| Moderate | 5 | 962 | 0.913 (0.796, 1.047) | 0.194 |
|
|
|
|
|
| High | 17 | 6276 | 0.939 (0.841, 1.048) | 0.262 |
|
|
|
|
|
| Unspecified | 6 | 5213 | 0.989 (0.877, 1.115) | 0.857 |
|
|
|
|
|
|
|
|
|
|
|
|
|
|
|
|
| SUPPORT: |
|
|
|
| 0.0072 | 81.8609 | 28 | <0.0001 | 61.13 |
| F2F | 11 | 7508 | 1 |
|
|
|
|
|
|
| F2F and phone | 13 | 3681 | 1.009 (0.918, 1.109) | 0.857 |
|
|
|
|
|
| F2F, phone and digital | 1 | 103 | 0.984 (0.710, 1.364) | 0.924 |
|
|
|
|
|
| Phone | 6 | 2820 | 1.002 (0.888, 1.132) | 0.972 |
|
|
|
|
|
| Digital | 2 | 498 | 0.845 (0.648, 1.102) | 0.213 |
|
|
|
|
|
|
|
|
|
|
|
|
|
|
|
|
| INCOME: |
|
|
|
|
|
|
|
|
|
| LMIC | 7 | 3037 | 1 |
| 0.0052 | 81.7673 | 31 | <0.0001 | 53.32 |
| HMIC | 26 | 11573 | 1.069 (0.967, 1.183) | 0.193 |
|
|
|
|
|
CI: confidence interval;RR: risk ratio.
Outcome 1.2: Stopping exclusive breastfeeding at six months postpartum
Forty studies (reporting on 44 interventions) with 16,332 women measured cessation of exclusive breastfeeding at six months post‐partum Analysis Analysis 1.2.
'Breastfeeding only' interventions may have a small beneficial effect on the number of women exclusively breastfeeding at six months (average RR 0.90, 95% CI 0.88 to 0.93; moderate‐certainty evidence). However, there was high heterogeneity for this outcome and results should therefore be interpreted with caution (Tau² = 0.01; Chi² = 593.36, df = 43 (P < 0.00001); I² = 93%).
Sensitivity analysis using only those studies assessed as having a low risk of bias for allocation concealment revealed that results still favoured the intervention group, although the effect estimate was slightly reduced in the studies at low risk of bias (average RR 0.95, 95% CI 0.91 to 0.98). Sensitivity analysis using only studies assessed as having a low risk of bias for incomplete outcome data showed a more beneficial treatment effect (RR 0.83, 95% CI 0.77 to 0.89). A sensitivity analysis omitting the one arm of the cluster‐randomised study (M'Liria 2020), for which a design effect could not be calculated changed the effect size and confidence intervals marginally and demonstrated the same positive treatment effect (average RR 0.91, 95% CI 0.88 to 0.94).
Visual examination of a funnel plot for this outcome suggested asymmetry Figure 6. However, due to the high levels of heterogeneity this needs to be interpreted with caution. To explore this further, we compared the random‐effects estimate with the fixed‐effect estimate. The fixed‐effect estimate was very similar (RR 0.92, 95% CI 0.91 to 0.94), which suggests that asymmetry may be a result of between study heterogeneity, rather than a small‐study effect.

Funnel plot of comparison 1: Breastfeeding only support versus usual care, outcome: 1.2 Stopping exclusive breastfeeding at 6 months
Meta‐regression (Table 2), identified that moderate intensity support was associated with a more beneficial intervention effect over the baseline of low support (RR 0.82, 95% CI 0.70 to 0.95, P = 0.010). However, there was no difference for high intensity support (RR 0.95, 95% CI 0.82 to 1.10, P = 0.48) or unspecified support (RR 0.95, 95% CI 0.79 to 1.15, p = 0.60). The meta‐regression also suggested that support interventions may have less of a beneficial effect in high income countries (RR 1.15, 95% CI 1.05 to 1.27, P = 0.003). There were no differences between person providing support and type of support.
|
|
|
|
|
| Total model statistics |
| |||
| Factor | Number of interventions | Number of women | RR (95% CI) | P value | Tau2 | Chi2 | P value | I2 |
|
|---|---|---|---|---|---|---|---|---|---|
|
| 44 |
|
|
|
|
|
|
|
|
| PERSON: |
|
|
|
| 0.0251 | 233.3179 | 40 | <0.0001 | 97.31 |
| Professional | 28 | 11780 | 1 |
|
|
|
|
|
|
| Non‐Professional | 12 | 3663 | 0.966 (0.853, 1.093) | 0.583 |
|
|
|
|
|
| Prof + Non‐prof | 3 | 749 | 1.024 (0.832, 1.259) | 0.826 |
|
|
|
|
|
| Unspecified | 1 | 140 | 0.345 (0.149, 0.799) | 0.013 |
|
|
|
|
|
|
|
|
|
|
|
|
|
|
|
|
| INTENSITY: |
|
|
|
| 0.0233 | 244.6064 | 40 | <0.0001 | 96.02 |
| Low | 7 | 5603 | 1 |
|
|
|
|
|
|
| Moderate | 14 | 2896 | 0.815 (0.696, 0.953) | 0.010 |
|
|
|
|
|
| High | 18 | 6315 | 0.949 (0.822, 1.096) | 0.476 |
|
|
|
|
|
| Unspecified | 5 | 1518 | 0.952 (0.789, 1.147) | 0.603 |
|
|
|
|
|
|
|
|
|
|
|
|
|
|
|
|
| SUPPORT: |
|
|
|
| 0.0245 | 218.5338 | 39 | <0.0001 | 96.37 |
| F2F | 20 | 6027 | 1 |
|
|
|
|
|
|
| F2F and phone | 13 | 6647 | 1.113 (0.982, 1.260) | 0.093 |
|
|
|
|
|
| F2F, phone and digital | 1 | 20 | 1.199 (0.779, 1.845) | 0.409 |
|
|
|
|
|
| Phone | 8 | 3043 | 1.059 (0.919, 1.220) | 0.425 |
|
|
|
|
|
| Digital | 2 | 595 | 1.016 (0.793, 1.303) | 0.898 |
|
|
|
|
|
|
|
|
|
|
|
|
|
|
|
|
| INCOME: |
|
|
|
| 0.0187 | 230.0321 | 42 | <0.0001 | 96.31 |
| LMIC | 22 | 5622 | 1 |
|
|
|
|
|
|
| HMIC | 22 | 10710 | 1.151 (1.047, 1.265) | 0.003 |
|
|
|
|
|
|
|
|
|
|
|
|
|
|
|
|
CI: confidence interval;RR: risk ratio.
Outcome 1.3: Stopping any breastfeeding at four to six weeks postpartum
Thirty‐six studies (reporting on 38 interventions) with 11,413 women measured cessation of any breastfeeding at 4‐6 weeks post‐partum Analysis 1.3.
'Breastfeeding only' interventions may have a beneficial effect on the number of women any breastfeeding at four to six weeks (average RR 0.88, 95% CI 0.79 to 0.97; moderate‐certainty evidence). However, there was high heterogeneity for this outcome and results should therefore be interpreted with caution (Tau² = 0.05; Chi² = 111.51, df = 37 (P < 0.00001); I² = 67%).
Sensitivity analysis using only those studies assessed as having a low risk of bias for allocation concealment revealed that results still favoured the intervention group, although the effect size was slightly increased in the studies at low risk of bias (average RR 0.86, 95% CI 0.76 to 0.98). Sensitivity analysis using only studies assessed as having a low risk of bias for incomplete outcome data showed a considerably more beneficial treatment effect (RR 0.74, 95% CI 0.63 to 0.87).
Visual examination of a funnel plot for this outcome suggested asymmetry Figure 7. However, due to the high levels of heterogeneity this needs to be interpreted with caution. To explore this further, we compared the random‐effects estimate with the fixed‐effect estimate. The fixed‐effect estimate was similar (RR 0.91, 95% CI 0.86 to 0.96), which suggests that asymmetry may be a result of between study heterogeneity, rather than a small‐study effect.

Funnel plot of comparison 1: Breastfeeding only support versus usual care, outcome: 1.3 Stopping breastfeeding (any) at 4‐6 weeks
Meta‐regression demonstrated no differences between explanatory variables (person providing intervention, intensity, type of support or income status of country). See Table 3.
| Factor | Number of studies | Number of women | RR (95% CI) | P value | Total model statistics | ||||
| Tau2 | Chi2 | df | P value | I2 | |||||
|
| 37 |
|
|
|
|
|
|
|
|
| PERSON: |
|
|
|
| 0.0909 | 110.94 | 34 | <0.0001 | 76.55 |
| Professional | 27 | 7526 | 1 |
|
|
|
|
|
|
| Non‐Professional | 8 | 2882 | 0.963 (0.717, 1.293) | 0.801 |
|
|
|
|
|
| Prof + Non‐prof | 2 | 774 | 1.182 (0.723, 1.934) | 0.505 |
|
|
|
|
|
| Unspecified | 0 | ‐ | ‐ | ‐ |
|
|
|
|
|
|
|
|
|
|
|
|
|
|
|
|
| INTENSITY: |
|
|
|
| 0.0966 | 100.86 | 33 | <0.0001 | 75.74 |
| Low | 11 | 4548 | 1 |
|
|
|
|
|
|
| Moderate | 8 | 1323 | 0.749 (0.504, 1.115) | 0.155 |
|
|
|
|
|
| High | 15 | 4019 | 0.991 (0.732, 1.342) | 0.953 |
|
|
|
|
|
| Unspecified | 3 | 1292 | 1.349 (0.839, 2.168) | 0.217 |
|
|
|
|
|
|
|
|
|
|
|
|
|
|
|
|
| SUPPORT/TYPE: |
|
|
|
| 0.1056 | 108.26 | 33 | <0.0001 | 79.59 |
| F2F | 11 | 4631 | 1 |
|
|
|
|
|
|
| F2F and phone | 17 | 3893 | 1.027 (0.754, 1.398) | 0.866 |
|
|
|
|
|
| F2F, phone and digital | 0 | ‐ | ‐ | ‐ |
|
|
|
|
|
| Phone | 7 | 2173 | 0.923 (0.624, 1.364) | 0.687 |
|
|
|
|
|
| Digital | 2 | 485 | 1.437 (0.707, 2.919) | 0.316 |
|
|
|
|
|
|
|
|
|
|
|
|
|
|
|
|
| INCOME: |
|
|
|
| 0.0770 | 104.47 | 35 | <0.0001 | 76.01 |
| LMIC | 7 | 2688 | 1 |
|
|
|
|
|
|
| HMIC | 30 | 8494 | 1.257 (0.903, 1.750) | 0.175 |
|
|
|
|
|
CI: confidence interval;RR: risk ratio.
Outcome 1.4 Stopping exclusive breastfeeding at four to six weeks postpartum
Forty‐two (reporting on 45 interventions) with 14,544 women measured cessation of exclusive breastfeeding at 4‐6 weeks post‐partum Analysis 1.4.
'Breastfeeding only' interventions may have a beneficial effect on the number of women exclusively breastfeeding at 4‐6 weeks (average RR 0.83, 95% CI 0.76 to 0.90; moderate‐certainty evidence). However, there was high heterogeneity for this outcome and results should therefore be interpreted with caution (Tau² = 0.05; Chi² = 672.57, df = 44 (P < 0.00001); I² = 93%).
Sensitivity analysis using only those studies assessed as having a low risk of bias for allocation concealment revealed that results still significantly favoured the intervention group, although the effect size was slightly increased in the studies at low risk of bias (average RR 0.81, 95% CI 0.72 to 0.92). Sensitivity analysis using only studies assessed as having a low risk of bias for incomplete outcome data showed a more beneficial treatment effect (RR 0.77, 95% CI 0.69 to 0.86). A sensitivity analysis omitting the one arm of the cluster‐randomised study (M'Liria 2020) for which a design effect could not be calculated changed the effect size and 95% CI marginally (average RR 0.84, 95% CI 0.77 to 0.91).
Visual examination of a funnel plot for this outcome suggested some asymmetry Figure 8. However, due to the high levels of heterogeneity this needs to be interpreted with caution. To explore this further, we compared the random‐effects estimate with the fixed‐effect estimate. The fixed‐effect estimate was similar (RR 0.88, 95% CI 0.85 to 0.91), which suggests that asymmetry may be a result of between study heterogeneity, rather than a small‐study effect.

Funnel plot of comparison: Breastfeeding only support versus usual care, outcome: 1.4 Stopping exclusive breastfeeding at 4‐6 weeks
Meta‐regression (Table 4), identified that moderate intensity support was associated with a more beneficial intervention effect over the baseline of low support (RR 0.79, 95% CI 0.63 to 0.99, P = 0.04). However, there was no difference for high intensity support (RR 1.01, 95% CI 0.84 to 1.23, p = 0.88) or unspecified support (RR 1.07, 95% CI 0.75 to 1.15, p = 0.71, P = 0.71). Similarly, there were no differences for any of the other explanatory variables
| Factor | Number of studies | Number of women | RR (95% CI) | P value | Total model statistics | ||||
| Tau2 | Chi2 | df | P value | I2 | |||||
|
| 45 |
|
|
|
|
|
|
|
|
| PERSON: |
|
|
|
|
|
|
|
|
|
| Professional | 31 | 11266 | 1 |
| 0.0480 | 231.253 | 42 | <00001 | 91.75 |
| Non‐Professional | 11 | 2529 | 0.853 (0.710, 1.025) | 0.09 |
|
|
|
|
|
| Prof + Non‐prof | 3 | 749 | 1.288 (0.939, 1.766) | 0.116 |
|
|
|
|
|
| Unspecified | 0 | ‐ | ‐ | ‐ |
|
|
|
|
|
|
|
|
|
|
|
|
|
|
|
|
| INTENSITY: |
|
|
|
|
|
|
|
|
|
| Low | 12 | 7327 | 1 |
| 0.0516 | 197.13 | 41 | <0.0001 | 89.54 |
| Moderate | 13 | 2113 | 0.790 (0.633, 0.986) | 0.037 |
|
|
|
|
|
| High | 17 | 4330 | 1.015 (0.836, 1.232) | 0.879 |
|
|
|
|
|
| Unspecified | 3 | 774 | 1.067 (0.754, 1.511) | 0.714 |
|
|
|
|
|
|
|
|
|
|
|
|
|
|
|
|
| SUPPORT: |
|
|
|
| 0.0612 | 207.04 | 40 | <0.0001 | 90.91 |
| F2F | 17 | 4679 | 1 |
|
|
|
|
|
|
| F2F and phone | 17 | 6797 | 1.016 (0.837, 1.24) | 0.869 |
|
|
|
|
|
| F2F, phone and digital | 1 | 20 | 1.193 (0.285, 4.991) | 0.809 |
|
|
|
|
|
| Phone | 7 | 2312 | 0.925 (0.714, 1.199) | 0.556 |
|
|
|
|
|
| Digital | 3 | 736 | 0.867 (0.591, 1.272) | 0.464 |
|
|
|
|
|
|
|
|
|
|
|
|
|
|
|
|
| INCOME: |
|
|
|
| 0.0508 | 223.312 | 43 | <0.0001 | 93.12 |
| LMIC | 15 | 3223 | 1 |
|
|
|
|
|
|
| HMIC | 30 | 11321 | 1.126 (0.942, 1.347) | 0.193 |
|
|
|
|
|
Outcome 1.5 Stopping any breastfeeding at two months post‐partum
Thirteen studies (reporting on 15 interventions) with 3169 women measured cessation of any breastfeeding at two months post‐partum Analysis 1.5.
'Breastfeeding only' interventions may have little impact on the number of women doing any breastfeeding at two months (average RR 0.93, 95% CI 0.77 to 1.11; low‐certainty evidence). However, there was high heterogeneity for this outcome and results should therefore be interpreted with caution (Tau² = 0.08; Chi² = 59.32, df = 14 (P < 0.00001); I² = 76%).
Sensitivity analysis using only those studies assessed as having a low risk of bias for allocation concealment identified similar results (average RR 0.93, 95% CI 0.75 to 1.16). However, a sensitivity analysis using only studies assessed as having a low risk of bias for incomplete outcome data did indicate that 'breastfeeding only' support interventions may have a beneficial effect (RR 0.82, 95% CI 0.68 to 0.99).
Visual examination of a funnel plot for this outcome suggested slight asymmetry Figure 9. However, due to the high levels of heterogeneity this needs to be interpreted with caution. To explore this further, we compared the random effects estimate with the fixed‐effect estimate. The fixed‐effect estimate was the same (RR 0.93, 95% CI 0.86 to 1.02), which suggests that asymmetry may be a result of between study heterogeneity, rather than a small‐study effect.

Funnel plot of comparison 1: Breastfeeding only support versus usual care, outcome: 1.5Stopping breastfeeding (any) at 2 months
Outcome 1.6 Stopping exclusive breastfeeding at two months post‐partum
Seventeen studies (reporting on 18 interventions) with 4317 women measured cessation of any breastfeeding at two months post‐partum Analysis 1.6
'Breastfeeding only' interventions probably have a beneficial effect on the number of women exclusively breastfeeding at two months (average RR 0.81, 95% CI 0.74 to 0.89; moderate‐certainty evidence). However, there was high heterogeneity for this outcome and results should therefore be interpreted with caution (Tau² = 0.02; Chi² = 66.23, df = 17 (P < 0.00001); I² = 74%).
Sensitivity analysis using only those studies assessed as having a low risk of bias for allocation concealment identified that there was a very small difference in the number of women exclusively breastfeeding at two months (average RR 0.84, 95% CI 0.77 to 0.92), however effect estimates, and 95% CI remain similar. A sensitivity analysis using only studies assessed as having a low risk of bias for incomplete outcome data showed a slightly more beneficial effect estimate (RR 0.78, 95% CI 0.68 to 0.90). A sensitivity analysis omitting the one arm of the cluster‐randomised study (M'Liria 2020), for which a design effect could not be calculated changed the effect size and confidence intervals marginally (average RR 0.82, 95% CI 0.75 to 0.90).
Visual examination of a funnel plot for this outcome suggested asymmetry (Figure 10). However, due to the high levels of heterogeneity this needs to be interpreted with caution. To explore this further, we compared the random‐effects estimate with the fixed‐effect estimate. The fixed‐effect estimate was very similar (RR 0.83, 95% CI 0.79 to 0.87), which suggests that asymmetry may be a result of between study heterogeneity, rather than a small‐study effect.

Funnel plot of comparison 1: Breastfeeding only support versus usual care, outcome: 1.6 Stopping exclusive breastfeeding at 2 months
Outcome 1.7 Stopping any breastfeeding at three to four months post‐partum
Thirty‐two studies (reporting on 35 interventions) with 12,054 women measured cessation of any breastfeeding at 3‐4 months post‐partum Analysis 1.7
'Breastfeeding only' interventions probably have a beneficial effect on the number of women doing any breastfeeding at 3‐4 months (average RR 0.87, 95% CI 0.81 to 0.93; moderate‐certainty evidence). However, there was high heterogeneity for this outcome and results should therefore be interpreted with caution (Tau² = 0.02; Chi² = 84.53, df = 34 (P < 0.00001); I² = 60%).
Sensitivity analysis using only those studies assessed as having a low risk of bias for allocation concealment demonstrated almost identical results (RR 0.86, 95% CI 0.80 to 0.93). A sensitivity analysis using only studies assessed as having a low risk of bias for incomplete outcome data showed a more beneficial effect estimate (RR 0.79, 95% CI 0.71 to 0.87).
Visual examination of a funnel plot for this outcome suggested some asymmetry (Figure 11). However, due to the high levels of heterogeneity this needs to be interpreted with caution. To explore this further, we compared the random‐effects estimate with the fixed‐effect estimate. The fixed‐effect estimate was identical with very similar 95% CI (RR 0.87, 95% CI 0.83 to 0.90), which suggests that asymmetry may be a result of between study heterogeneity, rather than a small‐study effect.

Funnel plot of comparison 1: Breastfeeding only support versus usual care, outcome: 1.7 Stopping breastfeeding (any) at 3‐4 months
Outcome 1.8 Stopping exclusive breastfeeding at three to four months post‐partum
Forty‐three studies (reporting on 48 interventions) with 11,575 women measured cessation of exclusive breastfeeding at 3‐4 months post‐partum Analysis 1.8.
'Breastfeeding only' interventions probably have a beneficial effect on the number of women exclusively breastfeeding at three to four 3‐4 months (RR 0.81, 95% CI 0.77 to 0.85; moderate‐certainty evidence). However, there was high heterogeneity for this outcome and results should therefore be interpreted with caution (Tau² = 0.02; Chi² = 410.53, df = 47 (P < 0.00001); I² = 89%).
Sensitivity analysis using only those studies assessed as having a low risk of bias for allocation concealment showed a slightly less beneficial treatment effect (RR 0.85, 95% CI 0.80 to 0.90). Conversely, a sensitivity analysis using only studies assessed as having a low risk of bias for incomplete outcome data showed a more beneficial effect estimate (RR 0.76, 95% CI 0.69 to 0.83). A sensitivity analysis omitting the one arm of the cluster‐randomised study (M'Liria 2020) for which a design effect could not be calculated changed did not change the effect estimate and changed the confidence intervals very marginally (RR 0.81, 95% CI 0.77 to 0.86).
Visual examination of a funnel plot for this outcome suggested asymmetry (Figure 12). However, due to the high levels of heterogeneity this needs to be interpreted with caution. To explore this further, we compared the random‐effects estimate with the fixed‐effect estimate. The fixed‐effect estimate is only slightly less than the random‐effects estimate 95% CI (RR 0.85, 95% CI 0.83 to 0.87), which suggests that asymmetry may be a result of between‐study heterogeneity, however, it does not exclude the possibility of publication bias.

Funnel plot of comparison 1: Breastfeeding only support versus usual care, outcome: 1.8 Stopping breastfeeding at 3‐4 months
Outcome 1.9 Stopping any breastfeeding at nine months post‐partum
One study with 552 women measured cessation of any breastfeeding at nine months post‐partum Analysis 1.9.
The one study suggested that 'breastfeeding only' interventions may have a beneficial effect on the number of women breastfeeding at nine months (RR 0.87, 95% CI 0.78 to 0.97; low‐certainty evidence).
As there was only one study included in this analysis, sensitivity analyses and assessment of reporting bias and heterogeneity were not possible.
Outcome 1.10 Stopping any breastfeeding at 12 months post‐partum
Two studies with 1311 women measured cessation of any breastfeeding at 12 months post‐partum Analysis 1.10.
'Breastfeeding only' interventions may have little or no impact on the number of women breastfeeding at 12 months (RR 0.95, 95% CI 0.90 to 1.00; low‐certainty evidence). There was evidence of possible moderate heterogeneity, however, this was not statistically significant (Tau² = 0.00; Chi² = 1.49, df = 1 (P < 0.22); I² = 33%).
The two studies were both graded low risk of bias of allocation concealment and unclear risk of bias for incomplete outcome data and thus sensitivity analysis was not possible. There were insufficient studies to produce a Funnel Plot.
Comparison 2. Breastfeeding plus support interventions versus usual care
Outcome 2.1: Stopping any breastfeeding at six months postpartum
Eleven studies (reporting on 12 interventions) with 4879 women measured cessation of any breastfeeding at six months post‐partum Analysis 2.1.
'Breastfeeding plus' interventions probably have a small beneficial effect on the number of women who continue breastfeeding beyond six months, with fewer women in the groups that receive support stopping breastfeeding by this time (average risk ratio (RR) 0.94, 95% CI 0.91 to 0.97; moderate‐certainty evidence). There was no evidence of heterogeneity (Tau² = 0.0, I² = 0%, Chi² = 10.73, P =0.47).
Sensitivity analysis using only studies assessed as having a low risk of bias for allocation concealment moved the null value to cross the 95% CI (RR 0.96, 95% CI 0.91 to 1.01). Whereas, sensitivity analysis using only studies assessed as having a low risk of bias for incomplete outcome data showed a slightly more beneficial treatment effect (RR 0.93, 95% CI 0.89 to 0.98).
Visual examination of a funnel plot for this outcome did not suggest asymmetry (Figure 13).

Funnel plot of comparison 2: Breastfeeding plus support versus usual care, outcome: 2.1 Stopping breastfeeding (any) at 6 months
There were limited data available for the meta‐regressions and no significant differences for the categories specified. Table 5.
| Factor | Number of studies | Number of women | RR (95% CI) | P value | Total model statistics | ||||
| Tau2 | Chi2 | df | P value | I2 | |||||
|
| 12 |
|
|
|
|
|
|
|
|
| PERSON: |
|
|
|
| <0.00005 | 4.5171 | 9 | 0.8742 | <0.001 |
| Professional | 8 | 3601 | 1 |
|
|
|
|
|
|
| Non‐Professional | 3 | 1221 | 1.045 (0.969, 1.127) | 0.25 |
|
|
|
|
|
| Prof + Non‐prof | 0 | ‐ |
|
|
|
|
|
|
|
| Unspecified | 1 | 57 | 0.775 (0.605, 0.994) | 0.044 |
|
|
|
|
|
|
|
|
|
|
|
|
|
|
|
|
| INTENSITY: |
|
|
|
| <0.00005 | 9.0329 | 8 | 0.3395 | 0.76 |
| Low | 1 | 1154 | 1 |
|
|
|
|
|
|
| Moderate | 4 | 1236 | 1.037 (0.879, 1.225) | 0.664 |
|
|
|
|
|
| High | 5 | 1607 | 0.990 (0.891, 1.100) | 0.855 |
|
|
|
|
|
| Unspecified | 2 | 882 | 0.884 (0.667, 1.171) | 0.391 |
|
|
|
|
|
|
|
|
|
|
|
|
|
|
|
|
| SUPPORT: |
|
|
|
| <0.00005 | 10.2209 | 10 | 0.4213 | 0.12 |
| F2F | 11 | 4469 | 1 |
|
|
|
|
|
|
| F2F and phone | 1 | 410 | 0.969 (0.606, 1.548) | 0.895 |
|
|
|
|
|
| F2F, phone and digital | 0 | ‐ |
|
|
|
|
|
|
|
| Phone | 0 | ‐ |
|
|
|
|
|
|
|
| Digital | 0 | ‐ |
|
|
|
|
|
|
|
|
|
|
|
|
|
|
|
|
|
|
| INCOME: |
|
|
|
|
|
|
|
|
|
| LMIC | 2 | 1012 | 1 |
| <0.00005 | 9.537 | 10 | 0.4820 | <0.005 |
| HMIC | 10 | 3867 | 0.872 (0.633, 1.202) | 0.402 |
|
|
|
|
|
Outcome 2.2: Stopping exclusive breastfeeding at six months postpartum
Thirteen studies (reporting on 14 interventions) with 7650 women measured cessation of exclusive breastfeeding at six months post‐partum Analysis 2.2.
'Breastfeeding plus' interventions may have a beneficial effect on the number of women exclusively breastfeeding at six months (average RR 0.79, 95% CI 0.70 to 0.90; low‐certainty evidence). However, there was high heterogeneity for this outcome and results should therefore be interpreted with caution (Tau² = 0.05; Chi² = 353.74, df = 13 (P < 0.00001); I² = 96%).
Sensitivity analysis using only those studies assessed as having a low risk of bias for allocation concealment resulted in a smaller effect estimate and moved the 95% CI (RR 0.91, 95% CI 0.83 to 1.00). Sensitivity analysis using only studies assessed as having a low risk of bias for incomplete outcome data showed a more beneficial effect estimate but with a wider 95% CI (RR 0.74, 95% CI 0.58 to 0.96). A sensitivity analysis omitting the one arm of the cluster‐randomised study (M'Liria 2020) for which a design effect could not be calculated changed the effect size estimate and confidence intervals marginally and demonstrated the same positive treatment effect (average RR 0.81, 95% CI 0.71 to 0.92).
Visual examination of a funnel plot for this outcome suggested asymmetry (Figure 14). However, due to the high levels of heterogeneity this needs to be interpreted with caution. To explore this further, we compared the random‐effects estimate with the fixed‐effect estimate. The fixed‐effect estimate was very similar (RR 0.85, 95% CI 0.82 to 0.87), which suggests that asymmetry may be a result of between study heterogeneity, rather than a small‐study effect.

Funnel plot of comparison 2: Breastfeeding plus support versus usual care, outcome: 2.2 Stopping exclusive breastfeeding at 6 months
Meta‐regression suggested that interventions delivered via face‐to‐face and phone may be associated with a more beneficial effect (RR 0.34, 95% CI 0.23 to 0.51, p < 0.005). However, there were only 14 studies included in this analysis, and they were unbalanced across the categories, so we urge caution with this finding. There were no differences between explanatory variables (person providing intervention, intensity, or income status of country) see Table 6.
| Factor | Number of studies | Number of women | RR (95% CI) | P value | Total model statistics | ||||
| Tau2 | Chi2 | df | P value | I2 | |||||
|
| 14 |
|
|
|
|
|
|
|
|
| PERSON: |
|
|
|
| 0.2225 | 213.847 | 12 | <0.0001 | 99.03 |
| Professional | 9 | 4671 | 1 |
|
|
|
|
|
|
| Non‐Professional | 5 | 2979 | 1.033 (0.612, 1.744) | 0.903 |
|
|
|
|
|
| Prof + Non‐prof | 0 | ‐ | ‐ |
|
|
|
|
|
|
| Unspecified | 0 | ‐ | ‐ |
|
|
|
|
|
|
|
|
|
|
|
|
|
|
|
|
|
| INTENSITY: |
|
|
|
| 0.487 | 189.8528 | 10 | <0.0001 | 99.02 |
| Low | 1 | 1154 | 1 |
|
|
|
|
|
|
| Moderate | 3 | 1165 | 0.993 (0.332, 2.969) | 0.990 |
|
|
|
|
|
| High | 8 | 4449 | 0.692 (0.253, 1.898) | 0.475 |
|
|
|
|
|
| Unspecified | 2 | 882 | 0.683 (0.212, 2.200) | 0.523 |
|
|
|
|
|
|
|
|
|
|
|
|
|
|
|
|
| SUPPORT: |
|
|
|
| 0.0584 | 68.6107 | 11 | <0.0001 | 97.25 |
| F2F | 11 | 6004 | 1 |
|
|
|
|
|
|
| F2F and phone | 2 | 1447 | 0.338 (0.225, 0.508) | <0.005 |
|
|
|
|
|
| F2F, phone and digital | 0 | ‐ | ‐ |
|
|
|
|
|
|
| Phone | 0 | ‐ | ‐ |
|
|
|
|
|
|
| Digital | 1 | 199 | 0.776 (0.440, 1.369) | 0.382 |
|
|
|
|
|
|
|
|
|
|
|
|
|
|
|
|
| INCOME: |
|
|
|
| 0.1712 | 181.2251 | 12 | <0.0001 | 98.91 |
| LMIC | 6 | 3807 | 1 |
|
|
|
|
|
|
| HMIC | 8 | 3843 | 1.517 (0.968, 2.377) | 0.069 |
|
|
|
|
|
CI: confidence interval;RR: risk ratio.
Outcome 2.3: Stopping any breastfeeding at four to six weeks postpartum
Six studies (reporting on seven interventions) with 2325 women measured cessation of any breastfeeding at 4‐6 weeks post‐partum Analysis 2.3.
'Breastfeeding plus' interventions probably has little to no impact on the number of women continuing any breastfeeding at four to si4‐6 weeks (RR 0.94, 95% CI 0.82 to 1.08; moderate‐certainty evidence). There was evidence of possible moderate heterogeneity, however, this was not statistically significant (Tau² = 0.01; Chi² = 10.07, df = 6 (P = 0.12); I² = 40%).
Sensitivity analysis using only those studies assessed as having a low risk of bias for allocation concealment found very similar effect estimates and 95% CI (RR 0.93, 95% CI 0.79 to 1.10). Sensitivity analysis using only studies assessed as having a low risk of bias for incomplete outcome data showed a similar effect estimate and wider 95% CI (RR 0.98, 95% CI 0.68 to 1.41).
Assessment of publication bias via Funnel Plot inspection was not possible due to the small number of studies.
Meta‐regression demonstrated no differences between explanatory variables (person providing intervention, intensity, type of support or income status of country). However, there were only seven interventions included, so results must be interpreted with caution. See Table 7.
| Factor | Number of studies | Number of women | RR (95% CI) | P value | Total model statistics | ||||
| Tau2 | Chi2 | df | P value | I2 | |||||
|
| 7 |
|
|
|
|
|
|
|
|
| PERSON: |
|
|
|
| <0.00005 | 9.8833 | 5 | 0.0786 | 0.01 |
| Professional | 5 | 1454 | 1 |
|
|
|
|
|
|
| Non‐Professional | 2 | 871 | 1.046 (0.849, 1.290) | 0.67 |
|
|
|
|
|
| Prof + Non‐prof | 0 | ‐ | ‐ |
|
|
|
|
|
|
| Unspecified | 0 | ‐ | ‐ |
|
|
|
|
|
|
|
|
|
|
|
|
|
|
|
|
|
| INTENSITY: |
|
|
|
| <0.00005 | 4.3241 | 4 | 0.3639 | 0.01 |
| Low | 0 | ‐ | ** NOTE baseline ‘Moderate’ |
|
|
|
|
|
|
| Moderate | 3 | 681 | 1 |
|
|
|
|
|
|
| High | 3 | 1172 | 1.015 (0.799, 1.289) |
|
|
|
|
|
|
| Unspecified | 1 | 472 | Not included in model |
|
|
|
|
|
|
|
|
|
|
|
|
|
|
|
|
|
| SUPPORT: |
|
|
|
| <0.00005 | 9.9954 | 5 | 0.0754 | 0.02 |
| F2F | 6 | 2090 | 1 |
|
|
|
|
|
|
| F2F and phone | 1 | 235 | 1.042 (0.769, 1.411) | 0.793 |
|
|
|
|
|
| F2F, phone and digital | 0 | ‐ | ‐ |
|
|
|
|
|
|
| Phone | 0 | ‐ | ‐ |
|
|
|
|
|
|
| Digital | 0 | ‐ | ‐ |
|
|
|
|
|
|
|
|
|
|
|
|
|
|
|
|
|
| INCOME: |
|
|
|
| N/A | N/A | N/A | N/A | N/A |
| LMIC | 0 | ‐ |
|
|
|
|
|
|
|
| HMIC | 7 | 2325 | N/A |
|
|
|
|
|
|
CI: confidence interval;RR: risk ratio.
Outcome 2.4 Stopping exclusive breastfeeding at four to six weeks postpartum
Six studies (reporting on seven interventions) with 2402 women measured cessation of exclusive breastfeeding at 4‐6 weeks post‐partum Analysis 2.4.
'Breastfeeding plus' interventions may have a beneficial effect on the number of women exclusively breastfeeding at 4‐6 weeks, but the evidence is very uncertain (average RR 0.73, 95% CI 0.57 to 0.95; very low‐certainty evidence). There was also high heterogeneity for this outcome and results should therefore be interpreted with caution (Tau² = 0.09; Chi² = 48.03, df = 6 (P < 0.00001); I² = 88%).
Sensitivity analysis using only those studies assessed as having a low risk of bias for allocation concealment revealed that effect estimate became smaller and moved the 95% CI to include the null value (average RR 0.92, 95% CI 0.85 to 1.01). Sensitivity analysis using only studies assessed as having a low risk of bias for incomplete outcome data also identified that the effect estimate became smaller and widened and moved the 95% CI to include the null value (RR 0.82, 95% CI 0.63 to 1.08). A sensitivity analysis omitting the one arm of the cluster‐randomised study (M'Liria 2020) for which a design effect could not be calculated also reduced the effect estimate and widened and moved the 95% CI to include the null value (average RR 0.87, 95% CI 0.72 to 1.04).
Assessment of publication bias via Funnel Plot inspection was not possible due to the small number of studies.
Meta‐regression (Table 8), demonstrated no differences between explanatory variables (person providing intervention, intensity, type of support or income status of country). However, there were only seven interventions included, so results must be interpreted with caution.
| Factor | Number of studies | Number of women | RR (95% CI) | P value | Total model statistics | ||||
| Tau2 | Chi2 | df | P value | I2 | |||||
|
| 7 |
|
|
|
|
|
|
|
|
| PERSON: |
|
|
|
| 0.457 | 45.2117 | 4 | <0.0001 | 94.89 |
| Professional | 5 | 1651 | 1 |
|
|
|
|
|
|
| Non‐Professional | 2 | 751 | 0.697 (0.213, 2.280) |
|
|
|
|
|
|
| Prof + Non‐prof | 0 | ‐ | ‐ |
|
|
|
|
|
|
| Unspecified | 0 | ‐ | ‐ |
|
|
|
|
|
|
|
|
|
|
|
|
|
|
|
|
|
| INTENSITY: |
|
|
|
| 0.4011 | 45.0465 | 4 | <0.0001 | 95.05 |
| Low | 0 | ‐ | ** NOTE baseline ‘Moderate’ |
|
|
|
|
|
|
| Moderate | 2 | 529 | 1 |
|
|
|
|
|
|
| High | 4 | 1401 | 0.561 (0.185, 1.701) | 0.307 |
|
|
|
|
|
| Unspecified | 1 | 472 | Not included in model |
|
|
|
|
|
|
|
|
|
|
|
|
|
|
|
|
|
| SUPPORT: |
|
|
|
| 0.3455 | 44.1268 | 5 | 0.0001 | 95.79 |
| F2F | 5 | 1834 | 1 |
|
|
|
|
|
|
| F2F and phone | 2 | 568 | 0.659 (0.236, 1.839) | 0.426 |
|
|
|
|
|
| F2F, phone and digital | 0 | ‐ | ‐ |
|
|
|
|
|
|
| Phone | 0 | ‐ | ‐ |
|
|
|
|
|
|
| Digital | 0 | ‐ | ‐ |
|
|
|
|
|
|
|
|
|
|
|
|
|
|
|
|
|
| INCOME: |
|
|
|
| 0.4544 | 42.7192 | 4 | <0.0001 | 95.86 |
| LMIC | 2 | 568 | 1 |
|
|
|
|
|
|
| HMIC | 5 | 1834 | 1.517 (0.457, 5.040) | 0.496 |
|
|
|
|
|
CI: confidence interval;RR: risk ratio.
Outcome 2.5 Stopping any breastfeeding at two months post‐partum
Four studies (reporting on five interventions) with 2089 women measured cessation of any breastfeeding at two months post‐partum Analysis 2.5.
'Breastfeeding plus' interventions probably have little to no impact on the number of women doing any breastfeeding at two months (average RR 0.92, 95% CI 0.79 to 1.07; moderate‐certainty evidence).
There was no significant evidence of heterogeneity (Tau² = 0.01; Chi² = 4.96, df = 4 (P = 0.29); I² = 19%).
Sensitivity analysis using only those studies assessed as having a low risk of bias for allocation concealment identified that the impact is still uncertain (RR 1.00, 95% CI 0.78 to 1.28). A sensitivity analysis using only studies assessed as having a low risk of bias for incomplete outcome data changed the direction of the effect estimate and widened the 95% CI (RR 1.31, 95% CI 0.89 to 1.93).
Assessment of publication bias via Funnel Plot inspection was not possible due to the small number of studies.
Outcome 2.6 Stopping exclusive breastfeeding at two months post‐partum
Nine studies (reporting on 10 interventions) with 4537 women measured cessation of any breastfeeding at two months post‐partum Analysis 2.6.
It is uncertain if 'breastfeeding plus' interventions have an impact on the number of women exclusively breastfeeding at two months (average RR 0.90, 95% CI 0.78 to 1.03; very low‐certainty evidence). However, there was high heterogeneity for this outcome and results should therefore be interpreted with caution (Tau² = 0.03; Chi² = 54.79, df = 9 (P < 0.00001); I² = 84%).
Sensitivity analysis using only those studies assessed as having a low risk of bias for allocation concealment changed the direction of the effect estimate and widened the 95% CI (average RR 1.04, 95% CI 0.87 to 1.26). Similarly, a sensitivity analysis using only studies assessed as having a low risk of bias for incomplete outcome changed the direction of the effect estimate and widened the 95% CI (RR 1.06, 95% CI 0.81 to 1.39). A sensitivity analysis omitting the one arm of the cluster‐randomised study (M'Liria 2020) for which a design effect could not be calculated changed the effect estimate marginally (RR 0.96, 95% CI 0.88 to 1.05).
Visual examination of a funnel plot for this outcome suggested possible asymmetry (Figure 15). However, due to the high levels of heterogeneity this needs to be interpreted with caution. To explore this further, we compared the random‐effects estimate with the fixed‐effect estimate. The fixed‐effect estimate was very similar (RR 0.92, 95% CI 0.87 to 0.98), which suggests that asymmetry may be a result of between study heterogeneity, rather than a small‐study effect.

Funnel plot of comparison 2: Breastfeeding plus support versus usual care, outcome: 2.6 Stopping exclusive breastfeeding at 2 months
Outcome 2.7 Stopping any breastfeeding at three to four months post‐partum
Five studies (reporting on six interventions) with 2064 women measured cessation of any breastfeeding at3‐4 months post‐partum Analysis 2.7.
'Breastfeeding plus' interventions may have little to no impact on the number of women doing any breastfeeding at 3‐4 months (average RR 0.97, 95% CI 0.81 to 1.15; low‐certainty evidence). However, there was substantial heterogeneity for this outcome and results should therefore be interpreted with caution (Tau² = 0.02; Chi² = 11.35, df = 5 (P < 0.00001); I² = 56%).
Sensitivity analysis using only those studies assessed as having a low risk of bias for allocation concealment demonstrated similar results (RR 0.97, 95% CI 0.75 to 1.18). A sensitivity analysis using only studies assessed as having a low risk of bias for incomplete outcome data also showed a similar effect estimate (RR 0.98, 95% CI 0.80 to 1.21).
Assessment of publication bias via Funnel Plot inspection was not possible due to the small number of studies.
Outcome 2.8 Stopping exclusive breastfeeding at three to four months post‐partum
Ten studies (reporting on 11 interventions) with 4766 women measured cessation of exclusive breastfeeding at3‐4 months post‐partum Analysis 2.8.
'Breastfeeding plus' interventions may have little to no impact on the number of women exclusively breastfeeding at 3‐4 months (RR 0.86, 95% CI 0.75 to 1.00; low‐certainty evidence). However, there was high heterogeneity for this outcome and results should therefore be interpreted with caution (Tau² = 0.04; Chi² = 68.42, df = 10 (P < 0.00001); I² = 85%).
Sensitivity analysis using only those studies assessed as having a low risk of bias for allocation concealment changed the direction of the effect estimate and widened the 95% CI (RR 1.06, 95% CI 0.81 to 1.39). A sensitivity analysis using only studies assessed as having a low risk of bias for incomplete outcome data found a similar effect estimate (RR 0.89, 95% CI 0.75 to 1.06). A sensitivity analysis omitting the one arm of the cluster‐randomised study (M'Liria 2020) for which a design effect could not be calculated changed did not change the effect estimate and changed the confidence intervals very marginally (RR 0.91, 95% CI 0.78 to 1.06).
Visual examination of a funnel plot for this outcome did not suggest the presence of asymmetry (Figure 16).

Funnel Plot for Outcome 2.8 Stopping exclusive breastfeeding at 3‐4 months
Outcome 2.9 Stopping any breastfeeding at nine months post‐partum
No 'breastfeeding plus' interventions measured stopping any breastfeeding at nine months.
Outcome 2.10 Stopping any breastfeeding at 12 months post‐partum
Two studies study with 1431 women measured cessation of any breastfeeding at 12 months post‐partum reported in Analysis 2.9.
'Breastfeeding plus' interventions probably have little to no effect on the number of women stopping any breastfeeding at 12 months (RR 0.96, 95% CI 0.91 to 1.00; moderate‐certainty evidence).
There was no evidence of heterogeneity for this outcome (Tau² = 0.00; Chi² = 0.28, df = 1 (P < 0.59); I² = 0%).
As there were only two studies included in this analysis, sensitivity analyses and assessment of reporting bias and heterogeneity were not possible.
Non‐breastfeeding outcomes
Maternal satisfaction with care
Maternal satisfaction with care was reported by study group in 12 studies. There was no consistency in the findings with six studies reporting improvements in maternal satisfaction in women receiving support and six studies reporting minimal or no difference.
More specifically, Abbass‐Dick 2015 reported that more mothers in the intervention group were satisfied with the information they received (81% vs 62.5%, P < 0.001). Laliberte 2016 measured satisfaction with care across a range of domains with women in the intervention group consistently reporting higher levels of satisfaction overall (OR 1.96, 95% CI 3.50 to 6.88), and in particular for satisfaction with opportunities to ask questions and satisfaction with breastfeeding support received (OR 5.50, 95% CI 3.16 to 9.57). Ekstrom 2006 found mothers in intervention clusters were more satisfied with support overall at three months compared to control clusters (intervention vs control group, P = 0.002; intervention vs control group B, P = 0.029). However, at nine months (P = 0.002) and three days postpartum (P <0.001) this difference was only significant in the comparison with control group A. Stockdale 2008 reported that women who received the Designer Breastfeeding intervention had significantly higher mean (M) scores for perceived midwife support (M = 42.2) compared to the control group (M= 31.4, P = 0.000). Patel 2018 reported the strongest increase in maternal satisfaction with 92.3% of intervention women being completely satisfied with their support versus 36% of the control group. Finally, when interviewed at the end of the study by Morrow 1999, 66% of mothers in the intervention group said the most important source of infant feeding advice was a peer counsellor, followed by a physician (19%) and their mothers (7%); in the control group, 50% listed a physician as their most important source, followed by their mother (22%) and a peer counsellor (2%).
Conversely, Clarke 2020 measured maternal satisfaction with feeding support at home and in the hospital and found only a minor difference between the intervention and control groups for both hospital support (7.2/10 vs 7.1/10) and home support (7.8/10 vs 7.7/10). Jolly 2012a indicated that slightly fewer women in the intervention group (26.9%) reported that they received less breastfeeding support than they would have wanted compared to the control group (30.2%), however, significance was not tested. Paul 2012 used the satisfaction with maternal and newborn care scale and found no mean difference (MD) at either two weeks (MD = 0.39, p 0.36) or two months (MD = 0.25, P = 0.58). In Kools 2005, opinions of mothers about feeding advice from caregivers were no more positive in the intervention group than in the control group, except for slightly less contradictory feeding advice (P = 0.04). Bashour 2008 reported over 80% of the women in each group were happy about their experiences during the postnatal period, with no differences between the groups. Wrenn 1997 used the Breastfeeding Support Scale and found no difference between the intervention and control group (97.0 vs 91.29, P >0.1).
Maternal satisfaction with feeding
Maternal satisfaction with feeding was reported by study group in 16 studies. Generally, the studies showed that the intervention had little impact on mothers’ satisfaction with feeding as measured by breastfeeding satisfaction scales and prevalence of problems breastfeeding with only Puharic 2020 reporting significantly fewer women in the intervention group having trouble breastfeeding between three and six months (9% vs 21%, P = 0.002) and Ahmed 2020 reporting a small increase in maternal breastfeeding evaluation scale scores in women receiving the intervention (M = 122.16 vs 112.79, P = 0.04).
Twelve of the studies found no significant differences between intervention and control groups. Six of these studies measured satisfaction with breastfeeding using various scales or items. First, Hoddinott 2012 measured satisfaction with feeding using the maternal breastfeeding evaluation score and found no difference between the groups (P = 0.59). Wrenn 1997 used the Maternal‐Infant Breastfeeding Satisfaction Subscale and suggested that both groups were satisfied with their breastfeeding experience (P > 0.20). Hongo 2020 reported no difference in breastfeeding satisfaction (raw data not provided). Bunik 2010 found a small increase in women reporting they were satisfied with their feeding method, but this was not significant (92% vs 87%, P not reported). Uscher‐Pines 2020 reported that women receiving telelactation were slightly less likely to be satisfied with their breastfeeding experience compared to controls, and again this difference was not significant (73% vs 78%, P = 0.41). Finally, Ekstrom 2006 found no difference in women enjoying breastfeeding between the intervention group and the control group, in which data were collected at the same time, at either three days (P = 0.980), three months (P = 0.853) or nine months (P = 0.516).
Six studies looked at the impact of support in reducing problems encountered when breastfeeding. Bashour 2008 reported that 15% of women in intervention and control groups had breast engorgement (P = 0.628). de Oliveira 2006 measured the rates of sore nipples, engorgement and mastitis at seven and 30 days and did not identify any differences between the groups. Hopkinson 2009 also measured a range of breastfeeding problems during the first four weeks. There was no clear beneficial intervention effect. However, women in the intervention group were slightly less likely to report sore nipples (65.8% vs 72.1%), engorgement (65.8% vs 67.1%) and pain (68% vs 76.7%) but were slightly more likely to report low milk supply (56.0% vs 53.3%), difficulty nursing (33.3% vs 26.3%) and exhaustion (47.1% vs 38.3%). Similarly, Jolly 2012a measured breastfeeding problems and found that women in the intervention group reported slightly more problems than the control group, however, this did not differ significantly (61.2% vs 54.3%, P not reported). Nilsson 2017 also reported that women discharged early with breastfeeding support experienced more breastfeeding problems (50.7% vs 46.1%, P = 0.014), however women in the control group were more likely to experience pain (83.1% vs 86.1%, P = 0.029). Finally, when looking at reasons for stopping breastfeeding, Bunik 2010 also reported no differences in difficulties feeding between intervention and control groups (15% vs 11%) or perceived milk insufficiency (40% vs 43%; P values not reported).
Three studies reported somewhat mixed impacts(Dennis 2002; Labarere 2005;Petrova 2009). All three found that a large majority of women in both groups were satisfied with the breastfeeding experience, but women in the control groups were more likely to be dissatisfied with the experience or encounter problems. More specifically, Dennis 2002 reported that 96.4% of all participants were satisfied with their breastfeeding experience, however, women in the control group were significantly more likely to report being dissatisfied (10.5% vs 1.5%, P = 0.02). While Labarere 2005 also reported that there was no difference in the number of women satisfied with the breastfeeding experience between the intervention (91.1%) and control group (87.7%, P = 0.41), there were significantly fewer women in the intervention group experiencing difficulties (55.3% vs 72.8%, P <0.01). Conversely, whilst Petrova 2009 reported that over 90% of women in intervention and control groups were satisfied with their breastfeeding experience, significantly more women in the intervention group encountered problems with breastfeeding (17.1% vs 2.6%, P <0.04).
Infant Morbidity
Twenty‐one studies measured outcomes related to infant morbidity. These can be broadly split into outcomes relating to healthcare utilisation (10 studies), outcomes relating to childhood illness (12 studies) and adverse neonatal events (one study).
In terms of hospital readmissions, there was no consistent evidence of differences between intervention and control groups. Three studies showed some evidence of a beneficial effect. Chapman 2004 reported that infants in the control group may be three times more likely to be readmitted to hospital by three months of age (odds ratio (OR) 3.5, 95% CI 1.0 to 11.9). However, the other two studies only showed beneficial effects at some time points. Nilsson 2017 reported that infants in the intervention group may be less likely to be readmitted due to jaundice, dehydration or weight loss than control infants at one week (aOR 0.55, 95% CI 0.37 to 0.81) but not at one month (aOR 0.96, 95% CI 0.58 to 1.59). Whereas Patel 2018 reported that generally, rates of hospital admission were similar in intervention and control clusters with the exception of visit three where infants in the intervention cluster were significantly less likely to require hospitalisation (12.5% vs 6.8%, P < 0.01).
The remaining seven studies found no significant differences between groups. Laliberte 2016 found no difference in infants requiring at least one self‐reported emergency room (ER) visit between two and 12 weeks (OR 1.02, 0.61‐1.72) or self‐reported re‐admission of infants between two and 12 weeks (OR 0.97, 0.43‐2.20). Hans 2018 reported no difference in the odds of requiring hospitalisation between the intervention and control group (OR 0.45, 95%CI 0.08 to 2.48). Nair 2017 identified no difference in care being sought from a care provider (OR 0·87, 95% CI 0·45 to 1·69). Whilst it is difficult to draw conclusions from these three studies as breastfeeding support was part of a much wider intervention on the provision community‐based workers, studies which only contained breastfeeding support had similar findings. For example, Paul 2012 found no differences in healthcare utilisation at either two weeks (RR 0.97, 95% CI 0.84 to 1.12) or two months (RR 0.95, 95% CI 0.86, 1.05) and Bunik 2010; Frank 1987; Petrova 2009 did not report any differences in healthcare utilisation.
Diarrhoea was the most commonly measured childhood illness outcome (measured in 10 studies). There was some evidence to suggest that interventions were associated with a reduction in episodes of diarrhoea (six studies). Paul 2012 reported control group infants were more likely to have one or more episodes of diarrhoea (RR 2.15, 95% CI, 1.16‐3.97). Similarly, Anderson 2005 found that control group infants were twice as likely to have one or more diarrhoeal episode (RR = 2.15, 95% CI 1.16 to 3.97). Bhandari 2003 reported that the prevalence of diarrhoea in the last seven days was lower in the intervention than in the control communities when measured at three months (OR 0.64, 95% CI 0.44 to 0.95) and six months (OR 0.85, 95% CI 0.72 to 0.99). Kramer 2001 reported that infants cared for in BFHI sites were less likely to have a gastrointestinal infection (OR 0.60, 95% CI 0.40 to 0.91). Morrow 1999 reported that at three months postpartum, fewer intervention (12/96) than control (9/34) infants had had an episode of diarrhoea (P = 0.029). However, whilst Yotebieng 2015 identified that Baby‐Friendly Hospital Initiative(BFHI) steps 1‐9 was associated with a reduction in prevalence of diarrhoea at 24 weeks (Crude prevalence rate ratio [CPRR] 0.52, 95% CI 0.32 to 0.84) this was not the case at 14 weeks (CPRR 1.01, 95% CI 0.59 to 1.70). Conversely, BFHI steps 1‐10 (Yotebieng 2015), was associated with an increased prevalence of diarrhoea at 14 weeks (CPRR 1.72, 95% CI 1.04 to 2.83), but not at 24 weeks (CPRR 1.23, 95% CI 0.88 to 1.71). In addition, a number of studies showed no difference in prevalence of diarrhoea. For instance, the prevalence of diarrhoea within the last two weeks at age 12 weeks and 24 weeks did not differ between the intervention clusters versus the control cluster in all three countries combined within the large multi‐country PROMISE EBF trial (Prevalence ratio 0.95, 95% CI 0.78 to 1.17) (Tylleskar 2011a; Tylleskar 2011b; Tylleskar 2011c). Similarly, Abdulahi 2021 found no difference (Unadjusted difference 2.50, P = 0.445), and nor did Bashour 2008 (P = 0.80). Finally, Nair 2017 used a composite measure that included diarrhoea and reported no difference in the odds of children having diarrhoea, cough or fever in the past two weeks between intervention and control groups (aOR 0.90, 95% CI 0.69 to 1.19).
Cough/respiratory infections were the next most commonly used measure (five studies). There was no evidence of any significant differences between intervention and control groups in the studies by Bashour 2008 (P = 0.916), Kramer 2001(OR 0.87, 95% CI 0.59 to 1.28)or Yotebieng 2015 who did not find any differences in fever with cough for either BFHI 1‐9 at 14 weeks (OR 0.51, 95% CI 0.19 to 1.36) or 24 weeks (OR 0.60, 95% CI 0.30 to 1.18), or BFHI 1‐10 at 14 weeks (OR 0.60, 95% CI 0.21 to 1.71) or 24 weeks (OR 1.03, 95% CI 0.66 to 1.59). As described previously, the composite measure by Nair 2017 which included cough or fever did not identify any differences. Only Abdulahi 2021 found a difference for fever with cough (Effect Size – 6.07, P = 0.238), however, this was non‐significant when looking at cough alone (Effect Size – 6.93, P = 0.096).
Jaundice was only included in two studies. First Bashour 2008 reported no differences in rates of jaundice (P = 0.525). Nilsson 2017 included jaundice as part of a composite measure and did find a reduction in infants in the intervention group being re‐admitted with jaundice, dehydration or weight loss at one week (aOR 0.55, 95% CI 0.37 to 0.81) but not at one month (OR 0.96, 95% CI 0.58 to 1.59). Ogaji 2020 also examined infant weight and found no differences in proportion of infants underweight (P= 0.34), with wasting (P = 0.59) or stunting (P = 0.57).
Puharic 2020 included childhood illness as a measure (no further information given) and reported that mothers of infants receiving breastfeeding support had lower rates of illness compared to active controls at both nought to three months (7% vs 16%) and three to six months (7% vs 11%).
One study (Quinlivan 2003), which was a postnatal home visiting programme for adolescent mothers measured adverse neonatal outcomes (infant death, severe non‐accidental injury and non‐voluntary foster care) and while there was a reduction in adverse outcomes in the intervention group, this difference was not significant (RR 0.24, 95% CI 0.05 to 1.08).
When considering these findings it should be noted that six of these studies were evaluations of wider interventions which included things such as antenatal and intrapartum care or vaccinations, which makes it difficult to draw conclusions for these infant outcomes (Bashour 2008; Bhandari 2003; Hans 2018; Laliberte 2016; Nair 2017; Quinlivan 2003).
Perinatal mental health
Only seven studies measured perinatal mental health outcomes. The most commonly used measure was the Edinburgh Postnatal Depression Scale (EPDS) (five studies). Only Lutenbacher 2018 found a beneficial intervention effect (d = 0.57, P <0.001). The other four studies did not identify any significant differences. First, Paul 2012 reported no difference in EPDS score at two weeks (MD = 0.06, P = .75), two months (MD ‐0.07, P = .70), or 6 months (MD = 0.24, P = .21). Second, Ahmed 2020, found no difference in EPDS scores between intervention and control groups at 1 month (4.7 vs 4.9, P = 0.39), 2 months (3.0 vs 4.3, P 0.170) or three months (2.8 vs 3.2, P = 0.92). Barnes 2017 did not identify any differences in EPDS scores (unadjusted effect estimates ‐0.07, 95% CI ‐0.76 to 0.62). Finally, Laliberte 2016 asked women to complete the EPDS at three weeks post‐partum, but the results were not reported due to the difference in response rate between the intervention group (68.9%) and the control group (38.9%). Depressive symptoms were also measured by Hans 2018 who reported no difference in the odds of women reporting high depressive symptoms at either three weeks (OR 0.96, 95% CI 0.53 to 1.71) or three months (OR 0.95, 95% CI 0.47 to 1.91).
Only Paul 2012 included anxiety as an outcome measure and reported no difference in State Trait Anxiety Inventory (STAI) score at two weeks (mean difference (MD) = ‐0.29, P = 0.47), two months (MD 0.51, P = .25), or six months (MD = ‐0.26, P = .61).
Finally, Clarke 2020, used the Warwick‐Edinburgh Mental Wellbeing Scale and found greater decreases in scores relative to baseline in the intervention sites compared to the control sites at both eight weeks (‐2.5 vs ‐0.1) and six months (‐2.9 vs ‐0.2).
Discussion
Summary of main results
This update of the review considered the evidence of the effect of breastfeeding support interventions on primary outcomes of stopping any or exclusive breastfeeding at 4‐6 weeks and six months postpartum. In addition, this update also considered the secondary breastfeeding outcomes of stopping any and exclusive breastfeeding at two months and 3‐4 months, and any breastfeeding at nine and 12 months. The review includes 116 trials published from 1984 to 2021, 103 of which contributed data to the analyses.
Due to the significant heterogeneity of interventions in previous versions of the review (which analysed all interventions together) and more recent evidence which suggests that multi‐component interventions are more effective (Beake 2012; Kim 2018; Pérez‐Escamilla 2016; Rollins 2016; Sinha 2015), this update has taken a more nuanced approach to the meta‐analysis and divided the analysis into ‘breastfeeding only’ and ‘breastfeeding plus’. We had originally planned to categorise the interventions into single component breastfeeding interventions, multi‐component breastfeeding interventions and multi‐component child and maternal health interventions, of which breastfeeding support is one aspect. However, it became apparent there was no consistent way to distinguish between the single‐ and multi‐component breastfeeding only interventions. We therefore restricted the groupings of interventions to 'breastfeeding only' interventions which only included breastfeeding support (n = 86) and 'breastfeeding plus' interventions (n = 30), which included other aspects of maternal and child health such as vaccinations, well baby clinics, intrapartum care and contraceptive services.
This review provides moderate‐certainty evidence that 'breastfeeding only' interventions probably reduce the risk of women stopping exclusive breastfeeding at six months, 4‐6 weeks, two months, and 3‐4 months. In addition, there was moderate‐certainty evidence that 'breastfeeding only' interventions probably reduce the risk of women stopping any breastfeeding at six months, 4‐6 weeks and 3‐4 months. There was low‐certainty evidence that 'breastfeeding only' interventions may reduce the number of women stopping breastfeeding at nine months. However, 'breastfeeding only' interventions may have little impact on any breastfeeding at two or 12 months (low‐certainty evidence).
For 'breastfeeding plus' interventions there is moderate‐certainty evidence that the interventions probably reduce the number of women stopping any breastfeeding and low certainty evidence that it may reduce the number of women stopping exclusive breastfeeding at six months. Breastfeeding plus' interventions may reduce the number of women stopping exclusive breastfeeding at 4‐6 weeks, but the evidence is very uncertain. 'Breastfeeding plus' interventions probably have little impact on the number of women stopping any breastfeeding at 4‐6 weeks, two months, or 3‐4 months or 12 months. Similarly, 'breastfeeding plus' interventions may reduce the number of women stopping exclusive breastfeeding at two months or 3‐4 months, but the evidence is uncertain.
A total of 35 studies reported non‐breastfeeding outcomes. There was considerable heterogeneity in how the non‐breastfeeding secondary outcomes were measured and thus meta‐analysis was not possible. A narrative synthesis did not find any consistency in findings for maternal satisfaction with care, maternal satisfaction with feeding method, perinatal mental health and for the outcomes related to infant morbidity except for diarrhoea where there was some evidence that breastfeeding support may reduce the prevalence of diarrhoea.
Despite categorising interventions into 'breastfeeding only' and 'breastfeeding plus', there was still substantial heterogeneity in interventions and despite relatively small estimate effects, the size of the treatment effects varied considerably across individual studies. Meta‐regression was conducted to further explore heterogeneity for the following explanatory variables: person providing intervention, intensity, type of support or income status of country. The power to detect differences within the meta regressions was limited by available samples. Numbers of studies and women contributing to each regression are given in the tables. There was a pattern of lower risk ratio (RR) for moderate compared to low intensity support and this difference was significant for stopping exclusive breastfeeding in the 'breastfeeding only' group at both 4‐6 weeks and six months. RR was significantly higher for the high‐income subgroup exclusively breastfeeding at six months, indicating that those in low‐ and middle‐income countries (LMICs) were less likely to have stopped exclusive breastfeeding at this time. Otherwise, the meta‐regression suggested that the explanatory variables do little to explain the high levels of heterogeneity. As there is a general lack of consistency with these findings at the different time points and limited power, the findings of the meta‐regression should be interpreted with caution. An alternative explanation for the heterogeneity may be due to background risk. The previous version of the review, included background breastfeeding initiation rates as a subgroup analyses, and did find that support interventions were more effective in reducing the number of women stopping exclusive breastfeeding at 4‐6 weeks and six months (but not for any breastfeeding at these time points). We did not include this in the meta‐regression due to difficulties in obtaining accurate background initiation data and instead used income country status of country which is associated with initiation as a proxy (Victora 2016), however, this may not have been sensitive enough to detect differences.
Effect estimates were larger for exclusive breastfeeding than for any breastfeeding at all‐time points for both breastfeeding only and breastfeeding plus interventions. For breastfeeding only interventions, effect estimates were larger for the shorter follow‐up time points (i.e. 4‐6 weeks, two months and 3‐4 months) versus 6‐12 months. This may be explained by the fact that the majority of interventions were more intensive in the first two months after birth. In addition, beyond this time point there are wider factors such as returning to paid employment and cultural practices around early introduction of solids (Alianmoghaddam 2018), which are less amenable to breastfeeding support. The reasons behind why there were greater effect estimates for exclusive breastfeeding than for any breastfeeding are difficult to extrapolate from our findings and this requires further qualitative work. However, a Realist Review on breastfeeding peer support suggested that greater effects for exclusive breastfeeding may be due to highly motivated mothers benefiting more from support (Trickey 2018). For 'breastfeeding plus' interventions, the picture is less consistent. Possible beneficial effects were found for women stopping exclusive breastfeeding at 4‐6 weeks and six months and there may be a small effect on women stopping any breastfeeding at six months. For all other outcomes the evidence is uncertain. The certainty of the evidence is greater for 'breastfeeding only' interventions with all being graded as moderate (except for stopping any breastfeeding at two months). Conversely, the majority of outcomes for 'breastfeeding plus' interventions were graded as low or very low.
Overall completeness and applicability of evidence
This update included 116 trials of which 103 contribute data. Following the screening of eligible studies for trustworthiness, a total of 54 studies were assigned to awaiting classification.
The number of mother‐infant pairs in these studies has increased to 98,816 from 74,656 in McFadden 2017. Whilst the majority of studies were still conducted in high‐income countries the proportion of studies conducted in low‐ and middle‐income countries has increased to 45% from 31% in McFadden 2017. More specifically, the 103 trials that contributed data to the analyses were conducted in 42 countries; 65 studies (54.8% of participants) in high‐income countries (HICs), 17 (22.9% of participants) in upper‐middle income countries (UMICs), 17 (14.5% of participants) in lower‐middle income countries (LMICs), and eight (7.7% of participants) in low‐income countries (LICs). This number and location of trials indicates that the challenge of supporting women to breastfeed is both longstanding and international; this is also reflected in the continuing low rates of duration and exclusivity of breastfeeding in many countries, despite increasing availability of good‐quality evidence of the scale of its public health impact. There was some evidence from the meta‐regression, that 'breastfeeding only' support may be associated with a more beneficial impact on exclusive breastfeeding at six months in LMICs, however, this should be interpreted with caution as there were no other differential effects based on income status of country for any other outcomes.
Whilst there has been some improvement in reporting quality in the newly‐added studies, the reporting of the included studies was not always comprehensive ‐ lacking, for example, in terms of a description of the components of the support intervention, details of the training and qualifications of the supporters, the definitions used of the extent of breastfeeding and in the description of adherence to the support protocol. There was also a failure to present details of the interventions and of the standard care available to both intervention and comparison groups. Very few of the trials described a theoretical basis for the intervention tested, with the result that the findings are difficult to explain or to replicate. Two issues that are worthy of further consideration are around the intervention provider and the measurement of breastfeeding.
First, in terms of the intervention provider, it was not always clear whether the provider was a professional or lay person. This was more frequently an issue in LMICs where there were a range of different intervention providers including community health workers and support workers. Whereas, in HICs, Lactation Consultants were used in a number of interventions and whilst lactation consultants may also be registered healthcare professionals, it is not essential for the role. To help manage this, we used the criteria outlined in Lewin 2010, which defined lay workers as receiving no formal professional or paraprofessional certificate or tertiary education degree. This therefore meant that community health workers, skilled birth attendants and support workers were classed as lay provider/non‐professionals and International Board Certified Lactation Consultants were classed as professionals for the purposes of the meta‐regression.
Secondly, the majority of studies did not report how exclusive breastfeeding duration was defined. When it was defined, 24 hour recall was the most frequently cited measure. Other measures included exclusive breastfeeding in the last week, last month or from birth. Previous research has shown that 24 hour recall over‐estimates the frequency of exclusive breastfeeding by approximately 20% (Belo 2011; Fenta 2017). This was evident in the one paper that measured exclusive breastfeeding at six months using data from “previous 24 hr”, “previous month” and “from birth” and demonstrated a range of results from 39.5% to 90% (Aidam 2005). In line with previous versions of the review we used 24‐hour recall data as these are the most frequently described, and acknowledge that this may result in an over‐estimation of exclusive breastfeeding in intervention and control groups.
This update involved two amendments to the inclusion criteria to better meet the needs of women in 2022 and beyond. The first was to include studies with healthy women who underwent caesarean section (e.g. for malpresentation, post‐term pregnancy, previous caesarean section, maternal choice). The second was to include interventions that provided support with digital technologies(e.g. SMS, web messenger services, social media, video calls). For the first amendment, we found no additional studies that could be included in this review. On further examination of the included studies, only eight document births by caesarean section as an exclusion criterion. Other studies did include women giving birth by caesarean section, however, due to lack of reporting we cannot establish what proportion of women gave birth via caesarean. There was also a lack of consideration of the additional needs women having a caesarean birth have (Beake 2017). Given that globally, an estimated 21.1% of women give birth via caesarean (Boerma 2018), this means that the results of this review may be less applicable to this sizeable group of women.
For the second amendment, inclusion of digital technologies, limited studies were found with only three studies using SMS and seven studies using online support such as Facebook groups, WhatsApp, Skype, Telemedicine and online forums. There were insufficient studies to properly assess this in the meta‐regression. However, looking at the studies individually did suggest that some were at least partially beneficial. However, given the small numbers involved conclusions cannot be drawn. It should also be considered that the studies included were conducted prior to the COVID‐19 pandemic and there is now an increased use and need for services to be delivered via digital technologies (Greenhalgh 2020). Additionally, it is now recognised that support provided via digital technologies may also improve accessibility, particularly for those living in remote areas (Kapinos 2019). Given that only seven out of 116 studies used digital interventions and half the studies used only face‐to‐face support, this limits the conclusions that can be drawn about support delivered in this way. Moreover, the COVID‐19 pandemic has increased the skills of both women and providers in using digital technologies (Fortuna 2020), which could arguably enhance the effectiveness of future interventions.
Finally, in this update, maternal mental health indicators were included as secondary outcomes. There was a striking lack of consideration of this as an outcome with only seven studies using measures of maternal mental health. Given that adverse maternal mental health has been shown to potentially have an impact on breastfeeding initiation, duration and exclusivity (Dalga 2021; Hoff 2019), breastfeeding support also needs to consider women’s emotional well‐being (Marshall 2021), and we currently cannot say if the included interventions are effective in this regard.
Quality of the evidence
We considered that the overall risk of bias of trials included in the review was mixed. Half of the studies were graded as being at low risk of bias for allocation concealment. However, for 'breastfeeding only' interventions when we carried out sensitivity analysis which included only those studies at low risk of bias for allocation concealment; the results were not substantially different. For 'breastfeeding plus' interventions, the same sensitivity analysis did reduce effect estimates and widen 95% confidence intervals (CIs) for the following three outcomes: stopping any and exclusive breastfeeding at six months and stopping exclusive breastfeeding at 4‐6 weeks. This is important as these were the only three outcomes where a possible beneficial effect was identified. The certainty of the evidence for each of these outcomes was therefore downgraded one due to risk of bias concerns.
Another possible source of bias was loss to follow‐up and missing outcome data. The previous version of the review excluded studies with attrition of greater than 25% from the meta‐analysis (McFadden 2017). However, in this update we did not restricted the meta‐analysis to studies with attrition of greater than 25% and instead performed a sensitivity analysis which restricted the analysis to studies at low risk of bias in this domain (Higgins 2019). For 'breastfeeding only' interventions, restricting the analysis to studies at low risk of bias for this domain suggested an increased effect estimate for all the primary outcomes and any and exclusive breastfeeding at two months. For 'breastfeeding plus' interventions, the sensitivity analyses demonstrated that two outcomes showed a larger effect estimate (any and exclusive breastfeeding at six months). Our approach to missing data adopted a ‘worst‐case scenario’ approach whereby we assumed all women who were lost to follow‐up stopped breastfeeding, and these sensitivity analyses suggest that effect estimate has generally been diluted. However, our overall effect estimate is likely still more appropriate given the possibility of response bias and the increased likelihood of women who stopped breastfeeding dropping out before those who continued. We have therefore not downgraded these outcomes due to risk of bias concerns. For a further two outcomes the 95% CIs moved to cross the line of no effect (stopping exclusive breastfeeding at 4‐6 weeks and two months). These two outcomes were downgraded one due to risk of bias concerns.
A potentially important source of bias in these studies was the general lack of blinding. Given the nature of the intervention, researchers would face considerable difficulties in blinding staff and women. Even when studies reported blinding participants and personnel there was no evidence to suggest this had been maintained. All studies were therefore graded at high or unclear risk of bias for this domain. While some studies did make attempts to blind the person collecting the data, all breastfeeding data were self‐reported. As it was not possible to adequately blind women to group status, there is a potential for bias (Higgins 2019). Therefore, all studies were judged as high risk of bias for this domain. This is a change to the last update of this review where self‐reporting was not fully considered in the risk of bias assessment (McFadden 2017). We did not downgrade for lack of blinding for either participants or personnel or outcome assessment.
The meta‐analyses identified substantial levels of heterogeneity which we attempted to explore via meta‐regression. The meta‐regression identified little in the way of differential effects, however, it should be cautioned that the power of this was limited.
For 'breastfeeding only' interventions, all primary outcomes were judged as moderate certainty based on the GRADE criteria. In addition, the following secondary outcomes were judged as moderate certainty: stopping exclusive breastfeeding at two months and stopping any and exclusive breastfeeding at 3‐4 months. All outcomes were downgraded one due to substantial levels of unexplained heterogeneity. For breastfeeding only interventions the following three outcomes were judged as low certainty: stopping any breastfeeding at two, nine and 12 months. Imprecision was a reason for downgrading for all outcomes. Stopping any breastfeeding at two months was also downgraded for substantial heterogeneity and stopping any breastfeeding at nine and 12 months were downgraded due to concerns around risk of bias.
For breastfeeding plus interventions, the certainty of the evidence was more mixed. Four outcomes were judged as moderate certainty: stopping any breastfeeding at 6 months, 4‐6 weeks, two months and 12 months. Stopping any breastfeeding at six months was downgraded one for concerns around risk of bias and the other three outcomes were downgraded due to concerns about imprecision. Three outcomes were judged as low certainty: stopping exclusive breastfeeding at six months and stopping any and exclusive breastfeeding at 3‐4 months. All three outcomes were downgraded one due to substantial heterogeneity. Stopping exclusive breastfeeding at six months was further downgraded one due to concerns around risk of bias. Stopping any and exclusive breastfeeding were further downgraded one due to concerns about imprecision. Finally, the certainty of the evidence for stopping exclusive breastfeeding at 4‐6 weeks and two months was judged as very low certainty. This was due to concerns around heterogeneity and risk of bias for both outcomes and also for concerns related to imprecision for stopping any breastfeeding at two months.
New to this update is the consideration of the studies in terms of their trustworthiness. This was an additional step that helped refine the studies included in the review. All potentially eligible studies from the updated search and all previously included studies were assessed against the new trustworthiness checklist. Study authors were contacted for more information if concerns around the following were identified: randomisation process; lack of prospective trial registration or evidence of ethics approval (if published after 2010); very low loss to follow‐up; the appearance of too similar baseline characteristics; implausible results; and for the case of abstracts, confirmation that the data comes from the final analysis. If there was no response or the response was unsatisfactory, the study was moved into awaiting classification. This process resulted in 54 studies being removed from the review which we believe improves the reliability of the review.
Potential biases in the review process
There is a potential for bias to be introduced at any stage of the review process. In order to minimise the bias in the review process, two review authors independently screened studies for inclusion and any disagreements were resolved by a third review author. Trustworthiness, data extraction, risk of bias assessment and GRADE application were performed by two review authors independently. Again, any discrepancies were resolved by a third review author. Where data were missing or unclear we attempted to contact study authors. It must be stressed that 'Risk of bias', trustworthiness and GRADE assessments are subjective in nature and therefore another team of review authors may have graded studies differently.
To minimise language bias any study not reported in English was translated into English and included in the review provided it met the inclusion criteria. Translation was not possible for two studies and these have been categorised as ‘awaiting classification’ (Raisi 2012; Sakkaki 2013).
Whilst we have attempted to identify all published and unpublished trials on breastfeeding support for healthy term women with healthy term babies, it is possible that not all existing trials have been included in this meta‐analysis. Funnel plot analyses generally demonstrated asymmetry, which may suggest that smaller studies showing a less beneficial effect of the intervention may be missing. However, as funnel plot asymmetry may be the result of other causes including heterogeneity, we explored this further. More specifically, we inspected all analyses where there was funnel plot asymmetry for evidence of heterogeneity. We found substantial statistical heterogeneity for all the outcomes and compared the findings of our random‐effects model with a fixed‐effect model (Sterne 2011). As the effect estimates were similar between the random‐effects and fixed‐effect models, we have considered that the funnel plot asymmetry may be a consequence of statistical heterogeneity and not publication bias (Sterne 2011), and we have not downgraded the certainty of the evidence on this basis. In these cases the evidence was downgraded for inconsistency due to statistical heterogeneity. However, it is not possible to completely rule out the presence of publication bias using this approach.
Agreements and disagreements with other studies or reviews
The overall findings of this review, that breastfeeding support interventions have been shown to be effective in reducing the risk of cessation of any breastfeeding and of exclusive breastfeeding, are similar to the findings of other reviews (McFadden 2019; Rollins 2016; Sinha 2015). Consistent with this review, other reviews have found greater effects on exclusive breastfeeding compared to any breastfeeding (Gavine 2022; McFadden 2019), and greater effects in low‐ and middle‐ income countries for exclusive breastfeeding at six months for 'breastfeeding only' interventions (Olufunlayo 2018; Shakya 2017). The smaller effect on exclusive breastfeeding at six months in high‐income countries may be explained by a floor effect as the baseline rates of exclusive breastfeeding at six months in high‐income countries are startlingly low (Victora 2016).
We concur with others, e.g. Hoddinott 2011 and Renfrew 2007, that it is critically important to identify the characteristics of support that may make this important but heterogenous intervention more or less effective in different circumstances and settings. For example, Jolly 2012b and Shakya 2017 found that peer support had a greater effect on reducing the risk of non‐exclusive breastfeeding in low‐ and middle‐income countries compared to high‐income countries. Other reviews have found that interventions to increase breastfeeding duration and exclusivity are more effective when delivered as multi‐component structured programmes such as the Baby Friendly Hospital Initiative/Baby Friendly Initiative in a combination of settings (Beake 2012; Pérez‐Escamilla 2016; Rollins 2016; Sinha 2015). In contrast, based on the large number, complexity and heterogeneity of interventions in this update, we did not find a meaningful methodology for determining which interventions could be categorised as multi‐component structured programmes.
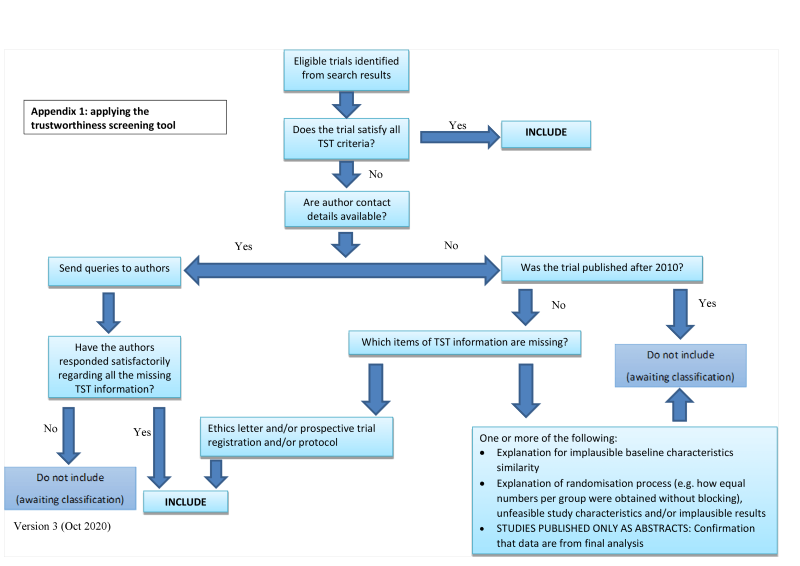
Applying the trustworthiness screening tool criteria

Risk of bias graph: review authors' judgements about each risk of bias item presented as percentages across all included studies

Risk of bias summary: review authors' judgements about each risk of bias item for each included study.
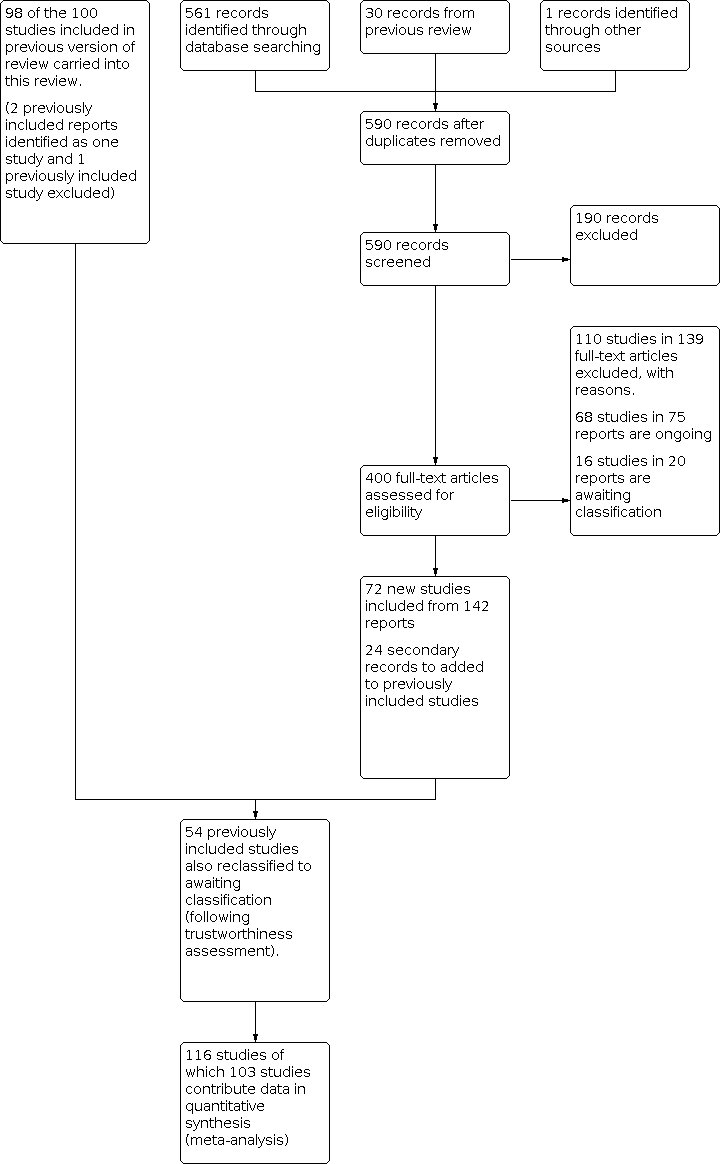
Study flow diagram

Funnel plot of comparison: 1 Breastfeeding only support versus usual care, outcome: 1.1 Stopping breastfeeding (any) at 6 months

Funnel plot of comparison 1: Breastfeeding only support versus usual care, outcome: 1.2 Stopping exclusive breastfeeding at 6 months

Funnel plot of comparison 1: Breastfeeding only support versus usual care, outcome: 1.3 Stopping breastfeeding (any) at 4‐6 weeks

Funnel plot of comparison: Breastfeeding only support versus usual care, outcome: 1.4 Stopping exclusive breastfeeding at 4‐6 weeks

Funnel plot of comparison 1: Breastfeeding only support versus usual care, outcome: 1.5Stopping breastfeeding (any) at 2 months

Funnel plot of comparison 1: Breastfeeding only support versus usual care, outcome: 1.6 Stopping exclusive breastfeeding at 2 months

Funnel plot of comparison 1: Breastfeeding only support versus usual care, outcome: 1.7 Stopping breastfeeding (any) at 3‐4 months

Funnel plot of comparison 1: Breastfeeding only support versus usual care, outcome: 1.8 Stopping breastfeeding at 3‐4 months

Funnel plot of comparison 2: Breastfeeding plus support versus usual care, outcome: 2.1 Stopping breastfeeding (any) at 6 months

Funnel plot of comparison 2: Breastfeeding plus support versus usual care, outcome: 2.2 Stopping exclusive breastfeeding at 6 months

Funnel plot of comparison 2: Breastfeeding plus support versus usual care, outcome: 2.6 Stopping exclusive breastfeeding at 2 months

Funnel Plot for Outcome 2.8 Stopping exclusive breastfeeding at 3‐4 months

Comparison 1: Breastfeeding only support versus usual care 2022, Outcome 1: Stopping breastfeeding (any) at 6 months

Comparison 1: Breastfeeding only support versus usual care 2022, Outcome 2: Stopping exclusive breastfeeding at 6 months

Comparison 1: Breastfeeding only support versus usual care 2022, Outcome 3: Stopping breastfeeding (any) at 4‐6 weeks

Comparison 1: Breastfeeding only support versus usual care 2022, Outcome 4: Stopping exclusive breastfeeding at 4‐6 weeks

Comparison 1: Breastfeeding only support versus usual care 2022, Outcome 5: Stopping breastfeeding (any) at 2 months

Comparison 1: Breastfeeding only support versus usual care 2022, Outcome 6: Stopping exclusive breastfeeding at 2 months

Comparison 1: Breastfeeding only support versus usual care 2022, Outcome 7: Stopping breastfeeding (any) at 3‐4 months

Comparison 1: Breastfeeding only support versus usual care 2022, Outcome 8: Stopping exclusive breastfeeding at 3‐4 months

Comparison 1: Breastfeeding only support versus usual care 2022, Outcome 9: Stopping any breastfeeding at 9 months

Comparison 1: Breastfeeding only support versus usual care 2022, Outcome 10: Stopping any breastfeeding at 12 months

Comparison 2: Breastfeeding plus support versus usual care 2022, Outcome 1: Stopping breastfeeding (any) at 6 months

Comparison 2: Breastfeeding plus support versus usual care 2022, Outcome 2: Stopping exclusive breastfeeding at 6 months

Comparison 2: Breastfeeding plus support versus usual care 2022, Outcome 3: Stopping breastfeeding (any) at 4‐6 weeks

Comparison 2: Breastfeeding plus support versus usual care 2022, Outcome 4: Stopping exclusive breastfeeding at 4‐6 weeks

Comparison 2: Breastfeeding plus support versus usual care 2022, Outcome 5: Stopping breastfeeding (any) at 2 months

Comparison 2: Breastfeeding plus support versus usual care 2022, Outcome 6: Stopping exclusive breastfeeding at 2 months

Comparison 2: Breastfeeding plus support versus usual care 2022, Outcome 7: Stopping breastfeeding (any) at 3‐4 months

Comparison 2: Breastfeeding plus support versus usual care 2022, Outcome 8: Stopping exclusive breastfeeding at 3‐4 months

Comparison 2: Breastfeeding plus support versus usual care 2022, Outcome 9: Stopping any breastfeeding at 12 months
| Breastfeeding support only compared to usual care | ||||||
| Patient or population: healthy breastfeeding women with healthy term babies | ||||||
| Outcomes | Anticipated absolute effects* (95% CI) | Relative effect | № of participants | Certainty of the evidence | Comments | |
|---|---|---|---|---|---|---|
| Risk with Usual care | Risk with Support | |||||
| Stopping breastfeeding (any) at 6 months | 600 per 1000 | 558 per 1000 | RR 0.93 | 14610 | ⊕⊕⊕⊝ | |
| Stopping exclusive breastfeeding at 6 months | 847 per 1000 | 763 per 1000 | RR 0.90 | 16332 | ⊕⊕⊕⊝ | |
| Stopping breastfeeding (any) at 4‐6 weeks | 308 per 1000 | 271 per 1000 | RR 0.88 | 11413 | ⊕⊕⊕⊝ | |
| Stopping exclusive breastfeeding at 4‐6 weeks | 518 per 1000 | 430 per 1000 | RR 0.83 | 14544 | ⊕⊕⊕⊝ | |
| Stopping breastfeeding (any) at 2 months | 384 per 1000 | 357 per 1000 | RR 0.93 | 3169 | ⊕⊕⊝⊝ | |
| Stopping exclusive breastfeeding at 2 months | 607 per 1000 | 491 per 1000 | RR 0.81 | 4317 | ⊕⊕⊕⊝ | |
| Stopping breastfeeding (any) at 3‐4 months | 462 per 1000 | 402 per 1000 | RR 0.87 | 12054 | ⊕⊕⊕⊝ | |
| Stopping exclusive breastfeeding at 3‐4 months | 731 per 1000 | 592 per 1000 | RR 0.81 | 11575 | ⊕⊕⊕⊝ | |
| Stopping breastfeeding at 9 months | 758 per 1000 | 660 per 1000 | RR 0.87 | 552 | ⊕⊕⊝⊝ | |
| Stopping breastfeeding at 12 months | 891 per 1000 | 846 per 1000 | RR 0.95 | 1311 | ⊕⊕⊝⊝ | |
| *The risk in the intervention group (and its 95% confidence interval) is based on the assumed risk in the comparison group and the relative effect of the intervention (and its 95% CI). | ||||||
| GRADE Working Group grades of evidence | ||||||
| See interactive version of this table: https://gdt.gradepro.org/presentations/#/isof/isof_question_revman_web_431686173574519163. | ||||||
| a We downgraded 1 level for serious concerns about inconsistency. Evidence of substantial unexplained heterogeneity. | ||||||
| Support plus compared to usual care for healthy breastfeeding women with healthy term babies | ||||||
| Patient or population: healthy breastfeeding women with healthy term babies | ||||||
| Outcomes | Anticipated absolute effects* (95% CI) | Relative effect | № of participants | Certainty of the evidence | Comments | |
|---|---|---|---|---|---|---|
| Risk with usual care | Risk with Support plus | |||||
| Stopping breastfeeding (any) at 6 months | 541 per 1000 | 508 per 1000 | RR 0.94 | 4879 | ⊕⊕⊕⊝ | |
| Stopping exclusive breastfeeding at 6 months | 685 per 1000 | 541 per 1000 | RR 0.79 | 7650 | ⊕⊕⊝⊝ | |
| Stopping breastfeeding (any) at 4‐6 weeks | 433 per 1000 | 407 per 1000 | RR 0.94 | 2325 | ⊕⊕⊕⊝ | |
| Stopping exclusive breastfeeding at 4‐6 weeks | 542 per 1000 | 396 per 1000 | RR 0.73 | 2402 | ⊕⊝⊝⊝ | |
| Stopping breastfeeding (any) at 2 months | 363 per 1000 | 334 per 1000 | RR 0.92 | 2089 | ⊕⊕⊕⊝ | |
| Stopping exclusive breastfeeding at 2 months | 425 per 1000 | 382 per 1000 | RR 0.90 | 4537 | ⊕⊝⊝⊝ | |
| Stopping breastfeeding (any) at 3‐4 months | 386 per 1000 | 374 per 1000 | RR 0.97 | 2064 | ⊕⊕⊝⊝ | |
| Stopping exclusive breastfeeding at 3‐4 months | 587 per 1000 | 505 per 1000 | RR 0.86 | 4766 | ⊕⊕⊝⊝ | |
| Stopping breastfeeding (any) at 12 months | 858 per 1000 | 823 per 1000 | RR 0.96 | 1431 | ⊕⊕⊕⊝ | |
| Stopping breastfeeding (any) at 9 months ‐ not reported | ‐ | ‐ | ‐ | ‐ | ‐ | |
| *The risk in the intervention group (and its 95% confidence interval) is based on the assumed risk in the comparison group and the relative effect of the intervention (and its 95% CI). | ||||||
| GRADE Working Group grades of evidence | ||||||
| See interactive version of this table: https://gdt.gradepro.org/presentations/#/isof/isof_question_revman_web_431754481798286092. | ||||||
| a We downgraded 1 level for serious concerns on risk of bias. Studies at risk of selection bias due to unclear allocation concealment. | ||||||
| Factor | Number of studies | Number of women | RR (95% CI) | P value | Total model statistics | ||||
| Tau2 | Chi2 | df | P value | I2 | |||||
|
| 33 |
|
|
|
|
|
|
|
|
| PERSON: |
|
|
|
| 0.0074 | 83.1435 | 30 | <0.0001 | 58.56 |
| Professional | 22 | 10214 | 1 |
|
|
|
|
|
|
| Non‐Professional | 8 | 3366 | 0.958 (0.866, 1.060) | 0.406 |
|
|
|
|
|
| Prof + Non‐prof | 3 | 1030 | 1.037 (0.911, 1.181) | 0.583 |
|
|
|
|
|
| Unspecified | 0 | ‐ | ‐ |
|
|
|
|
|
|
|
|
|
|
|
|
|
|
|
|
|
| INTENSITY: |
|
|
|
| 0.0060 | 74.3190 | 29 | <0.0001 | 52.73 |
| Low | 5 | 2159 | 1 |
|
|
|
|
|
|
| Moderate | 5 | 962 | 0.913 (0.796, 1.047) | 0.194 |
|
|
|
|
|
| High | 17 | 6276 | 0.939 (0.841, 1.048) | 0.262 |
|
|
|
|
|
| Unspecified | 6 | 5213 | 0.989 (0.877, 1.115) | 0.857 |
|
|
|
|
|
|
|
|
|
|
|
|
|
|
|
|
| SUPPORT: |
|
|
|
| 0.0072 | 81.8609 | 28 | <0.0001 | 61.13 |
| F2F | 11 | 7508 | 1 |
|
|
|
|
|
|
| F2F and phone | 13 | 3681 | 1.009 (0.918, 1.109) | 0.857 |
|
|
|
|
|
| F2F, phone and digital | 1 | 103 | 0.984 (0.710, 1.364) | 0.924 |
|
|
|
|
|
| Phone | 6 | 2820 | 1.002 (0.888, 1.132) | 0.972 |
|
|
|
|
|
| Digital | 2 | 498 | 0.845 (0.648, 1.102) | 0.213 |
|
|
|
|
|
|
|
|
|
|
|
|
|
|
|
|
| INCOME: |
|
|
|
|
|
|
|
|
|
| LMIC | 7 | 3037 | 1 |
| 0.0052 | 81.7673 | 31 | <0.0001 | 53.32 |
| HMIC | 26 | 11573 | 1.069 (0.967, 1.183) | 0.193 |
|
|
|
|
|
| CI: confidence interval;RR: risk ratio. | |||||||||
|
|
|
|
|
| Total model statistics |
| |||
| Factor | Number of interventions | Number of women | RR (95% CI) | P value | Tau2 | Chi2 | P value | I2 |
|
|---|---|---|---|---|---|---|---|---|---|
|
| 44 |
|
|
|
|
|
|
|
|
| PERSON: |
|
|
|
| 0.0251 | 233.3179 | 40 | <0.0001 | 97.31 |
| Professional | 28 | 11780 | 1 |
|
|
|
|
|
|
| Non‐Professional | 12 | 3663 | 0.966 (0.853, 1.093) | 0.583 |
|
|
|
|
|
| Prof + Non‐prof | 3 | 749 | 1.024 (0.832, 1.259) | 0.826 |
|
|
|
|
|
| Unspecified | 1 | 140 | 0.345 (0.149, 0.799) | 0.013 |
|
|
|
|
|
|
|
|
|
|
|
|
|
|
|
|
| INTENSITY: |
|
|
|
| 0.0233 | 244.6064 | 40 | <0.0001 | 96.02 |
| Low | 7 | 5603 | 1 |
|
|
|
|
|
|
| Moderate | 14 | 2896 | 0.815 (0.696, 0.953) | 0.010 |
|
|
|
|
|
| High | 18 | 6315 | 0.949 (0.822, 1.096) | 0.476 |
|
|
|
|
|
| Unspecified | 5 | 1518 | 0.952 (0.789, 1.147) | 0.603 |
|
|
|
|
|
|
|
|
|
|
|
|
|
|
|
|
| SUPPORT: |
|
|
|
| 0.0245 | 218.5338 | 39 | <0.0001 | 96.37 |
| F2F | 20 | 6027 | 1 |
|
|
|
|
|
|
| F2F and phone | 13 | 6647 | 1.113 (0.982, 1.260) | 0.093 |
|
|
|
|
|
| F2F, phone and digital | 1 | 20 | 1.199 (0.779, 1.845) | 0.409 |
|
|
|
|
|
| Phone | 8 | 3043 | 1.059 (0.919, 1.220) | 0.425 |
|
|
|
|
|
| Digital | 2 | 595 | 1.016 (0.793, 1.303) | 0.898 |
|
|
|
|
|
|
|
|
|
|
|
|
|
|
|
|
| INCOME: |
|
|
|
| 0.0187 | 230.0321 | 42 | <0.0001 | 96.31 |
| LMIC | 22 | 5622 | 1 |
|
|
|
|
|
|
| HMIC | 22 | 10710 | 1.151 (1.047, 1.265) | 0.003 |
|
|
|
|
|
|
|
|
|
|
|
|
|
|
|
|
| CI: confidence interval;RR: risk ratio. | |||||||||
| Factor | Number of studies | Number of women | RR (95% CI) | P value | Total model statistics | ||||
| Tau2 | Chi2 | df | P value | I2 | |||||
|
| 37 |
|
|
|
|
|
|
|
|
| PERSON: |
|
|
|
| 0.0909 | 110.94 | 34 | <0.0001 | 76.55 |
| Professional | 27 | 7526 | 1 |
|
|
|
|
|
|
| Non‐Professional | 8 | 2882 | 0.963 (0.717, 1.293) | 0.801 |
|
|
|
|
|
| Prof + Non‐prof | 2 | 774 | 1.182 (0.723, 1.934) | 0.505 |
|
|
|
|
|
| Unspecified | 0 | ‐ | ‐ | ‐ |
|
|
|
|
|
|
|
|
|
|
|
|
|
|
|
|
| INTENSITY: |
|
|
|
| 0.0966 | 100.86 | 33 | <0.0001 | 75.74 |
| Low | 11 | 4548 | 1 |
|
|
|
|
|
|
| Moderate | 8 | 1323 | 0.749 (0.504, 1.115) | 0.155 |
|
|
|
|
|
| High | 15 | 4019 | 0.991 (0.732, 1.342) | 0.953 |
|
|
|
|
|
| Unspecified | 3 | 1292 | 1.349 (0.839, 2.168) | 0.217 |
|
|
|
|
|
|
|
|
|
|
|
|
|
|
|
|
| SUPPORT/TYPE: |
|
|
|
| 0.1056 | 108.26 | 33 | <0.0001 | 79.59 |
| F2F | 11 | 4631 | 1 |
|
|
|
|
|
|
| F2F and phone | 17 | 3893 | 1.027 (0.754, 1.398) | 0.866 |
|
|
|
|
|
| F2F, phone and digital | 0 | ‐ | ‐ | ‐ |
|
|
|
|
|
| Phone | 7 | 2173 | 0.923 (0.624, 1.364) | 0.687 |
|
|
|
|
|
| Digital | 2 | 485 | 1.437 (0.707, 2.919) | 0.316 |
|
|
|
|
|
|
|
|
|
|
|
|
|
|
|
|
| INCOME: |
|
|
|
| 0.0770 | 104.47 | 35 | <0.0001 | 76.01 |
| LMIC | 7 | 2688 | 1 |
|
|
|
|
|
|
| HMIC | 30 | 8494 | 1.257 (0.903, 1.750) | 0.175 |
|
|
|
|
|
| CI: confidence interval;RR: risk ratio. | |||||||||
| Factor | Number of studies | Number of women | RR (95% CI) | P value | Total model statistics | ||||
| Tau2 | Chi2 | df | P value | I2 | |||||
|
| 45 |
|
|
|
|
|
|
|
|
| PERSON: |
|
|
|
|
|
|
|
|
|
| Professional | 31 | 11266 | 1 |
| 0.0480 | 231.253 | 42 | <00001 | 91.75 |
| Non‐Professional | 11 | 2529 | 0.853 (0.710, 1.025) | 0.09 |
|
|
|
|
|
| Prof + Non‐prof | 3 | 749 | 1.288 (0.939, 1.766) | 0.116 |
|
|
|
|
|
| Unspecified | 0 | ‐ | ‐ | ‐ |
|
|
|
|
|
|
|
|
|
|
|
|
|
|
|
|
| INTENSITY: |
|
|
|
|
|
|
|
|
|
| Low | 12 | 7327 | 1 |
| 0.0516 | 197.13 | 41 | <0.0001 | 89.54 |
| Moderate | 13 | 2113 | 0.790 (0.633, 0.986) | 0.037 |
|
|
|
|
|
| High | 17 | 4330 | 1.015 (0.836, 1.232) | 0.879 |
|
|
|
|
|
| Unspecified | 3 | 774 | 1.067 (0.754, 1.511) | 0.714 |
|
|
|
|
|
|
|
|
|
|
|
|
|
|
|
|
| SUPPORT: |
|
|
|
| 0.0612 | 207.04 | 40 | <0.0001 | 90.91 |
| F2F | 17 | 4679 | 1 |
|
|
|
|
|
|
| F2F and phone | 17 | 6797 | 1.016 (0.837, 1.24) | 0.869 |
|
|
|
|
|
| F2F, phone and digital | 1 | 20 | 1.193 (0.285, 4.991) | 0.809 |
|
|
|
|
|
| Phone | 7 | 2312 | 0.925 (0.714, 1.199) | 0.556 |
|
|
|
|
|
| Digital | 3 | 736 | 0.867 (0.591, 1.272) | 0.464 |
|
|
|
|
|
|
|
|
|
|
|
|
|
|
|
|
| INCOME: |
|
|
|
| 0.0508 | 223.312 | 43 | <0.0001 | 93.12 |
| LMIC | 15 | 3223 | 1 |
|
|
|
|
|
|
| HMIC | 30 | 11321 | 1.126 (0.942, 1.347) | 0.193 |
|
|
|
|
|
| Factor | Number of studies | Number of women | RR (95% CI) | P value | Total model statistics | ||||
| Tau2 | Chi2 | df | P value | I2 | |||||
|
| 12 |
|
|
|
|
|
|
|
|
| PERSON: |
|
|
|
| <0.00005 | 4.5171 | 9 | 0.8742 | <0.001 |
| Professional | 8 | 3601 | 1 |
|
|
|
|
|
|
| Non‐Professional | 3 | 1221 | 1.045 (0.969, 1.127) | 0.25 |
|
|
|
|
|
| Prof + Non‐prof | 0 | ‐ |
|
|
|
|
|
|
|
| Unspecified | 1 | 57 | 0.775 (0.605, 0.994) | 0.044 |
|
|
|
|
|
|
|
|
|
|
|
|
|
|
|
|
| INTENSITY: |
|
|
|
| <0.00005 | 9.0329 | 8 | 0.3395 | 0.76 |
| Low | 1 | 1154 | 1 |
|
|
|
|
|
|
| Moderate | 4 | 1236 | 1.037 (0.879, 1.225) | 0.664 |
|
|
|
|
|
| High | 5 | 1607 | 0.990 (0.891, 1.100) | 0.855 |
|
|
|
|
|
| Unspecified | 2 | 882 | 0.884 (0.667, 1.171) | 0.391 |
|
|
|
|
|
|
|
|
|
|
|
|
|
|
|
|
| SUPPORT: |
|
|
|
| <0.00005 | 10.2209 | 10 | 0.4213 | 0.12 |
| F2F | 11 | 4469 | 1 |
|
|
|
|
|
|
| F2F and phone | 1 | 410 | 0.969 (0.606, 1.548) | 0.895 |
|
|
|
|
|
| F2F, phone and digital | 0 | ‐ |
|
|
|
|
|
|
|
| Phone | 0 | ‐ |
|
|
|
|
|
|
|
| Digital | 0 | ‐ |
|
|
|
|
|
|
|
|
|
|
|
|
|
|
|
|
|
|
| INCOME: |
|
|
|
|
|
|
|
|
|
| LMIC | 2 | 1012 | 1 |
| <0.00005 | 9.537 | 10 | 0.4820 | <0.005 |
| HMIC | 10 | 3867 | 0.872 (0.633, 1.202) | 0.402 |
|
|
|
|
|
| Factor | Number of studies | Number of women | RR (95% CI) | P value | Total model statistics | ||||
| Tau2 | Chi2 | df | P value | I2 | |||||
|
| 14 |
|
|
|
|
|
|
|
|
| PERSON: |
|
|
|
| 0.2225 | 213.847 | 12 | <0.0001 | 99.03 |
| Professional | 9 | 4671 | 1 |
|
|
|
|
|
|
| Non‐Professional | 5 | 2979 | 1.033 (0.612, 1.744) | 0.903 |
|
|
|
|
|
| Prof + Non‐prof | 0 | ‐ | ‐ |
|
|
|
|
|
|
| Unspecified | 0 | ‐ | ‐ |
|
|
|
|
|
|
|
|
|
|
|
|
|
|
|
|
|
| INTENSITY: |
|
|
|
| 0.487 | 189.8528 | 10 | <0.0001 | 99.02 |
| Low | 1 | 1154 | 1 |
|
|
|
|
|
|
| Moderate | 3 | 1165 | 0.993 (0.332, 2.969) | 0.990 |
|
|
|
|
|
| High | 8 | 4449 | 0.692 (0.253, 1.898) | 0.475 |
|
|
|
|
|
| Unspecified | 2 | 882 | 0.683 (0.212, 2.200) | 0.523 |
|
|
|
|
|
|
|
|
|
|
|
|
|
|
|
|
| SUPPORT: |
|
|
|
| 0.0584 | 68.6107 | 11 | <0.0001 | 97.25 |
| F2F | 11 | 6004 | 1 |
|
|
|
|
|
|
| F2F and phone | 2 | 1447 | 0.338 (0.225, 0.508) | <0.005 |
|
|
|
|
|
| F2F, phone and digital | 0 | ‐ | ‐ |
|
|
|
|
|
|
| Phone | 0 | ‐ | ‐ |
|
|
|
|
|
|
| Digital | 1 | 199 | 0.776 (0.440, 1.369) | 0.382 |
|
|
|
|
|
|
|
|
|
|
|
|
|
|
|
|
| INCOME: |
|
|
|
| 0.1712 | 181.2251 | 12 | <0.0001 | 98.91 |
| LMIC | 6 | 3807 | 1 |
|
|
|
|
|
|
| HMIC | 8 | 3843 | 1.517 (0.968, 2.377) | 0.069 |
|
|
|
|
|
| CI: confidence interval;RR: risk ratio. | |||||||||
| Factor | Number of studies | Number of women | RR (95% CI) | P value | Total model statistics | ||||
| Tau2 | Chi2 | df | P value | I2 | |||||
|
| 7 |
|
|
|
|
|
|
|
|
| PERSON: |
|
|
|
| <0.00005 | 9.8833 | 5 | 0.0786 | 0.01 |
| Professional | 5 | 1454 | 1 |
|
|
|
|
|
|
| Non‐Professional | 2 | 871 | 1.046 (0.849, 1.290) | 0.67 |
|
|
|
|
|
| Prof + Non‐prof | 0 | ‐ | ‐ |
|
|
|
|
|
|
| Unspecified | 0 | ‐ | ‐ |
|
|
|
|
|
|
|
|
|
|
|
|
|
|
|
|
|
| INTENSITY: |
|
|
|
| <0.00005 | 4.3241 | 4 | 0.3639 | 0.01 |
| Low | 0 | ‐ | ** NOTE baseline ‘Moderate’ |
|
|
|
|
|
|
| Moderate | 3 | 681 | 1 |
|
|
|
|
|
|
| High | 3 | 1172 | 1.015 (0.799, 1.289) |
|
|
|
|
|
|
| Unspecified | 1 | 472 | Not included in model |
|
|
|
|
|
|
|
|
|
|
|
|
|
|
|
|
|
| SUPPORT: |
|
|
|
| <0.00005 | 9.9954 | 5 | 0.0754 | 0.02 |
| F2F | 6 | 2090 | 1 |
|
|
|
|
|
|
| F2F and phone | 1 | 235 | 1.042 (0.769, 1.411) | 0.793 |
|
|
|
|
|
| F2F, phone and digital | 0 | ‐ | ‐ |
|
|
|
|
|
|
| Phone | 0 | ‐ | ‐ |
|
|
|
|
|
|
| Digital | 0 | ‐ | ‐ |
|
|
|
|
|
|
|
|
|
|
|
|
|
|
|
|
|
| INCOME: |
|
|
|
| N/A | N/A | N/A | N/A | N/A |
| LMIC | 0 | ‐ |
|
|
|
|
|
|
|
| HMIC | 7 | 2325 | N/A |
|
|
|
|
|
|
| CI: confidence interval;RR: risk ratio. | |||||||||
| Factor | Number of studies | Number of women | RR (95% CI) | P value | Total model statistics | ||||
| Tau2 | Chi2 | df | P value | I2 | |||||
|
| 7 |
|
|
|
|
|
|
|
|
| PERSON: |
|
|
|
| 0.457 | 45.2117 | 4 | <0.0001 | 94.89 |
| Professional | 5 | 1651 | 1 |
|
|
|
|
|
|
| Non‐Professional | 2 | 751 | 0.697 (0.213, 2.280) |
|
|
|
|
|
|
| Prof + Non‐prof | 0 | ‐ | ‐ |
|
|
|
|
|
|
| Unspecified | 0 | ‐ | ‐ |
|
|
|
|
|
|
|
|
|
|
|
|
|
|
|
|
|
| INTENSITY: |
|
|
|
| 0.4011 | 45.0465 | 4 | <0.0001 | 95.05 |
| Low | 0 | ‐ | ** NOTE baseline ‘Moderate’ |
|
|
|
|
|
|
| Moderate | 2 | 529 | 1 |
|
|
|
|
|
|
| High | 4 | 1401 | 0.561 (0.185, 1.701) | 0.307 |
|
|
|
|
|
| Unspecified | 1 | 472 | Not included in model |
|
|
|
|
|
|
|
|
|
|
|
|
|
|
|
|
|
| SUPPORT: |
|
|
|
| 0.3455 | 44.1268 | 5 | 0.0001 | 95.79 |
| F2F | 5 | 1834 | 1 |
|
|
|
|
|
|
| F2F and phone | 2 | 568 | 0.659 (0.236, 1.839) | 0.426 |
|
|
|
|
|
| F2F, phone and digital | 0 | ‐ | ‐ |
|
|
|
|
|
|
| Phone | 0 | ‐ | ‐ |
|
|
|
|
|
|
| Digital | 0 | ‐ | ‐ |
|
|
|
|
|
|
|
|
|
|
|
|
|
|
|
|
|
| INCOME: |
|
|
|
| 0.4544 | 42.7192 | 4 | <0.0001 | 95.86 |
| LMIC | 2 | 568 | 1 |
|
|
|
|
|
|
| HMIC | 5 | 1834 | 1.517 (0.457, 5.040) | 0.496 |
|
|
|
|
|
| CI: confidence interval;RR: risk ratio. | |||||||||
| Outcome or subgroup title | No. of studies | No. of participants | Statistical method | Effect size |
| 1.1 Stopping breastfeeding (any) at 6 months Show forest plot | 30 | 14610 | Risk Ratio (M‐H, Random, 95% CI) | 0.93 [0.89, 0.97] |
| 1.2 Stopping exclusive breastfeeding at 6 months Show forest plot | 40 | 16332 | Risk Ratio (M‐H, Random, 95% CI) | 0.90 [0.88, 0.93] |
| 1.3 Stopping breastfeeding (any) at 4‐6 weeks Show forest plot | 36 | 11413 | Risk Ratio (M‐H, Random, 95% CI) | 0.88 [0.79, 0.97] |
| 1.4 Stopping exclusive breastfeeding at 4‐6 weeks Show forest plot | 42 | 14544 | Risk Ratio (M‐H, Random, 95% CI) | 0.83 [0.76, 0.90] |
| 1.5 Stopping breastfeeding (any) at 2 months Show forest plot | 13 | 3169 | Risk Ratio (M‐H, Random, 95% CI) | 0.93 [0.77, 1.11] |
| 1.6 Stopping exclusive breastfeeding at 2 months Show forest plot | 17 | 4317 | Risk Ratio (M‐H, Random, 95% CI) | 0.81 [0.74, 0.89] |
| 1.7 Stopping breastfeeding (any) at 3‐4 months Show forest plot | 32 | 12054 | Risk Ratio (M‐H, Random, 95% CI) | 0.87 [0.81, 0.93] |
| 1.8 Stopping exclusive breastfeeding at 3‐4 months Show forest plot | 43 | 11575 | Risk Ratio (M‐H, Random, 95% CI) | 0.81 [0.77, 0.85] |
| 1.9 Stopping any breastfeeding at 9 months Show forest plot | 1 | 552 | Risk Ratio (M‐H, Random, 95% CI) | 0.87 [0.78, 0.97] |
| 1.10 Stopping any breastfeeding at 12 months Show forest plot | 2 | 1311 | Risk Ratio (M‐H, Random, 95% CI) | 0.95 [0.90, 1.00] |
| Outcome or subgroup title | No. of studies | No. of participants | Statistical method | Effect size |
| 2.1 Stopping breastfeeding (any) at 6 months Show forest plot | 11 | 4879 | Risk Ratio (M‐H, Random, 95% CI) | 0.94 [0.91, 0.97] |
| 2.2 Stopping exclusive breastfeeding at 6 months Show forest plot | 13 | 7650 | Risk Ratio (M‐H, Random, 95% CI) | 0.79 [0.70, 0.90] |
| 2.3 Stopping breastfeeding (any) at 4‐6 weeks Show forest plot | 6 | 2325 | Risk Ratio (M‐H, Random, 95% CI) | 0.94 [0.82, 1.08] |
| 2.4 Stopping exclusive breastfeeding at 4‐6 weeks Show forest plot | 6 | 2402 | Risk Ratio (M‐H, Random, 95% CI) | 0.73 [0.57, 0.95] |
| 2.5 Stopping breastfeeding (any) at 2 months Show forest plot | 4 | 2089 | Risk Ratio (M‐H, Random, 95% CI) | 0.92 [0.79, 1.07] |
| 2.6 Stopping exclusive breastfeeding at 2 months Show forest plot | 9 | 4537 | Risk Ratio (M‐H, Random, 95% CI) | 0.90 [0.78, 1.03] |
| 2.7 Stopping breastfeeding (any) at 3‐4 months Show forest plot | 5 | 2064 | Risk Ratio (M‐H, Random, 95% CI) | 0.97 [0.81, 1.15] |
| 2.8 Stopping exclusive breastfeeding at 3‐4 months Show forest plot | 10 | 4766 | Risk Ratio (M‐H, Random, 95% CI) | 0.86 [0.75, 1.00] |
| 2.9 Stopping any breastfeeding at 12 months Show forest plot | 2 | 1431 | Risk Ratio (M‐H, Random, 95% CI) | 0.96 [0.91, 1.00] |