Dornase alfa for cystic fibrosis
Información
- DOI:
- https://doi.org/10.1002/14651858.CD001127.pub3Copiar DOI

- Base de datos:
-
- Cochrane Database of Systematic Reviews
- Versión publicada:
-
- 04 abril 2016see what's new
- Tipo:
-
- Intervention
- Etapa:
-
- Review
- Grupo Editorial Cochrane:
-
Grupo Cochrane de Fibrosis quística y enfermedades genéticas
- Copyright:
-
- Copyright © 2016 The Cochrane Collaboration. Published by John Wiley & Sons, Ltd.
Cifras del artículo
Altmetric:
Citado por:
Autores
Contributions of authors
Original review
Dr Kearney and Dr Wallis screened, appraised and abstracted data.
Dr Kearney sought additional information from authors. Data entry for the original review was performed by Dr Kearney and interpreted by Dr Kearney, Dr Wallis, Prof Ashby and with advice from the Cochrane Cystic Fibrosis and Genetic Disorders Group.
The review was conceived by the Cochrane Cystic Fibrosis and Genetic Disorders Group and designed by Dr Kearney.
May 2003
Change of lead reviewer from Dr Catherine Kearney to Mr Ashley Jones. Mr Ashley Jones and a colleague, Miss Tracey Remmington, carried out additional screening.
Mr Ashley Jones completed data entry.
October 2009
Dr Catherine Kearney has stepped down from the review team.
March 2016
Change of lead reviewer from Mr Ashley Jones, who has stepped down from the review, to Dr Connie Yang. Dr Connie Yang now acts as guarantor for the review. Dr Mark Chilvers, Dr Mark Montgomery and Sarah Nolan are now co‐authors on the review.
Sources of support
Internal sources
-
No sources of support supplied
External sources
-
National Institute for Health Research, UK.
This systematic review was supported by the National Institute for Health Research, via Cochrane Infrastructure funding to the Cochrane Cystic Fibrosis and Genetic Disorders Group.
Declarations of interest
Dr Connie Yang has received support from Novartis to attend the Killarney Cystic Fibrosis Meeting.
Dr Mark Chilvers is on the Advisory Board for dornase alfa and has received payment for this (one day each in 2013 and 2014) and for presentations on the off‐label use of dornase alfa (one day in 2014).
Dr. Montgomery and Sarah Nolan have no conflicts of interest.
Acknowledgements
We thank Tracey Remmington for independently extracting data and assessing trial quality for an earlier version of this review. We would also like to thank Mr Ashley Jones and Dr Catherine Kearney for their contributions to earlier versions of this review.
This systematic review has been made possible due to researchers providing their data and helpfully answering our queries. These include:
-
Dr H Fuchs and Dr C Johnson, Genentech, California, USA;
-
Prof Wilmott, Children's Hospital Medical Centre, Cincinnati, USA;
-
Dr P Shah, Chelsea and Westminster Hospital, London, UK;
-
Prof Zach, Uni Klinik fur Kinder‐und Jugendheilkunde, Germany;
-
W Greiner, North German Centre for Health Research, Germany;
-
Prof M Hodson, Royal Brompton Hospital, London, UK;
-
Dr Brinckswirth, St. Bartholomew's and The Royal London School of Medicine and Dentistry, London, UK;
-
Dr M Aitken, University of Washington Medical Centre, Washington, USA;
-
Mrs Mary Dodd, University Hospital of South Manchester, UK;
-
Dr Fabíola V. Adde, School of Medicine, Universidade de São Paulo, Brazil;
-
Dr. R Amin, Hospital for Sick Children, Toronto, CA;
-
Contacts at Pharmaxis who kindly supplied the additional data for the analyses: Frazer Chidwick, Kristen Morgan, Joanna Leadbetter and Brett Charlton.
Version history
| Published | Title | Stage | Authors | Version |
| 2021 Mar 18 | Dornase alfa for cystic fibrosis | Review | Connie Yang, Mark Montgomery | |
| 2018 Sep 06 | Dornase alfa for cystic fibrosis | Review | Connie Yang, Mark Montgomery | |
| 2016 Apr 04 | Dornase alfa for cystic fibrosis | Review | Connie Yang, Mark Chilvers, Mark Montgomery, Sarah J Nolan | |
| 2010 Mar 17 | Dornase alfa for cystic fibrosis | Review | Ashley P Jones, Colin Wallis | |
| 2003 Jul 21 | Dornase alfa for cystic fibrosis | Review | Ashley P Jones, Colin Wallis, Catherine E Kearney | |
Differences between protocol and review
Update 2016
-
Two outcome measures have been added to the primary outcome of changes in lung function: lung clearance index and forced expiratory volume at 0.5 seconds (FEV0.5 ). Lung clearance index has the potential to detect onset of patchy respiratory involvement in CF in mild or early lung disease. FEV0.5 is a more valid measure in young children because of short expiratory times.
-
The outcome 'Mean number of deaths' has been moved from 'Primary outcomes' to 'Secondary outcomes', since current Cochrane policy is to limit the number of primary outcomes to three.
-
In a post hoc change, in line with Cochrane guidance, the authors have presented five summary of findings tables; one for each comparison including the primary outcomes of the review at the three or six months follow up, or both.
Notes
Absolute difference = (post intervention value) ‐ (pre intervention value)
Relative difference = [(post intervention value) ‐ (pre intervention value)] /( pre intervention value)
Keywords
MeSH
Medical Subject Headings (MeSH) Keywords
- Cystic Fibrosis [*drug therapy];
- Deoxyribonuclease I [adverse effects, *therapeutic use];
- Expectorants [adverse effects, *therapeutic use];
- Forced Expiratory Volume;
- Mannitol [therapeutic use];
- Randomized Controlled Trials as Topic;
- Recombinant Proteins [adverse effects, therapeutic use];
- Saline Solution, Hypertonic [therapeutic use];
- Vital Capacity;
Medical Subject Headings Check Words
Adolescent; Child; Child, Preschool; Humans; Infant;
PICO
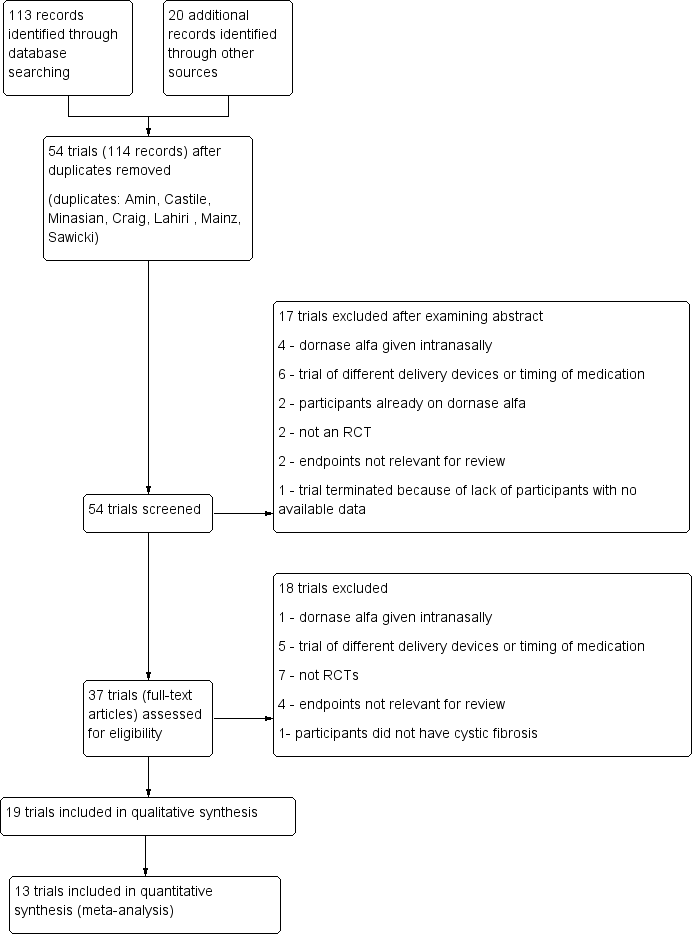
Study flow diagram.
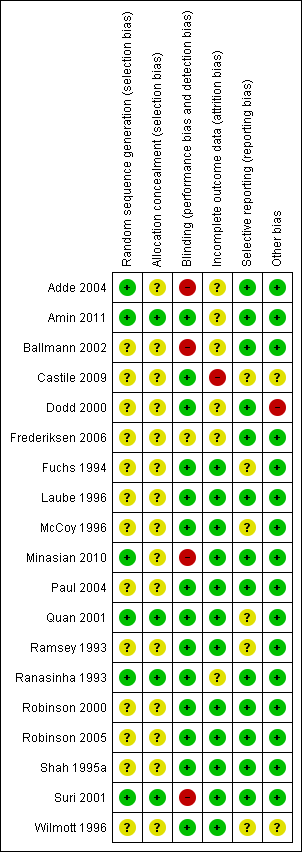
Risk of bias summary: review authors' judgements about each risk of bias item for each included study.

Comparison 1 Dornase alfa versus placebo, Outcome 1 Relative mean % change in FEV1 (% predicted).

Comparison 1 Dornase alfa versus placebo, Outcome 2 Relative mean % change in FEV1 (% predicted) at one month ‐ subgroup analysis by disease severity.

Comparison 1 Dornase alfa versus placebo, Outcome 3 Absolute mean % change in FEV1 (% predicted).
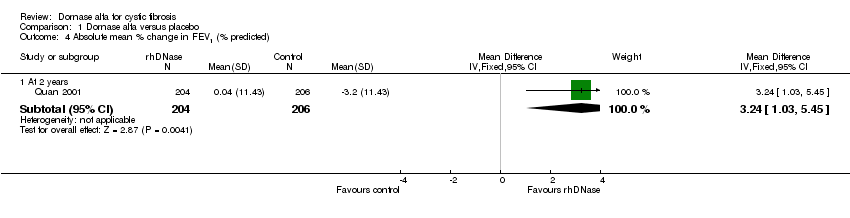
Comparison 1 Dornase alfa versus placebo, Outcome 4 Absolute mean % change in FEV1 (% predicted).
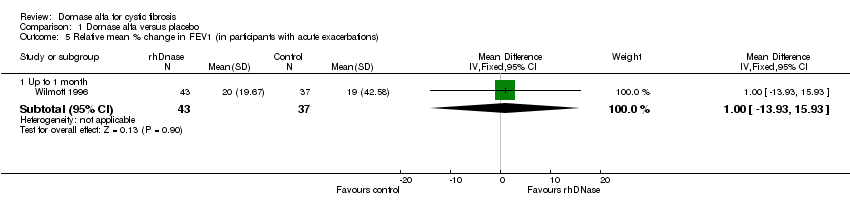
Comparison 1 Dornase alfa versus placebo, Outcome 5 Relative mean % change in FEV1 (in participants with acute exacerbations).

Comparison 1 Dornase alfa versus placebo, Outcome 6 Relative mean % change in FVC (% predicted).

Comparison 1 Dornase alfa versus placebo, Outcome 7 Relative mean % change in FVC (% predicted).

Comparison 1 Dornase alfa versus placebo, Outcome 8 Relative mean % change in FVC at one month ‐ subgroup analysis by disease severity.
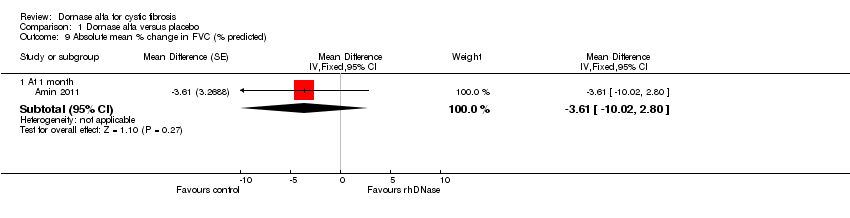
Comparison 1 Dornase alfa versus placebo, Outcome 9 Absolute mean % change in FVC (% predicted).

Comparison 1 Dornase alfa versus placebo, Outcome 10 Absolute mean % change in FVC (% predicted).

Comparison 1 Dornase alfa versus placebo, Outcome 11 Absolute mean change in LCI.

Comparison 1 Dornase alfa versus placebo, Outcome 12 Absolute change in FEV0.5 (z score).

Comparison 1 Dornase alfa versus placebo, Outcome 13 Quality of life ‐ CFQ‐R respiratory.
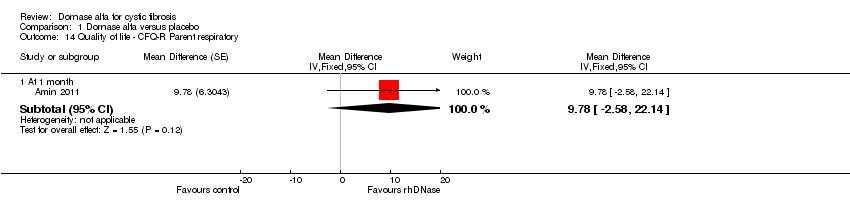
Comparison 1 Dornase alfa versus placebo, Outcome 14 Quality of life ‐ CFQ‐R Parent respiratory.

Comparison 1 Dornase alfa versus placebo, Outcome 15 Number of people experiencing exacerbations.
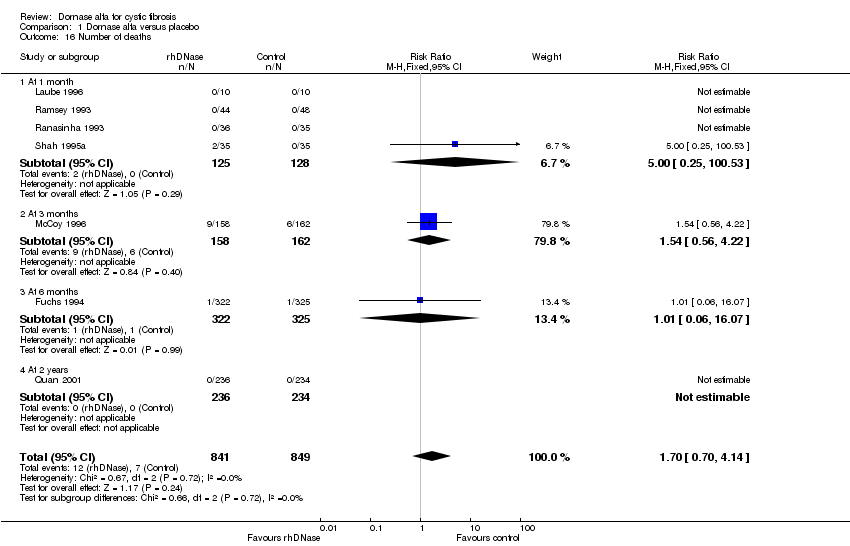
Comparison 1 Dornase alfa versus placebo, Outcome 16 Number of deaths.

Comparison 1 Dornase alfa versus placebo, Outcome 17 Mean number of days IV antibiotics used.
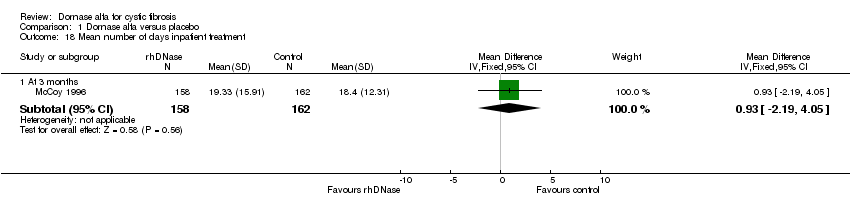
Comparison 1 Dornase alfa versus placebo, Outcome 18 Mean number of days inpatient treatment.

Comparison 1 Dornase alfa versus placebo, Outcome 19 Mean change in weight from baseline.
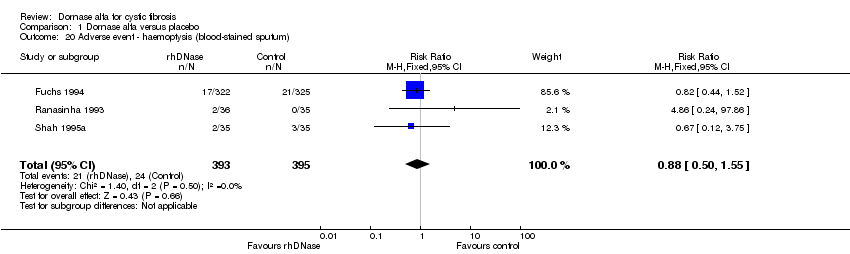
Comparison 1 Dornase alfa versus placebo, Outcome 20 Adverse event ‐ haemoptysis (blood‐stained sputum).
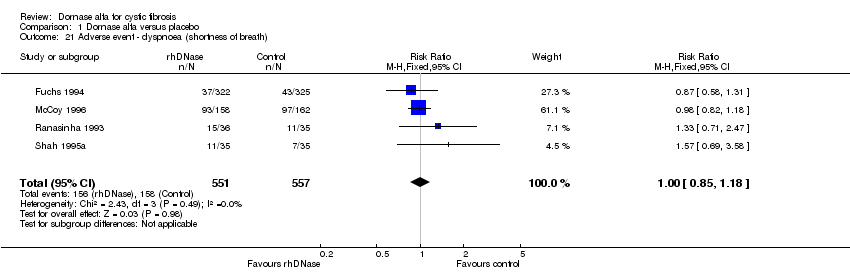
Comparison 1 Dornase alfa versus placebo, Outcome 21 Adverse event ‐ dyspnoea (shortness of breath).

Comparison 1 Dornase alfa versus placebo, Outcome 22 Adverse event ‐ pneumothorax.
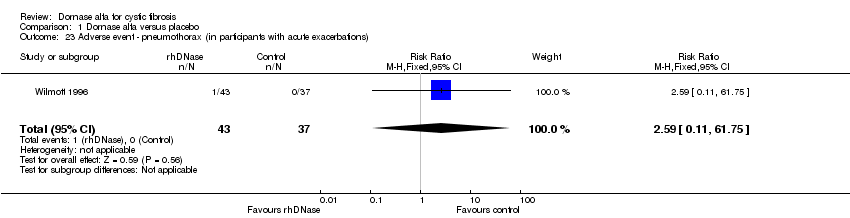
Comparison 1 Dornase alfa versus placebo, Outcome 23 Adverse event ‐ pneumothorax (in participants with acute exacerbations).

Comparison 1 Dornase alfa versus placebo, Outcome 24 Adverse event ‐ voice alteration.

Comparison 1 Dornase alfa versus placebo, Outcome 25 Adverse event ‐ voice alteration (1x versus 2x daily treatment).

Comparison 1 Dornase alfa versus placebo, Outcome 26 Adverse event ‐ voice alteration (in participants with acute exacerbations).

Comparison 1 Dornase alfa versus placebo, Outcome 27 Adverse event ‐ rash.

Comparison 1 Dornase alfa versus placebo, Outcome 28 Adverse event ‐ chest pain.

Comparison 1 Dornase alfa versus placebo, Outcome 29 Adverse event ‐ cough (new or increased).

Comparison 1 Dornase alfa versus placebo, Outcome 30 Adverse event ‐ increased sputum production.
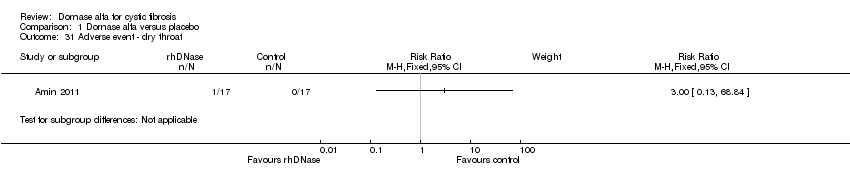
Comparison 1 Dornase alfa versus placebo, Outcome 31 Adverse event ‐ dry throat.
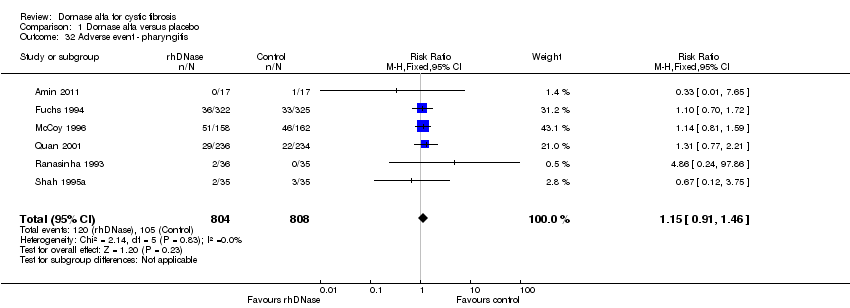
Comparison 1 Dornase alfa versus placebo, Outcome 32 Adverse event ‐ pharyngitis.
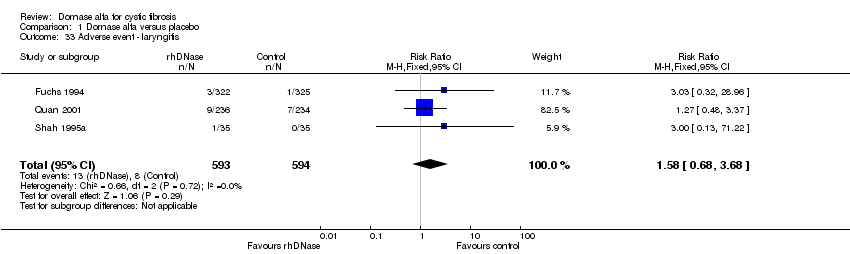
Comparison 1 Dornase alfa versus placebo, Outcome 33 Adverse event ‐ laryngitis.

Comparison 1 Dornase alfa versus placebo, Outcome 34 Adverse event ‐ conjunctivitis.

Comparison 1 Dornase alfa versus placebo, Outcome 35 Adverse event ‐ wheeze.
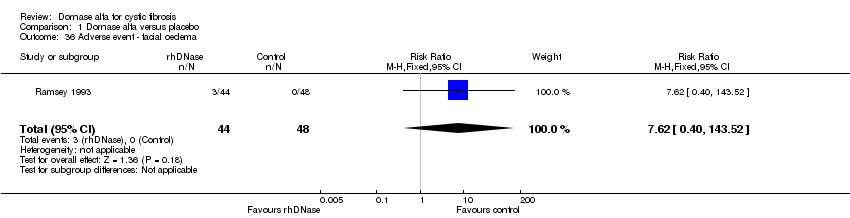
Comparison 1 Dornase alfa versus placebo, Outcome 36 Adverse event ‐ facial oedema.
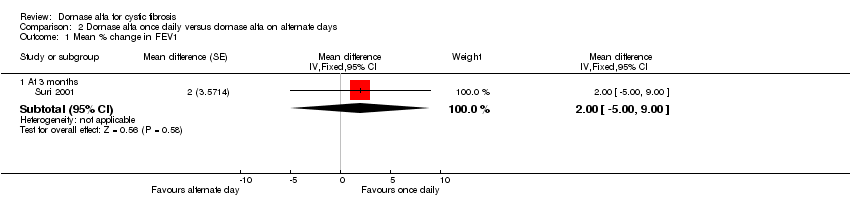
Comparison 2 Dornase alfa once daily versus dornase alfa on alternate days, Outcome 1 Mean % change in FEV1.
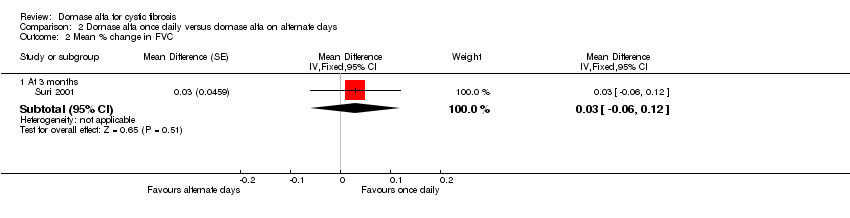
Comparison 2 Dornase alfa once daily versus dornase alfa on alternate days, Outcome 2 Mean % change in FVC.
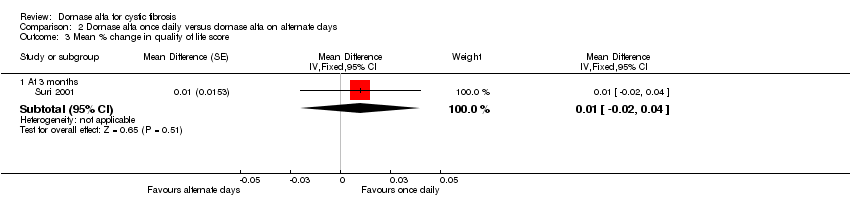
Comparison 2 Dornase alfa once daily versus dornase alfa on alternate days, Outcome 3 Mean % change in quality of life score.

Comparison 2 Dornase alfa once daily versus dornase alfa on alternate days, Outcome 4 Mean number of days inpatient treatment.
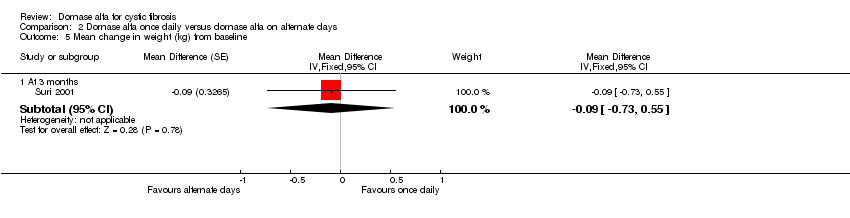
Comparison 2 Dornase alfa once daily versus dornase alfa on alternate days, Outcome 5 Mean change in weight (kg) from baseline.

Comparison 3 Dornase alfa daily versus hypertonic saline, Outcome 1 Mean % change in FEV1.
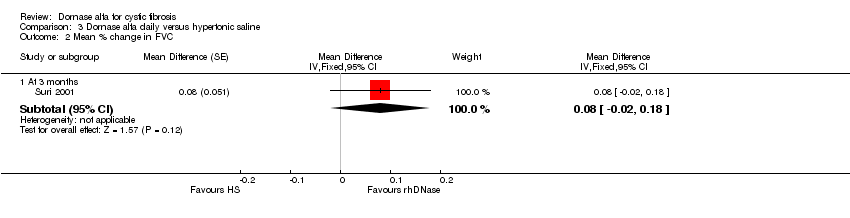
Comparison 3 Dornase alfa daily versus hypertonic saline, Outcome 2 Mean % change in FVC.

Comparison 3 Dornase alfa daily versus hypertonic saline, Outcome 3 Mean % change in quality of life score.
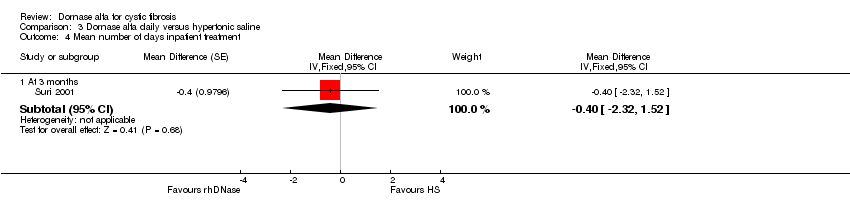
Comparison 3 Dornase alfa daily versus hypertonic saline, Outcome 4 Mean number of days inpatient treatment.

Comparison 3 Dornase alfa daily versus hypertonic saline, Outcome 5 Mean change in weight (kg) from baseline.

Comparison 4 Dornase alfa versus mannitol, Outcome 1 Mean absolute change in FEV1 (L).

Comparison 4 Dornase alfa versus mannitol, Outcome 2 Mean absolute change in FVC (L).
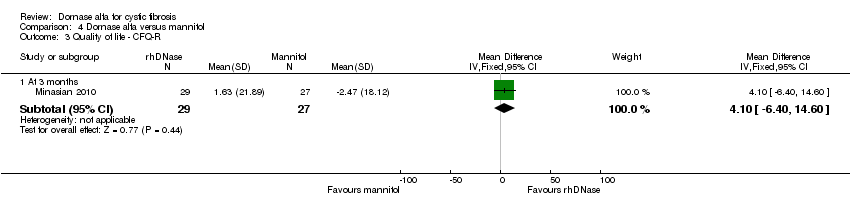
Comparison 4 Dornase alfa versus mannitol, Outcome 3 Quality of life ‐ CFQ‐R.

Comparison 4 Dornase alfa versus mannitol, Outcome 4 Number of people experiencing exacerbations.
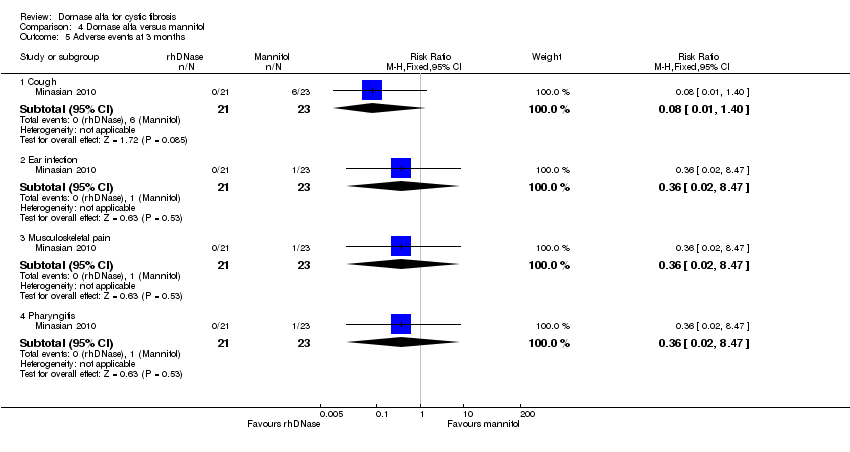
Comparison 4 Dornase alfa versus mannitol, Outcome 5 Adverse events at 3 months.
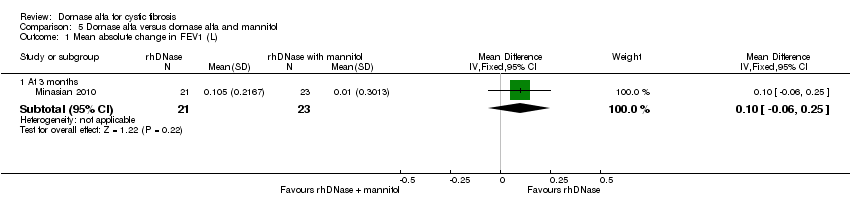
Comparison 5 Dornase alfa versus dornase alfa and mannitol, Outcome 1 Mean absolute change in FEV1 (L).

Comparison 5 Dornase alfa versus dornase alfa and mannitol, Outcome 2 Mean absolute change in FVC (L).

Comparison 5 Dornase alfa versus dornase alfa and mannitol, Outcome 3 Quality of life ‐ CFQ‐R.

Comparison 5 Dornase alfa versus dornase alfa and mannitol, Outcome 4 Number of people experiencing exacerbations.

Comparison 5 Dornase alfa versus dornase alfa and mannitol, Outcome 5 Adverse events at 3 months.
| Dornase alfa compared with placebo or no dornase alfa treatment for cystic fibrosis | ||||||
| Patient or population: Adults and children with cystic fibrosis Settings: Outpatients Intervention: Dornase alfa Comparison: Placebo or no treatment | ||||||
| Outcomes | Illustrative comparative risks* (95% CI) | Relative effect | No of Participants | Quality of the evidence | Comments | |
| Assumed risk | Corresponding risk | |||||
| Placebo or no dornase alfa treatment | Dornase alfa | |||||
| Relative mean percentage change in FEV1 (% predicted) at 3 months | The relative mean percentage change in FEV1 (% predicted) was 2.1 | The relative mean percentage change in FEV1 (% predicted) was 7.3 higher (4.04 higher to 10.56 higher) | NA | 320 (1 study)1 | ⊕⊕⊕⊝ | |
| Relative mean percentage change in FEV1 (% predicted) at 6 months | The relative mean percentage change in FEV1 (% predicted) was 0 | The relative mean percentage change in FEV1 (% predicted) was 5.8 higher (3.99 higher to 7.61 higher) | NA | 647 (1 study)1 | ⊕⊕⊕⊕ | Result presented from once‐daily dornase alfa group. Significant benefit for dornase alfa also present in twice‐daily dornase alfa group |
| Relative mean percentage change in FVC (% predicted) at 3 months | The relative mean percentage change in FVC (% predicted) was 7.3 | The relative mean percentage change in FVC (% predicted) was 5.1 higher (1.23 higher to 8.97 higher) | NA | 318 (1 study)4 | ⊕⊕⊕⊝ | |
| Relative mean percentage change in FVC (% predicted) at 3 months | See comment | See comment | MD 3.80 (2.62 to 4.98) | 647 (1 study)1 | ⊕⊕⊕⊕ | Mean difference between groups only presented. Result presented from once‐daily dornase alfa group. Significant benefit for dornase alfa also present in twice‐daily dornase alfa group |
| Change in quality of life ‐ CFQ‐R respiratory at 1 month | See comment | See comment | MD 0.84 (‐10.74 to 12.42) | 19 (1 cross‐over study)5 | ⊕⊕⊝⊝ | Positive MD indicates an advantage for dornase alfa daily. Participants received both interventions in cross‐over design. |
| Change in quality of life ‐ CFQ‐R respiratory (parent) at 1 month | See comment | See comment | MD 9.78 (‐2.58 to 22.14) | 19 (1 cross‐over study)5 | ⊕⊕⊝⊝ | Positive MD indicates an advantage for dornase alfa daily. Participants received both interventions in cross‐over design. |
| Number of people experiencing exacerbations at up to 2 years | 252 per 1000 | 196 per 1000 | RR 0.78 (0.62 to 0.96) | 1157 (3 studies)8 | ⊕⊕⊕⊝ | RR <1 indicates an advantage for dornase alfa. |
| *The basis for the assumed risk (e.g. the median control group risk across studies) is provided in footnotes. The corresponding risk (and its 95% confidence interval) is based on the assumed risk in the comparison group and the relative effect of the intervention (and its 95% CI). Assumed and corresponding risk not calculated for quality of life. Relative effect and 95% CI presented is adjusted for the cross‐over design of the study | ||||||
| GRADE Working Group grades of evidence | ||||||
| 1. Additionally four trials included in analysis at one month showed a significant advantage to dornase alfa over placebo or no dornase alfa treatment (Laube 1996; Ramsey 1993; Ranasinha 1993; Shah 1995a). Three studies not included in pooled analysis showed no difference between groups in relative FEV1(L) (Robinson 2000) and relative FEV1 (% predicted) (Wilmott 1996) or absolute FEV1 (% predicted) (Amin 2011) at one month. At one year, one study showed a significant advantage to dornase alfa over placebo or no dornase alfa treatment (Frederiksen 2006) and one study showed no difference between treatments (Robinson 2005). At one year, one study showed a significant advantage to dornase alfa over placebo or no dornase alfa treatment (Quan 2001) and at three years, one study showed no significant difference between treatments (Paul 2004). 2. Downgraded due to indirectness: participants in McCoy 1996 had severe lung disease (FVC below 40%). 3. No evidence of imprecision, inconsistency, indirectness, publication bias or serious risk of bias. 4. Additionally four trials included in analysis at one month (Laube 1996; Ramsey 1993; Ranasinha 1993; Shah 1995a) showed a significant advantage to dornase alfa over placebo or no dornase alfa treatment. One study not included in pooled analysis showed a significant advantage in relative FVC (L) to dornase alfa over placebo or no dornase alfa treatment (Robinson 2000) and one study showed no significant different in absolute FVC (% predicted) between groups (Amin 2011) at one month. No significant difference was found between groups at one year (Robinson 2005) and at two years (Quan 2001). 5. Additionally, four studies reported quality of life data which could not be included in pooled analysis. Wilmott 1996 showed no difference between groups in CFQ‐R. Ramsey reported that the frequency and magnitude of improvement across all quality of life questions was greater among participants receiving dornase alfa (Ramsey 1993). Ranasinha reported significant improvements in overall well‐being and significant improvements in general well‐being, cough frequency and chest congestion (Ranasinha 1993) and Fuchs reported significant improvements in well‐being score and dyspnoea score on dornase alfa compared to placebo (Fuchs 1994). 6. Downgraded once for lack of applicability: Amin included children only so results are not applicable to adults (Amin 2011). 7. Downgraded once for imprecision: wide confidence intervals around the effect size due to limited sample size of the trial. 8. Additionally, one study reported an age‐adjusted RR of having more than one respiratory exacerbation, but these data were not included in the pooled analysis (McCoy 1996). No significant difference was found between dornase alfa and control. 9. Downgraded once as data from one cross‐over trial was analysed as parallel data (Amin 2011), which is a conservative approach. | ||||||
| Dornase alfa daily compared with dornase alfa on alternate days for cystic fibrosis | ||||||
| Patient or population: Children with cystic fibrosis Settings: Outpatients Intervention: Dornase alfa daily Comparison: Dornase alfa alternate days | ||||||
| Outcomes | Illustrative comparative risks* (95% CI) | Relative effect | No of Participants | Quality of the evidence | Comments | |
| Assumed risk | Corresponding risk | |||||
| Dornase alfa alternate days | Dornase alfa daily | |||||
| Mean relative percentage change in FEV1 (L) at 3 months | See comment | See comment | MD 2.00 (‐5.00 to 9.00) | 43 (1 cross‐over study) | ⊕⊕⊝⊝ | Positive MD indicates an advantage for dornase alfa daily. Participants received both interventions in cross‐over design. |
| Mean relative percentage in FVC (L) at 3 months | See comment | See comment | MD 0.03 (‐0.06 to 0.12) | 43 (1 cross‐over study) | ⊕⊕⊝⊝ | Positive MD indicates an advantage for dornase alfa daily. Participants received both interventions in cross‐over design. |
| Mean relative percentage in quality of life score at 3 months | See comment | See comment | MD 0.01 (‐0.02 to 0.04) | 43 (1 cross‐over study) | ⊕⊕⊝⊝ | Positive MD indicates an advantage for dornase alfa daily. Participants received both interventions in cross‐over design. |
| Number of pulmonary exacerbations at 3 months | 17 exacerbations | 18 exacerbations | NA (see comment) | 43 (1 cross‐over study) | ⊕⊕⊝⊝ | No difference was found in the number of pulmonary exacerbations (no statistical comparison made) |
| *Assumed and corresponding risk not calculated lung function and quality of life. Relative effect and 95% CI presented is adjusted for the cross‐over design of the study. | ||||||
| GRADE Working Group grades of evidence | ||||||
| 1. Downgraded once for lack of applicability: Suri included children only so results are not applicable to adults (Suri 2001). 2. Downgraded once for high risk of bias due to lack of blinding. | ||||||
| Dornase alfa compared with hypertonic saline for cystic fibrosis | ||||||
| Patient or population: Children with cystic fibrosis Settings: Outpatients Intervention: Dornase alfa (once daily) Comparison: Hypertonic saline | ||||||
| Outcomes | Illustrative comparative risks* (95% CI) | Relative effect | No of Participants | Quality of the evidence | Comments | |
| Assumed risk | Corresponding risk | |||||
| Hypertonic Saline | Dornase alfa | |||||
| Mean relative percentage in FEV1 (L) at 3 months | See comment | See comment | MD 8.00 (2.00 to 14.00) | up to 431,2 (1 cross‐over study) (see comment) | ⊕⊕⊝⊝ | Positive MD indicates an advantage for dornase alfa. Participants received both interventions in cross‐over design. |
| Mean relative percentage in FVC (L) at 3 months | See comment | See comment | MD 0.08, (‐0.02 to 0.18) | up to 431,2 (1 cross‐over study) | ⊕⊕⊝⊝ | Positive MD indicates an advantage for dornase alfa. Participants received both interventions in cross‐over design. |
| Mean relative percentage in quality of life score at 3 months | See comment | See comment | MD 0.03, (‐0.01 to 0.07) | up to 431,2 (1 cross‐over study) | ⊕⊕⊝⊝ | Positive MD indicates an advantage for dornase alfa. Participants received both interventions in cross‐over design. |
| Number of pulmonary exacerbations at 3 months | 15 exacerbations | 17 exacerbations | NA (see comment) | up to 431,2 (1 cross‐over study) | ⊕⊕⊝⊝ | No difference was found in the number of pulmonary exacerbations (no statistical comparison made) |
| *Assumed and corresponding risk not calculated lung function and quality of life. Relative effect and 95% CI presented is adjusted for the cross‐over design of the study. | ||||||
| GRADE Working Group grades of evidence | ||||||
| 1. In the cross‐over trial, 43 participants completed the dornase alfa arm and 40 completed the hypertonic saline arm (Suri 2001). 2. Two additional cross‐over trials compared dornase alfa and hypertonic saline, no significant differences were found between the treatments for % change in FEV1 and other primary outcomes of the review were not recorded in these trials (Adde 2004; Ballmann 2002). 3. Downgraded once for lack of applicability: Suri included children only so results are not applicable to adults (Suri 2001). 4. Downgraded once for high risk of bias due to lack of blinding. | ||||||
| Dornase alfa compared with mannitol for cystic fibrosis | ||||||
| Patient or population: Children with cystic fibrosis Settings: Outpatients Intervention: Dornase alfa Comparison: Mannitol | ||||||
| Outcomes | Illustrative comparative risks* (95% CI) | Relative effect | No of Participants | Quality of the evidence | Comments | |
| Assumed risk | Corresponding risk | |||||
| Mannitol | Dornase Alfa | |||||
| Mean absolute change in FEV1 (L) at 3 months | See comment | See comment | MD 0.02 (‐0.11 to 0.16) | up to 231 (1 cross‐over study) | ⊕⊕⊝⊝ | Positive MD indicates an advantage for dornase alfa. Participants received both interventions in cross‐over design. |
| Mean absolute change in FVC (L) at 3 months | See comment | See comment | MD ‐0.02, (‐0.23 to 0.19) | up to 231 (1 cross‐over study) | ⊕⊕⊝⊝ | Positive MD indicates an advantage for dornase alfa. Participants received both interventions in cross‐over design. |
| Change in quality of life ‐ CFQ‐R at 3 months | See comment | See comment | MD 10.61 (0.27 to 20.95) | up to 231 (1 cross‐over study) | ⊕⊕⊝⊝ | Positive MD indicates an advantage for dornase alfa. Participants received both interventions in cross‐over design. |
| Number of people experiencing exacerbations ‐ at 3 months | 130 per 1000 | 143 per 1000 | RR 1.10 (0.25 to 4.84) | up to 231 (1 cross‐over study) | ⊕⊕⊝⊝ | RR <1 indicates an advantage for dornase alfa. Participants received both interventions in cross‐over design. |
| *Assumed and corresponding risk not calculated for lung function and quality of life. Relative effect and 95% CI presented is adjusted for the cross‐over design of the study. | ||||||
| GRADE Working Group grades of evidence | ||||||
| 1. In the cross‐over trial, 21 participants completed the dornase alfa arm and 23 participants completed the mannitol arm (Minasian 2010). 2. Downgraded once for lack of applicability: Minasian included children only so results are not applicable to adults (Minasian 2010). 3. Downgraded once for high risk of bias due to lack of blinding. | ||||||
| Dornase alfa compared with dornase alfa and mannitol for cystic fibrosis | ||||||
| Patient or population: Children with cystic fibrosis Settings: Outpatients Intervention: Dornase alfa Comparison: Dornase alfa and Mannitol | ||||||
| Outcomes | Illustrative comparative risks* (95% CI) | Relative effect | No of Participants | Quality of the evidence | Comments | |
| Assumed risk | Corresponding risk | |||||
| Dornase alfa and mannitol | Dornase alfa | |||||
| Mean absolute change in FEV1 (L) at 3 months | See comment | See comment | MD 0.10 (‐0.06 to 0.25) | up to 231 (1 cross‐over study) | ⊕⊕⊝⊝ | Positive MD indicates an advantage for dornase alfa. Participants received both interventions in cross‐over design. |
| Mean absolute change in FVC (L) at 3 months | See comment | See comment | MD 0.13 (‐0.11 to 0.37) | up to 231 (1 cross‐over study) | ⊕⊕⊝⊝ | Positive MD indicates an advantage for dornase alfa. Participants received both interventions in cross‐over design. |
| Change in quality of life ‐ CFQ‐R at 3 months | See comment | See comment | MD 10.61 (0.27 to 20.95) | up to 231 (1 cross‐over study) | ⊕⊕⊝⊝ | Positive MD indicates an advantage for dornase alfa. Participants received both interventions in cross‐over design. |
| Number of people experiencing exacerbations at 3 months | 261 per 1000 | 143 per 1000 | RR 0.55 (0.16 to 1.92) | up to 231 (1 cross‐over study) | ⊕⊕⊝⊝ | RR <1 indicates an advantage for dornase alfa. Participants received both interventions in cross‐over design. |
| *Assumed and corresponding risk not calculated lung function and quality of life. Relative effect and 95% CI presented is adjusted for the cross‐over design of the study. | ||||||
| GRADE Working Group grades of evidence | ||||||
| 1. In the crossover trial, 21 participants completed the dornase alfa arm and 23 participants completed the dornase alfa plus mannitol arm (Minasian 2010). 2. Downgraded once for lack of applicability: Minasian included children only so results are not applicable to adults (Minasian 2010). 3. Downgraded once for high risk of bias due to lack of blinding. | ||||||
| Study | Comparison group | Duration of treatment | Frequency of dornase treatment | Study design |
| Placebo | 4 weeks | once daily | cross‐over | |
| Placebo | 6 months | once daily | cross‐over | |
| Placebo | 2 weeks | once daily | cross‐over | |
| No treatment | 1 year | once daily | parallel | |
| Placebo and twice‐daily dornase | 6 months | once or twice daily | parallel | |
| Placebo | 6 days | twice a day | parallel | |
| Placebo | 3 months | once daily | parallel | |
| No treatment | 3 years | twice a day | parallel | |
| Placebo | 2 years | once a day | parallel | |
| Placebo | 10 days | twice a day (0.6 mg, 2.5 mg or 10 mg) | parallel | |
| Placebo | 10 days | twice a day | parallel | |
| Placebo | 7 days | once a day | cross‐over | |
| Placebo | 1 year | once a day | parallel | |
| Placebo | 2 weeks | twice a day | parallel | |
| Placebo | 15 days | twice a day | parallel | |
| Hypertonic saline and alternate day dornase | 3 months | once a day, alternate day | cross‐over | |
| Hypertonic saline | 4 weeks | once daily | cross‐over | |
| Hypertonic saline | 3 weeks | once daily | cross‐over | |
| Mannitol and mannitol plus dornase | 3 months | once daily | cross‐over | |
| *Trial done during acute exacerbation | ||||
| Pre dornase alfa | Post dornase alfa | Pre placebo | Post placebo | |
| FEV1 (L) mean (SD) | 2.63 (0.31) | 2.8 (0.32) | 2.63 (0.32) | 2.70 (0.32) |
| FVC (L) mean (SD) | 4.03 (0.35) | 4.21 (0.35) | 4.12 (0.36) | 4.06 (0.38) |
| FEV1: forced expiratory volume at one second | ||||
| Pre‐hypertonic saline | Post hypertonic saline | Pre dornase alfa | Post dornase alfa | P value | |
| FEV1 (% predicted) mean (SD) | 47 (18) | 46 (18) | 49 (15) | 50 (21) | NS |
| FEV1: forced expiratory volume at one second | |||||
| Outcome or subgroup title | No. of studies | No. of participants | Statistical method | Effect size |
| 1 Relative mean % change in FEV1 (% predicted) Show forest plot | 7 | Mean Difference (IV, Random, 95% CI) | Subtotals only | |
| 1.1 At 1 month | 4 | 248 | Mean Difference (IV, Random, 95% CI) | 9.51 [0.67, 18.35] |
| 1.2 At 3 months | 1 | 320 | Mean Difference (IV, Random, 95% CI) | 7.30 [4.04, 10.56] |
| 1.3 At 6 months | 1 | 647 | Mean Difference (IV, Random, 95% CI) | 5.8 [3.99, 7.61] |
| 1.4 At 12 months | 1 | 19 | Mean Difference (IV, Random, 95% CI) | 0.70 [‐11.26, 12.66] |
| 2 Relative mean % change in FEV1 (% predicted) at one month ‐ subgroup analysis by disease severity Show forest plot | 4 | Mean Difference (IV, Fixed, 95% CI) | Subtotals only | |
| 2.1 Moderate | 3 | 183 | Mean Difference (IV, Fixed, 95% CI) | 14.26 [10.79, 17.74] |
| 2.2 Severe | 1 | 65 | Mean Difference (IV, Fixed, 95% CI) | ‐2.81 [‐8.77, 3.15] |
| 3 Absolute mean % change in FEV1 (% predicted) Show forest plot | 1 | Mean difference (Fixed, 95% CI) | Subtotals only | |
| 3.1 At 1 month | 1 | Mean difference (Fixed, 95% CI) | 0.08 [‐5.59, 5.74] | |
| 4 Absolute mean % change in FEV1 (% predicted) Show forest plot | 1 | Mean Difference (IV, Fixed, 95% CI) | Subtotals only | |
| 4.1 At 2 years | 1 | 410 | Mean Difference (IV, Fixed, 95% CI) | 3.24 [1.03, 5.45] |
| 5 Relative mean % change in FEV1 (in participants with acute exacerbations) Show forest plot | 1 | Mean Difference (IV, Fixed, 95% CI) | Subtotals only | |
| 5.1 Up to 1 month | 1 | 80 | Mean Difference (IV, Fixed, 95% CI) | 1.0 [‐13.93, 15.93] |
| 6 Relative mean % change in FVC (% predicted) Show forest plot | 6 | Mean Difference (IV, Random, 95% CI) | Subtotals only | |
| 6.1 At 1 month | 4 | 248 | Mean Difference (IV, Random, 95% CI) | 7.52 [1.34, 13.69] |
| 6.2 At 3 months | 1 | 318 | Mean Difference (IV, Random, 95% CI) | 5.10 [1.23, 8.97] |
| 6.3 At 12 months | 1 | 19 | Mean Difference (IV, Random, 95% CI) | ‐5.70 [‐15.87, 4.47] |
| 7 Relative mean % change in FVC (% predicted) Show forest plot | 1 | Mean Difference (Random, 95% CI) | Subtotals only | |
| 7.1 At 6 months (once daily) | 1 | 2 | Mean Difference (Random, 95% CI) | 3.80 [2.62, 4.98] |
| 7.2 At 6 months (twice daily) | 1 | 2 | Mean Difference (Random, 95% CI) | 3.00 [1.82, 4.18] |
| 8 Relative mean % change in FVC at one month ‐ subgroup analysis by disease severity Show forest plot | 4 | 248 | Mean Difference (IV, Fixed, 95% CI) | 9.49 [6.34, 12.63] |
| 8.1 Moderate | 3 | 183 | Mean Difference (IV, Fixed, 95% CI) | 10.98 [7.68, 14.29] |
| 8.2 Severe | 1 | 65 | Mean Difference (IV, Fixed, 95% CI) | ‐4.90 [‐15.15, 5.35] |
| 9 Absolute mean % change in FVC (% predicted) Show forest plot | 1 | Mean Difference (Fixed, 95% CI) | Subtotals only | |
| 9.1 At 1 month | 1 | Mean Difference (Fixed, 95% CI) | ‐3.61 [‐10.02, 2.80] | |
| 10 Absolute mean % change in FVC (% predicted) Show forest plot | 1 | Mean Difference (IV, Random, 95% CI) | Subtotals only | |
| 10.1 At 2 years | 1 | 410 | Mean Difference (IV, Random, 95% CI) | 0.70 [‐1.24, 2.64] |
| 11 Absolute mean change in LCI Show forest plot | 1 | Mean Difference (Fixed, 95% CI) | Subtotals only | |
| 11.1 At 1 month | 1 | 34 | Mean Difference (Fixed, 95% CI) | ‐0.9 [‐1.87, 0.07] |
| 12 Absolute change in FEV0.5 (z score) Show forest plot | 1 | Mean Difference (IV, Fixed, 95% CI) | Subtotals only | |
| 12.1 At 6 months | 1 | 38 | Mean Difference (IV, Fixed, 95% CI) | 0.1 [‐0.57, 0.77] |
| 13 Quality of life ‐ CFQ‐R respiratory Show forest plot | 1 | Mean Difference (Fixed, 95% CI) | Subtotals only | |
| 13.1 At 1 month | 1 | Mean Difference (Fixed, 95% CI) | 0.84 [‐10.74, 12.42] | |
| 14 Quality of life ‐ CFQ‐R Parent respiratory Show forest plot | 1 | Mean Difference (Fixed, 95% CI) | Subtotals only | |
| 14.1 At 1 month | 1 | Mean Difference (Fixed, 95% CI) | 9.78 [‐2.58, 22.14] | |
| 15 Number of people experiencing exacerbations Show forest plot | 3 | 1151 | Risk Ratio (M‐H, Fixed, 95% CI) | 0.78 [0.62, 0.96] |
| 16 Number of deaths Show forest plot | 7 | 1690 | Risk Ratio (M‐H, Fixed, 95% CI) | 1.70 [0.70, 4.14] |
| 16.1 At 1 month | 4 | 253 | Risk Ratio (M‐H, Fixed, 95% CI) | 5.0 [0.25, 100.53] |
| 16.2 At 3 months | 1 | 320 | Risk Ratio (M‐H, Fixed, 95% CI) | 1.54 [0.56, 4.22] |
| 16.3 At 6 months | 1 | 647 | Risk Ratio (M‐H, Fixed, 95% CI) | 1.01 [0.06, 16.07] |
| 16.4 At 2 years | 1 | 470 | Risk Ratio (M‐H, Fixed, 95% CI) | 0.0 [0.0, 0.0] |
| 17 Mean number of days IV antibiotics used Show forest plot | 1 | Mean Difference (IV, Fixed, 95% CI) | Subtotals only | |
| 17.1 At 3 months | 1 | 320 | Mean Difference (IV, Fixed, 95% CI) | ‐2.96 [‐7.29, 1.37] |
| 18 Mean number of days inpatient treatment Show forest plot | 1 | Mean Difference (IV, Fixed, 95% CI) | Subtotals only | |
| 18.1 At 3 months | 1 | 320 | Mean Difference (IV, Fixed, 95% CI) | 0.93 [‐2.19, 4.05] |
| 19 Mean change in weight from baseline Show forest plot | 1 | Mean Difference (IV, Fixed, 95% CI) | Subtotals only | |
| 19.1 At 2 years | 1 | 470 | Mean Difference (IV, Fixed, 95% CI) | ‐0.20 [‐2.42, 2.02] |
| 20 Adverse event ‐ haemoptysis (blood‐stained sputum) Show forest plot | 3 | 788 | Risk Ratio (M‐H, Fixed, 95% CI) | 0.88 [0.50, 1.55] |
| 21 Adverse event ‐ dyspnoea (shortness of breath) Show forest plot | 4 | 1108 | Risk Ratio (M‐H, Fixed, 95% CI) | 1.00 [0.85, 1.18] |
| 22 Adverse event ‐ pneumothorax Show forest plot | 3 | 788 | Risk Ratio (M‐H, Fixed, 95% CI) | 0.60 [0.08, 4.50] |
| 23 Adverse event ‐ pneumothorax (in participants with acute exacerbations) Show forest plot | 1 | 80 | Risk Ratio (M‐H, Fixed, 95% CI) | 2.59 [0.11, 61.75] |
| 24 Adverse event ‐ voice alteration Show forest plot | 6 | 1670 | Risk Ratio (M‐H, Fixed, 95% CI) | 1.69 [1.20, 2.39] |
| 25 Adverse event ‐ voice alteration (1x versus 2x daily treatment) Show forest plot | 1 | Risk Ratio (M‐H, Fixed, 95% CI) | Subtotals only | |
| 26 Adverse event ‐ voice alteration (in participants with acute exacerbations) Show forest plot | 1 | 80 | Risk Ratio (M‐H, Fixed, 95% CI) | 2.58 [0.55, 12.03] |
| 27 Adverse event ‐ rash Show forest plot | 2 | 1117 | Risk Ratio (M‐H, Fixed, 95% CI) | 2.40 [1.16, 4.99] |
| 28 Adverse event ‐ chest pain Show forest plot | 3 | 1151 | Risk Ratio (M‐H, Fixed, 95% CI) | 1.00 [0.59, 1.70] |
| 29 Adverse event ‐ cough (new or increased) Show forest plot | 1 | Risk Ratio (M‐H, Fixed, 95% CI) | Subtotals only | |
| 30 Adverse event ‐ increased sputum production Show forest plot | 1 | Risk Ratio (M‐H, Fixed, 95% CI) | Subtotals only | |
| 31 Adverse event ‐ dry throat Show forest plot | 1 | Risk Ratio (M‐H, Fixed, 95% CI) | Subtotals only | |
| 32 Adverse event ‐ pharyngitis Show forest plot | 6 | 1612 | Risk Ratio (M‐H, Fixed, 95% CI) | 1.15 [0.91, 1.46] |
| 33 Adverse event ‐ laryngitis Show forest plot | 3 | 1187 | Risk Ratio (M‐H, Fixed, 95% CI) | 1.58 [0.68, 3.68] |
| 34 Adverse event ‐ conjunctivitis Show forest plot | 2 | 1117 | Risk Ratio (M‐H, Fixed, 95% CI) | 1.25 [0.50, 3.13] |
| 35 Adverse event ‐ wheeze Show forest plot | 3 | 175 | Risk Ratio (M‐H, Fixed, 95% CI) | 0.59 [0.15, 2.41] |
| 36 Adverse event ‐ facial oedema Show forest plot | 1 | 92 | Risk Ratio (M‐H, Fixed, 95% CI) | 7.62 [0.40, 143.52] |
| Outcome or subgroup title | No. of studies | No. of participants | Statistical method | Effect size |
| 1 Mean % change in FEV1 Show forest plot | 1 | Mean difference (Fixed, 95% CI) | Subtotals only | |
| 1.1 At 3 months | 1 | Mean difference (Fixed, 95% CI) | 2.0 [‐3.00, 9.00] | |
| 2 Mean % change in FVC Show forest plot | 1 | Mean Difference (Fixed, 95% CI) | Subtotals only | |
| 2.1 At 3 months | 1 | Mean Difference (Fixed, 95% CI) | 0.03 [‐0.06, 0.12] | |
| 3 Mean % change in quality of life score Show forest plot | 1 | Mean Difference (Fixed, 95% CI) | Subtotals only | |
| 3.1 At 3 months | 1 | Mean Difference (Fixed, 95% CI) | 0.01 [‐0.02, 0.04] | |
| 4 Mean number of days inpatient treatment Show forest plot | 1 | Mean Difference (Fixed, 95% CI) | Subtotals only | |
| 4.1 At 3 months | 1 | Mean Difference (Fixed, 95% CI) | ‐0.93 [‐3.24, 1.38] | |
| 5 Mean change in weight (kg) from baseline Show forest plot | 1 | Mean Difference (Fixed, 95% CI) | Subtotals only | |
| 5.1 At 3 months | 1 | Mean Difference (Fixed, 95% CI) | ‐0.09 [‐0.73, 0.55] | |
| Outcome or subgroup title | No. of studies | No. of participants | Statistical method | Effect size |
| 1 Mean % change in FEV1 Show forest plot | 1 | Mean Difference (Fixed, 95% CI) | Subtotals only | |
| 1.1 At 3 months | 1 | Mean Difference (Fixed, 95% CI) | 8.0 [2.00, 14.00] | |
| 2 Mean % change in FVC Show forest plot | 1 | Mean Difference (Fixed, 95% CI) | Subtotals only | |
| 2.1 At 3 months | 1 | Mean Difference (Fixed, 95% CI) | 0.08 [‐0.02, 0.18] | |
| 3 Mean % change in quality of life score Show forest plot | 1 | Mean Difference (Fixed, 95% CI) | Subtotals only | |
| 3.1 At 3 months | 1 | Mean Difference (Fixed, 95% CI) | 0.03 [‐0.01, 0.07] | |
| 4 Mean number of days inpatient treatment Show forest plot | 1 | Mean Difference (Fixed, 95% CI) | Subtotals only | |
| 4.1 At 3 months | 1 | Mean Difference (Fixed, 95% CI) | ‐0.4 [‐2.32, 1.52] | |
| 5 Mean change in weight (kg) from baseline Show forest plot | 1 | Mean Difference (Fixed, 95% CI) | Subtotals only | |
| 5.1 At 3 months | 1 | Mean Difference (Fixed, 95% CI) | ‐0.42 [‐1.04, 0.20] | |
| Outcome or subgroup title | No. of studies | No. of participants | Statistical method | Effect size |
| 1 Mean absolute change in FEV1 (L) Show forest plot | 1 | Mean Difference (IV, Fixed, 95% CI) | Subtotals only | |
| 1.1 At 3 months | 1 | 44 | Mean Difference (IV, Fixed, 95% CI) | 0.02 [‐0.11, 0.16] |
| 2 Mean absolute change in FVC (L) Show forest plot | 1 | Mean Difference (IV, Fixed, 95% CI) | Subtotals only | |
| 2.1 At 3 months | 1 | 44 | Mean Difference (IV, Fixed, 95% CI) | ‐0.02 [‐0.23, 0.19] |
| 3 Quality of life ‐ CFQ‐R Show forest plot | 1 | Mean Difference (IV, Fixed, 95% CI) | Subtotals only | |
| 3.1 At 3 months | 1 | 56 | Mean Difference (IV, Fixed, 95% CI) | 4.1 [‐6.40, 14.60] |
| 4 Number of people experiencing exacerbations Show forest plot | 1 | Risk Ratio (M‐H, Fixed, 95% CI) | Subtotals only | |
| 4.1 At 3 months | 1 | 44 | Risk Ratio (M‐H, Fixed, 95% CI) | 1.10 [0.25, 4.84] |
| 5 Adverse events at 3 months Show forest plot | 1 | Risk Ratio (M‐H, Fixed, 95% CI) | Subtotals only | |
| 5.1 Cough | 1 | 44 | Risk Ratio (M‐H, Fixed, 95% CI) | 0.08 [0.01, 1.40] |
| 5.2 Ear infection | 1 | 44 | Risk Ratio (M‐H, Fixed, 95% CI) | 0.36 [0.02, 8.47] |
| 5.3 Musculoskeletal pain | 1 | 44 | Risk Ratio (M‐H, Fixed, 95% CI) | 0.36 [0.02, 8.47] |
| 5.4 Pharyngitis | 1 | 44 | Risk Ratio (M‐H, Fixed, 95% CI) | 0.36 [0.02, 8.47] |
| Outcome or subgroup title | No. of studies | No. of participants | Statistical method | Effect size |
| 1 Mean absolute change in FEV1 (L) Show forest plot | 1 | Mean Difference (IV, Fixed, 95% CI) | Subtotals only | |
| 1.1 At 3 months | 1 | 44 | Mean Difference (IV, Fixed, 95% CI) | 0.10 [‐0.06, 0.25] |
| 2 Mean absolute change in FVC (L) Show forest plot | 1 | Mean Difference (IV, Fixed, 95% CI) | Subtotals only | |
| 2.1 At 3 months | 1 | 44 | Mean Difference (IV, Fixed, 95% CI) | 0.13 [‐0.11, 0.37] |
| 3 Quality of life ‐ CFQ‐R Show forest plot | 1 | Mean Difference (IV, Fixed, 95% CI) | Subtotals only | |
| 3.1 At 3 months | 1 | 53 | Mean Difference (IV, Fixed, 95% CI) | 10.61 [0.27, 20.95] |
| 4 Number of people experiencing exacerbations Show forest plot | 1 | Risk Ratio (M‐H, Fixed, 95% CI) | Subtotals only | |
| 5 Adverse events at 3 months Show forest plot | 1 | Risk Ratio (M‐H, Fixed, 95% CI) | Subtotals only | |
| 5.1 Cough | 1 | 44 | Risk Ratio (M‐H, Fixed, 95% CI) | 0.22 [0.01, 4.30] |
| 5.2 Headache | 1 | 44 | Risk Ratio (M‐H, Fixed, 95% CI) | 0.36 [0.02, 8.47] |
| 5.3 Nausea | 1 | 44 | Risk Ratio (M‐H, Fixed, 95% CI) | 0.36 [0.02, 8.47] |
| 5.4 Rash | 1 | 44 | Risk Ratio (M‐H, Fixed, 95% CI) | 0.36 [0.02, 8.47] |