Acetato de ciproterona para el hirsutismo
Referencias
Referencias de los estudios incluidos en esta revisión
Referencias de los estudios excluidos de esta revisión
Referencias adicionales
Characteristics of studies
Characteristics of included studies [ordered by study ID]
Ir a:
| Methods | Cross over study. 1 centre. No power calc. | |
| Participants | PCO by clinical and biochemical tests. Age 20‐35. Endo unit, Hospital de Bicentre, France. No exclusion criteria stated. | |
| Interventions | 1) CPA 50MG daily. | |
| Outcomes | FG score | |
| Notes | FG figures not available. | |
| Risk of bias | ||
| Bias | Authors' judgement | Support for judgement |
| Allocation concealment? | Unclear risk | B ‐ Unclear |
| Methods | Not blinded. 1 centre. No power calc. 41 women analysed. Withdrawals not stated. No ITT analyses. | |
| Participants | Hirsute women. Age 18‐45. Gynae or Endo clinics, Guys Hospital, London. Exclusion criteria not stated. | |
| Interventions | 1) Spironolactone + EE (Ovysmen) | |
| Outcomes | FG score. Linear hair growth. | |
| Notes | Photographic method for hair measurement. | |
| Risk of bias | ||
| Bias | Authors' judgement | Support for judgement |
| Allocation concealment? | Unclear risk | B ‐ Unclear |
| Methods | Single blinding. 1 centre. No power calc. 42 women randomised. 42 analysed. no withdrawals. No intention to treat (ITT) analyses. | |
| Participants | Hirsute women. Age mean group 1 20.1 (SD3.7), group 2 22.3 (SD 5.6). Marmara University School of Medicine. Istanbul, Turkey. Exclusion criteria not stated. | |
| Interventions | 1) Spironolactone (100MG) + EE (OC) | |
| Outcomes | FG score. Testo, DHEAS. | |
| Notes | ||
| Risk of bias | ||
| Bias | Authors' judgement | Support for judgement |
| Allocation concealment? | Unclear risk | B ‐ Unclear |
| Methods | Unclear blinding. No power calc. 45 women randomised. 42 analysed. 3 withdrawals for personal reasons. No ITT analyses. | |
| Participants | Women with hirsutism. No hormonal treatment for 6 months prior to study. Age 16‐29 years. Reprod. Endo. OPD Clinic. University of Pisa. | |
| Interventions | 1) CA 25MG Day 1‐10 plus EE 20mcg D1‐21. | |
| Outcomes | FG score. Total / free testosterone, androstenedione, DHEAS, SHBG, DHT,3 alpha androstanediol glucuronide. | |
| Notes | ||
| Risk of bias | ||
| Bias | Authors' judgement | Support for judgement |
| Allocation concealment? | Unclear risk | B ‐ Unclear |
| Methods | Unclear blinding. One centre. 173 women randomised. Two stage randomisation. Second two groups added to randomisation after study already commenced. 141 analysed. 32 withdrawals. No ITT analysis. Source of funding ‐ not stated. | |
| Participants | Complaint hirsutism. PCO on ultrasound + 1 biochemical abnormality. Age 14‐39. Exclusions: | |
| Interventions | 1) Diane | |
| Outcomes | FG score. | |
| Notes | ||
| Risk of bias | ||
| Bias | Authors' judgement | Support for judgement |
| Allocation concealment? | Unclear risk | B ‐ Unclear |
| Methods | Not blinded. 1 centre. No power calc. 22 women randomised. No withdrawals. | |
| Participants | Idiopathic hirsutism. Age 16‐32. O&G dept, University of Athens, Greece. | |
| Interventions | 1) CPA 100mg Day 5‐14. | |
| Outcomes | FG score. Testosterone | |
| Notes | ||
| Risk of bias | ||
| Bias | Authors' judgement | Support for judgement |
| Allocation concealment? | High risk | C ‐ Inadequate |
| Methods | Not blinded. 1 centre. No power calc. 50 women randomised. 2 withdrawals for personal reasons. 3 withdrawals during study period. Analysed ‐19 spironolactone and 26 CPA. | |
| Participants | Hirsute women. Cosmetic methods inadequate. Age 19‐46. Excluded: cliteromegaly. Endo Dept. Autin University Hospital. Heidelberg, Victoria, Australia. | |
| Interventions | 1) Spironolactone (100mg) + EE | |
| Outcomes | Hair diameter. | |
| Notes | ||
| Risk of bias | ||
| Bias | Authors' judgement | Support for judgement |
| Allocation concealment? | Unclear risk | B ‐ Unclear |
| Methods | Unclear blinding. 39 randomised. 33 analysed. 6 withdrawals. No ITT analyses. | |
| Participants | Idiopathic and ovarian hirsutism. Exclusion: adrenal hyperandrogenism. Dept Endo, Hospital Ramon Ycajal, Madrid, Spain. | |
| Interventions | 1) Triptorelin 3.75mg IM every 28 days | |
| Outcomes | FG score | |
| Notes | Endocrine values not available ‐ only graphs. | |
| Risk of bias | ||
| Bias | Authors' judgement | Support for judgement |
| Allocation concealment? | Unclear risk | B ‐ Unclear |
| Methods | Double blinded study. 1 centre. No power calc. 20 women randomised and analysed. | |
| Participants | PCOS with hirsutism. Age 17‐31. Exclusion criteria not stated. Iqbal Medical College, Lahore. | |
| Interventions | 1) CPA (2mg) + EE ‐ Diane | |
| Outcomes | Subjective improvement in hirsutism. Testosterone | |
| Notes | Endocrine values not available | |
| Risk of bias | ||
| Bias | Authors' judgement | Support for judgement |
| Allocation concealment? | Low risk | A ‐ Adequate |
Characteristics of excluded studies [ordered by study ID]
Ir a:
| Study | Reason for exclusion |
| Assessment of sexual activity before and after treatment with CPA. Not randomised study. | |
| Mean data not presented in paper. Cannot be used in meta‐analysis. | |
| Randomised study. Insufficient data given for analysis. | |
| Review, not original study. | |
| No CPA included in groups. | |
| Effects of CPA on bone mass. Not hirsute women. | |
| Randomised study comparing 2 routes of estrogen administration. Both groups received CPA. | |
| Not randomised | |
| Some women only acne, not hirsutism. | |
| Not randomised. | |
| Topical CPA therapy. | |
| Not a randomised study. | |
| Women pre‐treated with study drug prior to randomisation. | |
| Not randomised. | |
| Both groups contain CPA. Study to compare the additive effect of spironolactone with CPA. | |
| Not randomised. | |
| Women with acne without hirsutism included. | |
| Review, not original study. | |
| Not randomised. No control. | |
| Women with acne or hirsutism recruited. Unable to differentiate groups in the results. | |
| Randomised study of two diet regimes. CPA in both groups. | |
| Outcome data not available. | |
| Review. Not original study. | |
| Not randomised. | |
| Not randomised. | |
| Review. Not original study. | |
| Not randomised. | |
| Both groups contain CPA. Dose finding study. | |
| Both groups contain Diane. Study assessing the additive effect of adding finasteride. | |
| Not randomised. | |
| Both groups contain CPA. Study to assess the additive effect of GnRH agonist analogue. | |
| Both groups contain CPA. A study to assess the additive effect of GnRH agonist analogue. | |
| 14 women in study had non‐classical congenital adrenal hyperplasia. | |
| Both groups contain Diane (CPA). A study to assess two doses of estradiol. | |
| Randomised study of two routes of estrogen therapy. | |
| Review. Not original study. |
Data and analyses
| Outcome or subgroup title | No. of studies | No. of participants | Statistical method | Effect size |
| 1 SUBJECTIVE IMPROVEMENT IN HAIR GROWTH Show forest plot | 1 | 20 | Odds Ratio (M‐H, Fixed, 95% CI) | 45.0 [2.01, 1006.75] |
| Analysis 2.1  Comparison 2 CPA (2MG) + EE versus PLACEBO, Outcome 1 SUBJECTIVE IMPROVEMENT IN HAIR GROWTH. | ||||
| Outcome or subgroup title | No. of studies | No. of participants | Statistical method | Effect size |
| 1 FERRIMAN GALLWEY AT 6 MONTHS Show forest plot | 1 | 113 | Mean Difference (IV, Fixed, 95% CI) | 1.10 [‐0.71, 2.91] |
| Analysis 3.1  Comparison 3 CPA (>2MG) + EE versus CPA(2MG) + EE, Outcome 1 FERRIMAN GALLWEY AT 6 MONTHS. | ||||
| 2 TESTOSTERONE (TOTAL) AT 6 MONTHS Show forest plot | 1 | 113 | Mean Difference (IV, Fixed, 95% CI) | ‐0.49 [‐1.78, 0.80] |
| Analysis 3.2  Comparison 3 CPA (>2MG) + EE versus CPA(2MG) + EE, Outcome 2 TESTOSTERONE (TOTAL) AT 6 MONTHS. | ||||
| 3 TESTOSTERONE LEVEL (FREE) AT 6 MONTHS Show forest plot | 1 | 113 | Mean Difference (IV, Fixed, 95% CI) | 0.35 [‐0.61, 1.31] |
| Analysis 3.3  Comparison 3 CPA (>2MG) + EE versus CPA(2MG) + EE, Outcome 3 TESTOSTERONE LEVEL (FREE) AT 6 MONTHS. | ||||
| 4 ANDROSTENEDIONE LEVEL AT 6 MONTHS Show forest plot | 1 | 113 | Mean Difference (IV, Fixed, 95% CI) | ‐0.35 [‐1.32, 0.62] |
| Analysis 3.4  Comparison 3 CPA (>2MG) + EE versus CPA(2MG) + EE, Outcome 4 ANDROSTENEDIONE LEVEL AT 6 MONTHS. | ||||
| 5 DHEAS LEVEL AT 6 MONTHS Show forest plot | 1 | 113 | Mean Difference (IV, Fixed, 95% CI) | 0.18 [1.00, 1.36] |
| Analysis 3.5  Comparison 3 CPA (>2MG) + EE versus CPA(2MG) + EE, Outcome 5 DHEAS LEVEL AT 6 MONTHS. | ||||
| 6 ESTRADIOL LEVEL AT 6 MONTHS Show forest plot | 1 | 113 | Mean Difference (IV, Fixed, 95% CI) | ‐19.0 [‐103.67, 65.67] |
| Analysis 3.6  Comparison 3 CPA (>2MG) + EE versus CPA(2MG) + EE, Outcome 6 ESTRADIOL LEVEL AT 6 MONTHS. | ||||
| Outcome or subgroup title | No. of studies | No. of participants | Statistical method | Effect size |
| 1 FERRIMAN GALLWEY AT 6 MONTHS Show forest plot | 1 | 81 | Mean Difference (IV, Fixed, 95% CI) | 0.70 [‐0.84, 2.24] |
| Analysis 4.1  Comparison 4 CPA versus KETOCONAZOLE, Outcome 1 FERRIMAN GALLWEY AT 6 MONTHS. | ||||
| 2 TESTOSTERONE (TOTAL) AT 6 MONTHS Show forest plot | 1 | 81 | Mean Difference (IV, Fixed, 95% CI) | ‐0.02 [‐0.37, 0.33] |
| Analysis 4.2  Comparison 4 CPA versus KETOCONAZOLE, Outcome 2 TESTOSTERONE (TOTAL) AT 6 MONTHS. | ||||
| 3 TESTOSTERONE (FREE) AT 6 MONTHS Show forest plot | 1 | 81 | Mean Difference (IV, Fixed, 95% CI) | 1.39 [0.43, 2.35] |
| Analysis 4.3  Comparison 4 CPA versus KETOCONAZOLE, Outcome 3 TESTOSTERONE (FREE) AT 6 MONTHS. | ||||
| 4 ANDROSTENEDIONE AT 6 MONTHS Show forest plot | 1 | 81 | Mean Difference (IV, Fixed, 95% CI) | 0.35 [‐0.62, 1.32] |
| Analysis 4.4  Comparison 4 CPA versus KETOCONAZOLE, Outcome 4 ANDROSTENEDIONE AT 6 MONTHS. | ||||
| 5 DHEAS AT 6 MONTHS Show forest plot | 1 | 81 | Mean Difference (IV, Fixed, 95% CI) | 2.87 [1.99, 3.75] |
| Analysis 4.5  Comparison 4 CPA versus KETOCONAZOLE, Outcome 5 DHEAS AT 6 MONTHS. | ||||
| 6 ESTRADIOL AT 6 MONTHS Show forest plot | 1 | 81 | Mean Difference (IV, Fixed, 95% CI) | 135.0 [59.92, 210.08] |
| Analysis 4.6  Comparison 4 CPA versus KETOCONAZOLE, Outcome 6 ESTRADIOL AT 6 MONTHS. | ||||
| Outcome or subgroup title | No. of studies | No. of participants | Statistical method | Effect size |
| 1 WITHDRAWALS DURING TREATMENT Show forest plot | 1 | 48 | Odds Ratio (M‐H, Fixed, 95% CI) | 0.37 [0.03, 4.33] |
| Analysis 5.1  Comparison 5 CPA versus SPIRONOLACTONE, Outcome 1 WITHDRAWALS DURING TREATMENT. | ||||
| 2 FERRIMAN GALLWEY AT 3 MONTHS Show forest plot | 2 | 83 | Mean Difference (IV, Fixed, 95% CI) | ‐1.98 [‐4.12, 0.16] |
| Analysis 5.2  Comparison 5 CPA versus SPIRONOLACTONE, Outcome 2 FERRIMAN GALLWEY AT 3 MONTHS. | ||||
| 3 FERRIMAN GALLWEY AT 6 MONTHS Show forest plot | 3 | 160 | Mean Difference (IV, Fixed, 95% CI) | ‐1.35 [‐2.87, 0.18] |
| Analysis 5.3  Comparison 5 CPA versus SPIRONOLACTONE, Outcome 3 FERRIMAN GALLWEY AT 6 MONTHS. | ||||
| 4 SIDE EFFECTS DURING TREATMENT Show forest plot | 2 | 90 | Odds Ratio (M‐H, Fixed, 95% CI) | 0.75 [0.21, 2.70] |
| Analysis 5.4  Comparison 5 CPA versus SPIRONOLACTONE, Outcome 4 SIDE EFFECTS DURING TREATMENT. | ||||
| 5 LINEAR HAIR GROWTH AT 3 MONTHS Show forest plot | 1 | 41 | Mean Difference (IV, Fixed, 95% CI) | 0.02 [‐0.03, 0.07] |
| Analysis 5.5  Comparison 5 CPA versus SPIRONOLACTONE, Outcome 5 LINEAR HAIR GROWTH AT 3 MONTHS. | ||||
| 6 LINEAR HAIR GROWTH AT 6 MONTHS Show forest plot | 1 | 41 | Mean Difference (IV, Fixed, 95% CI) | ‐0.04 [‐0.09, 0.01] |
| Analysis 5.6  Comparison 5 CPA versus SPIRONOLACTONE, Outcome 6 LINEAR HAIR GROWTH AT 6 MONTHS. | ||||
| 7 HAIR SHAFT DIAMETER AT 6 MONTHS Show forest plot | 1 | 45 | Mean Difference (IV, Fixed, 95% CI) | 3.00 [‐23.85, 29.85] |
| Analysis 5.7  Comparison 5 CPA versus SPIRONOLACTONE, Outcome 7 HAIR SHAFT DIAMETER AT 6 MONTHS. | ||||
| 8 TESTOSTERONE (TOTAL) AT 6 MONTHS Show forest plot | 3 | 164 | Mean Difference (IV, Fixed, 95% CI) | ‐0.00 [‐0.28, 0.27] |
| Analysis 5.8  Comparison 5 CPA versus SPIRONOLACTONE, Outcome 8 TESTOSTERONE (TOTAL) AT 6 MONTHS. | ||||
| 9 TESTOSTERONE (FREE) AT 6 MONTHS Show forest plot | 1 | 77 | Mean Difference (IV, Fixed, 95% CI) | 0.35 [‐0.62, 1.32] |
| Analysis 5.9  Comparison 5 CPA versus SPIRONOLACTONE, Outcome 9 TESTOSTERONE (FREE) AT 6 MONTHS. | ||||
| 10 ANDROSTENEDIONE AT 6 MONTHS Show forest plot | 2 | 122 | Mean Difference (IV, Fixed, 95% CI) | ‐0.20 [‐1.66, 1.25] |
| Analysis 5.10  Comparison 5 CPA versus SPIRONOLACTONE, Outcome 10 ANDROSTENEDIONE AT 6 MONTHS. | ||||
| 11 DHEAS AT 6 MONTHS Show forest plot | 3 | 164 | Mean Difference (IV, Fixed, 95% CI) | ‐0.74 [‐1.71, 0.24] |
| Analysis 5.11  Comparison 5 CPA versus SPIRONOLACTONE, Outcome 11 DHEAS AT 6 MONTHS. | ||||
| 12 SHBG AT 6 MONTHS Show forest plot | 1 | 45 | Mean Difference (IV, Fixed, 95% CI) | 9.20 [‐27.20, 45.60] |
| Analysis 5.12  Comparison 5 CPA versus SPIRONOLACTONE, Outcome 12 SHBG AT 6 MONTHS. | ||||
| 13 ESTRADIOL AT 6 MONTHS Show forest plot | 1 | 77 | Mean Difference (IV, Fixed, 95% CI) | 119.00 [10.84, 227.16] |
| Analysis 5.13  Comparison 5 CPA versus SPIRONOLACTONE, Outcome 13 ESTRADIOL AT 6 MONTHS. | ||||
| Outcome or subgroup title | No. of studies | No. of participants | Statistical method | Effect size |
| 1 WITHDRAWALS FROM TREATMENT Show forest plot | 1 | 26 | Odds Ratio (M‐H, Fixed, 95% CI) | 3.6 [0.32, 40.23] |
| Analysis 6.1  Comparison 6 CPA versus FLUTAMIDE, Outcome 1 WITHDRAWALS FROM TREATMENT. | ||||
| 2 FERRIMAN GALLWEY AT 3 MONTHS Show forest plot | 3 | 72 | Mean Difference (IV, Fixed, 95% CI) | 0.37 [‐1.22, 1.95] |
| Analysis 6.2  Comparison 6 CPA versus FLUTAMIDE, Outcome 2 FERRIMAN GALLWEY AT 3 MONTHS. | ||||
| 3 FERRIMAN GALLWEY AT 6 MONTHS Show forest plot | 2 | 50 | Mean Difference (IV, Fixed, 95% CI) | 1.50 [‐1.06, 4.06] |
| Analysis 6.3  Comparison 6 CPA versus FLUTAMIDE, Outcome 3 FERRIMAN GALLWEY AT 6 MONTHS. | ||||
| 4 FERRIMAN GALLWEY AT 12 MONTHS Show forest plot | 1 | 28 | Mean Difference (IV, Fixed, 95% CI) | 4.5 [0.47, 8.53] |
| Analysis 6.4  Comparison 6 CPA versus FLUTAMIDE, Outcome 4 FERRIMAN GALLWEY AT 12 MONTHS. | ||||
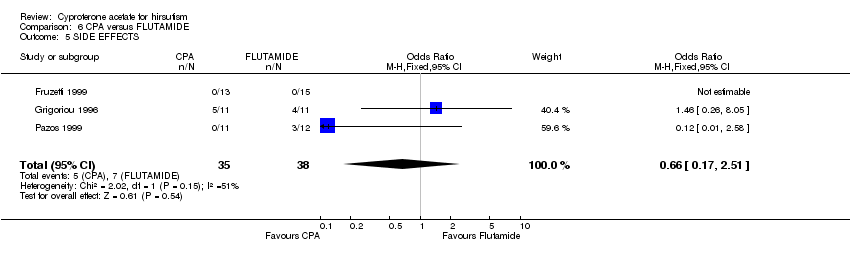
| 5 SIDE EFFECTS Show forest plot | 3 | 73 | Odds Ratio (M‐H, Fixed, 95% CI) | 0.66 [0.17, 2.51] |
| Analysis 6.5  Comparison 6 CPA versus FLUTAMIDE, Outcome 5 SIDE EFFECTS. | ||||
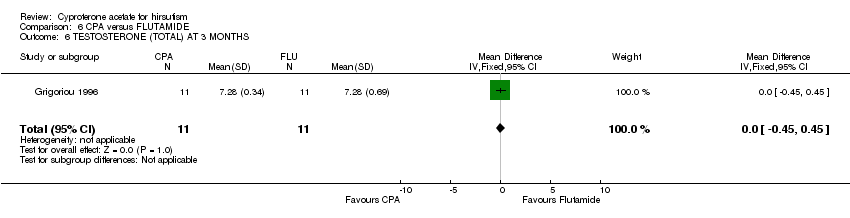
| 6 TESTOSTERONE (TOTAL) AT 3 MONTHS Show forest plot | 1 | 22 | Mean Difference (IV, Fixed, 95% CI) | 0.0 [‐0.45, 0.45] |
| Analysis 6.6  Comparison 6 CPA versus FLUTAMIDE, Outcome 6 TESTOSTERONE (TOTAL) AT 3 MONTHS. | ||||
| 7 TESTOSTERONE (TOTAL) AT 6 MONTHS Show forest plot | 1 | 22 | Mean Difference (IV, Fixed, 95% CI) | ‐0.69 [‐1.14, ‐0.24] |
| Analysis 6.7  Comparison 6 CPA versus FLUTAMIDE, Outcome 7 TESTOSTERONE (TOTAL) AT 6 MONTHS. | ||||
| 8 TESTOSTERONE (FREE) AT 3 MONTHS Show forest plot | 1 | 28 | Mean Difference (IV, Fixed, 95% CI) | ‐5.37 [‐10.29, ‐0.45] |
| Analysis 6.8  Comparison 6 CPA versus FLUTAMIDE, Outcome 8 TESTOSTERONE (FREE) AT 3 MONTHS. | ||||
| 9 TESTOSTERONE (FREE) AT 6 MONTHS Show forest plot | 1 | 28 | Mean Difference (IV, Fixed, 95% CI) | ‐4.16 [‐6.62, ‐1.70] |
| Analysis 6.9  Comparison 6 CPA versus FLUTAMIDE, Outcome 9 TESTOSTERONE (FREE) AT 6 MONTHS. | ||||
| 10 TESTOSTERONE (FREE) AT 12 MONTHS Show forest plot | 1 | 28 | Mean Difference (IV, Fixed, 95% CI) | ‐4.55 [‐7.43, ‐1.67] |
| Analysis 6.10  Comparison 6 CPA versus FLUTAMIDE, Outcome 10 TESTOSTERONE (FREE) AT 12 MONTHS. | ||||
| 11 ANDROSTENEDIONE AT 3 MONTHS Show forest plot | 1 | 22 | Mean Difference (IV, Fixed, 95% CI) | ‐2.79 [‐6.51, 0.93] |
| Analysis 6.11  Comparison 6 CPA versus FLUTAMIDE, Outcome 11 ANDROSTENEDIONE AT 3 MONTHS. | ||||
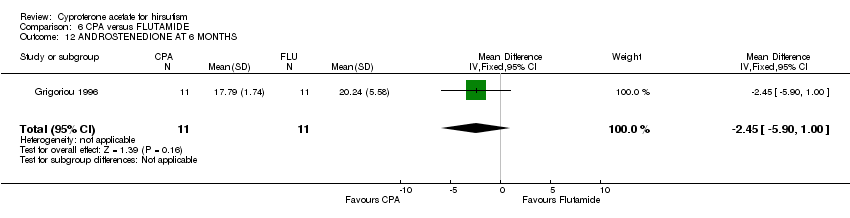
| 12 ANDROSTENEDIONE AT 6 MONTHS Show forest plot | 1 | 22 | Mean Difference (IV, Fixed, 95% CI) | ‐2.45 [‐5.90, 1.00] |
| Analysis 6.12  Comparison 6 CPA versus FLUTAMIDE, Outcome 12 ANDROSTENEDIONE AT 6 MONTHS. | ||||
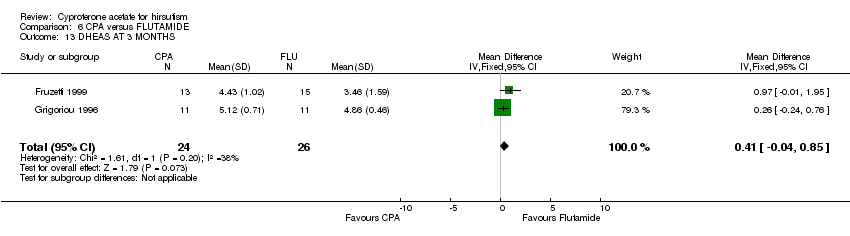
| 13 DHEAS AT 3 MONTHS Show forest plot | 2 | 50 | Mean Difference (IV, Fixed, 95% CI) | 0.41 [‐0.04, 0.85] |
| Analysis 6.13  Comparison 6 CPA versus FLUTAMIDE, Outcome 13 DHEAS AT 3 MONTHS. | ||||
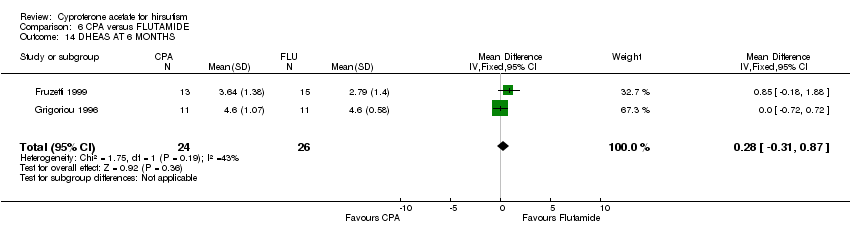
| 14 DHEAS AT 6 MONTHS Show forest plot | 2 | 50 | Mean Difference (IV, Fixed, 95% CI) | 0.28 [‐0.31, 0.87] |
| Analysis 6.14  Comparison 6 CPA versus FLUTAMIDE, Outcome 14 DHEAS AT 6 MONTHS. | ||||
| 15 DHEAS AT 12 MONTHS Show forest plot | 1 | 28 | Mean Difference (IV, Fixed, 95% CI) | 1.16 [‐0.38, 2.70] |
| Analysis 6.15  Comparison 6 CPA versus FLUTAMIDE, Outcome 15 DHEAS AT 12 MONTHS. | ||||
| 16 SHBG AT 3 MONTHS Show forest plot | 1 | 22 | Mean Difference (IV, Fixed, 95% CI) | 1.19 [‐1.57, 3.95] |
| Analysis 6.16  Comparison 6 CPA versus FLUTAMIDE, Outcome 16 SHBG AT 3 MONTHS. | ||||
| 17 SHBG AT 6 MONTHS Show forest plot | 1 | 22 | Mean Difference (IV, Fixed, 95% CI) | 1.17 [‐2.42, 4.76] |
| Analysis 6.17  Comparison 6 CPA versus FLUTAMIDE, Outcome 17 SHBG AT 6 MONTHS. | ||||
| Outcome or subgroup title | No. of studies | No. of participants | Statistical method | Effect size |
| 1 FERRIMAN GALLWEY AT 3 MONTHS Show forest plot | 1 | 27 | Mean Difference (IV, Fixed, 95% CI) | 4.70 [‐1.86, 11.26] |
| Analysis 7.1  Comparison 7 CPA versus FINASTERIDE, Outcome 1 FERRIMAN GALLWEY AT 3 MONTHS. | ||||
| 2 FERRIMAN GALLWEY AT 6 MONTHS Show forest plot | 1 | 27 | Mean Difference (IV, Fixed, 95% CI) | ‐0.20 [‐5.50, 5.10] |
| Analysis 7.2  Comparison 7 CPA versus FINASTERIDE, Outcome 2 FERRIMAN GALLWEY AT 6 MONTHS. | ||||
| 3 FERRIMAN GALLWEY AT 12 MONTHS Show forest plot | 1 | 27 | Mean Difference (IV, Fixed, 95% CI) | ‐0.10 [‐5.09, 4.89] |
| Analysis 7.3  Comparison 7 CPA versus FINASTERIDE, Outcome 3 FERRIMAN GALLWEY AT 12 MONTHS. | ||||
| 4 TESTOSTERONE (TOTAL) AT 3 MONTHS Show forest plot | 1 | 27 | Mean Difference (IV, Fixed, 95% CI) | ‐1.11 [‐1.81, ‐0.41] |
| Analysis 7.4  Comparison 7 CPA versus FINASTERIDE, Outcome 4 TESTOSTERONE (TOTAL) AT 3 MONTHS. | ||||
| 5 TESTOSTERONE (TOTAL) AT 6 MONTHS Show forest plot | 1 | 27 | Mean Difference (IV, Fixed, 95% CI) | ‐1.60 [‐2.39, ‐0.81] |
| Analysis 7.5  Comparison 7 CPA versus FINASTERIDE, Outcome 5 TESTOSTERONE (TOTAL) AT 6 MONTHS. | ||||
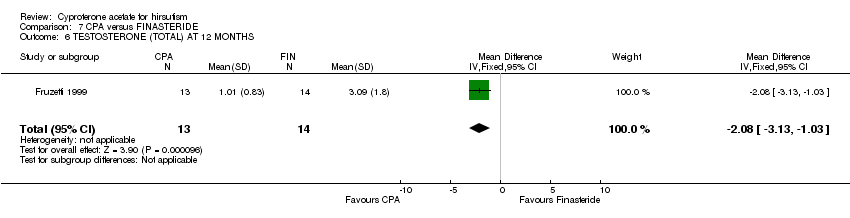
| 6 TESTOSTERONE (TOTAL) AT 12 MONTHS Show forest plot | 1 | 27 | Mean Difference (IV, Fixed, 95% CI) | ‐2.08 [‐3.13, ‐1.03] |
| Analysis 7.6  Comparison 7 CPA versus FINASTERIDE, Outcome 6 TESTOSTERONE (TOTAL) AT 12 MONTHS. | ||||
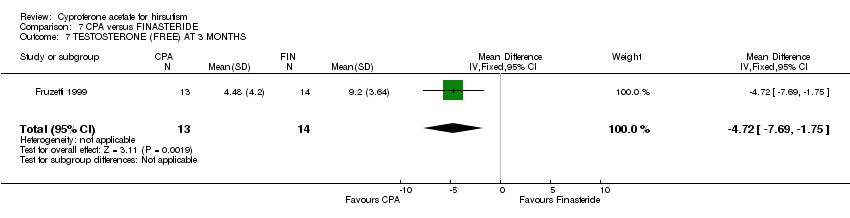
| 7 TESTOSTERONE (FREE) AT 3 MONTHS Show forest plot | 1 | 27 | Mean Difference (IV, Fixed, 95% CI) | ‐4.72 [‐7.69, ‐1.75] |
| Analysis 7.7  Comparison 7 CPA versus FINASTERIDE, Outcome 7 TESTOSTERONE (FREE) AT 3 MONTHS. | ||||
| 8 TESTOSTERONE (FREE) AT 6 MONTHS Show forest plot | 1 | 27 | Mean Difference (IV, Fixed, 95% CI) | ‐9.02 [‐12.44, ‐5.60] |
| Analysis 7.8  Comparison 7 CPA versus FINASTERIDE, Outcome 8 TESTOSTERONE (FREE) AT 6 MONTHS. | ||||
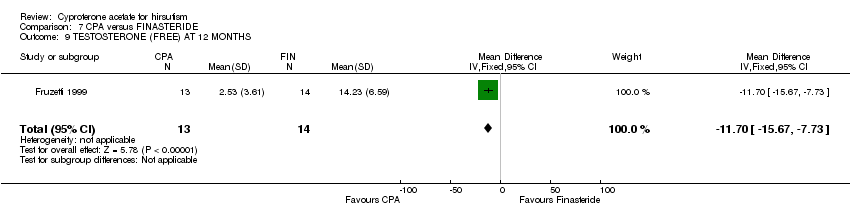
| 9 TESTOSTERONE (FREE) AT 12 MONTHS Show forest plot | 1 | 27 | Mean Difference (IV, Fixed, 95% CI) | ‐11.70 [‐15.67, ‐7.73] |
| Analysis 7.9  Comparison 7 CPA versus FINASTERIDE, Outcome 9 TESTOSTERONE (FREE) AT 12 MONTHS. | ||||
| 10 3 ALPHA ANDROSTENEDIOL GLUCORONIDE AT 6 MONTHS Show forest plot | 1 | 27 | Mean Difference (IV, Fixed, 95% CI) | ‐0.71 [‐5.05, 3.63] |
| Analysis 7.10  Comparison 7 CPA versus FINASTERIDE, Outcome 10 3 ALPHA ANDROSTENEDIOL GLUCORONIDE AT 6 MONTHS. | ||||
| Outcome or subgroup title | No. of studies | No. of participants | Statistical method | Effect size |
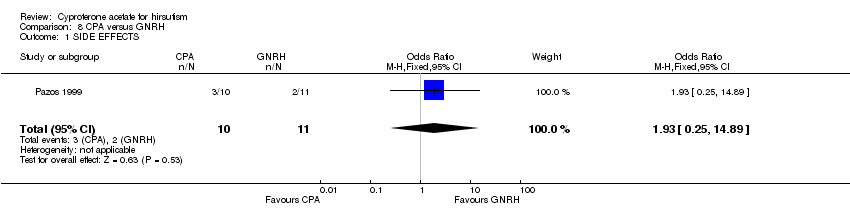
| 1 SIDE EFFECTS Show forest plot | 1 | 21 | Odds Ratio (M‐H, Fixed, 95% CI) | 1.93 [0.25, 14.89] |
| Analysis 8.1  Comparison 8 CPA versus GNRH, Outcome 1 SIDE EFFECTS. | ||||
| 2 FERRIMAN GALLWEY AT 3 MONTHS Show forest plot | 1 | 21 | Mean Difference (IV, Fixed, 95% CI) | ‐2.80 [‐5.85, 0.25] |
| Analysis 8.2  Comparison 8 CPA versus GNRH, Outcome 2 FERRIMAN GALLWEY AT 3 MONTHS. | ||||
| 3 TESTOSTERONE (TOTAL) AT 3 MONTHS Show forest plot | 1 | 20 | Mean Difference (IV, Fixed, 95% CI) | 0.17 [‐0.15, 0.49] |
| Analysis 8.3  Comparison 8 CPA versus GNRH, Outcome 3 TESTOSTERONE (TOTAL) AT 3 MONTHS. | ||||
| 4 ANDROSTENEDIONE AT 3 MONTHS Show forest plot | 1 | 20 | Mean Difference (IV, Fixed, 95% CI) | 0.66 [‐0.44, 1.76] |
| Analysis 8.4  Comparison 8 CPA versus GNRH, Outcome 4 ANDROSTENEDIONE AT 3 MONTHS. | ||||

Comparison 2 CPA (2MG) + EE versus PLACEBO, Outcome 1 SUBJECTIVE IMPROVEMENT IN HAIR GROWTH.

Comparison 3 CPA (>2MG) + EE versus CPA(2MG) + EE, Outcome 1 FERRIMAN GALLWEY AT 6 MONTHS.

Comparison 3 CPA (>2MG) + EE versus CPA(2MG) + EE, Outcome 2 TESTOSTERONE (TOTAL) AT 6 MONTHS.

Comparison 3 CPA (>2MG) + EE versus CPA(2MG) + EE, Outcome 3 TESTOSTERONE LEVEL (FREE) AT 6 MONTHS.

Comparison 3 CPA (>2MG) + EE versus CPA(2MG) + EE, Outcome 4 ANDROSTENEDIONE LEVEL AT 6 MONTHS.
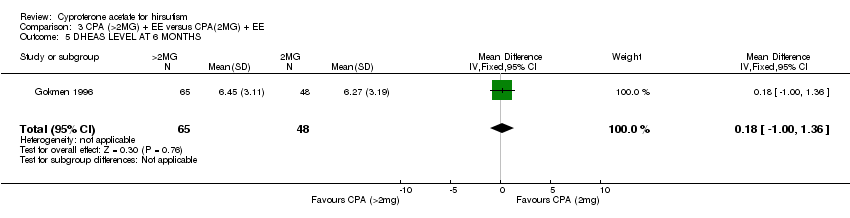
Comparison 3 CPA (>2MG) + EE versus CPA(2MG) + EE, Outcome 5 DHEAS LEVEL AT 6 MONTHS.

Comparison 3 CPA (>2MG) + EE versus CPA(2MG) + EE, Outcome 6 ESTRADIOL LEVEL AT 6 MONTHS.

Comparison 4 CPA versus KETOCONAZOLE, Outcome 1 FERRIMAN GALLWEY AT 6 MONTHS.

Comparison 4 CPA versus KETOCONAZOLE, Outcome 2 TESTOSTERONE (TOTAL) AT 6 MONTHS.

Comparison 4 CPA versus KETOCONAZOLE, Outcome 3 TESTOSTERONE (FREE) AT 6 MONTHS.

Comparison 4 CPA versus KETOCONAZOLE, Outcome 4 ANDROSTENEDIONE AT 6 MONTHS.
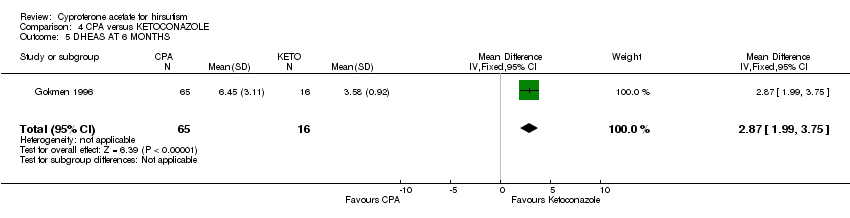
Comparison 4 CPA versus KETOCONAZOLE, Outcome 5 DHEAS AT 6 MONTHS.

Comparison 4 CPA versus KETOCONAZOLE, Outcome 6 ESTRADIOL AT 6 MONTHS.

Comparison 5 CPA versus SPIRONOLACTONE, Outcome 1 WITHDRAWALS DURING TREATMENT.
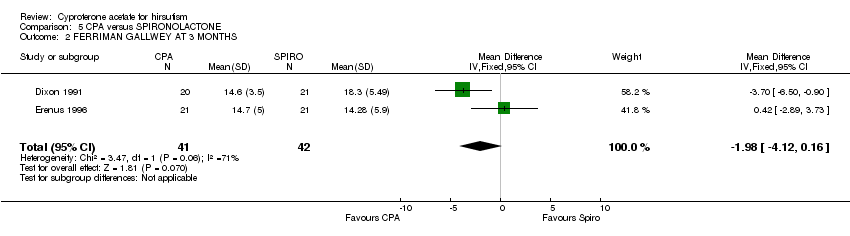
Comparison 5 CPA versus SPIRONOLACTONE, Outcome 2 FERRIMAN GALLWEY AT 3 MONTHS.

Comparison 5 CPA versus SPIRONOLACTONE, Outcome 3 FERRIMAN GALLWEY AT 6 MONTHS.

Comparison 5 CPA versus SPIRONOLACTONE, Outcome 4 SIDE EFFECTS DURING TREATMENT.

Comparison 5 CPA versus SPIRONOLACTONE, Outcome 5 LINEAR HAIR GROWTH AT 3 MONTHS.

Comparison 5 CPA versus SPIRONOLACTONE, Outcome 6 LINEAR HAIR GROWTH AT 6 MONTHS.

Comparison 5 CPA versus SPIRONOLACTONE, Outcome 7 HAIR SHAFT DIAMETER AT 6 MONTHS.

Comparison 5 CPA versus SPIRONOLACTONE, Outcome 8 TESTOSTERONE (TOTAL) AT 6 MONTHS.

Comparison 5 CPA versus SPIRONOLACTONE, Outcome 9 TESTOSTERONE (FREE) AT 6 MONTHS.

Comparison 5 CPA versus SPIRONOLACTONE, Outcome 10 ANDROSTENEDIONE AT 6 MONTHS.

Comparison 5 CPA versus SPIRONOLACTONE, Outcome 11 DHEAS AT 6 MONTHS.

Comparison 5 CPA versus SPIRONOLACTONE, Outcome 12 SHBG AT 6 MONTHS.

Comparison 5 CPA versus SPIRONOLACTONE, Outcome 13 ESTRADIOL AT 6 MONTHS.

Comparison 6 CPA versus FLUTAMIDE, Outcome 1 WITHDRAWALS FROM TREATMENT.

Comparison 6 CPA versus FLUTAMIDE, Outcome 2 FERRIMAN GALLWEY AT 3 MONTHS.

Comparison 6 CPA versus FLUTAMIDE, Outcome 3 FERRIMAN GALLWEY AT 6 MONTHS.
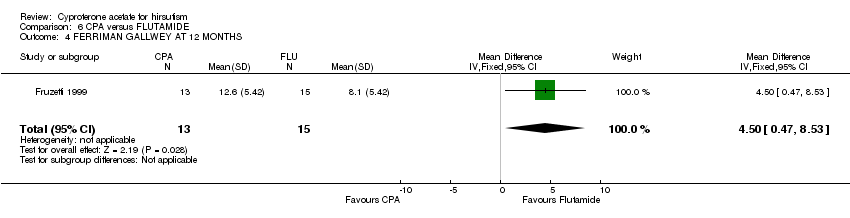
Comparison 6 CPA versus FLUTAMIDE, Outcome 4 FERRIMAN GALLWEY AT 12 MONTHS.
Comparison 6 CPA versus FLUTAMIDE, Outcome 5 SIDE EFFECTS.
Comparison 6 CPA versus FLUTAMIDE, Outcome 6 TESTOSTERONE (TOTAL) AT 3 MONTHS.

Comparison 6 CPA versus FLUTAMIDE, Outcome 7 TESTOSTERONE (TOTAL) AT 6 MONTHS.

Comparison 6 CPA versus FLUTAMIDE, Outcome 8 TESTOSTERONE (FREE) AT 3 MONTHS.

Comparison 6 CPA versus FLUTAMIDE, Outcome 9 TESTOSTERONE (FREE) AT 6 MONTHS.

Comparison 6 CPA versus FLUTAMIDE, Outcome 10 TESTOSTERONE (FREE) AT 12 MONTHS.

Comparison 6 CPA versus FLUTAMIDE, Outcome 11 ANDROSTENEDIONE AT 3 MONTHS.
Comparison 6 CPA versus FLUTAMIDE, Outcome 12 ANDROSTENEDIONE AT 6 MONTHS.
Comparison 6 CPA versus FLUTAMIDE, Outcome 13 DHEAS AT 3 MONTHS.
Comparison 6 CPA versus FLUTAMIDE, Outcome 14 DHEAS AT 6 MONTHS.

Comparison 6 CPA versus FLUTAMIDE, Outcome 15 DHEAS AT 12 MONTHS.

Comparison 6 CPA versus FLUTAMIDE, Outcome 16 SHBG AT 3 MONTHS.

Comparison 6 CPA versus FLUTAMIDE, Outcome 17 SHBG AT 6 MONTHS.

Comparison 7 CPA versus FINASTERIDE, Outcome 1 FERRIMAN GALLWEY AT 3 MONTHS.

Comparison 7 CPA versus FINASTERIDE, Outcome 2 FERRIMAN GALLWEY AT 6 MONTHS.

Comparison 7 CPA versus FINASTERIDE, Outcome 3 FERRIMAN GALLWEY AT 12 MONTHS.

Comparison 7 CPA versus FINASTERIDE, Outcome 4 TESTOSTERONE (TOTAL) AT 3 MONTHS.

Comparison 7 CPA versus FINASTERIDE, Outcome 5 TESTOSTERONE (TOTAL) AT 6 MONTHS.
Comparison 7 CPA versus FINASTERIDE, Outcome 6 TESTOSTERONE (TOTAL) AT 12 MONTHS.
Comparison 7 CPA versus FINASTERIDE, Outcome 7 TESTOSTERONE (FREE) AT 3 MONTHS.

Comparison 7 CPA versus FINASTERIDE, Outcome 8 TESTOSTERONE (FREE) AT 6 MONTHS.
Comparison 7 CPA versus FINASTERIDE, Outcome 9 TESTOSTERONE (FREE) AT 12 MONTHS.

Comparison 7 CPA versus FINASTERIDE, Outcome 10 3 ALPHA ANDROSTENEDIOL GLUCORONIDE AT 6 MONTHS.
Comparison 8 CPA versus GNRH, Outcome 1 SIDE EFFECTS.

Comparison 8 CPA versus GNRH, Outcome 2 FERRIMAN GALLWEY AT 3 MONTHS.

Comparison 8 CPA versus GNRH, Outcome 3 TESTOSTERONE (TOTAL) AT 3 MONTHS.

Comparison 8 CPA versus GNRH, Outcome 4 ANDROSTENEDIONE AT 3 MONTHS.
| Outcome or subgroup title | No. of studies | No. of participants | Statistical method | Effect size |
| 1 SUBJECTIVE IMPROVEMENT IN HAIR GROWTH Show forest plot | 1 | 20 | Odds Ratio (M‐H, Fixed, 95% CI) | 45.0 [2.01, 1006.75] |
| Outcome or subgroup title | No. of studies | No. of participants | Statistical method | Effect size |
| 1 FERRIMAN GALLWEY AT 6 MONTHS Show forest plot | 1 | 113 | Mean Difference (IV, Fixed, 95% CI) | 1.10 [‐0.71, 2.91] |
| 2 TESTOSTERONE (TOTAL) AT 6 MONTHS Show forest plot | 1 | 113 | Mean Difference (IV, Fixed, 95% CI) | ‐0.49 [‐1.78, 0.80] |
| 3 TESTOSTERONE LEVEL (FREE) AT 6 MONTHS Show forest plot | 1 | 113 | Mean Difference (IV, Fixed, 95% CI) | 0.35 [‐0.61, 1.31] |
| 4 ANDROSTENEDIONE LEVEL AT 6 MONTHS Show forest plot | 1 | 113 | Mean Difference (IV, Fixed, 95% CI) | ‐0.35 [‐1.32, 0.62] |
| 5 DHEAS LEVEL AT 6 MONTHS Show forest plot | 1 | 113 | Mean Difference (IV, Fixed, 95% CI) | 0.18 [1.00, 1.36] |
| 6 ESTRADIOL LEVEL AT 6 MONTHS Show forest plot | 1 | 113 | Mean Difference (IV, Fixed, 95% CI) | ‐19.0 [‐103.67, 65.67] |
| Outcome or subgroup title | No. of studies | No. of participants | Statistical method | Effect size |
| 1 FERRIMAN GALLWEY AT 6 MONTHS Show forest plot | 1 | 81 | Mean Difference (IV, Fixed, 95% CI) | 0.70 [‐0.84, 2.24] |
| 2 TESTOSTERONE (TOTAL) AT 6 MONTHS Show forest plot | 1 | 81 | Mean Difference (IV, Fixed, 95% CI) | ‐0.02 [‐0.37, 0.33] |
| 3 TESTOSTERONE (FREE) AT 6 MONTHS Show forest plot | 1 | 81 | Mean Difference (IV, Fixed, 95% CI) | 1.39 [0.43, 2.35] |
| 4 ANDROSTENEDIONE AT 6 MONTHS Show forest plot | 1 | 81 | Mean Difference (IV, Fixed, 95% CI) | 0.35 [‐0.62, 1.32] |
| 5 DHEAS AT 6 MONTHS Show forest plot | 1 | 81 | Mean Difference (IV, Fixed, 95% CI) | 2.87 [1.99, 3.75] |
| 6 ESTRADIOL AT 6 MONTHS Show forest plot | 1 | 81 | Mean Difference (IV, Fixed, 95% CI) | 135.0 [59.92, 210.08] |
| Outcome or subgroup title | No. of studies | No. of participants | Statistical method | Effect size |
| 1 WITHDRAWALS DURING TREATMENT Show forest plot | 1 | 48 | Odds Ratio (M‐H, Fixed, 95% CI) | 0.37 [0.03, 4.33] |
| 2 FERRIMAN GALLWEY AT 3 MONTHS Show forest plot | 2 | 83 | Mean Difference (IV, Fixed, 95% CI) | ‐1.98 [‐4.12, 0.16] |
| 3 FERRIMAN GALLWEY AT 6 MONTHS Show forest plot | 3 | 160 | Mean Difference (IV, Fixed, 95% CI) | ‐1.35 [‐2.87, 0.18] |
| 4 SIDE EFFECTS DURING TREATMENT Show forest plot | 2 | 90 | Odds Ratio (M‐H, Fixed, 95% CI) | 0.75 [0.21, 2.70] |
| 5 LINEAR HAIR GROWTH AT 3 MONTHS Show forest plot | 1 | 41 | Mean Difference (IV, Fixed, 95% CI) | 0.02 [‐0.03, 0.07] |
| 6 LINEAR HAIR GROWTH AT 6 MONTHS Show forest plot | 1 | 41 | Mean Difference (IV, Fixed, 95% CI) | ‐0.04 [‐0.09, 0.01] |
| 7 HAIR SHAFT DIAMETER AT 6 MONTHS Show forest plot | 1 | 45 | Mean Difference (IV, Fixed, 95% CI) | 3.00 [‐23.85, 29.85] |
| 8 TESTOSTERONE (TOTAL) AT 6 MONTHS Show forest plot | 3 | 164 | Mean Difference (IV, Fixed, 95% CI) | ‐0.00 [‐0.28, 0.27] |
| 9 TESTOSTERONE (FREE) AT 6 MONTHS Show forest plot | 1 | 77 | Mean Difference (IV, Fixed, 95% CI) | 0.35 [‐0.62, 1.32] |
| 10 ANDROSTENEDIONE AT 6 MONTHS Show forest plot | 2 | 122 | Mean Difference (IV, Fixed, 95% CI) | ‐0.20 [‐1.66, 1.25] |
| 11 DHEAS AT 6 MONTHS Show forest plot | 3 | 164 | Mean Difference (IV, Fixed, 95% CI) | ‐0.74 [‐1.71, 0.24] |
| 12 SHBG AT 6 MONTHS Show forest plot | 1 | 45 | Mean Difference (IV, Fixed, 95% CI) | 9.20 [‐27.20, 45.60] |
| 13 ESTRADIOL AT 6 MONTHS Show forest plot | 1 | 77 | Mean Difference (IV, Fixed, 95% CI) | 119.00 [10.84, 227.16] |
| Outcome or subgroup title | No. of studies | No. of participants | Statistical method | Effect size |
| 1 WITHDRAWALS FROM TREATMENT Show forest plot | 1 | 26 | Odds Ratio (M‐H, Fixed, 95% CI) | 3.6 [0.32, 40.23] |
| 2 FERRIMAN GALLWEY AT 3 MONTHS Show forest plot | 3 | 72 | Mean Difference (IV, Fixed, 95% CI) | 0.37 [‐1.22, 1.95] |
| 3 FERRIMAN GALLWEY AT 6 MONTHS Show forest plot | 2 | 50 | Mean Difference (IV, Fixed, 95% CI) | 1.50 [‐1.06, 4.06] |
| 4 FERRIMAN GALLWEY AT 12 MONTHS Show forest plot | 1 | 28 | Mean Difference (IV, Fixed, 95% CI) | 4.5 [0.47, 8.53] |
| 5 SIDE EFFECTS Show forest plot | 3 | 73 | Odds Ratio (M‐H, Fixed, 95% CI) | 0.66 [0.17, 2.51] |
| 6 TESTOSTERONE (TOTAL) AT 3 MONTHS Show forest plot | 1 | 22 | Mean Difference (IV, Fixed, 95% CI) | 0.0 [‐0.45, 0.45] |
| 7 TESTOSTERONE (TOTAL) AT 6 MONTHS Show forest plot | 1 | 22 | Mean Difference (IV, Fixed, 95% CI) | ‐0.69 [‐1.14, ‐0.24] |
| 8 TESTOSTERONE (FREE) AT 3 MONTHS Show forest plot | 1 | 28 | Mean Difference (IV, Fixed, 95% CI) | ‐5.37 [‐10.29, ‐0.45] |
| 9 TESTOSTERONE (FREE) AT 6 MONTHS Show forest plot | 1 | 28 | Mean Difference (IV, Fixed, 95% CI) | ‐4.16 [‐6.62, ‐1.70] |
| 10 TESTOSTERONE (FREE) AT 12 MONTHS Show forest plot | 1 | 28 | Mean Difference (IV, Fixed, 95% CI) | ‐4.55 [‐7.43, ‐1.67] |
| 11 ANDROSTENEDIONE AT 3 MONTHS Show forest plot | 1 | 22 | Mean Difference (IV, Fixed, 95% CI) | ‐2.79 [‐6.51, 0.93] |
| 12 ANDROSTENEDIONE AT 6 MONTHS Show forest plot | 1 | 22 | Mean Difference (IV, Fixed, 95% CI) | ‐2.45 [‐5.90, 1.00] |
| 13 DHEAS AT 3 MONTHS Show forest plot | 2 | 50 | Mean Difference (IV, Fixed, 95% CI) | 0.41 [‐0.04, 0.85] |
| 14 DHEAS AT 6 MONTHS Show forest plot | 2 | 50 | Mean Difference (IV, Fixed, 95% CI) | 0.28 [‐0.31, 0.87] |
| 15 DHEAS AT 12 MONTHS Show forest plot | 1 | 28 | Mean Difference (IV, Fixed, 95% CI) | 1.16 [‐0.38, 2.70] |
| 16 SHBG AT 3 MONTHS Show forest plot | 1 | 22 | Mean Difference (IV, Fixed, 95% CI) | 1.19 [‐1.57, 3.95] |
| 17 SHBG AT 6 MONTHS Show forest plot | 1 | 22 | Mean Difference (IV, Fixed, 95% CI) | 1.17 [‐2.42, 4.76] |
| Outcome or subgroup title | No. of studies | No. of participants | Statistical method | Effect size |
| 1 FERRIMAN GALLWEY AT 3 MONTHS Show forest plot | 1 | 27 | Mean Difference (IV, Fixed, 95% CI) | 4.70 [‐1.86, 11.26] |
| 2 FERRIMAN GALLWEY AT 6 MONTHS Show forest plot | 1 | 27 | Mean Difference (IV, Fixed, 95% CI) | ‐0.20 [‐5.50, 5.10] |
| 3 FERRIMAN GALLWEY AT 12 MONTHS Show forest plot | 1 | 27 | Mean Difference (IV, Fixed, 95% CI) | ‐0.10 [‐5.09, 4.89] |
| 4 TESTOSTERONE (TOTAL) AT 3 MONTHS Show forest plot | 1 | 27 | Mean Difference (IV, Fixed, 95% CI) | ‐1.11 [‐1.81, ‐0.41] |
| 5 TESTOSTERONE (TOTAL) AT 6 MONTHS Show forest plot | 1 | 27 | Mean Difference (IV, Fixed, 95% CI) | ‐1.60 [‐2.39, ‐0.81] |
| 6 TESTOSTERONE (TOTAL) AT 12 MONTHS Show forest plot | 1 | 27 | Mean Difference (IV, Fixed, 95% CI) | ‐2.08 [‐3.13, ‐1.03] |
| 7 TESTOSTERONE (FREE) AT 3 MONTHS Show forest plot | 1 | 27 | Mean Difference (IV, Fixed, 95% CI) | ‐4.72 [‐7.69, ‐1.75] |
| 8 TESTOSTERONE (FREE) AT 6 MONTHS Show forest plot | 1 | 27 | Mean Difference (IV, Fixed, 95% CI) | ‐9.02 [‐12.44, ‐5.60] |
| 9 TESTOSTERONE (FREE) AT 12 MONTHS Show forest plot | 1 | 27 | Mean Difference (IV, Fixed, 95% CI) | ‐11.70 [‐15.67, ‐7.73] |
| 10 3 ALPHA ANDROSTENEDIOL GLUCORONIDE AT 6 MONTHS Show forest plot | 1 | 27 | Mean Difference (IV, Fixed, 95% CI) | ‐0.71 [‐5.05, 3.63] |
| Outcome or subgroup title | No. of studies | No. of participants | Statistical method | Effect size |
| 1 SIDE EFFECTS Show forest plot | 1 | 21 | Odds Ratio (M‐H, Fixed, 95% CI) | 1.93 [0.25, 14.89] |
| 2 FERRIMAN GALLWEY AT 3 MONTHS Show forest plot | 1 | 21 | Mean Difference (IV, Fixed, 95% CI) | ‐2.80 [‐5.85, 0.25] |
| 3 TESTOSTERONE (TOTAL) AT 3 MONTHS Show forest plot | 1 | 20 | Mean Difference (IV, Fixed, 95% CI) | 0.17 [‐0.15, 0.49] |
| 4 ANDROSTENEDIONE AT 3 MONTHS Show forest plot | 1 | 20 | Mean Difference (IV, Fixed, 95% CI) | 0.66 [‐0.44, 1.76] |