| 1 Live birth rate Show forest plot | 8 | 1034 | Odds Ratio (M‐H, Fixed, 95% CI) | 0.77 [0.59, 1.01] |
|
| 1.1 LOD versus Clomiphene citrate + metformin | 2 | 159 | Odds Ratio (M‐H, Fixed, 95% CI) | 0.44 [0.24, 0.82] |
| 1.2 LOD versus Clomiphene citrate + tamoxifen | 1 | 150 | Odds Ratio (M‐H, Fixed, 95% CI) | 0.81 [0.42, 1.53] |
| 1.3 LOD versus Gonadotrophin | 3 | 318 | Odds Ratio (M‐H, Fixed, 95% CI) | 0.97 [0.59, 1.59] |
| 1.4 LOD versus Aromatase inhibitor | 2 | 407 | Odds Ratio (M‐H, Fixed, 95% CI) | 0.84 [0.54, 1.31] |
| 2 Multiple pregnancy rate (per ongoing pregnancy) Show forest plot | 12 | 1129 | Odds Ratio (M‐H, Fixed, 95% CI) | 0.21 [0.08, 0.58] |
|
| 2.1 LOD versus Clomiphene citrate + metformin | 3 | 441 | Odds Ratio (M‐H, Fixed, 95% CI) | 0.10 [0.01, 1.94] |
| 2.2 LOD versus Gonadotrophin | 5 | 166 | Odds Ratio (M‐H, Fixed, 95% CI) | 0.13 [0.03, 0.52] |
| 2.3 LOD versus Aromatase inhibitor | 2 | 407 | Odds Ratio (M‐H, Fixed, 95% CI) | 0.0 [0.0, 0.0] |
| 2.4 LOD versus Clomiphene citrate | 1 | 72 | Odds Ratio (M‐H, Fixed, 95% CI) | 0.0 [0.0, 0.0] |
| 2.5 LOD versus Rosiglitazone + CC | 1 | 43 | Odds Ratio (M‐H, Fixed, 95% CI) | 2.21 [0.19, 26.38] |
| 3 Pregnancy rate per woman randomised Show forest plot | 18 | 1930 | Odds Ratio (M‐H, Fixed, 95% CI) | 0.94 [0.78, 1.14] |
|
| 3.1 LOD versus Clomiphene citrate + metformin | 3 | 441 | Odds Ratio (M‐H, Fixed, 95% CI) | 0.79 [0.53, 1.18] |
| 3.2 LOD versus Clomiphene citrate + tamoxifen | 2 | 250 | Odds Ratio (M‐H, Fixed, 95% CI) | 0.97 [0.59, 1.59] |
| 3.3 LOD versus Gonadotrophin | 8 | 607 | Odds Ratio (M‐H, Fixed, 95% CI) | 1.01 [0.72, 1.42] |
| 3.4 LOD versus Aromatase inhibitor | 2 | 407 | Odds Ratio (M‐H, Fixed, 95% CI) | 0.89 [0.58, 1.37] |
| 3.5 LOD versus Clomiphene citrate | 1 | 72 | Odds Ratio (M‐H, Fixed, 95% CI) | 0.52 [0.19, 1.44] |
| 3.6 LOD versus Metformin | 1 | 110 | Odds Ratio (M‐H, Fixed, 95% CI) | 2.47 [1.05, 5.81] |
| 3.7 LOD versus Rosiglitazone + CC | 1 | 43 | Odds Ratio (M‐H, Fixed, 95% CI) | 0.75 [0.23, 2.50] |
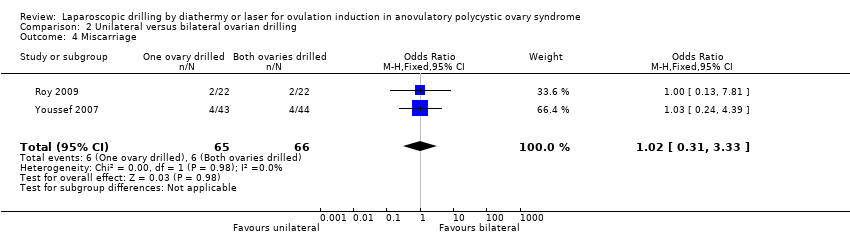
| 4 Miscarriage rate Show forest plot | 15 | 1592 | Odds Ratio (M‐H, Fixed, 95% CI) | 1.10 [0.74, 1.61] |
|
| 4.1 LOD versus Clomiphene citrate + metformin | 3 | 441 | Odds Ratio (M‐H, Fixed, 95% CI) | 1.43 [0.70, 2.91] |
| 4.2 LOD versus Clomiphene citrate + tamoxifen | 1 | 150 | Odds Ratio (M‐H, Fixed, 95% CI) | 1.71 [0.39, 7.45] |
| 4.3 LOD versus Gonadotrophin | 7 | 441 | Odds Ratio (M‐H, Fixed, 95% CI) | 0.73 [0.40, 1.33] |
| 4.4 LOD versus Aromatase inhibitor | 2 | 407 | Odds Ratio (M‐H, Fixed, 95% CI) | 1.33 [0.45, 3.90] |
| 4.5 LOD versus Metformin | 1 | 110 | Odds Ratio (M‐H, Fixed, 95% CI) | 2.08 [0.36, 11.85] |
| 4.6 LOD versus Rosiglitazone + CC | 1 | 43 | Odds Ratio (M‐H, Fixed, 95% CI) | 1.05 [0.06, 17.95] |
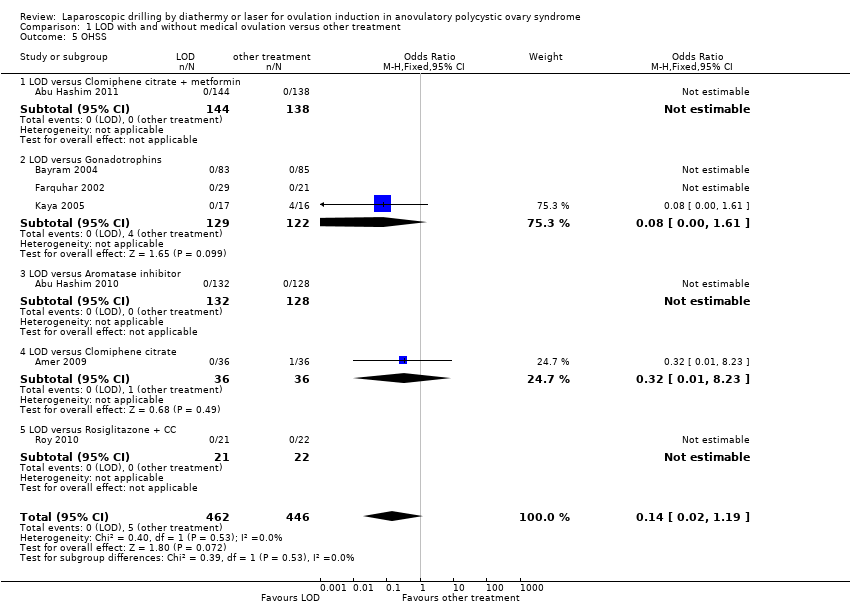
| 5 OHSS Show forest plot | 7 | 908 | Odds Ratio (M‐H, Fixed, 95% CI) | 0.14 [0.02, 1.19] |
|
| 5.1 LOD versus Clomiphene citrate + metformin | 1 | 282 | Odds Ratio (M‐H, Fixed, 95% CI) | 0.0 [0.0, 0.0] |
| 5.2 LOD versus Gonadotrophins | 3 | 251 | Odds Ratio (M‐H, Fixed, 95% CI) | 0.08 [0.00, 1.61] |
| 5.3 LOD versus Aromatase inhibitor | 1 | 260 | Odds Ratio (M‐H, Fixed, 95% CI) | 0.0 [0.0, 0.0] |
| 5.4 LOD versus Clomiphene citrate | 1 | 72 | Odds Ratio (M‐H, Fixed, 95% CI) | 0.32 [0.01, 8.23] |
| 5.5 LOD versus Rosiglitazone + CC | 1 | 43 | Odds Ratio (M‐H, Fixed, 95% CI) | 0.0 [0.0, 0.0] |
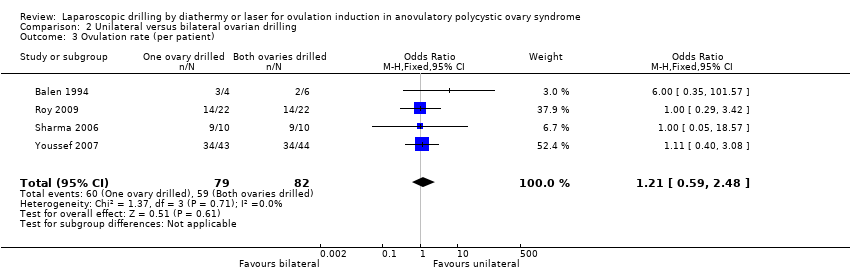
| 6 Ovulation rate Show forest plot | 7 | | Odds Ratio (M‐H, Fixed, 95% CI) | Subtotals only |
|
| 6.1 LOD versus Clomiphene citrate + metformin | 1 | 47 | Odds Ratio (M‐H, Fixed, 95% CI) | 0.89 [0.27, 2.93] |
| 6.2 LOD versus Clomiphene citrate + tamoxifen | 2 | 250 | Odds Ratio (M‐H, Fixed, 95% CI) | 1.34 [0.68, 2.63] |
| 6.3 LOD versus Gonadotrophins | 1 | 50 | Odds Ratio (M‐H, Fixed, 95% CI) | 0.66 [0.21, 2.07] |
| 6.4 LOD versus Clomiphene citrate | 1 | 72 | Odds Ratio (M‐H, Fixed, 95% CI) | 0.7 [0.27, 1.83] |
| 6.5 LOD versus Metformin | 1 | 110 | Odds Ratio (M‐H, Fixed, 95% CI) | 1.78 [0.80, 3.96] |
| 6.6 LOD versus Rosiglitazone + CC | 1 | 43 | Odds Ratio (M‐H, Fixed, 95% CI) | 0.67 [0.13, 3.44] |
| 7 Costs Show forest plot | 3 | | Mean Difference (IV, Fixed, 95% CI) | Subtotals only |
|
| 7.1 LOD versus Clomiphene citrate + metformin | 1 | 50 | Mean Difference (IV, Fixed, 95% CI) | 3711.3 [3585.17, 3837.43] |
| 7.2 LOD versus Gonadotrophins only (short term) | 2 | 203 | Mean Difference (IV, Fixed, 95% CI) | ‐1115.75 [‐1309.72, ‐921.77] |
| 7.3 LOD versus Gonadotrophins only (long term) | 1 | 168 | Mean Difference (IV, Fixed, 95% CI) | ‐2235.0 [‐4433.16, ‐36.84] |
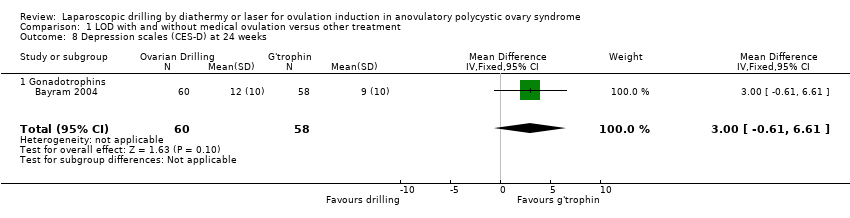
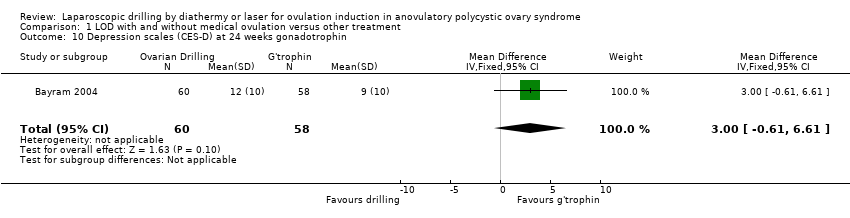
| 8 Depression scales (CES‐D) at 24 weeks Show forest plot | 1 | 118 | Mean Difference (IV, Fixed, 95% CI) | 3.0 [‐0.61, 6.61] |
|
| 8.1 Gonadotrophins | 1 | 118 | Mean Difference (IV, Fixed, 95% CI) | 3.0 [‐0.61, 6.61] |
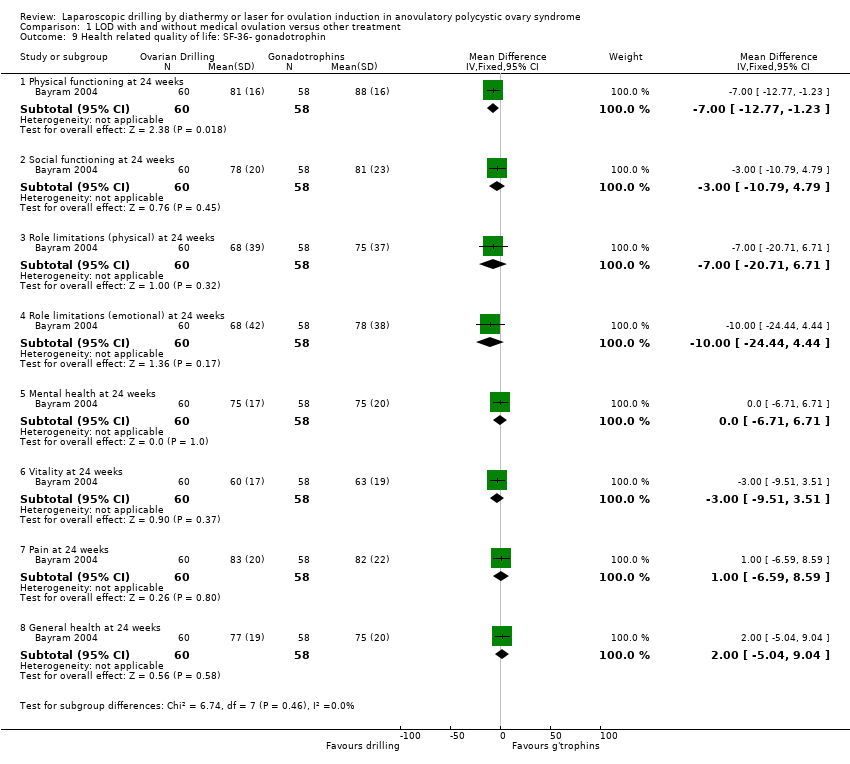
| 9 Health related quality of life: SF‐36‐ gonadotrophin Show forest plot | 1 | | Mean Difference (IV, Fixed, 95% CI) | Subtotals only |
|
| 9.1 Physical functioning at 24 weeks | 1 | 118 | Mean Difference (IV, Fixed, 95% CI) | ‐7.0 [‐12.77, ‐1.23] |
| 9.2 Social functioning at 24 weeks | 1 | 118 | Mean Difference (IV, Fixed, 95% CI) | ‐3.0 [‐10.79, 4.79] |
| 9.3 Role limitations (physical) at 24 weeks | 1 | 118 | Mean Difference (IV, Fixed, 95% CI) | ‐7.0 [‐20.71, 6.71] |
| 9.4 Role limitations (emotional) at 24 weeks | 1 | 118 | Mean Difference (IV, Fixed, 95% CI) | ‐10.0 [‐24.44, 4.44] |
| 9.5 Mental health at 24 weeks | 1 | 118 | Mean Difference (IV, Fixed, 95% CI) | 0.0 [‐6.71, 6.71] |
| 9.6 Vitality at 24 weeks | 1 | 118 | Mean Difference (IV, Fixed, 95% CI) | ‐3.0 [‐9.51, 3.51] |
| 9.7 Pain at 24 weeks | 1 | 118 | Mean Difference (IV, Fixed, 95% CI) | 1.0 [‐6.59, 8.59] |
| 9.8 General health at 24 weeks | 1 | 118 | Mean Difference (IV, Fixed, 95% CI) | 2.0 [‐5.04, 9.04] |
| 10 Depression scales (CES‐D) at 24 weeks gonadotrophin Show forest plot | 1 | 118 | Mean Difference (IV, Fixed, 95% CI) | 3.0 [‐0.61, 6.61] |
|
| 11 Rotterdam Symptom Checklist at 24 weeks‐ gonadotrophin Show forest plot | 1 | 472 | Mean Difference (IV, Fixed, 95% CI) | 3.18 [0.63, 5.74] |
|
| 11.1 Physical symptoms | 1 | 118 | Mean Difference (IV, Fixed, 95% CI) | 5.0 [‐0.96, 10.96] |
| 11.2 Psychological distress | 1 | 118 | Mean Difference (IV, Fixed, 95% CI) | 6.0 [‐1.05, 13.05] |
| 11.3 Activity level | 1 | 118 | Mean Difference (IV, Fixed, 95% CI) | 1.0 [‐2.44, 4.44] |
| 11.4 Overall quality of life | 1 | 118 | Mean Difference (IV, Fixed, 95% CI) | 7.00 [‐0.04, 14.04] |