Sacarosa para la analgesia de recién nacidos sometidos a procedimientos dolorosos
Referencias
References to studies included in this review
References to studies excluded from this review
References to studies awaiting assessment
References to ongoing studies
Additional references
References to other published versions of this review
Characteristics of studies
Characteristics of included studies [ordered by study ID]
| Methods | Double‐blind, RCT Painful intervention: venipuncture Study location: Department of Pediatrics, University Hospital, La Laguna, Tenerife, Spain Study period: not stated | |
| Participants | 28 (29 to 36 weeks' GA) healthy infants, PNA age 1 to 26 days | |
| Interventions | 2 mL 12% sucrose via syringe (n = 8) 2 min prior to venipuncture | |
| Outcomes | Oxygen saturation, respiratory rate, HR (just before and just after administering the solution and 5 min after venipuncture), time spent in audible crying for 3 min following venipuncture | |
| Notes | 1‐way and 2‐way ANOVA used to evaluate outcomes Data for oxygen saturation, respiratory rate and HR were reported at 5 min after venipuncture and were not included in meta‐analyses | |
| Risk of bias | ||
| Bias | Authors' judgement | Support for judgement |
| Random sequence generation (selection bias) | Low risk | Randomization was performed in advance using numbers taken from a randomisation table |
| Allocation concealment (selection bias) | Unclear risk | Allocation concealment not described |
| Blinding (performance bias and detection bias) | Low risk | Interventions blinded |
| Blinding of outcome assessment (detection bias) | Low risk | Outcomes were assessed blinded to interventions |
| Incomplete outcome data (attrition bias) | Low risk | Outcomes reported for all randomised infants |
| Selective reporting (reporting bias) | Unclear risk | The study protocol was not available to us so we could not judge whether there were any deviations from it |
| Other bias | Low risk | Appears free of other bias |
| Methods | RCT Painful intervention: heel lance Study location: Baskent University Hospital, Ankara, Turkey Study period: not stated | |
| Participants | 42 term newborns undergoing heel lance between postnatal days 3 and 8 as part of routine neonatal inpatient screening for phenylketonuria and hypothyroidism | |
| Interventions | 0.5 mL 24% sucrose solution given orally via syringe 2 min before heel lancing Laser acupuncture – 0.3 J energy applied to the Yintang point using a Laser PREMIO‐30 unit for 30 s | |
| Outcomes | NIPS, cry duration (s) | |
| Notes | ||
| Risk of bias | ||
| Bias | Authors' judgement | Support for judgement |
| Random sequence generation (selection bias) | Unclear risk | No information provided |
| Allocation concealment (selection bias) | High risk | Blank envelope containing a card indicated 1 of 2 groups. Not stated whether the envelopes were opaque, sealed and sequentially numbered |
| Blinding (performance bias and detection bias) | High risk | The nurse was blinded to group allocation before the envelope was opened, but not afterwards |
| Blinding of outcome assessment (detection bias) | Low risk | Assessments were made from video tapes (NIPS and cry duration) |
| Incomplete outcome data (attrition bias) | Low risk | Outcomes reported for all infants enrolled |
| Selective reporting (reporting bias) | Unclear risk | The study protocol was not available to us so we could not judge whether there were any deviations from it |
| Other bias | Low risk | Appears free of other bias |
| Methods | Double‐blind, randomized, controlled, cross‐over trial Painful intervention: venipuncture Study location: NICU at Leicester Royal Infirmary, UK Study period: not stated. | |
| Participants | 39 healthy preterm neonates (mean 30.5 (SD 2.3) weeks' GA), mean PNA 27.2 (SD 24.4) days | |
| Interventions | 2 mL 25% (0.5 g) sucrose (n = 39) via syringe over 2 min into infant's mouth before 2 routine venipunctures | |
| Outcomes | Rise in HR, oxygen saturation, duration of first cry, total duration of crying, NFCS at the 3 phases of the venipuncture | |
| Notes | Data were reported using means, SDs over the 3 phases of the venipuncture. Data could not be abstracted for the 2 groups prior to cross‐over. Adverse effects were evaluated | |
| Risk of bias | ||
| Bias | Authors' judgement | Support for judgement |
| Random sequence generation (selection bias) | Low risk | Selected from random number table by a hospital pharmacist |
| Allocation concealment (selection bias) | Low risk | Allocation controlled by a hospital pharmacist |
| Blinding (performance bias and detection bias) | Low risk | Interventions blinded |
| Blinding of outcome assessment (detection bias) | Low risk | Outcome assessments were done blinded to intervention group |
| Incomplete outcome data (attrition bias) | Unclear risk | Inconsistent number of infants reported in Methods section (n = 39) versus discussion section (n = 28) |
| Selective reporting (reporting bias) | Unclear risk | The study protocol was not available to us so we could not judge whether there were any deviations from it |
| Other bias | Low risk | Appears free of other bias |
| Methods | RCT Painful intervention: circumcision Study location: Day Care Surgery Department of Maternity and Children Hospital, Dammam City, Kingdom of Saudi Arabia Study period: January 2011 and April 2011 | |
| Participants | 90 full‐term newborn males who underwent circumcision GA of 38 weeks or beyond, 5 min Apgar score of 8 or higher, PNA of 12 h or older and birthweight > 2500 g, and to be free from jaundice, anomalies of the penis, and analgesia or sedation in the previous 48 h | |
| Interventions | 2 mL oral sucrose (24% w/v) given through a dropper onto the tongue 2 min before the procedure (n = 30) EMLA cream: applied to the shaft of the penis with an occlusive dressing 1 h before the procedure (n = 30) Combination of EMLA cream + oral sucrose (n = 30): 1 g EMLA cream applied to the shaft of the penis with an occlusive dressing 1 h before the procedure + 2 mL oral sucrose (24% w/v) given through a dropper onto the tongue 2 min before the procedure | |
| Outcomes | N‐PASS used to assess the severity of pain and neonatal response to pain, 5 min before, during and 5 min after the circumcision for all newborns. The scale measures both physiologic responses (HR, respiratory rate, blood pressure and oxygen saturation) and behavioural responses (crying irritability, behaviour state, facial expression and extremities tone) to pain | |
| Notes | ||
| Risk of bias | ||
| Bias | Authors' judgement | Support for judgement |
| Random sequence generation (selection bias) | Unclear risk | No information provided |
| Allocation concealment (selection bias) | Low risk | The sample was divided randomly into 3 groups. The envelope was opened to classify the neonate randomly to 1 of the groups in order to carry out the appropriate action |
| Blinding (performance bias and detection bias) | High risk | Staff were not blinded |
| Blinding of outcome assessment (detection bias) | High risk | Video imaging of the neonate 5 min before, during and until 10 min after the procedure showed the newborn reaction to pain and recorded the duration of crying. The videotapes were reviewed by an individual who was unaware of the infant’s treatment group, however, since the sucrose was applied 2 min before the procedure, it was probably possible to tell from the tapes which babies received sucrose |
| Incomplete outcome data (attrition bias) | Low risk | Outcome data reported for all 90 infants |
| Selective reporting (reporting bias) | Unclear risk | The study protocol was not available to us so we could not judge whether there were any deviations from it |
| Other bias | Low risk | Appears free of other bias |
| Methods | RCT Painful intervention: immunization injection Study location: a university hospital ambulatory paediatric clinic, Omaha, USA Study period: not stated | |
| Participants | 285 infants aged between 2 weeks and 18 months; 50 included in this review (only neonates at 2 weeks of age) | |
| Interventions | 2 mL 12% sucrose (n = 16) 2 mL sterile water (n = 15) No treatment (n = 19) | |
| Outcomes | Mean cry duration and percentage time crying during and 3 min after subcutaneous injection | |
| Notes | Data for percentage time crying were presented in graphical form only | |
| Risk of bias | ||
| Bias | Authors' judgement | Support for judgement |
| Random sequence generation (selection bias) | Unclear risk | Sequence generation not described |
| Allocation concealment (selection bias) | Low risk | Solutions in coded syringes prepared by pharmacist |
| Blinding (performance bias and detection bias) | Low risk | Low risk for sucrose and water; high risk for no intervention group |
| Blinding of outcome assessment (detection bias) | Low risk | Low risk for blinding of outcome assessments |
| Incomplete outcome data (attrition bias) | Unclear risk | 285 infants recruited from a continuous sample. Unsure of the number included in the analysis |
| Selective reporting (reporting bias) | Unclear risk | The study protocol was not available to us so we could not judge whether there were any deviations from it |
| Other bias | Low risk | Appears free of other bias |
| Methods | Double‐blind placebo‐controlled study Painful intervention: heel lance Study location: Marmara University Hospital, Istanbul, Turkey Study period: not stated | |
| Participants | 75 full‐term infants undergoing heel lance | |
| Interventions | 3 mL hind milk (n = 25) 3 mL 12.5% sucrose solution (n = 25) 3 mL distilled water (n = 25) | |
| Outcomes | NFCS, crying time, duration of crying, HR. Results reported as medians and IQRs | |
| Notes | ||
| Risk of bias | ||
| Bias | Authors' judgement | Support for judgement |
| Random sequence generation (selection bias) | Unclear risk | No information provided |
| Allocation concealment (selection bias) | High risk | Sealed envelopes were used, however, there was no information regarding whether envelopes were opaque and sequentially numbered |
| Blinding (performance bias and detection bias) | Low risk | The test solution was prepared in a covered syringe |
| Blinding of outcome assessment (detection bias) | Low risk | The researchers were blind to the groups and utilized only the video recordings for scoring |
| Incomplete outcome data (attrition bias) | Unclear risk | Sample sizes were not provided in Tables 2 and 3. We assumed the numbers from Table 1. Demographic features of the study groups were correct with 25 infants in each group |
| Selective reporting (reporting bias) | Unclear risk | The study protocol was not available to us so we could not judge whether there were any deviations from it |
| Other bias | Low risk | Appears free of other bias |
| Methods | Randomized, double‐blind, controlled trial Painful intervention: heel lance Study location: Loma Linda University Children’s Hospital NICU, Loma Linda, California, USA Study period: July 2009 to February 2012 | |
| Participants | 131 preterm infants ≤ 36.5 weeks’ PMA who weighed ≥ 800 g, had a central catheter in place, and required a heel lance | |
| Interventions | Sucrose 24% with a pacifier (n = 44): 2 mL for neonates > 2 kg; 1.5 mL for neonates 1.5 kg‐2 kg; and 0.5 mL for neonates < 1.5 kg Placebo with pacifier (n = 45) 42 infants received no heel lance no sucrose or placebo | |
| Outcomes | PIPP after 2 min, plasma hypoxanthine, uric acid, xanthine, allantoin HR, oxygen saturation. We received unpublished data for means and SDs from Dr Angeles | |
| Notes | ||
| Risk of bias | ||
| Bias | Authors' judgement | Support for judgement |
| Random sequence generation (selection bias) | Low risk | Randomization was performed by a research pharmacist, who used a permuted block randomization table generated by the study statistician |
| Allocation concealment (selection bias) | Low risk | The study drug was prepared immediately before the experimental procedure by the research pharmacist and labelled as 'study drug' to ensure blinding |
| Blinding (performance bias and detection bias) | Low risk | Neonates randomized to the sucrose group received a single dose of 24% sucrose in the following volumes: 2 mL for neonates >2 kg, 1.5 mL for neonates 1.5‐2 kg, and 0.5 mL for neonates that were <1.5 kg. Neonates randomized to the placebo group received an equal volume of sterile water to the anterior portion of the tongue along with a pacifier |
| Blinding of outcome assessment (detection bias) | Low risk | The neonate’s face was videotaped by trained research staff to record facial action at 0 min, during the heel lance and up to 30 s post heel lance |
| Incomplete outcome data (attrition bias) | Low risk | Data reported on all randomized infants |
| Selective reporting (reporting bias) | Unclear risk | The study protocol was not available to us so we could not judge whether there were any deviations from it |
| Other bias | Low risk | Appears free of other bias |
| Methods | RCT Painful intervention: each potentially painful procedure for a period of 7 days after enrolment Study location: a tertiary–level teaching hospital in North India Study period: April 2010 to April 2011 | |
| Participants | 106 newborns, between completed 32 weeks and 37 weeks PMA were randomized to 2 groups sucrose (n = 53) and water (n = 53). 93 infants were available for analysis (47 in the sucrose group and 46 in the water group) | |
| Interventions | Sterile solution 24% sucrose (0.5 mL in 1mL syringe) for every potentially painful procedure during the first 7 days after enrolment Double‐distilled water (0.5 mL in 1mL syringe) for every potentially painful procedure during the first 7 days after enrolment | |
| Outcomes | Primary outcome: score of motor development and vigor (MDV) and alertness and orientation (AO) domains of NAPI scale performed at 40 weeks PMA In addition, the highest HR and lowest SpO2 obtained during the procedure were recorded until 30 s after the painful stimulus, for newborns in both groups (not reported) | |
| Notes | We wrote to the authors and Dr Banga provided us with this information: The potentially painful procedures included: venipuncture, heel lance, peripheral venous catheterization, OG or NG tube insertion, intramuscular injection, suprapubic bladder tap, retinopathy of prematurity examination, removal of adhesive tapes | |
| Risk of bias | ||
| Bias | Authors' judgement | Support for judgement |
| Random sequence generation (selection bias) | Low risk | Block randomization using computer‐generated random sequences was used with a static block size of 6 each |
| Allocation concealment (selection bias) | Low risk | Allocation sequence was generated and maintained confidentially by the co‐investigator from department of Pharmacology. At the time of enrolment, the group allocation was telephonically conveyed to the research candidate, to ensure allocation concealment |
| Blinding (performance bias and detection bias) | Low risk | Identical‐looking packets carrying sucrose and the double‐distilled water, prepared and serially labelled according to confidential randomization code by pharmacy, were available at neonatal units. The primary care team members were responsible for administrating the intervention/control to the enrolled newborn according to the allocated serially numbered packet, unaware of the randomization |
| Blinding of outcome assessment (detection bias) | Low risk | The participants, the research candidate, and the primary care team members assessing the painful response were blinded to the group assignment |
| Incomplete outcome data (attrition bias) | Low risk | 3 infants lost to follow‐up in the sucrose group, intervention discontinued in 1 and 2 died. 5 infants lost to follow1up in the water group and 2 died |
| Selective reporting (reporting bias) | Unclear risk | The study protocol was not available to us so we could not judge whether there were any deviations from it |
| Other bias | Low risk | Appears free of other bias |
| Methods | RCT Painful intervention: venipuncture Study location: Neonatal ward of Tribhuvan University Teaching Hospital, Kathmandu, Nepal Study period: February to August 2006 | |
| Participants | 50 term infants aged between 12 h to 8 days Mean post‐natal age: 59.92 h no treatment group; 68.76 h sucrose group | |
| Interventions | No treatment group (n = 25) Sucrose group (n = 25): received 2 ml of 30% sucrose orally 2 minutes before venipuncture | |
| Outcomes | DAN score, duration of cry, number of infants crying | |
| Notes | Data for DAN scores were reported as median and IQRs. Duration of cry was reported as mean and SD and was included in meta‐analyses | |
| Risk of bias | ||
| Bias | Authors' judgement | Support for judgement |
| Random sequence generation (selection bias) | Low risk | Used random numbers from 1 to 50 developed from a random number table |
| Allocation concealment (selection bias) | High risk | Authors did not report whether the opaque, sealed envelopes used to allocate participants were sequentially numbered |
| Blinding (performance bias and detection bias) | Low risk | Personnel blinded |
| Blinding of outcome assessment (detection bias) | Low risk | Outcome assessors blinded |
| Incomplete outcome data (attrition bias) | Low risk | Outcome reported for all randomized infants |
| Selective reporting (reporting bias) | Unclear risk | One rating scale (DAN) listed in methods section and is reported in results table. The study protocol was not available to us so we could not judge whether there were any deviations from it |
| Other bias | Low risk | Appears free of other bias |
| Methods | RCT Painful intervention: venipuncture Study location: NICUs at Hôpital Armand Trousseau, Paris, France and Centre Hospitalier de Meaux, Meaux, France Study period: July to September 2007 | |
| Participants | 76 preterm infants, mean (SD) PMA: sucrose group (n = 37): 32.6 (2.33) weeks; sucrose + EMLA group: (n = 39): 32.3 (2.01) weeks | |
| Interventions | Sucrose group: 0.5 mL 30% sucrose solution orally and placebo cream Sucrose + EMLA group: 0.5 mL 30% sucrose solution orally and EMLA cream on the skin | |
| Outcomes | DAN scale, PIPP score | |
| Notes | Discussed adverse effects observed | |
| Risk of bias | ||
| Bias | Authors' judgement | Support for judgement |
| Random sequence generation (selection bias) | Low risk | Randomization done in advance in blocks of 8 using a random number table |
| Allocation concealment (selection bias) | Low risk | Used opaque, sealed and sequentially numbered envelopes |
| Blinding (performance bias and detection bias) | Low risk | Participants and personnel blinded |
| Blinding of outcome assessment (detection bias) | Low risk | Outcome assessors blinded |
| Incomplete outcome data (attrition bias) | Low risk | Outcomes not reported for 4 infants because of problems with video recording |
| Selective reporting (reporting bias) | Unclear risk | The study protocol was not available to us so we could not judge whether there were any deviations from it |
| Other bias | Low risk | Appears free of other bias |
| Methods | RCT Painful intervention: heel lance Study location: Tompkins Community Hospital, Ithaca, New York, USA Study period: not stated | |
| Participants | 72 newborn infants (PNA 22 h to 40 h) | |
| Interventions | 2 mL 12% sucrose (n = 8) Solutions were given via syringe over a 2‐min period | |
| Outcomes | Crying time (percentage of procedure time spent crying, percentage of time spent crying during 3‐min recovery period, number of infants that cried 20% or more during each recovery minute) | |
| Notes | Sucrose vs. water, Similac vs. water and RSF vs. water were compared using Mann‐Whitney U test. Most results were presented in graph form and means were reported in the text and could not be combined in meta‐analyses | |
| Risk of bias | ||
| Bias | Authors' judgement | Support for judgement |
| Random sequence generation (selection bias) | Unclear risk | Sequence generation not described |
| Allocation concealment (selection bias) | Unclear risk | Similac group could not be concealed because appearance differed from other intervention solutions |
| Blinding (performance bias and detection bias) | Low risk | Sucrose and water solutions blinded However, Similac group was high risk as its appearance differed from sucrose or water |
| Blinding of outcome assessment (detection bias) | Unclear risk | Sucrose and water solutions blinded. However, Similac group was high risk as its appearance differed from sucrose or water |
| Incomplete outcome data (attrition bias) | Low risk | Outcomes reported for all randomized infants |
| Selective reporting (reporting bias) | Unclear risk | The study protocol was not available to us so we could not judge whether there were any deviations from it |
| Other bias | Unclear risk | Several test solutions were gifts from Ross Laboratories |
| Methods | RCT Painful intervention: heel lance Study location: Boston Medical Center, Boston, MA, USA Study period: not stated. | |
| Participants | 40 term newborn infants, 34 h to 55 h old | |
| Interventions | All interventions given for 2 min prior to heel lance: 2 mL 12% sucrose over 2 min via syringe (n = 10) | |
| Outcomes | Percentage of time spent crying during 3 min after heel lance, percentage of time spent grimacing, change in mean HR | |
| Notes | Data were reported in graph forms only | |
| Risk of bias | ||
| Bias | Authors' judgement | Support for judgement |
| Random sequence generation (selection bias) | Unclear risk | Sequence generation not described |
| Allocation concealment (selection bias) | Unclear risk | Allocation concealment not described |
| Blinding (performance bias and detection bias) | Low risk | Sucrose and water alone groups blinded; pacifier + water, and pacifier + sucrose groups were blinded (although assessors could see pacifiers, they did not know which solution was being tested) |
| Blinding of outcome assessment (detection bias) | Low risk | Sucrose and water alone groups blinded; pacifier + water, and pacifier + sucrose groups were blinded (although assessors could see pacifiers, they did not know which solution was being tested) |
| Incomplete outcome data (attrition bias) | Low risk | Results reported for all randomized infants |
| Selective reporting (reporting bias) | Unclear risk | The study protocol was not available to us so we could not judge whether there were any deviations from it |
| Other bias | Low risk | Appears free of other bias |
| Methods | RCT Painful intervention: screening for ROP Study location: Neonatal Unit, Royal Infirmary of Edinburgh, Edinburgh, Scotland, UK and Neonatal Unit, Birmingham Heartlands Hospital, Birmingham, UK Study period: not stated | |
| Participants | 40 preterm infants < 32 weeks' PMA Sterile water group: mean PMA 27 weeks; mean PNA 45 days | |
| Interventions | 2 min before start of eye examination: | |
| Outcomes | PIPP during eye examination | |
| Notes | Data were presented in graph form and reported as means and SDs Adverse events were not evaluated | |
| Risk of bias | ||
| Bias | Authors' judgement | Support for judgement |
| Random sequence generation (selection bias) | Unclear risk | Sequence generation not described |
| Allocation concealment (selection bias) | High risk | Sealed opaque envelopes. Did not state if the envelopes were sealed and sequentially numbered |
| Blinding (performance bias and detection bias) | Low risk | Sucrose and water alone groups blinded; pacifier + water, and pacifier + sucrose groups were blinded |
| Blinding of outcome assessment (detection bias) | Low risk | Sucrose and water alone groups blinded; pacifier + water, and pacifier + sucrose groups were blinded |
| Incomplete outcome data (attrition bias) | Low risk | Outcomes reported for all randomized infants |
| Selective reporting (reporting bias) | Unclear risk | The study protocol was not available to us so we could not judge whether there were any deviations from it |
| Other bias | Low risk | Appears free of other bias |
| Methods | Randomized, double‐blind, placebo‐controlled, cross‐over trial Painful intervention: heel lance Study location: Neonatal Clinic, Department of Obstetrics and Gynaecology, University Hospital, Zurich, Switzerland Study period: not stated | |
| Participants | 16 preterm infants (27 to 34 weeks' PMA), PNA approximately 42 days | |
| Interventions | 2 mL 50% sucrose via syringe 2 min before heel lance Each infant was assessed twice receiving2ml of sucrose 50%or 2 ml of distilled water in random order immediately before heel lance | |
| Outcomes | Increase in HR (beats/min); recovery time for HR (s); recovery time for respirations (s); crying (percentage of total intervention); recovery time until crying stopped (s); oxygen saturation (maximum increase in kPa; maximum decrease in kPa; and difference between baseline and 10 min after end of intervention in kPa), and cerebral blood volume | |
| Notes | Results were presented in graph form without mean values and SDs, in tables with medians with IQRs, or both. Used Wilcoxon signed rank test. Data for sucrose and placebo groups prior to cross‐over were not presented | |
| Risk of bias | ||
| Bias | Authors' judgement | Support for judgement |
| Random sequence generation (selection bias) | Low risk | Sequence generated from random number table |
| Allocation concealment (selection bias) | Low risk | Vials containing solutions were coded and contents could not be identified |
| Blinding (performance bias and detection bias) | Low risk | Sucrose and water solutions blinded |
| Blinding of outcome assessment (detection bias) | Low risk | Sucrose and water solutions blinded |
| Incomplete outcome data (attrition bias) | Low risk | Outcome reported for all randomized infants |
| Selective reporting (reporting bias) | Unclear risk | The study protocol was not available to us so we could not judge whether there were any deviations from it |
| Other bias | Low risk | Appears free of other bias |
| Methods | RCT Painful intervention: venipuncture Study location: maternity ward, Poissy Hospital, Poissy, France Study period: April to end of June 1997 | |
| Participants | 150 term newborn infants, 3 to 4 days old | |
| Interventions | 2 min prior to venipuncture the allocated solution was adminstered for 30 seconds by a sterile syringe into the infant's mouth No treatment (n = 25) | |
| Outcomes | DAN scale during venipuncture, reported as median and IQR | |
| Notes | Mann‐Whitney U test used to evaluate pain scores | |
| Risk of bias | ||
| Bias | Authors' judgement | Support for judgement |
| Random sequence generation (selection bias) | Low risk | Sequence generated by random number table |
| Allocation concealment (selection bias) | Low risk | Allocated by sequentially numbered, opaque and sealed envelopes |
| Blinding (performance bias and detection bias) | High risk | Low risk for sucrose and water solutions High risk for pacifier groups |
| Blinding of outcome assessment (detection bias) | High risk | Low risk for sucrose and water solutions High risk for pacifier groups |
| Incomplete outcome data (attrition bias) | Low risk | No withdrawals |
| Selective reporting (reporting bias) | Unclear risk | The study protocol was not available to us so we could not judge whether there were any deviations from it |
| Other bias | Low risk | Appears free of other bias |
| Methods | RCT Painful intervention: repeated heel lances Study location: 3 NICUs in Switzerland Study period: 12 January to 31 December 2009 | |
| Participants | 71 preterm infants between 24 and 32 weeks PMA | |
| Interventions | Sucrose group (n = 24): sucrose 20% (0.2 mL/kg), administered orally ∼2 min before the heel lance. If the infant seemed to be in pain during the heel lance phase, up to 2 additional doses of sucrose were administered and noted in the study chart Sucrose + facilitated tucking (FT) (n = 23): combination of sucrose and facilitated tucking; the FT was started at the beginning of the baseline phase and sucrose was given 2 min before the heel lance FT (n = 24): FT was started at the beginning of the baseline phase, and the infant was 'tucked' through all 3 phases | |
| Outcomes | BPSN: data collection occurred: at baseline (before any manipulation); at heel lance (skin preparation, heel stick, and haemostasis after blood was drawn); and during recovery (3 min after the heel lance) The BPSN contains 9 items: 3 are physiological (HR, respiratory rate, and oxygen saturation) and 6 are behavioural (grimacing, body movements, crying, skin colour, sleeping patterns, consolation) | |
| Notes | ||
| Risk of bias | ||
| Bias | Authors' judgement | Support for judgement |
| Random sequence generation (selection bias) | Low risk | Block randomization by using SPSS, version 16 |
| Allocation concealment (selection bias) | Low risk | For each site, group assignments were sealed in opaque, consecutively numbered envelopes |
| Blinding (performance bias and detection bias) | High risk | When parents consented to participation, the envelope was opened by a study nurse |
| Blinding of outcome assessment (detection bias) | High risk | The intervention was not blinded |
| Incomplete outcome data (attrition bias) | Low risk | Outcomes reported for all 71 randomized infants |
| Selective reporting (reporting bias) | Low risk | The trial was registered as: NCT00758511 In the registry it said that 25% sucrose would be used. In the paper it said that 20% sucrose was used. We did not see any other deviations from the protocol |
| Other bias | Low risk | Appears free of other bias |
| Methods | RCT Painful intervention: heel lance Study location: Neonatal Unit of Agnelli Hospital, Pinerolo, Turin, Italy Study period: January to April 2007 | |
| Participants | 51 term infants: mean PMA 39.3 weeks (SD 1.2) in breastfeeding group; 50 term infants: mean PMA 39.4 weeks (SD 1.1) in sucrose group | |
| Interventions | 1 mL 25% sucrose (n = 50) Breastfeeding (n = 51) | |
| Outcomes | PIPP during blood sampling, 2 min after heel lance, HR increase from baseline at 30 s following commencement of procedure, oxygen saturation decrease, duration of first cry, percentage crying time in first 2 min and during blood sampling Data reported as median and full range | |
| Notes | ||
| Risk of bias | ||
| Bias | Authors' judgement | Support for judgement |
| Random sequence generation (selection bias) | Low risk | Computer‐generated sequence created by statistician and masked to investigators |
| Allocation concealment (selection bias) | Low risk | Sequentially numbered opaque sealed envelopes |
| Blinding (performance bias and detection bias) | High risk | Breastfeeding could not be blinded. Nurses and parents not blinded to assignment |
| Blinding of outcome assessment (detection bias) | Low risk | Only assistants listening to voice recordings of cry for PIPP scoring were blind to intervention. High risk for PIPP‐R outcomes |
| Incomplete outcome data (attrition bias) | Low risk | Outcomes reported on all randomized infants |
| Selective reporting (reporting bias) | Unclear risk | The study protocol was not available to us so we could not judge whether there were any deviations from it |
| Other bias | Low risk | Appears free of other bias |
| Methods | RCT Painful intervention: screening for ROP Study location: Dr Sami Ulus Maternity and Children Training and Research Hospital, Ankara, Turkey Study period: July 2011 to June 2012 | |
| Participants | 64 infants undergoing eye examination for ROP. The groups had similar PMA (28.5 ± 2.8 weeks), mean birthweight (1304 ± 466 g) or corrected PMA (35.4 ± 3.7 weeks) at examination | |
| Interventions | All infants received topical anaesthetic (proxymetacaine, Alcaine) drop 0.5%: ALCON CANADA Inc, Mississauga, Canada) applied 30 s before the eye examination. In addition: Sucrose group (n= 32): received 0.5 mL/kg 24% sucrose with a pacifier Control group (n = 32): received 0.5 mL/kg sterile water with a pacifier | |
| Outcomes | Mean PIPP score during examination Secondary outcome measurements were frequency of tachycardia (> 180 beats/min), bradycardia (< 100 beats/min), desaturations (< 85% for > 10 s) and crying time | |
| Notes | ||
| Risk of bias | ||
| Bias | Authors' judgement | Support for judgement |
| Random sequence generation (selection bias) | Unclear risk | No information provided |
| Allocation concealment (selection bias) | Low risk | Syringes of either 24% sucrose (A) or sterile water (B) were provided by the pharmacy in sealed envelopes. Both of the solutions were colourless |
| Blinding (performance bias and detection bias) | Low risk | The parents, the nurse, the ophthalmologist and investigators were blinded to the group assignment |
| Blinding of outcome assessment (detection bias) | Low risk | All the infants were video‐recorded until completion of the eye examination. Primary outcome measurement was PIPP score which was performed by the same investigator who had web‐based training |
| Incomplete outcome data (attrition bias) | Low risk | Outcomes reported for all 64 infants |
| Selective reporting (reporting bias) | Low risk | Clinical Trials.gov Identifier: NCT01811979. There did not seem to be any deviations from the protocol |
| Other bias | Low risk | Appears free of other bias |
| Methods | Cross‐over RCT Painful intervention: venipuncture Study location: NICU at King Faisal Specialist Hospital, Jeddah, Saudi Arabia Study period: January 2005 to May 2007 | |
| Participants | 36 infants: median (range): 32 weeks' PMA (27 to 46), mean (SD) GA: 32.4 (2.0) ‐ 2 different mean PMAs reported in the article | |
| Interventions | 0.5 mL sterile water with pacifier 0.5 mL sterile water without pacifier 0.5 mL 24% sucrose with pacifier 0.5 mL 24% sucrose without pacifier Pacifier alone Control group (the authors do not state what this grooup received ‐ we assume no intervention) | |
| Outcomes | Duration of cry, PIPP, HR, respiratory rate, glucose check | |
| Notes | All infants received all of the 6 interventions and so we could not use the results in meta‐analyses | |
| Risk of bias | ||
| Bias | Authors' judgement | Support for judgement |
| Random sequence generation (selection bias) | Low risk | A paper was randomly picked so that assignments were random and double‐blinded for the sucrose and water solutions |
| Allocation concealment (selection bias) | High risk | Consecutively numbered envelopes, but report did not specify whether they were opaque or sealed |
| Blinding (performance bias and detection bias) | Low risk | Personnel were blinded to sucrose and water solutions |
| Blinding of outcome assessment (detection bias) | Low risk | Outcome assessors were blinded |
| Incomplete outcome data (attrition bias) | Low risk | Outcomes reported for randomized infants |
| Selective reporting (reporting bias) | Unclear risk | The study protocol was not available to us so we could not judge whether there were any deviations from it |
| Other bias | Low risk | Appears free of other bias |
| Methods | Randomized, double‐blind, placebo‐controlled, cross‐over study Painful intervention: screening for ROP Study location: Department of Neonatology, Women’s Hospital, Greensboro, North Carolina, USA Study period: January 2003 to June 2004 | |
| Participants | 23 preterm infants mean PMA 26.4 weeks (range 24 to 29), PNA 28 to 93 days | |
| Interventions | Mydriatic eye drops (phenylephrine HCl 1%, cyclopentolate HCl 0.2%) and local anaesthetic eye drops (proxymetacaine HCl 0.5%: 2 drops) were given to both groups prior to examination. In addition infants received: Sucrose group: 2 mL 24% sucrose via syringe (n = 23) Water group: 2 mL sterile water via syringe (n = 23) | |
| Outcomes | PIPP score at 5 min and 1 min pre‐examination, PIPP score at eye speculum insertion, PIPP score 1 min and 5 min post examination | |
| Notes | Results were reported as means and SDs after cross‐over. Results for the 2 groups prior to cross‐over were not available Adverse events reported, but no adverse events experienced | |
| Risk of bias | ||
| Bias | Authors' judgement | Support for judgement |
| Random sequence generation (selection bias) | Low risk | Treatment allocation was made in groups of 6 based on the results from a dice roll |
| Allocation concealment (selection bias) | Low risk | Allocation centrally controlled by pharmacist |
| Blinding (performance bias and detection bias) | Low risk | Sucrose and water solutions blinded |
| Blinding of outcome assessment (detection bias) | Low risk | Blinding of outcome assessments |
| Incomplete outcome data (attrition bias) | Unclear risk | Reported to have 23 neonates in study but only 22 neonates included in demographic information and PIPP Scores in Table 1 of the paper |
| Selective reporting (reporting bias) | Unclear risk | The study protocol was not available to us so we could not judge whether there were any deviations from it |
| Other bias | Low risk | Stopped at 23 neonates due to change in ophthalmologist in order to maintain consistency in examinations; however, statistical power calculated determined that 24 neonates were needed for the study. This does not seem to have affected the results |
| Methods | Randomized, double‐blind, controlled trial Painful intervention: venipuncture, arterial puncture, heel lance, intravenous cannulation, endotracheal tube introduction, endotracheal tube suctioning, gavage insertion for feeding, removal of electrode leads and tape Study location: NICU of the Hospital of Clinics, School of Medicine, University of São Paulo at Ribeirão Preto, Preto, Brasil Study period: April 2003 and September 2005 | |
| Participants | 33 preterm infants, median PMA 30 weeks | |
| Interventions | On day 1, no treatment was given to any neonate in order to collect baseline data. On days 2 to 4 solutions (sucrose or water) were administered to neonates before every painful procedure (listed above): 0.5 mL/kg 25% sucrose before every minor painful procedure listed above (n = 17) 0.5 mL/kg sterile water before every minor painful procedure listed above (n = 16) | |
| Outcomes | Incidence of cry (percentage of neonates crying), HR (percentage of neonates with HR ≥ 160 beats/min), NFCS (percentage of neonates with score ≥ 3), Activated Behavioural State (percentage of neonates with score ≥ 4) | |
| Notes | Pain was assessed over 4 days during morning blood collection (heel lance) The Mann‐Whitney U test was used to calculate the difference between sucrose and water groups for continuous variables. The Chi2 test was used to calculate the difference between sucrose and water groups for categorical variables No means or standard deviations were reported. NFCS results were reported in graph form only Adverse events were assessed | |
| Risk of bias | ||
| Bias | Authors' judgement | Support for judgement |
| Random sequence generation (selection bias) | Low risk | Computer‐generated randomization sequence |
| Allocation concealment (selection bias) | Low risk | Solutions prepared by pharmacist labelled 'A' or 'B' to keep identity from investigators. Co‐ordinator kept identities of solutions in sealed and opaque envelopes until after analysis |
| Blinding (performance bias and detection bias) | Low risk | Staff blinded to sucrose and water solutions |
| Blinding of outcome assessment (detection bias) | Low risk | Blinding of outcome assessments |
| Incomplete outcome data (attrition bias) | Low risk | 11/ 44 enrolled infants were discharged from the NICU while the data collection was in progress and 33 infants completed the study |
| Selective reporting (reporting bias) | Unclear risk | The study protocol was not available to us so we could not judge whether there were any deviations from it |
| Other bias | Low risk | Appears free of other bias |
| Methods | RCT Painful intervention: heel lance Study location: a University‐affiliated metropolitan Level III NICU, Toronto, Ontario, Canada Study period: 16‐month period during 1998‐1999 | |
| Participants | 190 preterm and term infants, mean PMA 33.7 weeks, under 7 days' PNA | |
| Interventions | 2 min prior to heel lance: Sucrose + NNS group (N = 64): 0.5 mL 24% sucrose via syringe to the anterior surface of the tongue followed by pacifier | |
| Outcomes | PIPP at 30 s and 60 s after heel lance | |
| Notes | 1‐way ANOVA to evaluate mean pain scores | |
| Risk of bias | ||
| Bias | Authors' judgement | Support for judgement |
| Random sequence generation (selection bias) | Low risk | Sequence generated using a centralized randomization table |
| Allocation concealment (selection bias) | Low risk | Centrally allocated by pharmacist. Pharmacist labelled all solutions as 'study drug' and delivered it to neonate's bedside |
| Blinding (performance bias and detection bias) | Low risk | Staff were blinded to sucrose and water solutions |
| Blinding of outcome assessment (detection bias) | Low risk | Facial coders were not informed about the purpose of the study, phases of the heel lance, or group allocation for the 2 pacifier groups |
| Incomplete outcome data (attrition bias) | Low risk | 12 neonates were lost to follow‐up due to equipment failure |
| Selective reporting (reporting bias) | Unclear risk | The study protocol was not available to us so we could not judge whether there were any deviations from it |
| Other bias | Low risk | Appears free of other biases |
| Methods | RCT, factorial design Painful intervention: heel lance Study location: Lakeshore General Hospital, Montreal, Quebec, Canada Study period: not stated | |
| Participants | 94 normally developing newborns, mean PMA 39.4 weeks on 2nd or 3rd day of life | |
| Interventions | No holding + sterile water given by pipette (n = 21) | |
| Outcomes | Percentage of time crying, pain concatenation scores for facial activity, mean HR, mean vagal tone index, measurements prior to intervention and at 1, 2, and 3 min after heel lance | |
| Notes | Factorial ANOVA to assess effects on behavioural and physiological measures | |
| Risk of bias | ||
| Bias | Authors' judgement | Support for judgement |
| Random sequence generation (selection bias) | Unclear risk | Sequence generation not described |
| Allocation concealment (selection bias) | Unclear risk | Allocation concealment not described |
| Blinding (performance bias and detection bias) | Low risk | Sucrose and water solutions blinded |
| Blinding of outcome assessment (detection bias) | Low risk | Facial coders were blind to solution assignment only but not to holding |
| Incomplete outcome data (attrition bias) | Low risk | Results reported for all infants who completed the study |
| Selective reporting (reporting bias) | Unclear risk | The study protocol was not available to us so we could not judge whether there were any deviations from it |
| Other bias | Low risk | Appears free of other bias |
| Methods | Prospective, randomized, blinded, placebo‐controlled study Painful intervention: screening for ROP Study location: NICUs at Conneticut Children's Medical Center and John Dempsey Hospital, USA Study period: not stated | |
| Participants | 32 preterm infants with birthweight < 1.5 kg or PMA < 28 weeks | |
| Interventions | Sterile water (n = 16) | |
| Outcomes | HR, respiratory rate and oxygen saturation at baseline, post mydriatic, post study drug, during eye examination, post eye examination PIPP at baseline, during eye examination, post eye examination Crying time during eye examination Blood pressure at baseline, post mydriatic, during eye examination and post eye examination | |
| Notes | Results were reported as means and standard deviations Adverse events were evaluated and included choking, and transient oxygen desaturation | |
| Risk of bias | ||
| Bias | Authors' judgement | Support for judgement |
| Random sequence generation (selection bias) | Unclear risk | Sequence generation not described |
| Allocation concealment (selection bias) | High risk | Pharmacy provided solutions in sealed envelopes after randomization, but did not specify whether envelopes were sequentially numbered and opaque |
| Blinding (performance bias and detection bias) | Low risk | Sucrose and water solutions blinded |
| Blinding of outcome assessment (detection bias) | Low risk | Although not explicitly stated, it can be inferred that nurses administering solutions and those assessing videotapes were blinded to assigned solution |
| Incomplete outcome data (attrition bias) | Low risk | Outcome reported for all randomized infants |
| Selective reporting (reporting bias) | Unclear risk | The study protocol was not available to us so we could not judge whether there were any deviations from it |
| Other bias | Low risk | Appears free of other bias |
| Methods | RCT Painful intervention: vaccination (hepatitis B) Study location: University of Chicago Medicalm Center, Chicago, Illinois, USA Study period: June to July 2007 | |
| Participants | 47 healthy full‐term infants undergoing vaccination | |
| Interventions | Sucrose group (n = 15): 1.0 mL 25% sucrose solution administered via syringe Warmth group (n = 14): 100% radiant warmth from Ohmeda warmer on the manual setting Pacifier group (n = 15): hospital‐issued pacifier held lightly to their mouths 3 infants were subsequently excluded from data analysis (1 in the sucrose group and 2 in the warmth group) | |
| Outcomes | Cumulative crying time, mean HR, mean respiratory sinus arrhythmia, cumulative distribution of grimace time | |
| Notes | All outcomes were provided in graph form only and could not be used in meta‐analyses | |
| Risk of bias | ||
| Bias | Authors' judgement | Support for judgement |
| Random sequence generation (selection bias) | Unclear risk | No information provided |
| Allocation concealment (selection bias) | High risk | Infants were randomly assigned using a sealed envelope system into 1 of 3 groups: warmth (n = 14), sucrose (n = 15), pacifier (n = 15). Did not state whether the envelopes were sequentially numbered or not |
| Blinding (performance bias and detection bias) | High risk | Infants in the warmth group had their clothing removed except for the diaper and were placed under an Ohmeda‐Ohio 3000 Infant Warmer System. Infants in the other 2 study groups (sucrose and pacifier) remained in their bassinets (cots) clothed in a shirt, diaper, and hat |
| Blinding of outcome assessment (detection bias) | High risk | The infant’s face was videotaped for offline coding of grimace and cry. The research assistants could probably tell to which group the infant belonged |
| Incomplete outcome data (attrition bias) | Low risk | Of the 47 enrolled infants, 3 infants were subsequently excluded from data analysis due to technical problems with HR recording (1 in the sucrose group and 2 in the warmth group) |
| Selective reporting (reporting bias) | Unclear risk | The study protocol was not available to us so we could not judge whether there were any deviations from it |
| Other bias | Low risk | Appears free of other bias |
| Methods | RCT Painful intervention: vaccination (hepatitis B) Study location: University of Chicago Hospital, Chicago, Illinois, USA Study period: July to August 2008 | |
| Participants | 29 healthy, full‐term newborns undergoing vaccination Exclusion criteria included preterm birth (< 37 weeks’ completed PMA), birthweight < 2 kg, any Apgar score < 6, congenital abnormalities, medical complications, or drug exposure. Infants with previous oxygen administration, ventilatory support, or NICU admission were excluded | |
| Interventions | Sucrose group (n = 15): 1.0 mL 24 % sucrose 2 min before vaccination Sucrose + warmth group (n = 14): 1.0 mL 24% sucrose 2 min before vaccination + radiant warmth from an infant warmer before the vaccination Infants in the sucrose + warmth group were placed under an Ohmeda Ohio Infant Warmer (Model No. 3000; GE Healthcare, Fairfield, CT), and their clothing was removed, except for a diaper (nappy) | |
| Outcomes | Duration of cry and grimace (s), HR variability and HR | |
| Notes | Duration of cry and grimace were provided as means and SDs and in graph form. Respiratory sinus arrhythmia and HR reported in graph form Both groups received sucrose | |
| Risk of bias | ||
| Bias | Authors' judgement | Support for judgement |
| Random sequence generation (selection bias) | Unclear risk | Quote: "We randomly assigned each infant in the study to sucrose alone or sucrose plus warmer groups by using a sealed envelope randomisation system" |
| Allocation concealment (selection bias) | High risk | No information about whether the envelopes were opaque and sequentially numbered |
| Blinding (performance bias and detection bias) | High risk | The study could not be blinded to warmth vs. no warmth |
| Blinding of outcome assessment (detection bias) | Unclear risk | Video tapes were analyzed by assessors blinded to group assignment – probably, but could the warmer be seen? |
| Incomplete outcome data (attrition bias) | Low risk | Outcomes reported on all infants |
| Selective reporting (reporting bias) | Unclear risk | The study protocol was not available to us so we could not judge whether there were any deviations from it. We could not find a Trils registration number |
| Other bias | Low risk | Appears free of other bias |
| Methods | RCT Painful intervention: heel lance Study location: a moderate sized hospital in Southern California, USA Study period: not stated | |
| Participants | 84 term newborns, approximately 17 h to 19 h old | |
| Interventions | Sugar‐coated pacifier held in infant's mouth before procedure to 3 min after procedure (n = 21) | |
| Outcomes | Salivary cortisol levels, duration of cry, vagal tone | |
| Notes | Analysis using MANOVA to evaluate outcomes by groups | |
| Risk of bias | ||
| Bias | Authors' judgement | Support for judgement |
| Random sequence generation (selection bias) | Unclear risk | Sequence generation not described |
| Allocation concealment (selection bias) | Unclear risk | Allocation concealment not described |
| Blinding (performance bias and detection bias) | High risk | Use of pacifier precluded blinding. No blinding between pacifier groups either, as one was moistened with water and one dipped in sugar packet |
| Blinding of outcome assessment (detection bias) | High risk | No blinding of outcome measurement |
| Incomplete outcome data (attrition bias) | Unclear risk | No statement indicating how many infants were recruited and how many dropped out |
| Selective reporting (reporting bias) | Unclear risk | The study protocol was not available to us so we could not judge whether there were any deviations from it |
| Other bias | Low risk | Appears free of other bias |
| Methods | RCT Painful intervention: heel lance Study location: Hospital of Vigevano, Italy Study period: not stated | |
| Participants | 140 term (38 to 41 weeks' PMA) | |
| Interventions | Nothing (n = 20) | |
| Outcomes | HR before, during and 3 min after heel lance | |
| Notes | ANOVA to evaluate HR across groups at each phase of the heel lance. Means and SDs provided | |
| Risk of bias | ||
| Bias | Authors' judgement | Support for judgement |
| Random sequence generation (selection bias) | Low risk | Sequence generated by random number table |
| Allocation concealment (selection bias) | High risk | Allocated by sealed opaque envelopes. Did not state if the envelopes were sequentially numbered |
| Blinding (performance bias and detection bias) | Low risk | Staff were blinded to sucrose and water solutions |
| Blinding of outcome assessment (detection bias) | Low risk | Blinding of outcome assessments |
| Incomplete outcome data (attrition bias) | Low risk | 20 infants were allocated to each group and results for all infants were presented |
| Selective reporting (reporting bias) | Unclear risk | The study protocol was not available to us so we could not judge whether there were any deviations from it |
| Other bias | Low risk | Appears free of other bias |
| Methods | Randomized, double‐blind, placebo‐controlled trial Painful intervention: heel lance Study location: Leeds General Infirmary, Leeds, UK Study period: 6 months (dates not provided) | |
| Participants | 60 term (37 to 42 weeks' PMA) infants, 1 to 6 days of age | |
| Interventions | 2 mL 12.5% sucrose 2 min prior to heel lance (n = 15) | |
| Outcomes | Total time (s) crying over 3 min following heel lance, time of first cry (s) following heel lance, percentage change in HR after heel lance (at 1, 3 and 5 min) | |
| Notes | Analysis of non‐parametric data was by the Mann‐Whitney U test or a trend test. Total time crying in the first 3 min after heel lance was reported as medians and IQRs. Changes in HR were expressed in means and SDs as a percentage of resting HR Adverse effects were not evaluated | |
| Risk of bias | ||
| Bias | Authors' judgement | Support for judgement |
| Random sequence generation (selection bias) | Unclear risk | Sequence generation not described |
| Allocation concealment (selection bias) | Low risk | Preprepared solutions in coded bottles |
| Blinding (performance bias and detection bias) | Low risk | Sucrose and water solutions administered blinded to staff |
| Blinding of outcome assessment (detection bias) | Low risk | Blinding of outcome assessments |
| Incomplete outcome data (attrition bias) | Low risk | Outcomes reported for all randomized infants |
| Selective reporting (reporting bias) | Unclear risk | The study protocol was not available to us so we could not judge whether there were any deviations from it |
| Other bias | Low risk | Appears free of other bias |
| Methods | Randomized, blinded, controlled trial Painful intervention: heel lance Study location: Royal Children's Hospital, University of Melboourne, Victoria, Australia Study period: May 2000 to July 2001 | |
| Participants | Our sample was a subset of a larger study (n = 128) that included older infants Authors provided us with data for a subset of infants that fulfilled our inclusion criteria The subset included 99 hospitalized infants Mean (SD) PMA of placebo group: 36.7 weeks (3.3) | |
| Interventions | 1 mL water 2 min prior to heel lance (n = 46) For infants weighing ≤ 1500 g the dose was reduced to 0.5 mL | |
| Outcomes | NFCS at baseline, upon heel lance, during heel squeeze and completion of heel squeeze at 1, 2 and 3 min of recovery Duration of cry until 5‐s pause, percentage of crying time during heel lance and squeeze, percentage of crying time during 3 min recovery period HR and oxygen saturation (SpO2) | |
| Notes | Results were presented in graphs Adverse events were not evaluated | |
| Risk of bias | ||
| Bias | Authors' judgement | Support for judgement |
| Random sequence generation (selection bias) | Low risk | Computer‐generated randomization sequence |
| Allocation concealment (selection bias) | Low risk | Pharmacy‐prepared solutions in consecutively numbered syringes. Contents of syringes obscured |
| Blinding (performance bias and detection bias) | Low risk | Sucrose and water solutions blinded |
| Blinding of outcome assessment (detection bias) | Low risk | Blinding of outcome assessments |
| Incomplete outcome data (attrition bias) | Low risk | Results reported for all randomized infants |
| Selective reporting (reporting bias) | Unclear risk | The study protocol was not available to us so we could not judge whether there were any deviations from it |
| Other bias | Low risk | NNS with pacifier was provided as comfort measure if part of regular infant care. This was addressed by the authors and adjusted analyses were performed to assess the effect of pacifier across groups |
| Methods | RCT Painful intervention: circumcision Study location: General Care Nursery of the University of Chicago Hospitals, Chicago, Ill, USA Study period: not stated | |
| Participants | 119 full‐term male neonates undergoing circumcision, PMA ≥ 38 weeks, PNA ≥ 12 h | |
| Interventions | No treatment (n = 40) | |
| Outcomes | HR and oxygen saturation (change from baseline and means for each interval of circumcision) | |
| Notes | Results of change in HR and oxygen saturation for each group were reported as mean and SD. Mean HRs for each interval of circumcision were presented in graph form Mean HR and oxygen saturation were compared between groups using ANOVA. Characteristics of infants in the 3 groups were compared using Chi2 test, Fisher exact test or ANOVA Adverse events were not evaluated | |
| Risk of bias | ||
| Bias | Authors' judgement | Support for judgement |
| Random sequence generation (selection bias) | Low risk | Shuffled opaque unmarked envelopes to generate sequence |
| Allocation concealment (selection bias) | High risk | Group assignments contained in opaque unmarked envelopes. Did not state if the envelopes were sequentially numbered |
| Blinding (performance bias and detection bias) | High risk | Intervention was not blinded |
| Blinding of outcome assessment (detection bias) | Low risk | The outcome assessment was blinded. Outcome not likely to be influenced by lack of blinding |
| Incomplete outcome data (attrition bias) | Low risk | There was 1 exclusion: an infant randomized to sucrose was not circumcised. After the operator visualized the location of the meatus, she thought the surgery was contraindicated |
| Selective reporting (reporting bias) | Unclear risk | The study protocol was not available to us so we could not judge whether there were any deviations from it |
| Other bias | Low risk | Appears free of other bias |
| Methods | RCT Painful intervention: heel lance Study location: Marmara University Hospital, Istanbul, Turkey Study period: August 1997 to May 1998 | |
| Participants | 113 healthy newborns PMA: 37 to 42 weeks, median PNA: 2 days (range 2 to 5 days) | |
| Interventions | 2 mL 30% sucrose (n = 28) | |
| Outcomes | Mean cry time during 3 min after heel lance; mean maximum HR 3 min after heel lance; mean recovery time for HR; percentage change in HR at 1, 2, 3 min after heel lance | |
| Notes | 1‐way ANOVA was used to evaluate mean cry time, recovery time and percentage change in HR Results reported as means and standard errors of the mean | |
| Risk of bias | ||
| Bias | Authors' judgement | Support for judgement |
| Random sequence generation (selection bias) | Unclear risk | Sequence generation not described |
| Allocation concealment (selection bias) | Unclear risk | Allocation concealment not described |
| Blinding (performance bias and detection bias) | Unclear risk | Could not tell if intervention was blinded |
| Blinding of outcome assessment (detection bias) | Low risk | Could not tell if HR assessment was blinded; however, it was stated that assessment of crying was blinded |
| Incomplete outcome data (attrition bias) | Unclear risk | No clear statement given. Indicated that any baby that cried prior to the heel lance was excluded, but number in methods is same as number in results, so unsure if there were more recruited but dropped out/excluded for results |
| Selective reporting (reporting bias) | Unclear risk | The study protocol was not available to us so we could not judge whether there were any deviations from it |
| Other bias | Low risk | Appears free of other bias |
| Methods | RCT Painful intervention: heel lance Study location: University‐affiliated level III NICU, Canada Study period: not stated | |
| Participants | 85 preterm infants (25 to 34 weeks' PMA), 2 to 10 days of age | |
| Interventions | 0.05 mL 24% sucrose via syringe into the mouth just prior to heel lance (n = 27) | |
| Outcomes | HR, oxygen saturation, behavioural facial actions, behavioural state; NFCS baseline and at 3 x 30‐s blocks | |
| Notes | Data were analyzed using MANOVA (facial action). For HR repeated measures ANOVA was used with mean values but no SDs presented in graph form For state repeated measures ANOVA was performed and no univariate means and SDs were presented | |
| Risk of bias | ||
| Bias | Authors' judgement | Support for judgement |
| Random sequence generation (selection bias) | Low risk | Computer‐generated random allocation sequence |
| Allocation concealment (selection bias) | High risk | Sequentially numbered envelopes, but did not specify whether envelopes were opaque |
| Blinding (performance bias and detection bias) | High risk | Quote: "The research nurse who actually conducted the heel stick procedure was not naive as to the interventions". "Not only was it obvious whether or not the infant was on the rocking bed, the nurse participated in preparing the infants for the conditions" |
| Blinding of outcome assessment (detection bias) | Unclear risk | Quote: "Similarily, in instances where the pulse oximeter signal was lost and heart rate was recorded by hand, the researcher collecting the data knew to which group the infant belonged". "The research assistant who coded the behavioral data in the laboratory did not know the purpose of the study, the nature of the interventions, nor the infants' group assignment" |
| Incomplete outcome data (attrition bias) | High risk | The original design called for 28 infants/group based on anticipated effect size; however Table 1 shows that sample size of each group varied from 14 to 27; not equal groups |
| Selective reporting (reporting bias) | Unclear risk | The study protocol was not available to us so we could not judge whether there were any deviations from it |
| Other bias | Low risk | Appears free of other bias |
| Methods | RCT Painful intervention: heel lance Study location: Level III NICU, Canada Study period: not stated | |
| Participants | 48 preterm neonates, mean PMA of 31 weeks (range 25 to 34 weeks) within 10 days of birth | |
| Interventions | Interventions given by syringe to anterior surface of the tongue at: 2 min prior to heel lance, just prior to lancing, and 2 min after lancing 0.05 mL 24% sucrose as a single dose, followed by 2 doses of sterile water (n = 15) | |
| Outcomes | PIPP, measured over 5 x 30‐s blocks of time | |
| Notes | Repeated measures ANOVA was used to evaluate the effect of single vs. repeated doses of sucrose | |
| Risk of bias | ||
| Bias | Authors' judgement | Support for judgement |
| Random sequence generation (selection bias) | Low risk | Computer‐generated random assignment |
| Allocation concealment (selection bias) | High risk | Once parental consent was obtained, the research assistant opened the next sealed study envelope that contained the computer‐generated random assignment to 1 of 3 treatment groups: single sucrose, repeated sucrose, and sterile water. Trial report did not state whether or not the envelopes were opaque |
| Blinding (performance bias and detection bias) | High risk | Sucrose and water solutions blinded for research nurses, but not the research assistants as they prepared the syringes with the solutions |
| Blinding of outcome assessment (detection bias) | Low risk | The video tapes were later coded according to the NFCS in the university laboratory by research assistants who were blind to the purpose of the study |
| Incomplete outcome data (attrition bias) | Low risk | Outcomes reported for all randomized infants |
| Selective reporting (reporting bias) | Unclear risk | The study protocol was not available to us so we could not judge whether there were any deviations from it |
| Other bias | Low risk | Appears free of other bias |
| Methods | RCT Painful intervention: multiple invasive procedures Study location: 3 level III university‐affiliated NICUs in Canada Study period: 27 months (dates not stated) | |
| Participants | 103 preterm infants completed the study (107 infants entered the study; 2 infants died and 2 were withdrawn) Sucrose group: mean (SD) PMA: 28.18 weeks (1.72) | |
| Interventions | Sucrose or water was administered orally up to 3 times, 2 min apart, for every invasive procedure during a 7‐day period: 0.1 mL 24% sucrose (n = 51) 0.1 mL water (n = 52) | |
| Outcomes | Neurobehavioural development assessed by the sub scales of alertness and orientation and motor development and vigour of the NAPI, Score for Neonatal Acute Physiology (SNAP) and Neuro‐Biological Risk Score (NBRS) | |
| Notes | Data could not be used for meta‐analyses | |
| Risk of bias | ||
| Bias | Authors' judgement | Support for judgement |
| Random sequence generation (selection bias) | Low risk | Random computer‐generated program |
| Allocation concealment (selection bias) | Unclear risk | Did not specify how allocation was done |
| Blinding (performance bias and detection bias) | Unclear risk | Research assistants not blinded to group, but blinded to purpose of study |
| Blinding of outcome assessment (detection bias) | Unclear risk | Research assistants not blinded to group, but blinded to purpose of study |
| Incomplete outcome data (attrition bias) | Unclear risk | 2 infants were withdrawn from the study during the week of intervention and another 2 infants died |
| Selective reporting (reporting bias) | Unclear risk | The study protocol was not available to us so we could not judge whether there were any deviations from it |
| Other bias | Low risk | Appears free of other bias |
| Methods | RCT Painful intervention: circumcision Study location: normal newborn Nursery of the Boston Univeristy Medical Centre, Boston, MA, USA Study period: March 1999 to August 2000 | |
| Participants | 57 male infants undergoing circumcision | |
| Interventions | Mogen method and water (n = 15) Solutions were given via a dipped pacifier | |
| Outcomes | Cry and grimacing during real time 10‐s intervals | |
| Notes | Results were reported graphically. A 2‐factor analysis of variance evaluated raw and percentage duration of crying and grimacing. The Kolmogorov‐Smirnov test for the equivalence of empiric distribution functions was used to evaluate differences in the distribution of cumulative crying and grimacing Adverse events were not evaluated | |
| Risk of bias | ||
| Bias | Authors' judgement | Support for judgement |
| Random sequence generation (selection bias) | Unclear risk | Sequence generation not adequately described |
| Allocation concealment (selection bias) | Low risk | Solutions prepared and coded by pharmacy and stored in dark vials to make them indistinguishable |
| Blinding (performance bias and detection bias) | Low risk | Sucrose and water solutions were prepared and coded by pharmacy department and stored in individual darkened vials, each containing 60 mL aliquots. Investigators, research assistants, and hospital staff who participated in the circumcision did not know the contents of a given vial |
| Blinding of outcome assessment (detection bias) | Low risk | Evaluators who were unaware of the experimental condition scored the audio‐video tapes using software |
| Incomplete outcome data (attrition bias) | Unclear risk | It is unclear how many infants were included in the analyses |
| Selective reporting (reporting bias) | Unclear risk | The study protocol was not available to us so we could not judge whether there were any deviations from it |
| Other bias | Low risk | Appears free of other bias |
| Methods | RCT, cross‐over design Painful intervention: NG intubation Study location: NICU at St Olav's University Hospital, Trondheim, Norway Study period: January 2005 to June 2008 | |
| Participants | 24 preterm infants, 28 to 32 weeks' PMA | |
| Interventions | Each infant acted as his or her own control over a 3‐week period 6 times. On these occasions, 6 different treatment combinations were given in randomized order: Pacifier or no pacifier, combined with no fluid, sterile water, or 30% sucrose | |
| Outcomes | PIPP scores | |
| Notes | Infants acted as their own controls | |
| Risk of bias | ||
| Bias | Authors' judgement | Support for judgement |
| Random sequence generation (selection bias) | Low risk | Random list generated by computer |
| Allocation concealment (selection bias) | Low risk | Used a unique sequence from list ‐ only the study leader had access to the list |
| Blinding (performance bias and detection bias) | Unclear risk | Nurses doing PIPP scores were asked to "turn away" before solution was given but authors did not mention how to control for that |
| Blinding of outcome assessment (detection bias) | Unclear risk | Nurses doing PIPP scores were asked to "turn away" before solution was given but authors did not mention how to control for that |
| Incomplete outcome data (attrition bias) | Low risk | 2 infants were transferred to another hospital and did not complete the study. 24 infants completed the study and they had complete observations. The 6 treatment combinations resulted in 144 discreet events being observed |
| Selective reporting (reporting bias) | Unclear risk | The study protocol was not available to us so we could not judge whether there were any deviations from it |
| Other bias | Low risk | Appears free of other bias |
| Methods | RCT Painful intervention: heel lance Study location: Children's Hospital of Chongqing Medical University, Chongqing 400014, China Study period: not stated | |
| Participants | 560 full‐term neonates (male 295, female 265) PMA 37 to 42 weeks; weight at birth 2500 g to 4000 g; Apgar scores at 1 min and 5 min after birth averaged Inclusion criteria: ≥ 8 points; age 3 to 28 days; had not undergone surgery; baseline HR 120‐140 beats/min; oxygen saturation ≥ 0.90; planned screening for congenital metabolic disease Exclusion criteria: neonates presenting with asphyxia, congenital heart disease, and neuromuscular disease during birth; oxygen inhalation; hyperglycaemia; fasting; received sedative injection within last 48 h; fructose intolerance; maternal methadone dependence; vertebral injury | |
| Interventions | The infants were randomized to 7 groups: Placebo group (plain boiled water) 10% glucose 25% glucose 50% glucose 12% sucrose 24% sucrose 30% sucrose The solutions were administered through a syringe dripping into the neonate's mouth 2 min before heel lance | |
| Outcomes | The heel lance procedure was recorded by video. HR, oxygen saturation and pain scores were assessed at 1 min before heel lance and 3, 5 and 10 min after heel lance. Results were reported as means and full ranges. | |
| Notes | The article was translated for us by Mr David Corpman | |
| Risk of bias | ||
| Bias | Authors' judgement | Support for judgement |
| Random sequence generation (selection bias) | Low risk | A table of random numbers was used |
| Allocation concealment (selection bias) | Unclear risk | A lottery method was used to assign the 7 groups to a boiled water placebo control group (placebo group), glucose groups (10%, 25%, and 50% concentration (mass concentration)), and sucrose groups (12%, 24%, and 30% concentration) |
| Blinding (performance bias and detection bias) | Unclear risk | There was no statement that staff and assessors were blinded to intervention groups |
| Blinding of outcome assessment (detection bias) | Unclear risk | The heel lance procedure was recorded by video. HR, oxygen saturation and pain scores were assessed at 1 min before heel lance and 3, 5 and 10 min after the heel lance. It is not stated if the assessors were blinded to intervention groups |
| Incomplete outcome data (attrition bias) | Low risk | Results reported for 80 infants in each group |
| Selective reporting (reporting bias) | Unclear risk | The study protocol was not available to us so we could not judge whether there were any deviations from it |
| Other bias | Low risk | Appears free of other bias |
| Methods | RCT Painful intervention: heel lance Study location: Children’s Hospital of Chongqing Medical University, Chongqing, and Hunan Children’s Hospital, Hunan, Shenzhen Children’s Hospital, Shenzhen, and Chengdu Women’s & Children’s Central Hospital, Chengdu, China Study period: 25 June 2012 to 25 February 2013 | |
| Participants | New born infants (n = 671) with PMA between 37 and 42 weeks at birth; PNA between 3 and 28 days; birthweight 2500 g to 4000 g; Apgar score ≥ 8 at 5 min after birth; resting HR 120‐140 beats/min and resting oxygen saturation ≥ 95%; and requiring neonatal congenital metabolism disease screening or blood glucose test | |
| Interventions | The interventions in the 4 groups were as follows: Sucrose + routine care group: 2 mL 24% sucrose administered to the infant’s mouth by syringe 2 min before the heel lance procedure Sucrose + NNS: 2 mL 24% sucrose administered to the infant’s mouth by syringe 2 min before the heel lance procedure, and then a standard silicone newborn pacifier was placed into the infant’s mouth until the end of the process Sucrose + swaddling: infants were swaddled with a cotton blanket, upper but not lower limb movements were restricted by the blanket, and then 2 mL 24% sucrose administered to the infant’s mouth by syringe 2 min before the heel lance procedure. The lower limbs were swaddled right after the heel lance procedure until the end of the process Sucrose + NNS + swaddling): infants were swaddled with a cotton blanket, upper but not lower limb movements were restricted by the blanket, then 2 mL 24% sucrose administered into the infant’s mouth by syringe before the heel lance procedure, then a standard silicone newborn pacifier was placed into the infant’s mouth, the lower limbs were swaddled right after the heel lance procedure until the end of the process | |
| Outcomes | Revised NFCS, increase in HR (%), decrease in oxygen saturation (%). There was no significant difference in the frequency of adverse effects (fall in HR or oxygen saturation) across groups. No adverse events were observed during the procedure | |
| Notes | ||
| Risk of bias | ||
| Bias | Authors' judgement | Support for judgement |
| Random sequence generation (selection bias) | Low risk | Each infant was assigned a random digit by using a random number table generated with SPSS19.0 |
| Allocation concealment (selection bias) | Unclear risk | A simple calculation utilizing the random digit was used to determine a remainder (remainder = random digit/4), which was then used to decide which group the infant belonged to. For example, if the remainder was 1, then the infant was assigned to the sucrose group. If the remainder was 2, then the infant was assigned to the sucrose + NNS group. If the remainder was 3 then the infant was assigned to the sucrose + swaddling group. If the remainder was 0 then the group assigned was the sucrose + NNS + swaddling group. Randomization codes were kept in a secure location that could not be accessed by study personnel |
| Blinding (performance bias and detection bias) | High risk | Quote: "Although we made efforts to limit bias from the coder, there is a possibility that the coder could still have distinguished the different groups by assessing with or without NNS". Nurses performing heel sticks were blinded to study and infant’s clinical information |
| Blinding of outcome assessment (detection bias) | High risk | Quote: "Although we made efforts to limit bias from the coder, there is a possibility that the coder could still have distinguished the different groups by assessing with or without NNS" |
| Incomplete outcome data (attrition bias) | Low risk | It appears that outcome data were reported on all infants |
| Selective reporting (reporting bias) | Unclear risk | The study protocol was not available to us so we could not judge whether there were any deviations from it |
| Other bias | Low risk | Appears free of other bias |
| Methods | RCT Painful intervention: IM injection Study location: a neonatal nursery at a medical centre in Taipei, Taiwan Study period: not stated | |
| Participants | 165 newborns, ≥ 36 weeks PMA receiving IM injections. Birthweight ≥ 2200 g, Apgar score ≥ 7 at 1 and 5 min after birth | |
| Interventions | 20% sucrose orally NNS Routine care | |
| Outcomes | NFCS, cry duration, HR and respiratory rate | |
| Notes | We reported on cry duration in the sucrose and the routine care groups | |
| Risk of bias | ||
| Bias | Authors' judgement | Support for judgement |
| Random sequence generation (selection bias) | Low risk | Computer generated |
| Allocation concealment (selection bias) | Low risk | Each infant enrolled in the study was randomly assigned to 1 of 3 pain relief methods by a statistician blind to the study purpose and using random allocation software |
| Blinding (performance bias and detection bias) | High risk | The senior research nurse was trained to follow the nursery's standard procedures for IM injections of hepatitis vaccine. The IM injection procedures were controlled to be administered within 1 min in all newborns of the 3 groups. The other research nurse was trained to offer NNS or oral sucrose adeptly to infants in the experimental groups before the IM injection procedures |
| Blinding of outcome assessment (detection bias) | Low risk | The other research assistant, blinded to the study purpose and the infants' clinical information and intervention groups, was trained to code facial actions, to score pain using the NFCS and to measure cry duration. Facial actions and cry duration were recorded using a real‐time colour video recorder. Video signals were directly transmitted to a computer, and a time code was recorded and entered into videotapes by software The NNS group was probably known to the research assistant |
| Incomplete outcome data (attrition bias) | Low risk | Outcomes reported for all randomized infants |
| Selective reporting (reporting bias) | Unclear risk | The study protocol was not available to us so we could not judge whether there were any deviations from it |
| Other bias | Low risk | Appears free of other biases |
| Methods | RCT Painful intervention: heel lance Study location: Level III NICU and a neonatal special care unit at a medical centre in Taipei, Taiwan Study period: not stated | |
| Participants | 110 infants (PMA 26.4 to 37 weeks) needing heel lances | |
| Interventions | 3 interventions were used in different combinations: NNS + FT (n = 22); FT + sucrose (n = 21); NNS + sucrose (n = 21); NNS + sucrose + FT (n = 23) Sucrose intervention: infants were fed 0.2 mL–2.0 mL 20% sucrose through a syringe 2 min before the heel lance procedures. Volume depended on the infant’s PMA (PMA 26 to 28 weeks: 0.2 mL; PMA 28.1 to 30 weeks: 0.5 mL; PMA 30.1 to 32 weeks: 1 mL; PMA 32.1 to 37 weeks: 1.5 mL; PMA > 37 weeks: 2.0 mL) NNS intervention: infants were given a standard silicone newborn pacifier to stimulate sucking 1 min before touching the foot to initiate heel lance procedures FT intervention: infants were placed in a flexed posture and gently held by the intervener’s warm hands without strongly restraining the infant’s head and body, one hand on the infant’s head, and the other on the trunk Control group: routine care (n = 23) | |
| Outcomes | Infants’ behavioural states (quiet sleep, active sleep, transition state, active awake, quiet awake, fussing or crying) | |
| Notes | ||
| Risk of bias | ||
| Bias | Authors' judgement | Support for judgement |
| Random sequence generation (selection bias) | Low risk | Computer generated Infants meeting the study criteria were randomly assigned to control and treatment interventions by a statistician blind to the study purpose using Clinstat block randomization |
| Allocation concealment (selection bias) | Low risk | See random sequence generation |
| Blinding (performance bias and detection bias) | High risk | We could not see how staff and assessors could be blinded |
| Blinding of outcome assessment (detection bias) | High risk | We could not see how staff and assessors could be blinded |
| Incomplete outcome data (attrition bias) | Low risk | Outcomes reported for all randomized infants |
| Selective reporting (reporting bias) | Unclear risk | The study protocol was not available to us so we could not judge whether there were any deviations from it |
| Other bias | Low risk | Appears free of other bias |
| Methods | RCT Painful intervention: heel lance Study location: Hospital Puerta de Hierro‐Majadahonda, Madrid, Spain Study period: not stated | |
| Participants | 136 healthy term neonates (PMA 37 to 41 weeks) | |
| Interventions | Sucrose group (N = 32; analyzed): 2 mL 24% sucrose given into mouth with a sterile syringe 2 min before heel lance to neonates laid supine on a cot; procedure was done in presence of mother Sucrose + skin‐to‐skin contact (SSC) group (n = 35; analyzed): neonates held prone between their mother's breasts at least 5 min before sampling and 2 mL 24% sucrose was given into mouth with a sterile syringe 2 min before heel lance SSC group (n = 31? Written to authors, could be 32): neonates held prone between their mother's breasts at least 5 min before sampling Breastfeeding (BF) + SSC group (n = 29; analyzed): neonates were held prone with skin‐to‐skin contact with mother; BF started at last 5 min before heel lance and was maintained during sampling Mothers were allowed to speak and touch their babies in all groups | |
| Outcomes | NIPS; HR; crying time (s); crying in blood sampling; number of heel lances (%) Data presented as medians and IQRs, HR as means with SDs | |
| Notes | ||
| Risk of bias | ||
| Bias | Authors' judgement | Support for judgement |
| Random sequence generation (selection bias) | Unclear risk | No information provided |
| Allocation concealment (selection bias) | High risk | Randomization was by closed envelopes and 268 opaque (but not sequentially numbered) envelopes with the group assignment were prepared at the beginning of the study and mixed. Parents selected 1 envelope |
| Blinding (performance bias and detection bias) | High risk | Nurses and parents were not blinded to the treatment assignment |
| Blinding of outcome assessment (detection bias) | High risk | Nurses and parents were not blinded to the treatment assignment |
| Incomplete outcome data (attrition bias) | Low risk | In the sucrose group 1 infant was not analyzed because of technical problem. In the BF + SSC group 3 infants were excluded from the analysis because of non‐effective BF, 2 because of incorrect SSC and 1 because of technical problem. All participants from the sucrose + SSC group were included. In the SSC group there were technical problem in 1 infant but Figure 1 in the trial report indicates that 31/33 infants were analyzed, and we do not know what happened to this 1 infant |
| Selective reporting (reporting bias) | Low risk | Trial registration number (ClinicalTrials.gov): NCT01576432. There did not seem to be any deviations from the protocol in the full report |
| Other bias | Low risk | Appears free of other bias |
| Methods | Randomized study (blinded for cry but not for DAN) Painful intervention: heel lance Study location: transitional care unit and postnatal ward of a large, teaching hospital, Mumbai, India Study period: not stated | |
| Participants | 104 term neonates > 24 h old | |
| Interventions | 2 mL 20% sucrose (n = 17) 2 mL distilled water (n = 15) 2 mL expressed breast milk (n = 18) NNS (n = 20) Rocking (n = 17) Massage (n = 17) | |
| Outcomes | DAN before heel prick and 30 s and 1, 2 and 4 min after heel prick; time of first cry (s) (i.e. until baby took first inspiration after beginning of cry), total cry (s); HR and oxygen saturation (SpO2) before heel prick and 2 and 4 min after heel prick | |
| Notes | Results were graphed and reported as means and SDs (2 SD) Adverse events were not evaluated | |
| Risk of bias | ||
| Bias | Authors' judgement | Support for judgement |
| Random sequence generation (selection bias) | Low risk | Sequence generated by random number table |
| Allocation concealment (selection bias) | Unclear risk | Allocation concealment not described |
| Blinding (performance bias and detection bias) | High risk | Interventions could not be blinded. 1 observer left the room during the intervention to be able to assess the DAN score blindly. A second observer was in the room during the interventions and was not blinded |
| Blinding of outcome assessment (detection bias) | High risk | 1 observer left the room during the intervention to be able to assess the DAN score blindly. A second observer was in the room during the interventions and was not blinded |
| Incomplete outcome data (attrition bias) | Unclear risk | Physiological parameters (HR, oxygen saturation) not reported, but were listed as outcomes variables in the Methods sections |
| Selective reporting (reporting bias) | Unclear risk | Physiological parameters (HR, oxygen saturation) not reported, but were listed as outcomes variables in the Methods sections |
| Other bias | Low risk | Appears free of other bias |
| Methods | Randomized, double‐blind, controlled trial Painful intervention: NG tube insertion Study location: Department of Child Health, Rotherham General Hospital, Rotherham, South Yorkshire, UK Study period: not stated | |
| Participants | 20 preterm infants, mean PMA 30 weeks Sucrose group: mean PNA 23 days Water group: mean PNA 27 days | |
| Interventions | Total of 51 NG tube insertions. Each infant was randomised to either the water or sucrose group prior to each insertion. This was not a cross‐over study. In each instance where NG tube insertion was required, the infant was randomised separately and independently of any previous allocation to receive either placebo (sterile water) or 24% sucrose solution 0.5 mL to 2 mL 24% sucrose (n = 26) 0.5 mL to 2 mL sterile water (n = 25) | |
| Outcomes | Incidence of crying, HR, oxygen saturation, NFCS (median) | |
| Notes | Incidence of crying reported as percentage of neonates who cried. HR and oxygen saturation measured as change (in beats/min and percentage saturation, respectively) from baseline Adverse events were evaluated; brief apnoea and self‐limiting bradycardia reported in a few neonates, but no clinical intervention needed. No statistically significant differences between sucrose and water groups regarding incidence of adverse events | |
| Risk of bias | ||
| Bias | Authors' judgement | Support for judgement |
| Random sequence generation (selection bias) | Low risk | Computer‐generated random number list |
| Allocation concealment (selection bias) | Low risk | Used sealed opaque envelopes to allocate to groups |
| Blinding (performance bias and detection bias) | Low risk | Sucrose and water solutions administered in a blinded manner |
| Blinding of outcome assessment (detection bias) | Low risk | Blinding of outcome assessments |
| Incomplete outcome data (attrition bias) | Unclear risk | No information provided about why enrolled infants did not participate in the study |
| Selective reporting (reporting bias) | Unclear risk | The study protocol was not available to us so we could not judge whether there were any deviations from it |
| Other bias | Unclear risk | Infants were randomised several times ‐ could they be "remembering" their previous experience, which may affect the results? |
| Methods | Double‐blind, RCT Painful intervention: arterial puncture Study location: a 40‐bed, Level III, NICU of a 564‐bed community‐based hospital in midwest USA Study period: 12‐month period (Dates not reported) | |
| Participants | 47 neonates, 30 to 36 weeks’ PMA, 48 h old, nil by mouth status, and medical requirement for an arterial puncture | |
| Interventions | Sucrose group (n = 24): 0.5 mL solution oral sucrose (Sweet‐Ease, preservative‐free, 24% sucrose solution 99044, Children’s Medical Ventures, Norwell, Massachusetts) given in a 1 mL syringe 1‐3 min before arterial puncture. A pacifier was then held in place lightly and infant's extremities swaddled by nurses assigned to infant’s care. Arterial puncture was performed by another nurse Control group (n = 23): a pacifier was held in place lightly and infant's extremities swaddled by nurses assigned to infant’s care. Arterial puncture was performed by another nurse | |
| Outcomes | NIPS, HR, oxygen saturation (%) | |
| Notes | ||
| Risk of bias | ||
| Bias | Authors' judgement | Support for judgement |
| Random sequence generation (selection bias) | Low risk | Random assignment to groups was done using a computer randomization scheme |
| Allocation concealment (selection bias) | High risk | Envelopes were sealed, but not sequentially numbered |
| Blinding (performance bias and detection bias) | Low risk | Immediately prior to the therapeutically required arterial puncture, the study investigator left the infant’s room while the nurse caring for the infant opened the sealed envelope containing the randomization assignment to treatment group. Infants assigned to the sucrose solution treatment group were then given a 0.5 mL solution of oral sucrose in a 1‐mL syringe by the nurse caring for the infant. Infants assigned to the placebo group did not receive any oral solution The investigator was then called back to the infant’s bedside, remaining blinded to treatment group assignment, and obtained baseline study data (NIPS; HR; oxygen saturation) immediately after the arterial puncture needle was inserted and again 1 min after the arterial puncture procedure was completed For infants assigned to the sucrose treatment group, the time from sucrose administration to arterial puncture was at least 1 min but not more than 3 min. Group assignment codes were not revealed to study investigators until study enrolment was completed |
| Blinding of outcome assessment (detection bias) | Low risk | See blinding of participants and personnel. Group assignment codes were not revealed to study investigators until study enrolment was completed |
| Incomplete outcome data (attrition bias) | Low risk | Outcome data were presented for 47/49 infants |
| Selective reporting (reporting bias) | Unclear risk | The study protocol was not available to us so we could not judge whether there were any deviations from it |
| Other bias | Low risk | Appears free of other bias |
| Methods | Randomized, double‐blind, placebo‐controlled trial Painful intervention: screening for ROP Study location: level‐3 university‐affiliated NICU, Monroe, Louisiana, USA Study period: February 2002 to August 2002 | |
| Participants | 30 preterm infants Sucrose group: mean PMA 26.5 weeks, mean PNA 8.5 weeks Water group: mean PMA 27.3 weeks, mean PNA 8.2 weeks | |
| Interventions | Sucrose group (n = 15): pacifier and 3 doses of 0.1 mL 24% sucrose drops Water group (n = 15): pacifier and 3 doses of 0.1 mL sterile water drops Both groups received proxymetacaine hydrochloride 0.5% and were swaddled before the eye examination | |
| Outcomes | PIPP at baseline; at eye drops instillation; during examination of left eye and at 30 s, 60 s, 90 s and 120 s after completion of the eye examination | |
| Notes | Results were in graph form and reported as means and standard errors of the means. A series of t‐tests were conducted and their P values reported Adverse events were not evaluated | |
| Risk of bias | ||
| Bias | Authors' judgement | Support for judgement |
| Random sequence generation (selection bias) | Low risk | Computer‐generated randomization sequence |
| Allocation concealment (selection bias) | High risk | Allocated using sealed envelopes, but did not specify whether envelopes were opaque or sequentially numbered |
| Blinding (performance bias and detection bias) | Low risk | Sucrose and water solutions administered blinded to staff Nurse administering interventions was aware of group allocation. All other personnel and investigators were blinded |
| Blinding of outcome assessment (detection bias) | Low risk | Outcome assessment was blinded |
| Incomplete outcome data (attrition bias) | Low risk | Outcome reported for all randomized infants |
| Selective reporting (reporting bias) | Unclear risk | The study protocol was not available to us so we could not judge whether there were any deviations from it |
| Other bias | Low risk | Appears free of other bias |
| Methods | Randomized, double‐blind, controlled trial Painful intervention: venipuncture Study location: Unidad de Cuidado Intensivo Neonatal, Clinica Universitaria Bolivariana, Medellin, Colombia Study period: January to June 2008 | |
| Participants | 111 preterm and term infants: 55 in sucrose group, 56 in water group | |
| Interventions | 1 mL 12% sucrose 1 mL water | |
| Outcomes | NIPS score | |
| Notes | Trial report was written in Spanish | |
| Risk of bias | ||
| Bias | Authors' judgement | Support for judgement |
| Random sequence generation (selection bias) | Low risk | Random number table used |
| Allocation concealment (selection bias) | Low risk | Coded solutions |
| Blinding (performance bias and detection bias) | Unclear risk | Staff were blinded to the solutions used |
| Blinding of outcome assessment (detection bias) | Unclear risk | Trial report did not mention blinding of outcome assessors |
| Incomplete outcome data (attrition bias) | Low risk | Outcome data reported on all 111 randomized infants |
| Selective reporting (reporting bias) | Unclear risk | The study protocol was not available to us so we could not judge whether there were any deviations from it |
| Other bias | Low risk | Appears free of other bias |
| Methods | Randomized, prospective, cross‐over study Painful intervention: SC injection Study location: Service de Néonatologie, Hôpital Armand‐Trousseau, Paris, France Study period: 1 April to 31 August 2002 | |
| Participants | 33 preterm neonates, < 33 weeks' PMA Mean ± SD PMA at birth: 30 ± 6 weeks Mean ± SD PMA at injection: 32 ± 6 weeks | |
| Interventions | NNS group: non‐nutritive pacifier Sucrose + NNS group: 0.2 mL to 0.5 mL 30% sucrose with pacifier EMLA + NNS group: local application of EMLA cream with pacifier Sucrose + EMLA + NNS group: 0.2 mL to 0.5 mL 30% sucrose with EMLA and pacifier | |
| Outcomes | DAN and NFCS scores; HR, respiratory rate and oxygen saturation (%) measured before, during and after injection | |
| Notes | Fisher test, ANOVA of fixed‐effect and the Tukey method were used to compare groups Results were reported as means and SDs Each infant acted as its own control. For each consecutive EPO injection, patients were randomised between four groups of intervention. The numbers of injections reported for the different interventions in Table 1 of the trial report varied from 41 to 86. NNSgroup; n = 41; Sucrose + NNS group; n = 86; EMLA + NNS group; n = 71; and Sucrose + EMLA + NNS group; n = 67. Data could not be used in RevMan‐analyses Adverse effects were not reported | |
| Risk of bias | ||
| Bias | Authors' judgement | Support for judgement |
| Random sequence generation (selection bias) | Unclear risk | Sequence generation not described |
| Allocation concealment (selection bias) | Unclear risk | Allocation concealment not described |
| Blinding (performance bias and detection bias) | High risk | Interventions could not be blinded |
| Blinding of outcome assessment (detection bias) | Unclear risk | Did not state that outcome assessment was blinded |
| Incomplete outcome data (attrition bias) | High risk | Each infant acted as its own control. The numbers reported for the different interventions in Table 1 vary from 41 to 86 |
| Selective reporting (reporting bias) | Unclear risk | The study protocol was not available to us so we could not judge whether there were any deviations from it |
| Other bias | High risk | Unequal distribution of allocated and received treatments amongst injections: NNS; n = 41, EMLA + NNS; n = 71, sucrose + NNS; n = 86, sucrose + EMLA + NNS; n = 67 |
| Methods | Randomized, prospective, placebo‐controlled study Painful intervention: screening for ROP Study location: Dublin, Ireland Study period: not stated | |
| Participants | 40 preterm infants Water group: mean PMA ± SD = 29.5 ± 2.3 weeks, mean corrected age at first eye examination ± SD = 33.1 ± 1.2 weeks Sucrose group: mean PMA ± SD = 29.8 ± 2.4 weeks, mean corrected age at first eye examination ± SD = 33.0 ± 1.1 weeks | |
| Interventions | Sucrose group: 0.2 mL 24% sucrose given by mouth using a syringe and a pacifier (N = 20) Water group: 0.2 mL sterile water given by mouth using a syringe and a pacifier (N = 20) Both groups were swaddled | |
| Outcomes | N‐PASS; HR and oxygen saturation at baseline; number of episodes of bradycardia, desaturation | |
| Notes | Recorded number of adverse events | |
| Risk of bias | ||
| Bias | Authors' judgement | Support for judgement |
| Random sequence generation (selection bias) | Low risk | Computer‐based randomization process used |
| Allocation concealment (selection bias) | Low risk | Sequentially numbered, opaque and sealed envelopes used |
| Blinding (performance bias and detection bias) | Low risk | Only pharmacist was aware of the identify of solutions, all other personnel were blinded |
| Blinding of outcome assessment (detection bias) | Low risk | Outcome assessors were blinded |
| Incomplete outcome data (attrition bias) | Low risk | Outcome reported for all randomized infants |
| Selective reporting (reporting bias) | Unclear risk | The study protocol was not available to us so we could not judge whether there were any deviations from it |
| Other bias | Low risk | Appears free of other bias |
| Methods | Randomized, double‐blind, placebo‐controlled trial Painful intervention: heel lance and venipuncture Study location: NICU of Osaka Medical College, Osaka, Japan Study period: November 1999 to March 2000 | |
| Participants | 100 healthy, full‐term infants ≥ 37 weeks' PMA | |
| Interventions | 1 mL sterile water 2 min before heel lance (n = 25) 1 mL 50% sucrose 2 min before heel lance (n = 25) 1 mL sterile water 2 min before venipuncture (n = 25) 1 mL 50% sucrose 2 min before venipuncture (n = 25) | |
| Outcomes | NFCS score after skin puncture, during blood sampling and during compression to stop bleeding; duration of first cry, ratio of crying to no crying, total procedure time | |
| Notes | Intergroup comparisons were performed by the Kruskal‐Wallis test Mann Whitney U test for continuous variables or by the Chi2 test for categorical data Results were reported as medians and ranges and means and SDs. P values were reported Adverse effects were evaluated for the procedure itself, not sucrose | |
| Risk of bias | ||
| Bias | Authors' judgement | Support for judgement |
| Random sequence generation (selection bias) | Unclear risk | Sequence generation not described |
| Allocation concealment (selection bias) | High risk | 100 sealed envelopes. Did not state if they were opaque and sequentially numbered |
| Blinding (performance bias and detection bias) | Low risk | Sucrose and water solutions were administered blindly |
| Blinding of outcome assessment (detection bias) | Low risk | Blinded outcome assessments |
| Incomplete outcome data (attrition bias) | Low risk | Outcome data provided for all randomized infants |
| Selective reporting (reporting bias) | Unclear risk | The study protocol was not available to us so we could not judge whether there were any deviations from it |
| Other bias | Low risk | Appeears free of other bias |
| Methods | Randomized, blinded, cross‐over trial Painful intervention: heel lance Study location: NICU, Istanbul, Turkey Study period: not stated | |
| Participants | 31 preterm infants: mean (SD) PMA 30.5 weeks (2.7); PNA 20 days (16) | |
| Interventions | 2 mL sterile water All solutions were given 2 min before heel lance. The infants were tested 3 times in a cross‐over manner | |
| Outcomes | HR, respiratory rate, oxygen saturation and NFCS score at baseline, heel lance and at 1, 2, 3 and 4 min post heel lance; duration of first cry and total crying time | |
| Notes | The differences in duration of crying time and blood collection were analyzed using the Friedman test Results were reported as means and SDs Adverse effects were not evaluated | |
| Risk of bias | ||
| Bias | Authors' judgement | Support for judgement |
| Random sequence generation (selection bias) | Low risk | Envelopes drawn randomly to determine sequence |
| Allocation concealment (selection bias) | High risk | Allocated by sealed envelopes. Solutions contained in identical bottles coded by nurse who was not part of the study. Did not mention whether envelopes were opaque or sequentially numbered |
| Blinding (performance bias and detection bias) | Low risk | Sucrose and water solutions were provided blinded to staff |
| Blinding of outcome assessment (detection bias) | Low risk | Quote: “Videotape records were later analyzed by two observers who were not aware of which solution was used. Each observer assessed the data independently and could not communicate their findings to the other.” |
| Incomplete outcome data (attrition bias) | Low risk | Outcomes reported on all randomized infants |
| Selective reporting (reporting bias) | Unclear risk | The study protocol was not available to us so we could not judge whether there were any deviations from it |
| Other bias | Low risk | Appears free of other bias |
| Methods | Double‐blind RCT Painful intervention: heel lance Study location: Department of Obstetrics and Gynaecology, Aalborg University Hospital, Aalborg, Denmark Study period: 3 months (dates not provided) | |
| Participants | 100 newborn term infants, mean age 6 days (range 4 to 9) | |
| Interventions | 2 mL 50% sucrose solution via syringe into the mouth over 30 s, 2 min prior to heel lance (n = 50) | |
| Outcomes | NIPS score, crying time (duration of first cry, crying time during heel lance, fraction of crying during sampling, crying time during first minute after end of sampling, total crying time), NIPS 1 min after heel lance and 1 min after blood sampling, change in HR at 0 min and 1 min, change in oxygen saturation at 0 min and 1 min | |
| Notes | Results were reported as medians and 5% and 95% percentiles ‐ we did not attempt to convert to means and SDs. Four infants were excluded after randomisation due to failure of the videotaping leaving 96 newborns for analysis; sucrose n = 49; placebo n = 47 | |
| Risk of bias | ||
| Bias | Authors' judgement | Support for judgement |
| Random sequence generation (selection bias) | Unclear risk | Sequence generation not described |
| Allocation concealment (selection bias) | Low risk | 100 syringes manufactured at random to contain sucrose or water. Numbered and administered consecutively. Contents were unknown to investigators and parents |
| Blinding (performance bias and detection bias) | Low risk | Sucrose and water solutions were administered blinded to investigators and parents |
| Blinding of outcome assessment (detection bias) | Low risk | Blinding of outcome assessments |
| Incomplete outcome data (attrition bias) | Low risk | 4 infants were excluded due to failure of videotaping, leaving 96 newborns for analysis |
| Selective reporting (reporting bias) | Unclear risk | The study protocol was not available to us so we could not judge whether there were any deviations from it |
| Other bias | Low risk | Appears free of other bias |
| Methods | RCT Painful intervention: OG tube insertion Study location: NICUs of Kalawati Saran Children's Hospital, Lady Hardinge Medical College, New Delhi, India Study period: not stated | |
| Participants | 120 clinically stable preterm infants (< 37 weeks PMA) were enrolled within the first 7 postnatal days, they had not received any painful stimulus 30 min prior to intervention, and required routine OG tube insertion. 105 infants were analyzed | |
| Interventions | 1 mL 24% sucrose administered to the tongue 2 min before OG tube insertion. Total number randomized: n = 60; final analysis n = 53 1 mL distilled water administered to the tongue 2 min before OG tube insertion. Total number randomized: n = 60; final analysis n = 52 | |
| Outcomes | The primary outcome was the response to the pain, assessed by the PIPP scale, prior to the procedure, during the procedure, and at 30 s, 1 min and 2 min postprocedure Secondary outcomes were the maximum HR and minimum oxygen saturation recorded during the procedure | |
| Notes | ||
| Risk of bias | ||
| Bias | Authors' judgement | Support for judgement |
| Random sequence generation (selection bias) | Low risk | Used block randomization with computer generated random sequences and a block size of 4 |
| Allocation concealment (selection bias) | Low risk | Allocation concealment was done by the hospital pharmacy which packed 2 mL of the sucrose and the double distilled water into syringes and provided opaque sealed envelopes sequentially labelled according to randomization code |
| Blinding (performance bias and detection bias) | Low risk | 2 min prior to the procedure, 1 mL of the solution marked with infant's serial number was administered orally to the infant by a healthcare provider (blinded to the contents of the solution) |
| Blinding of outcome assessment (detection bias) | Low risk | A consultant of the unit, who was unrelated to the study and was blinded to the study methodology, evaluated the video‐recordings and assigned the PIPP scores |
| Incomplete outcome data (attrition bias) | Low risk | 6 infants were excluded from the sucrose group as the monitor malfunctioned, and 1 infant in the sucrose group went into sudden cardiorespiratory arrest and had to be excluded. In the water group the OGT was displaced before the 2 min post procedure PIPP scores could be assigned for 3 infants, and the monitor malfunctioned for 5 infants. 53 infants were analyzed in the sucrose group and 52 in the water group (88% of enrolled infants) |
| Selective reporting (reporting bias) | Low risk | The protocol for the study was available to us and there did not seem to be any deviation from the protocol. ClinicalTrials.gov (Registration number: NCT 00949104) |
| Other bias | Low risk | Appears free of other bias |
| Methods | RCT Stressful intervention: echocardiography Study location: a level III NICU in Gujarat, India Study period: August to November 2013 | |
| Participants | 104 neonates with established enteral feeding, not on any respiratory support and with PMA between 32 and 42 weeks requiring echocardiography Exclusion criteria: neonates who were nil by mouth, had poor neurological status, and those who were paralysed or sedated with pharmacological agents | |
| Interventions | Sucrose group: Arbineo 24% w/v oral solution, dose: 1 mL for infants 32 to 40 weeks PMA, 2 mL for infants > 40 weeks PMA, administered 2 min prior to echocardiography by a dropper Control group: no medication or placebo | |
| Outcomes | PIPP, adverse events | |
| Notes | ||
| Risk of bias | ||
| Bias | Authors' judgement | Support for judgement |
| Random sequence generation (selection bias) | Low risk | Computer generated using GraphPad software |
| Allocation concealment (selection bias) | High risk | Sealed opaque envelopes but not stated if they were sequentially numbered |
| Blinding (performance bias and detection bias) | High risk | Could not be blinded |
| Blinding of outcome assessment (detection bias) | Low risk | The investigators performing the video analysis were blinded to group allocation |
| Incomplete outcome data (attrition bias) | Low risk | All enrolled infants were analyzed |
| Selective reporting (reporting bias) | Unclear risk | The study was not entered into a trials registry and the protocol for the study was not available to us. We could not judge if there was a deviation from the protocol or not |
| Other bias | Low risk | Appears free of other bias |
| Methods | Randomized, double‐blind, placebo‐controlled, cross‐over study Study intervention: heel lance Study location: Leeds General Infirmary, Leeds, UK Study period: not stated | |
| Participants | 15 infants (32 to 34 weeks' PMA) > 24 h of age | |
| Interventions | 1 mL 25% sucrose via syringe into mouth 2 min prior to heel lance | |
| Outcomes | Duration of first cry (s) following heel lance, percentage of time crying 5 min after heel lance, HR (at ‐2, 0, 1, 3, 5 min from heel lance), behavioural scores (4 facial expressions and the presence of cry at ‐2, 0, 1, 3, 5 min from heel lance) | |
| Notes | Medians and ranges were reported for duration of first cry, percentage cry over 5 min and HR. For composite behavioural outcome scores data were presented in graph form only with no indication if data represented medians or means. Wilcoxon matched pairs signed rank test used to evaluate outcomes | |
| Risk of bias | ||
| Bias | Authors' judgement | Support for judgement |
| Random sequence generation (selection bias) | Unclear risk | Sequence generation not described |
| Allocation concealment (selection bias) | Unclear risk | Allocation concealment not described |
| Blinding (performance bias and detection bias) | Unclear risk | Unsure if staff were blinded to sucrose and water solutions |
| Blinding of outcome assessment (detection bias) | Unclear risk | Unsure of whether outcome assessments were performed blinded |
| Incomplete outcome data (attrition bias) | Low risk | Results reported for all randomized infants |
| Selective reporting (reporting bias) | Unclear risk | The study protocol was not available to us so we could not judge whether there were any deviations from it |
| Other bias | Low risk | Appears free of other bias |
| Methods | Randomized, single‐blind, placebo‐controlled trial Painful intervention: heel lance Study location: Leeds General Infirmary, Leeds, UK Study period: not stated | |
| Participants | 60 infants (37 to 42 weeks' PMA) 2 to 5 days old | |
| Interventions | 2 mL 25% sucrose via syringe into mouth 2 min prior to heel lance (n = 15) | |
| Outcomes | Duration of first cry (s) following heel lance, percentage time crying over 3 min following heel lance, percentage change in HR over 7 min (‐2, 0, 1, 3, 5 min from heel lance), behavioural scores (4 facial expressions and the presence of cry (‐2, 0, 1, 3, 5 min after heel lance) | |
| Notes | Results were presented as medians and IQRs for the pain score. For cry duration and percentage crying over 3 min the data were presented as medians and IQRs. Percentage change in HR was reported in graph form without indicating whether the data represented means or medians with SDs or errors. Mann‐Whitney U test used to evaluate outcomes | |
| Risk of bias | ||
| Bias | Authors' judgement | Support for judgement |
| Random sequence generation (selection bias) | Unclear risk | Sequence generation not described |
| Allocation concealment (selection bias) | Unclear risk | Allocation concealment not described |
| Blinding (performance bias and detection bias) | Low risk | Investigators were blind to the nature of the sucrose and water solutions, but the Calpol could not be disguised because of its pink colour |
| Blinding of outcome assessment (detection bias) | Low risk | Outcome assessments were performed blinded to groups for sucrose and water but not for Calpol |
| Incomplete outcome data (attrition bias) | Low risk | Outcomes reported for all randomized infants |
| Selective reporting (reporting bias) | Unclear risk | The study protocol was not available to us so we could not judge whether there were any deviations from it |
| Other bias | Low risk | Appears free of other bias |
| Methods | Randomized, double‐blind, placebo‐controlled, cross‐over trial for the mode of delivery of sucrose or water by mouth or intragastrically Painful intervention: heel lance Study location: Leeds General Infirmary, Leeds, UK Study period: Dates not provided | |
| Participants | 30 preterm infants (PMA 32 to 36 weeks, PNA < 24 h) | |
| Interventions | Each infant received either sucrose or water and was not crossed over for the solution received, only for the method of delivery Sucrose group (n = 15): 25% sucrose solution (volume not reported) given via syringe into the mouth or via NG tube 2 min prior to first heel lance, and via the alternate route for the second heel lance within 48 h | |
| Outcomes | Percentage crying over 5 min after sampling, behavioural scores (4 facial expressions and the presence of cry) at 1, 3 and 5 min after the lance for a total behavioural score | |
| Notes | Mann Whitney‐U and Wilcoxon matched pairs signed ranked test used to evaluate outcomes | |
| Risk of bias | ||
| Bias | Authors' judgement | Support for judgement |
| Random sequence generation (selection bias) | Unclear risk | Sequence generation not described |
| Allocation concealment (selection bias) | Unclear risk | Allocation concealment not described |
| Blinding (performance bias and detection bias) | Unclear risk | Did not describe measures taken to ensure blinding of intervention and outcome assessment |
| Blinding of outcome assessment (detection bias) | Unclear risk | Did not describe measures taken to ensure blinding of intervention and outcome assessment |
| Incomplete outcome data (attrition bias) | Low risk | Outcomes reported on all randomized infants |
| Selective reporting (reporting bias) | Unclear risk | The study protocol was not available to us so we could not judge whether there were any deviations from it |
| Other bias | Low risk | Appears free of other bias |
| Methods | Randomized, double‐blind trial Painful intervention: bladder catheterization Study location: a single tertiary‐care dedicated paediatric emergency department, USA Study period: June 2003 to November 2004 | |
| Participants | 83 infants ≤ 90 days old, born at least 34 weeks' PMA were enrolled and randomized, 3 infants were withdrawn after randomization Separated into 3 age groups:
| |
| Interventions | 2 mL 24% sucrose via syringe 2 min before bladder catheterization (n = 40) 2 mL sterile water via syringe 2 min before bladder catheterization (n = 40) | |
| Outcomes | DAN scale, percentage cry, time to return to behavioural baseline | |
| Notes | Post hoc subgroup analyses, t‐tests, Chi2 tests, Mann‐Whitney test, ANOVA and Breslow‐Day (BD) test for homogeneity used to evaluate outcomes Results were reported as means and SDs. P values were reported Adverse events were evaluated; no adverse effects experienced | |
| Risk of bias | ||
| Bias | Authors' judgement | Support for judgement |
| Random sequence generation (selection bias) | Low risk | Sequence generated by random number table |
| Allocation concealment (selection bias) | Low risk | Syringes were coded by pharmacy and solutions were indistinguishable |
| Blinding (performance bias and detection bias) | Low risk | Staff blinded to sucrose and water solutions |
| Blinding of outcome assessment (detection bias) | Low risk | Research nurses were blinded to the treatment allocation |
| Incomplete outcome data (attrition bias) | Low risk | 83 infants were enrolled and randomized, but 3 were withdrawn after randomizations as a result of inappropriate enrolment or withdrawal of consent |
| Selective reporting (reporting bias) | Unclear risk | The study protocol was not available to us so we could not judge whether there were any deviations from it |
| Other bias | Low risk | Appears free of other bias |
| Methods | Prospective RCT Painful intervention: screening for ROP Study location: NICU at a university‐affiliated hospital, Amarillo, Texas, USA Study period: not stated | |
| Participants | 30 infants < 32 weeks' GA or weighing < 1500 g Sucrose group mean GA 29.57 weeks (range 26 to 32) Control group mean GA 28.8 weeks (range 25 to 31) | |
| Interventions | Sucrose group: swaddled in a warm blanket, pacifier packed with gauze soaked in 24% sucrose and held by a nurse until 15 min after the eye examination Control: no swaddling, no sucrose and not held by nurse All infants received eye drop instillation of 0.5% proxymetacaine and 1% tropicamide, then 15 min later eye drop instillation of 0.5% tropicamide and 2.5% phenylephrine All eye drops were instilled into both infant's eyes before the ROP examination | |
| Outcomes | Pulse rate, respiratory rate and oxygen saturation at baseline (30 min before instillation of proxymetacaine), 5 min before eye examination, 3 different times during eye examination and 5 min after the completion of the examination; total crying time; time required to return to baseline value | |
| Notes | ANOVA and Wilcoxon signed rank test and the Pearson test were used to evaluate outcomes Results were reported as medians, means and standard errors of the means (SEM). P values were also reported Adverse events were not evaluated | |
| Risk of bias | ||
| Bias | Authors' judgement | Support for judgement |
| Random sequence generation (selection bias) | Unclear risk | Sequence generation not described |
| Allocation concealment (selection bias) | Unclear risk | Allocation concealment not described |
| Blinding (performance bias and detection bias) | High risk | No blinding to interventions |
| Blinding of outcome assessment (detection bias) | Low risk | Outcome assessments blinded |
| Incomplete outcome data (attrition bias) | Unclear risk | Pulse rate, respiratory rate data not reported |
| Selective reporting (reporting bias) | Unclear risk | Pulse rate, respiratory rate data not reported |
| Other bias | Low risk | Appears free of other bias |
| Methods | Randomized, double‐blind, placebo‐controlled study Painful intervention: heel lance Study setting: Leeds General Infirmary, Leeds, UK Study period: not stated | |
| Participants | 52 infants, 37 to 42 weeks' PMA, 2 to 7 days old | |
| Interventions | 2 mL 7.5% sucrose administered by a dropper into the mouth over a 1‐min period prior to heel lance (n = 26) | |
| Outcomes | Percentage time crying during sampling and 3 min following the completion of the heel lance recorded on a standard audio tape recorder and analyzed blindly at a later date | |
| Notes | Results presented as medians only with no ranges | |
| Risk of bias | ||
| Bias | Authors' judgement | Support for judgement |
| Random sequence generation (selection bias) | Unclear risk | Sequence generation not described |
| Allocation concealment (selection bias) | Unclear risk | Allocation concealment not described |
| Blinding (performance bias and detection bias) | Unclear risk | Not clear whether staff were blinded to sucrose and water solutions |
| Blinding of outcome assessment (detection bias) | Low risk | Blinding of outcome assessments |
| Incomplete outcome data (attrition bias) | Low risk | Outcomes reported for all randomized infants |
| Selective reporting (reporting bias) | Unclear risk | The study protocol was not available to us so we could not judge whether there were any deviations from it |
| Other bias | Low risk | Appears free of other bias |
| Methods | RCT Painful intervention: heel lance Study location: neonatal ward of Amphia Hospital, a secondary health care centre in Breda, the Netherlands Study period: January 2010 to May 2011 | |
| Participants | 71 preterm infants, PMA 32 to 36 6/7 weeks at birth undergoing heel lance with an automated piercing device | |
| Interventions | Sucrose group (n= 25; 24 analyzed): neonates lay in their cots and received 1 mL to 2 mL 24% sucrose solution 2 min before the heel lance, combined with NNS and Newborn Individualized Developmental Care and Assessment Breastfed group (n = 23; all analyzed): infants were breastfed while held in mothers' arms, heel lance was performed after continuous sucking was observed (i.e. during feeding) Bottle‐fed group (n = 23; all analyzed): infants were bottle‐fed breast milk. The non‐breast feeding group infants were held in arms of an experienced nurse and were given supplemental breast milk by a sterile syringe and heel lance was performed after continuous sucking was observed | |
| Outcomes | PIPP score; COMFORTneo Score, HR and SpO2 | |
| Notes | ||
| Risk of bias | ||
| Bias | Authors' judgement | Support for judgement |
| Random sequence generation (selection bias) | Low risk | Randomization sequence was created by using a fixed block size of 8 for a maximum of 75 neonates with a 1:1:1 allocation |
| Allocation concealment (selection bias) | Low risk | Neonates were allocated to 1 of the 3 groups according to the method of sequentially numbered and opaque sealed envelopes created by an independent employee and masked for the investigator |
| Blinding (performance bias and detection bias) | High risk | It was not possible to blind investigators for the allocated intervention |
| Blinding of outcome assessment (detection bias) | High risk | It was not possible to blind investigators for the allocated intervention |
| Incomplete outcome data (attrition bias) | Low risk | 1 infant was excluded from the sucrose group |
| Selective reporting (reporting bias) | Low risk | This trial was registered at www.clinicaltrials.gov (identifier NCT01276366). There did not seem to be any deviations from the protocol |
| Other bias | Low risk | Appears free of other bias |
| Methods | Randomized, prospective study Painful intervention: heel lance Study location: Elizabeth Garret Anderson Wing, University College Hospital, London, UK Study period: 25 February 2009 to 25 March 2010 | |
| Participants | 59 infants; 29 assigned to sucrose group and 30 to water group 44 term infants 37 to 43 weeks' PMA, < 8 days old were included in the analysis of the primary outcome (pain‐specific brain activity recorded with electroencephalography and identified by principal component analysis) | |
| Interventions | Sucrose group (n = 20): 0.5 mL 24% sucrose given via syringe Water group (n = 24): 0.5 mL sterile water | |
| Outcomes | HR change, PIPP score, nociceptive‐specific brain activity, latency to change in facial expression(s), facial non‐responders, nociceptive reflex withdrawal activity | |
| Notes | ||
| Risk of bias | ||
| Bias | Authors' judgement | Support for judgement |
| Random sequence generation (selection bias) | Low risk | Computer‐generated randomized code |
| Allocation concealment (selection bias) | Low risk | Only the hospital pharmacy had access to the randomization codes that could be used to identify the solution. A sealed copy of the randomization chart was also stored in the neonatal unit in case an adverse event was reported |
| Blinding (performance bias and detection bias) | Low risk | Participants, personnel and outcome assessors blinded |
| Blinding of outcome assessment (detection bias) | Low risk | Outcome assessors blinded |
| Incomplete outcome data (attrition bias) | High risk | 59 infants were enrolled, but the primary outcome was ascertained in 44 infants (75%) |
| Selective reporting (reporting bias) | Unclear risk | The study protocol was not available to us so we could not judge whether there were any deviations from it |
| Other bias | Low risk | Appears free of other bias |
| Methods | Prospective, randomized, double‐blind, placebo‐controlled trial Painful intervention: circumcision Study location: Fairview Riverside Medical Center, Minneapolis, Minnesota, USA Study period: 1993 to 1994 | |
| Participants | 80 healthy term male newborns, mean PMA 39.5 weeks, mean PNA 31.5 h | |
| Interventions | DPNB with non‐buffered lidocaine (0.8 mL lidocaine, 0.2 mL saline), new padded restraint chair and pacifier dipped in water (n = 20) DPNB with buffered lidocaine (0.8 mL lidocaine, 0.2 mL sodium bicarbonate), rigid plastic restraint chair and pacifier dipped in water (n = 20) DPNB with non‐buffered lidocaine (0.8 mL lidocaine, 0.2 mL saline), rigid plastic restraint chair and pacifier dipped in 24% sucrose (n = 20) DPNB with non‐buffered lidocaine (0.8 mL lidocaine, 0.2 mL saline), rigid plastic restraint chair and pacifier dipped in water (n = 20) | |
| Outcomes | Behavioural Distress Scale (scores prior to injection, at injection for DPNB, 2 min post injection, 4 min post injection and at circumcision); plasma cortisol level (30 min after start of circumcision); percentage of sleep during circumcision | |
| Notes | Results were reported as mean and SDs Adverse effects were not evaluated | |
| Risk of bias | ||
| Bias | Authors' judgement | Support for judgement |
| Random sequence generation (selection bias) | Unclear risk | Sequence generation not described |
| Allocation concealment (selection bias) | Unclear risk | Allocation concealment not described |
| Blinding (performance bias and detection bias) | Low risk | Sucrose and water solutions blinded |
| Blinding of outcome assessment (detection bias) | Low risk | Blinding of outcome assessments |
| Incomplete outcome data (attrition bias) | Unclear risk | Data results did not specify number of infants with data |
| Selective reporting (reporting bias) | Unclear risk | The study protocol was not available to us so we could not judge whether there were any deviations from it |
| Other bias | Low risk | Appears free of other bias |
| Methods | Randomized, cross‐over, controlled trial Painful intervention: heel lance Study location: NICUs of 3 metropolitan university‐affiliated teaching hospitals and 1 children's hospital in Canada and the USA Study period: a 15‐month period (dates not given) | |
| Participants | 122 preterm neonates, 27 to 31 weeks' PMA, < 28 days old | |
| Interventions | Each infant received all 4 interventions in a random order (serving as his/her own control); there was 1 control intervention and 3 treatment interventions
| |
| Outcomes | PIPP | |
| Notes | Repeated measures ANOVA and ANCOVA used to evaluate efficacy of treatment interventions The first author provided us with unpublished information regarding the study methods. | |
| Risk of bias | ||
| Bias | Authors' judgement | Support for judgement |
| Random sequence generation (selection bias) | Low risk | Computer generated sequence |
| Allocation concealment (selection bias) | Low risk | Allocation was enclosed in sealed, opaque envelopes |
| Blinding (performance bias and detection bias) | Low risk | The study solutions were prepared in each of the study units by the Pharmacist and labelled as Study Solution 1 and 2. The research nurses (who performed the heel lance and administered each intervention) drew up the solution specified in the intervention sequence from a dark coloured bottle, so were blind to which solution (e.g. water or 24% sucrose) was used. Nurses were not blind to the prone positioning or control |
| Blinding of outcome assessment (detection bias) | Low risk | The study nurse collected all of the data (e.g. videotaped facial expressions, recorded cry) and was blind to study solutions; the data coders were also blinded to which study solution was used ‐ but NOT to the prone positioning or control, as they could visualize this on the videotapes. The data analysts were blinded to all of the interventions |
| Incomplete outcome data (attrition bias) | Low risk | Outcomes reported for all randomized infants |
| Selective reporting (reporting bias) | Low risk | The primary author assured us that there were no deviations from the protocol |
| Other bias | Low risk | Appears free of other bias |
| Methods | Prospective RCT Painful intervention: heel lance and other procedures Study location: 1 tertiary‐level NICU in Canada Study period: not stated | |
| Participants | 66 preterm infants, 26 to 30 weeks' PMA, < 72 h PNA | |
| Interventions | No intervention (N = 22) 0.1 mL sterile water via syringe and pacifier (n = 21) Solutions were given 2 min before every procedure during the first 28 days of life | |
| Outcomes | PIPP, neonatal clinical outcomes and neurobiological risk scores | |
| Notes | Actual PIPP scores (mean, standard deviation) were not reported. PIPP scores were analyzed by RMANOVA. Chi2 analyses were used to compare the incidence of immediate and long‐term adverse events Adverse events were evaluated. Adverse events were reported as 'low' and all immediate adverse events resolved spontaneously | |
| Risk of bias | ||
| Bias | Authors' judgement | Support for judgement |
| Random sequence generation (selection bias) | Low risk | Computer‐generated table of random numbers |
| Allocation concealment (selection bias) | Low risk | Delivered to baby by pharmacist. Solutions carried in dark glass bottles. Water and sucrose solutions appeared to be the same |
| Blinding (performance bias and detection bias) | Low risk | Staff were blinded to sucrose and water solutions |
| Blinding of outcome assessment (detection bias) | Low risk | Blinding of outcome assessments |
| Incomplete outcome data (attrition bias) | Low risk | 2 infants dropped out of the study prior to any data collection |
| Selective reporting (reporting bias) | Unclear risk | The study protocol was not available to us so we could not judge whether there were any deviations from it |
| Other bias | Low risk | Appears free of other bias |
| Methods | RCT Painful intervention: heel lance Study location: Section of Neonatology, Department of Paediatrics, the National Hospital, Oslo, Norway Study period: not reported | |
| Participants | 48 preterm infants, median PMA 32 weeks, median PNA 14 days | |
| Interventions | 2 mL 15% sucrose (n = 12) | |
| Outcomes | Changes from before heel lance to during heel lance for: crying time, changes in behavioural state, skin conductance, HR | |
| Notes | Paired non‐parametric tests (Wilcoxon test) used to compare the infant's intervention and control session | |
| Risk of bias | ||
| Bias | Authors' judgement | Support for judgement |
| Random sequence generation (selection bias) | Unclear risk | Sequence generation not described |
| Allocation concealment (selection bias) | Unclear risk | Allocation concealment not described. Randomly divided into 4 groups |
| Blinding (performance bias and detection bias) | Unclear risk | 2 groups fasting; 2 groups fed (milk) during the last hour prior to heel lanceup via NG tube |
| Blinding of outcome assessment (detection bias) | Unclear risk | Did not provide any information about blinding of assessor |
| Incomplete outcome data (attrition bias) | Unclear risk | No information on number of participants included in the Methods or Results sections. Results in figures and P values only. Presented no data that could be meta‐analysed |
| Selective reporting (reporting bias) | Unclear risk | The study protocol was not available to us, so we could not judge whether there were any deviations from it |
| Other bias | Low risk | Appears free of other bias |
| Methods | RCT Painful intervention: vaccination pain (hepatitis B) Study location: Shahid Mostafa Khomini Hospital of Ilam, Islamic Republic of Iran Study period: May 2013 to June 2013 | |
| Participants | 90 full‐term neonates, who were not receiving analgesics, not receiving nutrition during 30 min before vaccination and absence of diarrhoea and common cold | |
| Interventions | The hepatitis B vaccine was injected 2 min after administration of sucrose, glucose or no treatment and pain severity measured by the NIPS scale during 1‐2 min Sucrose group (n = 30): 2 mL 25% sucrose through a syringe in 30 s Glucose group (n = 30): 2 mL 25% glucose through a syringe in 30 s Control group (n = 30): no intervention | |
| Outcomes | NIPS during 1‐2 min after vaccine injection | |
| Notes | ||
| Risk of bias | ||
| Bias | Authors' judgement | Support for judgement |
| Random sequence generation (selection bias) | Unclear risk | The cases were randomly (simple randomization method) divided into 3 groups of 30 neonates each |
| Allocation concealment (selection bias) | Unclear risk | No information provided |
| Blinding (performance bias and detection bias) | High risk | The cases were randomly (simple randomization method) divided into 3 groups of 30 neonates each |
| Blinding of outcome assessment (detection bias) | High risk | The cases were randomly (simple randomization method) divided into 3 groups of 30 neonates each |
| Incomplete outcome data (attrition bias) | Low risk | NIPS reported on all 90 infants |
| Selective reporting (reporting bias) | Low risk | The registered protocol was available to us and there did not seem to have been any deviation from the protocol. IRCT 201304096790N3). Date registered: 22 May 2013. Registration timing: Registration while recruiting |
| Other bias | Low risk | Appears free of other bias |
| Methods | Double‐blind, RCT Painful intervention: IM injections, venipunctures and heel lances Study location: Mount Sinai Hospital, Toronto, Ontario, Canada Study period: 15 September 2003 to 27 July 2004 | |
| Participants | 240 newborns, mean PMA 38.7 to 39.9 weeks, mean PNA 0.5 h to 0.8 h | |
| Interventions | 2 mL 24% sucrose given to newborns of non‐diabetic mothers (n = 60) 2 mL sterile water given to newborns of non‐diabetic mothers (n = 60) 2 mL 24% sucrose given to newborns of diabetic mothers (n = 60) 2 mL sterile water given to newborns of diabetic mothers (n = 60) Solutions were given before all IM injections, venipunctures and heel lances during the first 2 days of life | |
| Outcomes | PIPP score during procedure | |
| Notes | Student's t‐test used to compare average PIPP scores between groups. Post hoc analyses were performed after adjusting for baseline characteristics by use of a general linear model for IM injection and venipuncture and linear mixed‐model analysis for heel lances. Adverse events were analyzed using the Chi2 test or the Student t‐test Adverse effects were reported ‐ no significant differences between groups in the incidence of adverse events, which included spitting up and blood glucose levels | |
| Risk of bias | ||
| Bias | Authors' judgement | Support for judgement |
| Random sequence generation (selection bias) | Low risk | Random numbers table: allocation was done on a 1:1:1 basis |
| Allocation concealment (selection bias) | Low risk | Centralized at the hospital pharmacy. Solutions carried in identical bottles only labelled with patient identification |
| Blinding (performance bias and detection bias) | Low risk | Staff were blinded to sucrose and water solutions |
| Blinding of outcome assessment (detection bias) | Low risk | Outcome assessments blinded |
| Incomplete outcome data (attrition bias) | Low risk | Results reported for all randomized infants |
| Selective reporting (reporting bias) | Unclear risk | The study protocol was not available to us so we could not judge whether there were any deviations from it |
| Other bias | Low risk | Appears free of other bias |
| Methods | RCT Painful intervention: venipuncture Study location: Mother and Infant Unit, Mount Sinai Hospital, Toronto, Ontario, Canada Study period: 20 August 2007 to 22 February 2009 | |
| Participants | 330 infants mean PMA (SD) 39.5 weeks (1.2) Liposomal lidocaine group (n = 110) mean PMA (SD) 39.6 weeks (1) Sucrose group (n = 110) mean PMA (SD) 39.6 weeks (1.3) Sucrose liposomal lidocaine group (n = 110) mean PMA (SD) 39.6 weeks (1.3) | |
| Interventions | Liposomal lidocaine group: 1 g liposomal lidocaine 4% cream to the dorsum of the hand, occluded by a dressing (Tegaderm) for 30‐40 min Sucrose group: 2 mL 24% sucrose solution, administered by mouth using a syringe over 1‐2 min Sucrose liposomal lidocaine group: both sucrose and liposomal lidocaine as described above Placebos were used for liposomal lidocaine and sucrose (i.e. double‐dummy design), so that all infants received a topically administered cream (liposomal lidocaine or placebo cream) and oral solution (sucrose or placebo water) | |
| Outcomes | Facial grimacing, cry duration (s),observer‐rated pain using a visual analogue scale (VAS) (0 to 10 cm), HR (beats/min), oxygen saturation (%) | |
| Notes | Reported no significant adverse effects | |
| Risk of bias | ||
| Bias | Authors' judgement | Support for judgement |
| Random sequence generation (selection bias) | Low risk | Random number table used |
| Allocation concealment (selection bias) | Low risk | Concealment of treatment allocation was achieved by carrying out randomization and dispensing functions offsite |
| Blinding (performance bias and detection bias) | Low risk | Participants and personnel blinded |
| Blinding of outcome assessment (detection bias) | Low risk | Outcome assessors blinded |
| Incomplete outcome data (attrition bias) | Low risk | Efficacy outcomes were not reported in 9 infants and safety outcomes were not repotted in 2 infants |
| Selective reporting (reporting bias) | Unclear risk | The study protocol was not available to us so we could not judge whether there were any deviations from it |
| Other bias | Low risk | Appears free of other bias |
| Methods | RCT Painful intervention: heel lance Study location: tertiary‐level NICU in Western India Study period; 1 year, dates not stated | |
| Participants | Participants were full‐term infants (>37 weeks PMA), with birthweight > 2200 g, > 24 h old and were exclusively breastfed Exclusion criteria: neonates with history of birth asphyxia, sepsis, meningitis, respiratory distress, congenital malformations, receiving nil by mouth, being mechanically ventilated and who received any pharmacological agent for analgesia in the 72 h before enrolment | |
| Interventions | Sucrose group (n = 45): 30% sucrose solution delivered by sterile syringe Sucrose + NNS (n = 45): 30% sucrose solution delivered by sterile syringe plus NNS NNS group (n = 45): sterile gauze was held gently in neonate’s mouth and the palate tickled to stimulate sucking No treatment group (n = 45): received no treatment | |
| Outcomes | PIPP, total crying time. Results presented as medians and IQRs | |
| Notes | ||
| Risk of bias | ||
| Bias | Authors' judgement | Support for judgement |
| Random sequence generation (selection bias) | Low risk | Computer‐generated random‐sequence numbers |
| Allocation concealment (selection bias) | High risk | Opaque sealed envelopes were used. Did not say if the envelopes were sequentially numbered |
| Blinding (performance bias and detection bias) | High risk | Staff knew if the infants were given sucrose by syringe or if they were given NNS or no intervention. Quote: ” ... blinding was not possible because the interpreter was performing the procedure” |
| Blinding of outcome assessment (detection bias) | High risk | ” ... blinding was not possible because the interpreter was performing the procedure” |
| Incomplete outcome data (attrition bias) | Low risk | Outcomes reported for all randomized infants |
| Selective reporting (reporting bias) | Unclear risk | The study protocol was not available to us so we could not judge whether there were any deviations from it |
| Other bias | Low risk | Appears free of other bias |
| Methods | RCT Painful intervention: heel lance Study location: Hutzel Harper University Hospital, Detroit, MI, USA Study period 2005 to 2007 | |
| Participants | 56 term infants ≤ 7 days old: appropriate for PMA (weight between 5th to 95th percentile) scheduled to undergo routine heel lance for newborn metabolic screening | |
| Interventions | Sucrose group (n = 29): infants received 2.0 mL 24% sucrose orally Water group (n = 27): infants received sterile water orally Feedings were withheld 2.0 h prior to heel lance to minimize risk of aspiration. No infant received NNS (pacifiers) during the study | |
| Outcomes | Primary outcomes: mean skin blood flow; NIPS Skin blood flow, perfusion units measured by Laser Doppler Imager during heel lance HR, RR, oxygen saturation in blood | |
| Notes | ||
| Risk of bias | ||
| Bias | Authors' judgement | Support for judgement |
| Random sequence generation (selection bias) | Low risk | A computer‐generated block method |
| Allocation concealment (selection bias) | Low risk | Pharmacy Investigational Drug Service team at Hutzel Harper University Hospital maintained the double‐blinded randomization sequence |
| Blinding (performance bias and detection bias) | Low risk | A computer‐generated block method assigned infants to receive either 2 mL 24% sucrose or 2 mL sterile water placebo prior to heel lance |
| Blinding of outcome assessment (detection bias) | Low risk | Doses were dispensed in plastic oral syringes |
| Incomplete outcome data (attrition bias) | Low risk | In the sucrose group (n = 30) 1 infant was excluded secondary to withdrawn consent. In the placebo group (n = 30) 3 infants were not included: 1 had a significant Laser Doppler Imager scan artefact, 1 received oral acetaminophen prior to heel lance, and 1 developed persistent tachypnoea prior to the study |
| Selective reporting (reporting bias) | Unclear risk | We could not determine whether this study was registered in a trials registry, so we could not tell if there were any deviations from the protocol |
| Other bias | Low risk | Appears free of other bias. |
| Methods | Prospective RCT Painful intervention: heel lance Study location: Maternity Unit Hospital de Basurto, Bilbao, Vizcaya, Spain Study period: 3 months in 2007 | |
| Participants | 150 term infants | |
| Interventions | 2 mL 24% sucrose with NNS NNS with water Control: facilitated tucking | |
| Outcomes | Modified NFCS, mean crying time | |
| Notes | Paper translated from Spanish to English | |
| Risk of bias | ||
| Bias | Authors' judgement | Support for judgement |
| Random sequence generation (selection bias) | Unclear risk | Sequence generation not described |
| Allocation concealment (selection bias) | Unclear risk | Allocation concealment not described |
| Blinding (performance bias and detection bias) | Low risk | Staff were blinded to sucrose and water solutions |
| Blinding of outcome assessment (detection bias) | Unclear risk | It was unclear if outcome assessments were performed staff blinded to interventions |
| Incomplete outcome data (attrition bias) | Low risk | Outcomes reported for all randomized infants |
| Selective reporting (reporting bias) | Unclear risk | The study protocol was not available to us so we could not judge whether there were any deviations from it |
| Other bias | Unclear risk | Appears free of other bias |
| Methods | RCT Painful intervention: heel lance Study location: Trabzon Delivery and Children's Diseases Hospital, Erzurum, Turkey Study period: February 2007 to January 2008 | |
| Participants | 120 infants GA 37 to 42 weeks Sucrose group (n = 30): mean PMA (SD) 39.10 weeks (0.71) Mother's milk group (n = 30): mean PMA (SD) 39.10 weeks (1.03) Pacifier group (n = 30): mean PMA (SD) 39.20 weeks (0.93) Control group (n = 30): mean PMA (SD) 39.67 weeks(0.80) | |
| Interventions | Sucrose group: 2 mL 20% sucrose via syringe 2 min before the procedure (using a syringe with the needle removed and avoiding contact of the syringe with the mouth and lips) Mother's milk group: 2 mL mother's milk via syringe 2 min before the procedure (using a syringe with the needle removed and avoiding contact of the syringe with the mouth and lips) Pacifier group: given a pacifier Control group: newborns were in their mothers' lap; no interventions were made before the painful procedure | |
| Outcomes | NIPS score, HR, respiratory rate, crying time. Data were presented according to different procedure times and could not be used in meta‐analyses | |
| Notes | ||
| Risk of bias | ||
| Bias | Authors' judgement | Support for judgement |
| Random sequence generation (selection bias) | Unclear risk | Did not specify method of randomization |
| Allocation concealment (selection bias) | Unclear risk | Did not specify method of allocation concealment |
| Blinding (performance bias and detection bias) | Unclear risk | Did not report on blinding of personnel |
| Blinding of outcome assessment (detection bias) | Unclear risk | Did not report on blinding of outcome assessors |
| Incomplete outcome data (attrition bias) | Low risk | There were no withdrawals |
| Selective reporting (reporting bias) | Unclear risk | The study protocol was not available to us so we could not judge whether there were any deviations from it |
| Other bias | Low risk | Appears free of other bias |
| Methods | RCT Painful intervention: heel lance Study location: Marmara University Hosppital, Istanbul, Turkey Study period: September 1996 to January 1997 | |
| Participants | 102 healthy term infants, PMA 37 to 42 weeks, median PNA 1.6 days (range 1 to 15 days) | |
| Interventions | 2 mL 25% sucrose (n = 35) | |
| Outcomes | Median crying time 3 min after heel lance; percentage change in HR 1, 2, and 3 min after heel lance | |
| Notes | Kruskal‐Wallis 1‐way ANOVA used to assess differences between groups | |
| Risk of bias | ||
| Bias | Authors' judgement | Support for judgement |
| Random sequence generation (selection bias) | Unclear risk | Sequence generation not described |
| Allocation concealment (selection bias) | Unclear risk | Allocation concealment not described |
| Blinding (performance bias and detection bias) | Low risk | Sucrose and water solutions were administered blinded to staff, but human milk was probably not blinded to staff |
| Blinding of outcome assessment (detection bias) | Low risk | Blinding of outcome assessments |
| Incomplete outcome data (attrition bias) | Low risk | Outcome data provided on all randomized infants |
| Selective reporting (reporting bias) | Unclear risk | The study protocol was not available to us so we could not judge whether there were any deviations from it |
| Other bias | Low risk | Appears free of other bias |
Abbreviations
BF = breastfeeding
BPSN = Bernese Pain Scale for Neonates
DAN = Douleur Aiguë du Nouveau‐né Scale
DPNB = dorsal penile nerve block
EMLA = eutectic mixture of local anaesthetic (a topical mixture of lidocaine (2.5%) and prilocaine (2.5%) cream)
HR = heart rate
IM = intramuscular
IQR = interquartile range(s)
min = minute(s)
NAPI = Neurobehavioural Assessment of Preterm Infants
NFCS = Neonatal Facial Coding System
NG = nasogastric
NICU = neonatal intensive care unit
NIPS = Neonatal Infant Pain Scale
N‐PASS = Neonatal Pain Agitation and Sedation Scale
NNS = non‐nutritive sucking
PIPP = Premature Infant Pain Profile
PMA = postmenstrual age
PNA = postnatal age
RCT = randomised controlled trial
RR = respiratory rate
ROP = retinopathy of prematurity
SC = subcutaneous
SD = standard deviation
SpO2 = oxygen saturation
SSC = skin to skin contact
w/v = weight by volume
Characteristics of excluded studies [ordered by study ID]
| Study | Reason for exclusion |
| Available as an abstract only | |
| Although this was an RCT, 4 newborns were included twice (i.e. there were 55 events recorded for 51 participants), therefore, it was not possible to separate data for 51 newborns | |
| This was a non‐randomised study. A single cohort was studied. The intervention was a non‐sucrose sweetener | |
| The word 'random' does not appear anywhere in the text. It is unlikely that this is an RCT | |
| The age of the infants was 8.5 months | |
| Study did not include the use of sucrose | |
| Although an RCT, the authors did not provide information on the number of infants in each group. Results were presented in graph form without indicating whether means or medians were used. No standard deviations were presented | |
| Excluded based on PNA (2 and 4 months PNA) | |
| This manuscript was published previously in the European Journal of Pediatrics ("Comparison of sucrose and human milk on pain response in newborns" by Ors et al, Eur J Pediatr, 158:63‐66, 1999) and so, this article has been retracted by the Journal of Pain | |
| Although this was an RCT the number of neonates in each group was not stated | |
| This was a controlled trial without randomisation. The number of patients in each group was not stated | |
| Study not fully randomised | |
| This study used an artificial sweetener, glycine or breast milk as the intervention | |
| PNA 0 to 6 months | |
| PNA 0 to 48 months. A group < 1 month old could not be separated | |
| Study not fully randomised | |
| The noxious stimulus was heel stroke, which is non‐invasive | |
| Available as an abstract only | |
| Available as an abstract only | |
| An RCT cross‐over study in which no painful stimulus was applied to the neonates | |
| Not an RCT | |
| Available as an abstract only | |
| Available as an abstract only | |
| Non‐randomised study | |
| The infants in this study were too old for inclusion in this review (mean age 17.1 weeks) | |
| All infants received sucrose | |
| Randomised double blind cross‐over study. Data analyzed by paired t‐test. Results from the first exposure to sucrose or placebo could not be isolated | |
| Control group was not randomised | |
| This was a quasi‐randomised trial. "Healthy newborns (n = 142) were consecutively allocated to one of the six groups: ..." | |
| Immunisations performed at 2, 3 or 4 months, so infants were too old for this review | |
| Study not fully randomised | |
| Mean PNA 9.5 weeks | |
| Infants were too old for this review | |
| Dr Scaramuzzo informed us that “our randomisation method was simply one yes‐one not”. This was therefore a quasi‐randomised trial which we did not include in the review | |
| This study used glucose and breast milk as the interventions | |
| Available as an abstract only | |
| Available as an abstract only | |
| Not an RCT and included older infants | |
| Infants did not receive a painful procedure | |
| Population subset of a larger study already included in the review | |
| Sucrose was not used as an intervention | |
| Not fully randomised |
Abbreviations
PNA = postnatal age
RCT = randomised controlled trial
Characteristics of studies awaiting assessment [ordered by study ID]
| Methods | |
| Participants | |
| Interventions | |
| Outcomes | |
| Notes | Study awaiting classification ‐ written in Persian |
| Methods | |
| Participants | |
| Interventions | |
| Outcomes | |
| Notes | Study awaiting classification – written in Persian |
| Methods | |
| Participants | |
| Interventions | |
| Outcomes | |
| Notes | We have not been able to locate a copy of the article at libraries in Canada or the US. |
Characteristics of ongoing studies [ordered by study ID]
| Trial name or title | Trial of repeated analgesia with kangaroo care (TRAKC) |
| Methods | RCT |
| Participants | Infants < 36.0 weeks PMA |
| Interventions | Kangaroo mother care Sucrose Kangaroo mother care + sucrose |
| Outcomes | PIPP; NAPI |
| Starting date | June 2012 |
| Contact information | Marsha Campbell‐Yeo, RN, NNP, PhD; [email protected] |
| Notes | ClinicalTrials.gov Identifier: NCT01561547 |
| Trial name or title | RCT of sucrose analgesia for repeated capillary blood sampling |
| Methods | RCT Painful intervention: repeated capillary blood sampling |
| Participants | PMA or PNA not provided |
| Interventions | Sucrose Water |
| Outcomes | Outcome measures not provided |
| Starting date | September 2006 |
| Contact information | Dr Simon Mitchell, SMH Central Manchester & Manchester Children's University Hospitals |
| Notes | ISRCTN59514984 |
| Trial name or title | Kangaroo mother care combined with sucrose to reduce pain responses in preterm infants |
| Methods | RCT Painful intervention: venipuncture |
| Participants | 1. PMA between 28 and 36 weeks |
| Interventions | Kangaroo mother care + sucrose Sucrose |
| Outcomes | Pain responses measured by:
Primary outcome measures were taken at baseline (30 s before venipuncture); during skin cleansing; needle stick and blood harvesting; compression after needle removal; and rest (up to 5 min after the end of the procedure) |
| Starting date | March 2007 |
| Contact information | Ms Ananda Fernandes, Praceta Falcão Resende 1 |
| Notes | ISRCTN73259137 |
| Trial name or title | Effect of skin‐to‐skin compared to sucrose for pain relief in infants undergoing repeated painful procedures: randomised clinical trial |
| Methods | RCT |
| Participants | Newborns 4 to 12 h old with PMA ≥ 36 weeks |
| Interventions | The therapeutic intervention is skin‐to‐skin contact and the control interventions is 25% sucrose |
| Outcomes | NFCS |
| Starting date | June 2013 |
| Contact information | Liciane Langona Montanholi Av. Bandeirantes, 3900, City: Ribeirão Preto/Brazil Zip Code: 14040‐902 Telephone: +55 16 3602 3411 Email: [email protected] Affiliation: Escola de Enfermagem de Ribeirão Preto‐ Universidade de São Paulo |
| Notes | RBR‐7nynr7 |
| Trial name or title | Role of repeated painful procedures in preterm neonates on short term neuro behavioural outcome |
| Methods | RCT |
| Participants | Infants up to 28 days of age |
| Interventions | 24% sucrose Placebo |
| Outcomes | Short‐term neurobehavioral status at enrolment in the study and at 40 weeks post‐conceptional age using the NAPI scale |
| Starting date | July 2010 |
| Contact information | Vikram Datta, MD., Lady Hardinge Medical College, New Delhi, Delhi1, India, 110001 Email: [email protected] |
| Notes | ClinicalTrials.gov Identifier: NCT01190995 |
| Trial name or title | Pilot study of sucrose to reduce pain in sick babies |
| Methods | RCT |
| Participants | Infants who are inpatients of the NICU:
|
| Interventions | 24% sucrose solution |
| Outcomes | PIPP; total crying time: skin conductance activity |
| Starting date | May 2012 |
| Contact information | Denise Harrison, Children's Hospital of Eastern Ontario |
| Notes | ClinicalTrials.gov Identifier NCT01438008 |
| Trial name or title | Registration and treatment of pain during eye examination of prematurity |
| Methods | RCT |
| Participants | Ages eligible for study: 31 to 37 weeks |
| Interventions | Paracetamol mixture 20 mg/kg + pacifier + glucose Pacifier + sucrose |
| Outcomes | Pain ‐ time frame 5 minutes using PIPP |
| Starting date | March 2012 |
| Contact information | Hakon Bergseng, PhD Email: [email protected] |
| Notes | ClinicalTrials.gov Identifier: NCT01552993 |
| Trial name or title | Neurodevelopmental outcomes of preterm infants treated for pain management with repeated doses of sucrose 24% |
| Methods | RCT |
| Participants | Preterm infants born 27‐33 weeks PMA |
| Interventions | Breast milk or formula prior to every painful procedure Multiple doses of sucrose 1‐3 min prior to every invasive procedure |
| Outcomes | Primary outcome measures: neurodevelopmental outcomes at 6 month corrected age; Griffith mental developmental scale (gross and fine motor, language, performance, social) and general movements by Prechtel |
| Starting date | January 2013 |
| Contact information | Dr Iris Morag, Sheba Medical Center Email: [email protected] |
| Notes | ClinicalTrials.gov Identifier: NCT01742520 |
| Trial name or title | Does noninvasive electrical stimulation of acupuncture points (NESAP) reduce heel stick pain in infants? |
| Methods | RCT |
| Participants | Infants up to 3 days of age |
| Interventions | Sham NESAP with 24% oral sucrose NESAP with oral water NESAP with 24% oral sucrose Sham NESAP with oral water |
| Outcomes | Changes from baseline PIPP; change in salivary cortisol after heel stick; change in HR variability during heel stick; change in HR; change in oxygen saturation; duration of crying after TENS unit initiated; duration of crying during heel stick |
| Starting date | March 2013 |
| Contact information | Richard W Hall MD University of Arkansas |
| Notes | ClinicalTrials.gov Identifier: NCT01800318 |
| Trial name or title | Oral sucrose versus glucose for procedural pain in premature neonates |
| Methods | RCT |
| Participants | Preterm neonates ≤ 34 weeks PMA and ≤ 7 days of age postnatally |
| Interventions | Oral sucrose versus glucose for procedural pain in premature neonates |
| Outcomes | Urinary markers of ATP utilization, oxidative stress and cell injury |
| Starting date | February 2014 |
| Contact information | Danilyn Angeles, PhD, Loma Linda University, 909‐558‐7563; Email: [email protected] |
| Notes | ClinicalTrials.gov Identifier: NCT01894659 |
| Trial name or title | Analgesic effect of oral 25% glucose versus oral 24% sucrose for pain relief during heel lance in preterm neonates |
| Methods | RCT |
| Participants | Infants at 34 to 37 weeks PMA |
| Interventions | Sucrose 1 mL of 24% sucrose administered prior to heel lance vs. 1 mL of 25% glucose administered prior to heel lance |
| Outcomes | Painful response:PIPP 30 s after heel lance Duration of crying Within 2 min following the procedure |
| Starting date | July 2013 |
| Contact information | Vikram Datta, MD., Lady Hardinge Medical College, New Delhi, Delhi1, India, 110001; Email: [email protected] |
| Notes | ClinicalTrials.gov Identifier: NCT01931020 |
| Trial name or title | Efficacy of breast milk expressed and sucrose in procedural pain in preterm (LACTEET) |
| Methods | RCT |
| Participants | Preterm infants (PMA 25 to 37 weeks and body weight < 2500 g) |
| Interventions | Expressed breast milk vs. oral 24% sucrose |
| Outcomes | PIPP; percentage of crying |
| Starting date | October 2013 |
| Contact information | Laura Collados Gómez, Hospital University Gregorio Marañon, Madrid, Spain, 28007 |
| Notes | ClinicalTrials.gov Identifier: NCT02133716 |
| Trial name or title | The effect of sucrose on pain relief during venous blood sampling in preterm infants |
| Methods | RCT |
| Participants | Preterm infants weighing > 1000 g |
| Interventions | The aim of this study is to find the minimal effective dose of 25% sucrose to reduce pain during a single venous blood sampling procedure: 0.2 mL or 0.5 mL |
| Outcomes | Pain assessed by PIPP‐R. Pain score related to the blood sampling will be performed twice: at skin puncture and immediately after the needle has been removed |
| Starting date | January 2015 |
| Contact information | Contact: Laila Kristoffersen (Email: [email protected]); Contact: Håkon Bergseng, MD PhD (Email: [email protected]); St Olavs hospital, Trondheim, Norway |
| Notes | NCT02344368 |
| Trial name or title | Efficacy of oral sucrose in newborns exposed to painful stimuli |
| Methods | RCT |
| Participants | All infants (< 1 month of age) admitted to the Unit of Neonatal Intensive Care of Monaldi Hospital, Naples, Italy. |
| Interventions | 24% sucrose oral solution administered during capillary and arterial blood sample taking, directly by a disposable plastic vial at dosage of 1.5 mL for newborns with a birthweight > 3 kg and 1 mL for newborns with a birthweight < 3 kg Sterile water administered directly by a disposable plastic vial during capillary and arterial blood sample taking |
| Outcomes | Skin conductance algesimeter was used to monitor pain. Skin conductance activity was measured for 3 min before, during, and for 3 min after the intervention |
| Starting date | June 2013 |
| Contact information | Dr Annalisa Passariello Address Via S. Pansini 5‐80100‐Naples. University of Naples “Federico II”. Italy Phone +39 3395077349 Email: [email protected] |
| Notes | ACTRN12614000164695 |
| Trial name or title | Effectiveness of human breast milk, table sugar vs sterile water for pain relief in premature infants undergoing a heel prick procedure in nursery of Christian Medical College and Hospital, Vellore |
| Methods | RCT |
| Participants | Haemodynamically stable preterm (28 to 36 weeks PMA) infants, aged 0 to 28 days, who tolerate feeds, and are admitted to the nursery and undergo heel‐prick procedure |
| Interventions | 24% sucrose (0.6 mL/kg body weight) to be given orally over 15 s (single dose) Expressed breast milk (0.6 mL/kg body weight) Placebo (sterile water 0.6 mL/kg body weight) |
| Outcomes | Preintervention PIPP score (infant at rest) and postintervention pain at 0, 2, and 5 min using PIPP scale |
| Starting date | June 2012 |
| Contact information | Ms Sophia Philip, College of Nursing, Christian Medical College, Vellore, Tamil Nadu 632004 India. Phone: 9894143708. Email: [email protected] |
| Notes | CTRI/2012/06/002730 |
| Trial name or title | Prevention of the procedural pain in the newborn (ACTISUCROSE) |
| Methods | RCT |
| Participants | Newborns with PMA of 37 to 42 weeks |
| Interventions | 20% saccharose Breastfeeding |
| Outcomes | Increase of the total concentration of haemoglobin (delta HbT) measured by the spectrometer during the intravenous injection |
| Starting date | June 2013 |
| Contact information | Jean‐Michel Roue, University Hospital, Brest, France |
| Notes | NCT02109263 |
| Trial name or title | Comparing efficacy of music therapy, sucrose and combination of the two in neonates for pain relief during heel prick procedure |
| Methods | RCT. This is a cross‐over study with each neonate getting all 3 interventions in random order. There will be a minimum of 40 minutes of 'wash‐out' period between interventions |
| Participants | Newborns ≥ 32 weeks, stable clinical condition with no need of CPAP/high flow/ventilation; age 0 h to 28 days |
| Interventions | Music therapy |
| Outcomes | PIPP score, HR stability, saturation stability |
| Starting date | Anticipated date of first participant enrolment 1 June 2015 |
| Contact information | Dr Swapnil Shah, Department of Neonatology, Royal North Shore Hospital, Reserve Road, St Leonards NSW 2065, Australia. Phone: +61 2 9463 2141 Fax: +61 2 9463 2004 Email: [email protected] |
| Notes |
| Trial name or title | Sucrose practices for pain in neonates |
| Methods | RCT |
| Participants | Newborns up to 2 weeks of age. Infants 24 to 42 weeks PMA at birth, admitted to the NICU, and scheduled to receive a heel lance |
| Interventions | 0.1 mL 24% sucrose concurrent opioids 0.5 mL 24% sucrose concurrent opioids 1.0 mL 24% sucrose concurrent opioids 0.1 mL 24% sucrose no opioids 0.5 mL 24% sucrose no opioids 1.0 mL 24% sucrose no opioids |
| Outcomes | The primary outcome is pain intensity measured using the PIPP‐R to assess change from baseline to 30 s post painful procedure |
| Starting date | July 2013 |
| Contact information | Bonnie Stevens, RN, PhD Email: [email protected] |
| Notes | ClinicalTrials.gov Identifier: NCT02134873 |
Abbreviations
ATP = adenosine triphosphate
CPAP = continuous positive airway pressure
PMA = post menstrual age
HR = heart rate
min = minute(s)
NAPI = Neurobehavioural Assessment of Preterm Infants
NESAP = Non−invasive Electrical Stimulation of Acupuncture Points
NFCS = Neonatal Facial Coding System
NICU = neonatal intensive care unit
PIPP = Premature Infant Pain Profile
PIPP‐R = Premature Infant Pain Profile‐Revised
PMA = postmenstrual age
PNA = postnatal age
RCT = randomised controlled trial
TENS = transcutaneous electrical nerve stimulation
Data and analyses
| Outcome or subgroup title | No. of studies | No. of participants | Statistical method | Effect size |
| 1 Total crying time (s) Show forest plot | 1 | 42 | Mean Difference (IV, Fixed, 95% CI) | ‐48.09 [‐93.04, ‐3.14] |
| Analysis 1.1  Comparison 1 Heel lance (term infants): sucrose (12% to 12.5%) versus water/routine care, Outcome 1 Total crying time (s). | ||||
| 1.1 Term infants | 1 | 42 | Mean Difference (IV, Fixed, 95% CI) | ‐48.09 [‐93.04, ‐3.14] |
| 2 Percentage change in heart rate 1 min after heel lance Show forest plot | 1 | 30 | Mean Difference (IV, Fixed, 95% CI) | 6.4 [‐13.69, 26.49] |
| Analysis 1.2  Comparison 1 Heel lance (term infants): sucrose (12% to 12.5%) versus water/routine care, Outcome 2 Percentage change in heart rate 1 min after heel lance. | ||||
| 2.1 Term infants | 1 | 30 | Mean Difference (IV, Fixed, 95% CI) | 6.4 [‐13.69, 26.49] |
| Outcome or subgroup title | No. of studies | No. of participants | Statistical method | Effect size |
| 1 PIPP at 30 s after heel lance Show forest plot | 2 | 105 | Mean Difference (IV, Fixed, 95% CI) | ‐1.42 [‐2.86, 0.01] |
| Analysis 2.1  Comparison 2 Heel lance: sucrose (20% to 33%) versus water, Outcome 1 PIPP at 30 s after heel lance. | ||||
| 1.1 Term infants | 1 | 44 | Mean Difference (IV, Fixed, 95% CI) | ‐2.70 [‐4.96, ‐0.44] |
| 1.2 Preterm infants | 1 | 61 | Mean Difference (IV, Fixed, 95% CI) | ‐0.56 [‐2.42, 1.30] |
| 2 PIPP at 60 s after heel lance Show forest plot | 1 | 31 | Mean Difference (IV, Fixed, 95% CI) | ‐1.80 [‐3.81, 0.21] |
| Analysis 2.2  Comparison 2 Heel lance: sucrose (20% to 33%) versus water, Outcome 2 PIPP at 60 s after heel lance. | ||||
| 2.1 Preterm infants | 1 | 31 | Mean Difference (IV, Fixed, 95% CI) | ‐1.80 [‐3.81, 0.21] |
| 3 PIPP score during heel lance (1st heel lance) Show forest plot | 1 | 107 | Mean Difference (IV, Fixed, 95% CI) | 0.0 [‐1.52, 1.52] |
| Analysis 2.3  Comparison 2 Heel lance: sucrose (20% to 33%) versus water, Outcome 3 PIPP score during heel lance (1st heel lance). | ||||
| 3.1 Newborns of diabetic mothers | 1 | 107 | Mean Difference (IV, Fixed, 95% CI) | 0.0 [‐1.52, 1.52] |
| 4 DAN score at 30 s after heel lance Show forest plot | 1 | 32 | Mean Difference (IV, Fixed, 95% CI) | ‐1.90 [‐8.58, 4.78] |
| Analysis 2.4  Comparison 2 Heel lance: sucrose (20% to 33%) versus water, Outcome 4 DAN score at 30 s after heel lance. | ||||
| 4.1 Term infants | 1 | 32 | Mean Difference (IV, Fixed, 95% CI) | ‐1.90 [‐8.58, 4.78] |
| 5 NIPS during heel lance Show forest plot | 1 | 56 | Mean Difference (IV, Fixed, 95% CI) | ‐2.0 [‐2.42, ‐1.58] |
| Analysis 2.5  Comparison 2 Heel lance: sucrose (20% to 33%) versus water, Outcome 5 NIPS during heel lance. | ||||
| 5.1 Term infants | 1 | 56 | Mean Difference (IV, Fixed, 95% CI) | ‐2.0 [‐2.42, ‐1.58] |
| 6 Duration of first cry (s) Show forest plot | 2 | 142 | Mean Difference (IV, Fixed, 95% CI) | ‐8.63 [‐19.88, 2.61] |
| Analysis 2.6  Comparison 2 Heel lance: sucrose (20% to 33%) versus water, Outcome 6 Duration of first cry (s). | ||||
| 6.1 Term infants | 1 | 32 | Mean Difference (IV, Fixed, 95% CI) | ‐5.0 [‐17.40, 7.40] |
| 6.2 Preterm infants | 1 | 110 | Mean Difference (IV, Fixed, 95% CI) | ‐25.41 [‐52.06, 1.24] |
| 7 Total crying time Show forest plot | 2 | 88 | Mean Difference (IV, Fixed, 95% CI) | ‐22.11 [‐32.52, ‐11.70] |
| Analysis 2.7  Comparison 2 Heel lance: sucrose (20% to 33%) versus water, Outcome 7 Total crying time. | ||||
| 7.1 Term infants | 2 | 88 | Mean Difference (IV, Fixed, 95% CI) | ‐22.11 [‐32.52, ‐11.70] |
| 8 Heart rate (beats/min) during heel lance Show forest plot | 2 | 96 | Mean Difference (IV, Fixed, 95% CI) | ‐0.81 [‐8.57, 6.94] |
| Analysis 2.8  Comparison 2 Heel lance: sucrose (20% to 33%) versus water, Outcome 8 Heart rate (beats/min) during heel lance. | ||||
| 8.1 Term infants | 2 | 96 | Mean Difference (IV, Fixed, 95% CI) | ‐0.81 [‐8.57, 6.94] |
| 9 Percentage change in heart rate 1 min after heel lance Show forest plot | 2 | 86 | Mean Difference (IV, Fixed, 95% CI) | 0.90 [‐5.81, 7.61] |
| Analysis 2.9  Comparison 2 Heel lance: sucrose (20% to 33%) versus water, Outcome 9 Percentage change in heart rate 1 min after heel lance. | ||||
| 9.1 Term infants | 2 | 86 | Mean Difference (IV, Fixed, 95% CI) | 0.90 [‐5.81, 7.61] |
| 10 Respiratory rate (breaths/min) during heel lance Show forest plot | 1 | 56 | Mean Difference (IV, Fixed, 95% CI) | ‐1.0 [‐7.64, 5.64] |
| Analysis 2.10  Comparison 2 Heel lance: sucrose (20% to 33%) versus water, Outcome 10 Respiratory rate (breaths/min) during heel lance. | ||||
| 10.1 Term infants | 1 | 56 | Mean Difference (IV, Fixed, 95% CI) | ‐1.0 [‐7.64, 5.64] |
| 11 Oxygen saturation (%) during heel lance Show forest plot | 1 | 56 | Mean Difference (IV, Fixed, 95% CI) | ‐5.0 [‐12.79, 2.79] |
| Analysis 2.11  Comparison 2 Heel lance: sucrose (20% to 33%) versus water, Outcome 11 Oxygen saturation (%) during heel lance. | ||||
| 11.1 Term infants | 1 | 56 | Mean Difference (IV, Fixed, 95% CI) | ‐5.0 [‐12.79, 2.79] |
| 12 Skin blood flow during heel lance (perfusion units (PU)) Show forest plot | 1 | 56 | Mean Difference (IV, Fixed, 95% CI) | ‐32.0 [‐68.87, 4.87] |
| Analysis 2.12  Comparison 2 Heel lance: sucrose (20% to 33%) versus water, Outcome 12 Skin blood flow during heel lance (perfusion units (PU)). | ||||
| 12.1 Term infants | 1 | 56 | Mean Difference (IV, Fixed, 95% CI) | ‐32.0 [‐68.87, 4.87] |
| 13 Nociceptive‐specific brain activity (mean weight) Show forest plot | 1 | 44 | Mean Difference (IV, Fixed, 95% CI) | 0.02 [‐0.05, 0.09] |
| Analysis 2.13  Comparison 2 Heel lance: sucrose (20% to 33%) versus water, Outcome 13 Nociceptive‐specific brain activity (mean weight). | ||||
| 13.1 Term infants | 1 | 44 | Mean Difference (IV, Fixed, 95% CI) | 0.02 [‐0.05, 0.09] |
| Outcome or subgroup title | No. of studies | No. of participants | Statistical method | Effect size |
| 1 Duration of first cry (s) Show forest plot | 2 | 80 | Mean Difference (IV, Fixed, 95% CI) | ‐63.20 [‐79.20, ‐47.19] |
| Analysis 3.1  Comparison 3 Heel lance: sucrose (50%) versus water, Outcome 1 Duration of first cry (s). | ||||
| 1.1 Term infants | 2 | 80 | Mean Difference (IV, Fixed, 95% CI) | ‐63.20 [‐79.20, ‐47.19] |
| 2 Percentage change in heart rate 1 min after heel lance Show forest plot | 1 | 30 | Mean Difference (IV, Fixed, 95% CI) | 2.60 [‐11.43, 16.63] |
| Analysis 3.2  Comparison 3 Heel lance: sucrose (50%) versus water, Outcome 2 Percentage change in heart rate 1 min after heel lance. | ||||
| 2.1 Term infants | 1 | 30 | Mean Difference (IV, Fixed, 95% CI) | 2.60 [‐11.43, 16.63] |
| Outcome or subgroup title | No. of studies | No. of participants | Statistical method | Effect size |
| 1 PIPP Show forest plot | 1 | 47 | Mean Difference (IV, Fixed, 95% CI) | ‐1.75 [‐2.22, ‐1.28] |
| Analysis 4.1  Comparison 4 Heel lance: sucrose (24%) versus breastfeeding, Outcome 1 PIPP. | ||||
| 1.1 Preterm infants | 1 | 47 | Mean Difference (IV, Fixed, 95% CI) | ‐1.75 [‐2.22, ‐1.28] |
| 2 Comfort score Show forest plot | 1 | 47 | Mean Difference (IV, Fixed, 95% CI) | ‐2.60 [‐3.06, ‐2.14] |
| Analysis 4.2  Comparison 4 Heel lance: sucrose (24%) versus breastfeeding, Outcome 2 Comfort score. | ||||
| 2.1 Preterm infants | 1 | 47 | Mean Difference (IV, Fixed, 95% CI) | ‐2.60 [‐3.06, ‐2.14] |
| Outcome or subgroup title | No. of studies | No. of participants | Statistical method | Effect size |
| 1 NFCS Show forest plot | 1 | 100 | Mean Difference (IV, Fixed, 95% CI) | ‐0.60 [‐1.47, 0.27] |
| Analysis 5.1  Comparison 5 Heel lance: sucrose (24%) + NNS versus water + NNS, or pacifier dipped in sucrose versus pacifier dipped in water, Outcome 1 NFCS. | ||||
| 1.1 Term infants | 1 | 100 | Mean Difference (IV, Fixed, 95% CI) | ‐0.60 [‐1.47, 0.27] |
| 2 PIPP 30 s after heel lance (mainly preterm infants) Show forest plot | 3 | 278 | Mean Difference (IV, Fixed, 95% CI) | ‐1.70 [‐2.13, ‐1.26] |
| Analysis 5.2  Comparison 5 Heel lance: sucrose (24%) + NNS versus water + NNS, or pacifier dipped in sucrose versus pacifier dipped in water, Outcome 2 PIPP 30 s after heel lance (mainly preterm infants). | ||||
| 2.1 New subgroup | 3 | 278 | Mean Difference (IV, Fixed, 95% CI) | ‐1.70 [‐2.13, ‐1.26] |
| 3 PIPP 60 s after heel lance Show forest plot | 2 | 164 | Mean Difference (IV, Fixed, 95% CI) | ‐2.14 [‐3.34, ‐0.94] |
| Analysis 5.3  Comparison 5 Heel lance: sucrose (24%) + NNS versus water + NNS, or pacifier dipped in sucrose versus pacifier dipped in water, Outcome 3 PIPP 60 s after heel lance. | ||||
| 4 Crying time (s) Show forest plot | 2 | 142 | Mean Difference (IV, Fixed, 95% CI) | ‐1.41 [‐9.87, 7.04] |
| Analysis 5.4  Comparison 5 Heel lance: sucrose (24%) + NNS versus water + NNS, or pacifier dipped in sucrose versus pacifier dipped in water, Outcome 4 Crying time (s). | ||||
| 4.1 Term infants | 2 | 142 | Mean Difference (IV, Fixed, 95% CI) | ‐1.41 [‐9.87, 7.04] |
| Outcome or subgroup title | No. of studies | No. of participants | Statistical method | Effect size |
| 1 Crying time (s) Show forest plot | 1 | 35 | Mean Difference (IV, Fixed, 95% CI) | ‐8.0 [‐21.07, 5.07] |
| Analysis 6.1  Comparison 6 Heel lance: sucrose (20%) versus human milk, Outcome 1 Crying time (s). | ||||
| 1.1 Term infants | 1 | 35 | Mean Difference (IV, Fixed, 95% CI) | ‐8.0 [‐21.07, 5.07] |
| Outcome or subgroup title | No. of studies | No. of participants | Statistical method | Effect size |
| 1 PIPP score Show forest plot | 1 | 47 | Mean Difference (IV, Fixed, 95% CI) | ‐1.75 [‐4.03, 0.53] |
| Analysis 7.1  Comparison 7 Heel lance: sucrose (24%) + NNS+ NIDCAP support versus breast milk (by breastfeeding), Outcome 1 PIPP score. | ||||
| 2 COMFORTneo score Show forest plot | 1 | 47 | Mean Difference (IV, Fixed, 95% CI) | ‐2.60 [‐4.84, ‐0.36] |
| Analysis 7.2  Comparison 7 Heel lance: sucrose (24%) + NNS+ NIDCAP support versus breast milk (by breastfeeding), Outcome 2 COMFORTneo score. | ||||
| Outcome or subgroup title | No. of studies | No. of participants | Statistical method | Effect size |
| 1 PIPP score Show forest plot | 1 | 47 | Mean Difference (IV, Fixed, 95% CI) | ‐0.13 [‐2.41, 2.15] |
| Analysis 8.1  Comparison 8 Heel lance: sucrose (24%) + NNS + NIDCAP support versus breast milk (by syringe), Outcome 1 PIPP score. | ||||
| 2 COMFORTneo score Show forest plot | 1 | 47 | Mean Difference (IV, Fixed, 95% CI) | ‐0.5 [‐2.74, 1.74] |
| Analysis 8.2  Comparison 8 Heel lance: sucrose (24%) + NNS + NIDCAP support versus breast milk (by syringe), Outcome 2 COMFORTneo score. | ||||
| Outcome or subgroup title | No. of studies | No. of participants | Statistical method | Effect size |
| 1 Total Bernese Pain Scale for Neonates during heel lance Show forest plot | 1 | 48 | Mean Difference (IV, Fixed, 95% CI) | ‐2.27 [‐4.66, 0.12] |
| Analysis 9.1  Comparison 9 Repeated heel lances: sucrose (20%) versus facilitated tucking, Outcome 1 Total Bernese Pain Scale for Neonates during heel lance. | ||||
| 2 Total Bernese Pain Scale for Neonates during recovery Show forest plot | 1 | 48 | Mean Difference (IV, Fixed, 95% CI) | ‐0.31 [‐1.72, 1.10] |
| Analysis 9.2  Comparison 9 Repeated heel lances: sucrose (20%) versus facilitated tucking, Outcome 2 Total Bernese Pain Scale for Neonates during recovery. | ||||
| Outcome or subgroup title | No. of studies | No. of participants | Statistical method | Effect size |
| 1 Total Bernese Pain Scale for Neonates during heel lance (preterm infants) Show forest plot | 1 | 47 | Mean Difference (IV, Fixed, 95% CI) | ‐0.05 [‐2.16, 2.06] |
| Analysis 10.1  Comparison 10 Repeated heel lances: sucrose (20%) versus facilitated tucking + sucrose (20%), Outcome 1 Total Bernese Pain Scale for Neonates during heel lance (preterm infants). | ||||
| 2 Total Bernese Pain Scale for Neonates during recovery (preterm infants) Show forest plot | 1 | 47 | Mean Difference (IV, Fixed, 95% CI) | 0.64 [‐0.73, 2.01] |
| Analysis 10.2  Comparison 10 Repeated heel lances: sucrose (20%) versus facilitated tucking + sucrose (20%), Outcome 2 Total Bernese Pain Scale for Neonates during recovery (preterm infants). | ||||
| Outcome or subgroup title | No. of studies | No. of participants | Statistical method | Effect size |
| 1 Heart rate (beats/min) during heel lance Show forest plot | 1 | 40 | Mean Difference (IV, Fixed, 95% CI) | 6.20 [‐6.19, 18.59] |
| Analysis 11.1  Comparison 11 Heel lance: sucrose (30% to 33%) versus glucose (30% to 33%), Outcome 1 Heart rate (beats/min) during heel lance. | ||||
| 1.1 Term infants | 1 | 40 | Mean Difference (IV, Fixed, 95% CI) | 6.20 [‐6.19, 18.59] |
| 2 Crying time (s) Show forest plot | 1 | 56 | Mean Difference (IV, Fixed, 95% CI) | ‐34.89 [‐61.67, ‐8.11] |
| Analysis 11.2  Comparison 11 Heel lance: sucrose (30% to 33%) versus glucose (30% to 33%), Outcome 2 Crying time (s). | ||||
| 2.1 Term infants | 1 | 56 | Mean Difference (IV, Fixed, 95% CI) | ‐34.89 [‐61.67, ‐8.11] |
| 3 Percentage change in heart rate 1 min after heel lance Show forest plot | 1 | 56 | Mean Difference (IV, Fixed, 95% CI) | ‐6.58 [‐14.85, 1.69] |
| Analysis 11.3  Comparison 11 Heel lance: sucrose (30% to 33%) versus glucose (30% to 33%), Outcome 3 Percentage change in heart rate 1 min after heel lance. | ||||
| 3.1 Term infants | 1 | 56 | Mean Difference (IV, Fixed, 95% CI) | ‐6.58 [‐14.85, 1.69] |
| Outcome or subgroup title | No. of studies | No. of participants | Statistical method | Effect size |
| 1 Heart rate (beats/min) during heel lance Show forest plot | 1 | 40 | Mean Difference (IV, Fixed, 95% CI) | 16.30 [1.93, 30.67] |
| Analysis 12.1  Comparison 12 Heel lance: sucrose (50%) versus glucose (50%), Outcome 1 Heart rate (beats/min) during heel lance. | ||||
| 1.1 Term infants | 1 | 40 | Mean Difference (IV, Fixed, 95% CI) | 16.30 [1.93, 30.67] |
| Outcome or subgroup title | No. of studies | No. of participants | Statistical method | Effect size |
| 1 NIPS score Show forest plot | 1 | 42 | Mean Difference (IV, Fixed, 95% CI) | ‐0.86 [‐1.43, ‐0.29] |
| Analysis 13.1  Comparison 13 Heel lance (term infants): sucrose (24%) versus laser acupuncture, Outcome 1 NIPS score. | ||||
| 2 Crying time (s) Show forest plot | 1 | 42 | Mean Difference (IV, Fixed, 95% CI) | ‐51.29 [‐73.11, ‐29.47] |
| Analysis 13.2  Comparison 13 Heel lance (term infants): sucrose (24%) versus laser acupuncture, Outcome 2 Crying time (s). | ||||
| Outcome or subgroup title | No. of studies | No. of participants | Statistical method | Effect size |
| 1 Revised NFCS Show forest plot | 1 | 343 | Mean Difference (IV, Fixed, 95% CI) | 0.43 [0.23, 0.63] |
| Analysis 14.1  Comparison 14 Heel lance: sucrose (24%) versus sucrose (24%) + NNS, Outcome 1 Revised NFCS. | ||||
| 2 Percentage increase in heart rate Show forest plot | 1 | 343 | Mean Difference (IV, Fixed, 95% CI) | 2.29 [0.44, 4.14] |
| Analysis 14.2  Comparison 14 Heel lance: sucrose (24%) versus sucrose (24%) + NNS, Outcome 2 Percentage increase in heart rate. | ||||
| 3 Decrease in oxygen saturation in blood (%) Show forest plot | 1 | 343 | Mean Difference (IV, Fixed, 95% CI) | 0.48 [0.10, 0.86] |
| Analysis 14.3  Comparison 14 Heel lance: sucrose (24%) versus sucrose (24%) + NNS, Outcome 3 Decrease in oxygen saturation in blood (%). | ||||
| Outcome or subgroup title | No. of studies | No. of participants | Statistical method | Effect size |
| 1 Revised NFCS Show forest plot | 1 | 343 | Mean Difference (IV, Fixed, 95% CI) | 0.4 [0.19, 0.61] |
| Analysis 15.1  Comparison 15 Heel lance: sucrose (24%) versus sucrose (24%) + swaddling, Outcome 1 Revised NFCS. | ||||
| 2 Percentage increase in heart rate Show forest plot | 1 | 343 | Mean Difference (IV, Fixed, 95% CI) | 0.57 [‐1.43, 2.57] |
| Analysis 15.2  Comparison 15 Heel lance: sucrose (24%) versus sucrose (24%) + swaddling, Outcome 2 Percentage increase in heart rate. | ||||
| 3 Decrease in oxygen saturation in blood (%) Show forest plot | 1 | 343 | Mean Difference (IV, Fixed, 95% CI) | 0.30 [‐0.07, 0.67] |
| Analysis 15.3  Comparison 15 Heel lance: sucrose (24%) versus sucrose (24%) + swaddling, Outcome 3 Decrease in oxygen saturation in blood (%). | ||||
| Outcome or subgroup title | No. of studies | No. of participants | Statistical method | Effect size |
| 1 Revised NFCS Show forest plot | 1 | 337 | Mean Difference (IV, Fixed, 95% CI) | 0.43 [0.23, 0.63] |
| Analysis 16.1  Comparison 16 Heel lance: sucrose (24%) versus sucrose (24%) + NNS + swaddling, Outcome 1 Revised NFCS. | ||||
| 2 Percentage increase in heart rate Show forest plot | 1 | 337 | Mean Difference (IV, Fixed, 95% CI) | 3.25 [1.43, 5.07] |
| Analysis 16.2  Comparison 16 Heel lance: sucrose (24%) versus sucrose (24%) + NNS + swaddling, Outcome 2 Percentage increase in heart rate. | ||||
| 3 Decrease in oxygen saturation in blood (%) Show forest plot | 1 | 337 | Mean Difference (IV, Fixed, 95% CI) | 0.79 [0.44, 1.14] |
| Analysis 16.3  Comparison 16 Heel lance: sucrose (24%) versus sucrose (24%) + NNS + swaddling, Outcome 3 Decrease in oxygen saturation in blood (%). | ||||
| Outcome or subgroup title | No. of studies | No. of participants | Statistical method | Effect size |
| 1 NIPS score in term and preterm infants Show forest plot | 1 | 111 | Mean Difference (IV, Fixed, 95% CI) | ‐0.9 [‐1.81, 0.01] |
| Analysis 17.1  Comparison 17 Venipuncture: sucrose (12%) versus water, Outcome 1 NIPS score in term and preterm infants. | ||||
| Outcome or subgroup title | No. of studies | No. of participants | Statistical method | Effect size |
| 1 PIPP score during venipuncture Show forest plot | 1 | 213 | Mean Difference (IV, Fixed, 95% CI) | ‐2.79 [‐3.76, ‐1.83] |
| Analysis 18.1  Comparison 18 Venipuncture: sucrose (24% to 30%) versus control (sterile water or no treatment), Outcome 1 PIPP score during venipuncture. | ||||
| 1.1 Newborns of non‐diabetic mothers | 1 | 106 | Mean Difference (IV, Fixed, 95% CI) | ‐3.2 [‐4.58, ‐1.82] |
| 1.2 Newborns of diabetic mothers | 1 | 107 | Mean Difference (IV, Fixed, 95% CI) | ‐2.40 [‐3.76, ‐1.04] |
| 2 Duration of cry (s) Show forest plot | 1 | 50 | Mean Difference (IV, Fixed, 95% CI) | ‐16.5 [‐71.41, 38.41] |
| Analysis 18.2  Comparison 18 Venipuncture: sucrose (24% to 30%) versus control (sterile water or no treatment), Outcome 2 Duration of cry (s). | ||||
| 2.1 Term infants | 1 | 50 | Mean Difference (IV, Fixed, 95% CI) | ‐16.5 [‐71.41, 38.41] |
| Outcome or subgroup title | No. of studies | No. of participants | Statistical method | Effect size |
| 1 Duration of first cry (s) Show forest plot | 1 | 50 | Mean Difference (IV, Fixed, 95% CI) | ‐14.0 [‐51.79, 23.79] |
| Analysis 19.1  Comparison 19 Venipuncture: sucrose (50%) versus water, Outcome 1 Duration of first cry (s). | ||||
| 1.1 Term infants | 1 | 50 | Mean Difference (IV, Fixed, 95% CI) | ‐14.0 [‐51.79, 23.79] |
| Outcome or subgroup title | No. of studies | No. of participants | Statistical method | Effect size |
| 1 PIPP score Show forest plot | 1 | 76 | Mean Difference (IV, Fixed, 95% CI) | 1.30 [‐0.12, 2.72] |
| Analysis 20.1  Comparison 20 Venipuncture: sucrose (24% to 30%) versus sucrose (24% to 30%) + EMLA/Liposomal lidocaine cream on the skin, Outcome 1 PIPP score. | ||||
| 1.1 Preterm infants | 1 | 76 | Mean Difference (IV, Fixed, 95% CI) | 1.30 [‐0.12, 2.72] |
| 2 PIPP score during recovery period Show forest plot | 1 | 76 | Mean Difference (IV, Fixed, 95% CI) | 0.60 [‐0.73, 1.93] |
| Analysis 20.2  Comparison 20 Venipuncture: sucrose (24% to 30%) versus sucrose (24% to 30%) + EMLA/Liposomal lidocaine cream on the skin, Outcome 2 PIPP score during recovery period. | ||||
| 3 DAN score during venipuncture Show forest plot | 1 | 76 | Mean Difference (IV, Fixed, 95% CI) | 1.30 [0.26, 2.34] |
| Analysis 20.3  Comparison 20 Venipuncture: sucrose (24% to 30%) versus sucrose (24% to 30%) + EMLA/Liposomal lidocaine cream on the skin, Outcome 3 DAN score during venipuncture. | ||||
| 3.1 Preterm infants | 1 | 76 | Mean Difference (IV, Fixed, 95% CI) | 1.30 [0.26, 2.34] |
| 4 DAN score during recovery period Show forest plot | 1 | 76 | Mean Difference (IV, Fixed, 95% CI) | 1.40 [0.03, 2.77] |
| Analysis 20.4  Comparison 20 Venipuncture: sucrose (24% to 30%) versus sucrose (24% to 30%) + EMLA/Liposomal lidocaine cream on the skin, Outcome 4 DAN score during recovery period. | ||||
| 5 Facial grimacing score Show forest plot | 1 | 213 | Mean Difference (IV, Fixed, 95% CI) | ‐5.0 [‐13.48, 3.48] |
| Analysis 20.5  Comparison 20 Venipuncture: sucrose (24% to 30%) versus sucrose (24% to 30%) + EMLA/Liposomal lidocaine cream on the skin, Outcome 5 Facial grimacing score. | ||||
| 6 Observer‐rated pain (VAS) (cm) Show forest plot | 1 | 213 | Mean Difference (IV, Fixed, 95% CI) | ‐0.7 [‐1.55, 0.15] |
| Analysis 20.6  Comparison 20 Venipuncture: sucrose (24% to 30%) versus sucrose (24% to 30%) + EMLA/Liposomal lidocaine cream on the skin, Outcome 6 Observer‐rated pain (VAS) (cm). | ||||
| 7 Mean crying times during all procedures (s) Show forest plot | 2 | 289 | Mean Difference (IV, Fixed, 95% CI) | 1.83 [‐10.42, 14.09] |
| Analysis 20.7  Comparison 20 Venipuncture: sucrose (24% to 30%) versus sucrose (24% to 30%) + EMLA/Liposomal lidocaine cream on the skin, Outcome 7 Mean crying times during all procedures (s). | ||||
| 7.1 Term infants | 1 | 213 | Mean Difference (IV, Fixed, 95% CI) | 0.0 [‐13.79, 13.79] |
| 7.2 Preterm infants | 1 | 76 | Mean Difference (IV, Fixed, 95% CI) | 8.69 [‐17.97, 35.35] |
| 8 Heart rate (beats/min) Show forest plot | 1 | 213 | Mean Difference (IV, Fixed, 95% CI) | 5.0 [0.39, 9.61] |
| Analysis 20.8  Comparison 20 Venipuncture: sucrose (24% to 30%) versus sucrose (24% to 30%) + EMLA/Liposomal lidocaine cream on the skin, Outcome 8 Heart rate (beats/min). | ||||
| 9 Oxygen saturation % Show forest plot | 1 | 213 | Mean Difference (IV, Fixed, 95% CI) | 0.20 [‐0.33, 0.73] |
| Analysis 20.9  Comparison 20 Venipuncture: sucrose (24% to 30%) versus sucrose (24% to 30%) + EMLA/Liposomal lidocaine cream on the skin, Outcome 9 Oxygen saturation %. | ||||
| Outcome or subgroup title | No. of studies | No. of participants | Statistical method | Effect size |
| 1 Facial grimacing score Show forest plot | 1 | 216 | Mean Difference (IV, Fixed, 95% CI) | ‐28.0 [‐36.48, ‐19.52] |
| Analysis 21.1  Comparison 21 Venipuncture: sucrose (24%) versus liposomal lidocaine, Outcome 1 Facial grimacing score. | ||||
| 2 Observer‐rated pain (VAS) (cm) Show forest plot | 1 | 216 | Mean Difference (IV, Fixed, 95% CI) | ‐0.40 [‐1.25, 0.45] |
| Analysis 21.2  Comparison 21 Venipuncture: sucrose (24%) versus liposomal lidocaine, Outcome 2 Observer‐rated pain (VAS) (cm). | ||||
| 3 Cry duration (s) Show forest plot | 1 | 216 | Mean Difference (IV, Fixed, 95% CI) | ‐39.0 [‐52.43, ‐25.57] |
| Analysis 21.3  Comparison 21 Venipuncture: sucrose (24%) versus liposomal lidocaine, Outcome 3 Cry duration (s). | ||||
| 4 Heart rate (beats/min) Show forest plot | 1 | 216 | Mean Difference (IV, Fixed, 95% CI) | 3.0 [‐1.95, 7.95] |
| Analysis 21.4  Comparison 21 Venipuncture: sucrose (24%) versus liposomal lidocaine, Outcome 4 Heart rate (beats/min). | ||||
| 5 Oxygen saturation (%) Show forest plot | 1 | 216 | Mean Difference (IV, Fixed, 95% CI) | 0.5 [‐0.03, 1.03] |
| Analysis 21.5  Comparison 21 Venipuncture: sucrose (24%) versus liposomal lidocaine, Outcome 5 Oxygen saturation (%). | ||||
| Outcome or subgroup title | No. of studies | No. of participants | Statistical method | Effect size |
| 1 Heart rate (beats/min) after needle insertion Show forest plot | 1 | 47 | Mean Difference (IV, Fixed, 95% CI) | ‐1.90 [‐11.73, 7.93] |
| Analysis 22.1  Comparison 22 Arterial puncture in preterm infants: sucrose (24%) versus no intervention, Outcome 1 Heart rate (beats/min) after needle insertion. | ||||
| 2 Heart rate (beats/min) 1 min after procedure completed Show forest plot | 1 | 47 | Mean Difference (IV, Fixed, 95% CI) | ‐2.40 [‐10.56, 5.76] |
| Analysis 22.2  Comparison 22 Arterial puncture in preterm infants: sucrose (24%) versus no intervention, Outcome 2 Heart rate (beats/min) 1 min after procedure completed. | ||||
| 3 Oxygen saturation in blood (%) after needle insertion Show forest plot | 1 | 47 | Mean Difference (IV, Fixed, 95% CI) | ‐1.0 [‐4.65, 2.65] |
| Analysis 22.3  Comparison 22 Arterial puncture in preterm infants: sucrose (24%) versus no intervention, Outcome 3 Oxygen saturation in blood (%) after needle insertion. | ||||
| 4 Oxygen saturation in blood (%) 1 min after procedure Show forest plot | 1 | 47 | Mean Difference (IV, Fixed, 95% CI) | ‐2.90 [‐5.95, 0.15] |
| Analysis 22.4  Comparison 22 Arterial puncture in preterm infants: sucrose (24%) versus no intervention, Outcome 4 Oxygen saturation in blood (%) 1 min after procedure. | ||||
| Outcome or subgroup title | No. of studies | No. of participants | Statistical method | Effect size |
| 1 NIPS 1 min to 2 min after IM injection Show forest plot | 1 | 60 | Mean Difference (IV, Fixed, 95% CI) | ‐2.30 [‐2.93, ‐1.67] |
| Analysis 23.1  Comparison 23 Intramuscular injection (term infants): sucrose (20% to 25%) versus water or no intervention, Outcome 1 NIPS 1 min to 2 min after IM injection. | ||||
| 2 PIPP during IM injection (term infants) Show forest plot | 1 | 232 | Mean Difference (IV, Fixed, 95% CI) | ‐1.05 [‐1.98, ‐0.12] |
| Analysis 23.2  Comparison 23 Intramuscular injection (term infants): sucrose (20% to 25%) versus water or no intervention, Outcome 2 PIPP during IM injection (term infants). | ||||
| 2.1 Infants of non‐diabetic mothers | 1 | 115 | Mean Difference (IV, Fixed, 95% CI) | ‐1.10 [‐2.38, 0.18] |
| 2.2 Infants of diabetic mothers | 1 | 117 | Mean Difference (IV, Fixed, 95% CI) | ‐1.0 [‐2.35, 0.35] |
| 3 Duration of cry (s) Show forest plot | 1 | 110 | Mean Difference (IV, Fixed, 95% CI) | ‐163.83 [‐192.58, ‐135.08] |
| Analysis 23.3  Comparison 23 Intramuscular injection (term infants): sucrose (20% to 25%) versus water or no intervention, Outcome 3 Duration of cry (s). | ||||
| Outcome or subgroup title | No. of studies | No. of participants | Statistical method | Effect size |
| 1 NIPS 1 min to 2 min after immunization Show forest plot | 1 | 60 | Mean Difference (IV, Fixed, 95% CI) | ‐0.10 [‐0.89, 0.69] |
| Analysis 24.1  Comparison 24 Intramuscular injection (term infants): sucrose (25%) versus glucose (25%), Outcome 1 NIPS 1 min to 2 min after immunization. | ||||
| Outcome or subgroup title | No. of studies | No. of participants | Statistical method | Effect size |
| 1 Crying time (s) Show forest plot | 1 | 29 | Mean Difference (IV, Fixed, 95% CI) | 15.2 [11.52, 18.88] |
| Analysis 25.1  Comparison 25 Intramuscular injection (term infants): sucrose (25%) versus sucrose (25%) + warmth, Outcome 1 Crying time (s). | ||||
| 2 Grimacing time Show forest plot | 1 | 29 | Mean Difference (IV, Fixed, 95% CI) | 16.20 [12.35, 20.05] |
| Analysis 25.2  Comparison 25 Intramuscular injection (term infants): sucrose (25%) versus sucrose (25%) + warmth, Outcome 2 Grimacing time. | ||||
| Outcome or subgroup title | No. of studies | No. of participants | Statistical method | Effect size |
| 1 Change in DAN score Show forest plot | 1 | 33 | Mean Difference (IV, Fixed, 95% CI) | ‐2.43 [‐4.50, ‐0.36] |
| Analysis 26.1  Comparison 26 Bladder catheterization: sucrose (24%) versus sterile water, Outcome 1 Change in DAN score. | ||||
| 2 Infants crying at maximal catheter insertion Show forest plot | 1 | 33 | Risk Difference (M‐H, Fixed, 95% CI) | ‐0.51 [‐0.81, ‐0.22] |
| Analysis 26.2  Comparison 26 Bladder catheterization: sucrose (24%) versus sterile water, Outcome 2 Infants crying at maximal catheter insertion. | ||||
| Outcome or subgroup title | No. of studies | No. of participants | Statistical method | Effect size |
| 1 PIPP score intra procedure Show forest plot | 1 | 105 | Mean Difference (IV, Fixed, 95% CI) | ‐0.30 [‐1.33, 0.73] |
| Analysis 27.1  Comparison 27 Orogastric tube insertion in preterm infants: sucrose (24%) versus distilled water, Outcome 1 PIPP score intra procedure. | ||||
| 2 PIPP score 30 s post procedure Show forest plot | 1 | 105 | Mean Difference (IV, Fixed, 95% CI) | ‐1.30 [‐2.31, ‐0.29] |
| Analysis 27.2  Comparison 27 Orogastric tube insertion in preterm infants: sucrose (24%) versus distilled water, Outcome 2 PIPP score 30 s post procedure. | ||||
| 3 PIPP score 1 min post procedure Show forest plot | 1 | 105 | Mean Difference (IV, Fixed, 95% CI) | ‐0.5 [‐1.40, 0.40] |
| Analysis 27.3  Comparison 27 Orogastric tube insertion in preterm infants: sucrose (24%) versus distilled water, Outcome 3 PIPP score 1 min post procedure. | ||||
| Outcome or subgroup title | No. of studies | No. of participants | Statistical method | Effect size |
| 1 PIPP during examination Show forest plot | 1 | 32 | Mean Difference (IV, Fixed, 95% CI) | 0.0 [‐2.08, 2.08] |
| Analysis 28.1  Comparison 28 ROP examination: sucrose (24%) by syringe + swaddled + pacifier versus water by syringe + swaddled + pacifier, Outcome 1 PIPP during examination. | ||||
| 2 Crying time (%) Show forest plot | 1 | 32 | Mean Difference (IV, Fixed, 95% CI) | ‐10.0 [‐32.91, 12.91] |
| Analysis 28.2  Comparison 28 ROP examination: sucrose (24%) by syringe + swaddled + pacifier versus water by syringe + swaddled + pacifier, Outcome 2 Crying time (%). | ||||
| 3 Heart rate (beats/min) Show forest plot | 1 | 32 | Mean Difference (IV, Fixed, 95% CI) | ‐6.0 [‐19.33, 7.33] |
| Analysis 28.3  Comparison 28 ROP examination: sucrose (24%) by syringe + swaddled + pacifier versus water by syringe + swaddled + pacifier, Outcome 3 Heart rate (beats/min). | ||||
| 4 Mean blood pressure (mmHg) Show forest plot | 1 | 32 | Mean Difference (IV, Fixed, 95% CI) | ‐5.00 [‐18.48, 4.48] |
| Analysis 28.4  Comparison 28 ROP examination: sucrose (24%) by syringe + swaddled + pacifier versus water by syringe + swaddled + pacifier, Outcome 4 Mean blood pressure (mmHg). | ||||
| 5 Respiratory rate (breaths/min) Show forest plot | 1 | 32 | Mean Difference (IV, Fixed, 95% CI) | 2.0 [‐5.07, 9.07] |
| Analysis 28.5  Comparison 28 ROP examination: sucrose (24%) by syringe + swaddled + pacifier versus water by syringe + swaddled + pacifier, Outcome 5 Respiratory rate (breaths/min). | ||||
| 6 Oxygen saturation (%) Show forest plot | 1 | 32 | Mean Difference (IV, Fixed, 95% CI) | ‐1.00 [‐5.86, ‐0.14] |
| Analysis 28.6  Comparison 28 ROP examination: sucrose (24%) by syringe + swaddled + pacifier versus water by syringe + swaddled + pacifier, Outcome 6 Oxygen saturation (%). | ||||
| Outcome or subgroup title | No. of studies | No. of participants | Statistical method | Effect size |
| 1 Total crying time Show forest plot | 1 | 30 | Mean Difference (IV, Fixed, 95% CI) | ‐33.90 [‐76.22, 8.42] |
| Analysis 29.1  Comparison 29 ROP examination: sucrose (24% ) + swaddled + held versus lying in the crib, Outcome 1 Total crying time. | ||||
| 2 Oxygen saturation (%) during examination Show forest plot | 1 | 30 | Mean Difference (IV, Fixed, 95% CI) | ‐1.71 [‐5.85, 2.43] |
| Analysis 29.2  Comparison 29 ROP examination: sucrose (24% ) + swaddled + held versus lying in the crib, Outcome 2 Oxygen saturation (%) during examination. | ||||
| Outcome or subgroup title | No. of studies | No. of participants | Statistical method | Effect size |
| 1 PIPP score during eye examination Show forest plot | 3 | 134 | Mean Difference (IV, Fixed, 95% CI) | ‐2.15 [‐2.86, ‐1.43] |
| Analysis 30.1  Comparison 30 ROP examination: sucrose (24% to 33%) (sucrose or sucrose + NNS) versus control (water or water + NNS), Outcome 1 PIPP score during eye examination. | ||||
| 1.1 Sucrose via syringe versus control (sterile water via syringe) | 1 | 20 | Mean Difference (IV, Fixed, 95% CI) | ‐1.0 [‐2.54, 0.54] |
| 1.2 Sucrose + pacifier versus control (sterile water + pacifier) | 3 | 114 | Mean Difference (IV, Fixed, 95% CI) | ‐2.47 [‐3.27, ‐1.66] |
| 2 Crying time (s) during eye examination Show forest plot | 1 | 64 | Mean Difference (IV, Fixed, 95% CI) | ‐21.10 [‐33.10, ‐9.10] |
| Analysis 30.2  Comparison 30 ROP examination: sucrose (24% to 33%) (sucrose or sucrose + NNS) versus control (water or water + NNS), Outcome 2 Crying time (s) during eye examination. | ||||
| Outcome or subgroup title | No. of studies | No. of participants | Statistical method | Effect size |
| 1 Change from baseline in heart rate (beats/min) Show forest plot | 1 | 56 | Mean Difference (IV, Fixed, 95% CI) | ‐9.70 [‐19.82, 0.42] |
| Analysis 31.1  Comparison 31 Circumcision: sucrose 50% solution on a premature nipple containing a 2 x 2 cm sterile gauze pad moistened by the fluid versus no treatment, Outcome 1 Change from baseline in heart rate (beats/min). | ||||
| Outcome or subgroup title | No. of studies | No. of participants | Statistical method | Effect size |
| 1 N‐PASS score during circumcision Show forest plot | 1 | 60 | Mean Difference (IV, Fixed, 95% CI) | 2.40 [1.85, 2.95] |
| Analysis 32.1  Comparison 32 Circumcision: sucrose (24%) versus EMLA, Outcome 1 N‐PASS score during circumcision. | ||||
| 2 N‐PASS score after 5 min Show forest plot | 1 | 60 | Mean Difference (IV, Fixed, 95% CI) | 1.4 [0.74, 2.06] |
| Analysis 32.2  Comparison 32 Circumcision: sucrose (24%) versus EMLA, Outcome 2 N‐PASS score after 5 min. | ||||
| 3 Heart rate (beats/min) during circumcision Show forest plot | 1 | 60 | Mean Difference (IV, Fixed, 95% CI) | 6.0 [0.19, 11.81] |
| Analysis 32.3  Comparison 32 Circumcision: sucrose (24%) versus EMLA, Outcome 3 Heart rate (beats/min) during circumcision. | ||||
| 4 Respiratory rate (cycles/min) during circumcision Show forest plot | 1 | 60 | Mean Difference (IV, Fixed, 95% CI) | ‐1.90 [‐4.00, 0.20] |
| Analysis 32.4  Comparison 32 Circumcision: sucrose (24%) versus EMLA, Outcome 4 Respiratory rate (cycles/min) during circumcision. | ||||
| 5 Oxygen saturation (%) during circumcision Show forest plot | 1 | 60 | Mean Difference (IV, Fixed, 95% CI) | ‐2.70 [‐3.70, ‐1.70] |
| Analysis 32.5  Comparison 32 Circumcision: sucrose (24%) versus EMLA, Outcome 5 Oxygen saturation (%) during circumcision. | ||||
| Outcome or subgroup title | No. of studies | No. of participants | Statistical method | Effect size |
| 1 N‐PASS score during circumcision Show forest plot | 1 | 60 | Mean Difference (IV, Fixed, 95% CI) | 3.00 [2.42, 3.58] |
| Analysis 33.1  Comparison 33 Circumcision: sucrose (24%) versus EMLA + sucrose (24%), Outcome 1 N‐PASS score during circumcision. | ||||
| 2 N‐PASS score after 5 min Show forest plot | 1 | 60 | Mean Difference (IV, Fixed, 95% CI) | 1.20 [0.49, 1.91] |
| Analysis 33.2  Comparison 33 Circumcision: sucrose (24%) versus EMLA + sucrose (24%), Outcome 2 N‐PASS score after 5 min. | ||||
| 3 Heart rate (beats/min) during circumcision Show forest plot | 1 | 60 | Mean Difference (IV, Fixed, 95% CI) | 12.0 [6.62, 17.38] |
| Analysis 33.3  Comparison 33 Circumcision: sucrose (24%) versus EMLA + sucrose (24%), Outcome 3 Heart rate (beats/min) during circumcision. | ||||
| 4 Respiratory rate (cycles/min) Show forest plot | 1 | 60 | Mean Difference (IV, Fixed, 95% CI) | 0.60 [‐1.77, 2.97] |
| Analysis 33.4  Comparison 33 Circumcision: sucrose (24%) versus EMLA + sucrose (24%), Outcome 4 Respiratory rate (cycles/min). | ||||
| 5 Oxygen saturation (%) during circumcision Show forest plot | 1 | 60 | Mean Difference (IV, Fixed, 95% CI) | ‐3.40 [‐4.39, ‐2.41] |
| Analysis 33.5  Comparison 33 Circumcision: sucrose (24%) versus EMLA + sucrose (24%), Outcome 5 Oxygen saturation (%) during circumcision. | ||||
| Outcome or subgroup title | No. of studies | No. of participants | Statistical method | Effect size |
| 1 Change in heart rate (beats/min) from baseline Show forest plot | 1 | 79 | Mean Difference (IV, Fixed, 95% CI) | 17.40 [11.16, 23.64] |
| Analysis 34.1  Comparison 34 Circumcision: sucrose solution (50%) on a premature nipple containing a 2 x 2 cm sterile gauze pad moistened by the fluid versus dorsal penile nerve block (DPNB), Outcome 1 Change in heart rate (beats/min) from baseline. | ||||
| Outcome or subgroup title | No. of studies | No. of participants | Statistical method | Effect size |
| 1 Mean Behavioral Distress Scale scores during circumcision Show forest plot | 1 | 40 | Mean Difference (IV, Fixed, 95% CI) | ‐0.67 [‐1.08, ‐0.26] |
| Analysis 35.1  Comparison 35 Circumcision: pacifier dipped in sucrose (24%) + DPNB versus pacifier dipped in water + DPNB, Outcome 1 Mean Behavioral Distress Scale scores during circumcision. | ||||
| 2 Mean plasma cortisol levels n mol/dL Show forest plot | 1 | 40 | Mean Difference (IV, Fixed, 95% CI) | 68.90 [‐53.93, 191.73] |
| Analysis 35.2  Comparison 35 Circumcision: pacifier dipped in sucrose (24%) + DPNB versus pacifier dipped in water + DPNB, Outcome 2 Mean plasma cortisol levels n mol/dL. | ||||
| Outcome or subgroup title | No. of studies | No. of participants | Statistical method | Effect size |
| 1 PIPP Show forest plot | 1 | 104 | Mean Difference (IV, Fixed, 95% CI) | ‐2.15 [‐3.30, 1.00] |
| Analysis 36.1  Comparison 36 Echocardiography (term and preterm infants): sucrose (24%) versus no medication/placebo, Outcome 1 PIPP. | ||||
| Outcome or subgroup title | No. of studies | No. of participants | Statistical method | Effect size |
| 1 'Motor development and vigor' (MDV) domain of NAPI tool Show forest plot | 1 | 93 | Mean Difference (IV, Fixed, 95% CI) | ‐1.83 [‐8.59, 4.93] |
| Analysis 37.1  Comparison 37 Potentially painful procedures over seven days: sucrose (24%) versus water, Outcome 1 'Motor development and vigor' (MDV) domain of NAPI tool. | ||||
| 2 'Alertness and orientation' (AO) domain of NAPI Show forest plot | 1 | 93 | Mean Difference (IV, Fixed, 95% CI) | 3.09 [‐6.49, 12.67] |
| Analysis 37.2  Comparison 37 Potentially painful procedures over seven days: sucrose (24%) versus water, Outcome 2 'Alertness and orientation' (AO) domain of NAPI. | ||||

Study flow diagram: review update

Risk of bias graph: review authors' judgements about each risk of bias item presented as percentages across all included studies.

Risk of bias summary: review authors' judgements about each risk of bias item for each included study.

Forest plot of comparison: 6 Heel lance: Sucrose (24%) + NNS vs. water + NNS, outcome: 6.2 PIPP 30 s after heel lance (term and preterm infants).

Forest plot of comparison: 6 Heel lance: Sucrose (24%) + NNS vs. water + NNS, outcome: 6.3 PIPP 60 s after heel lance.
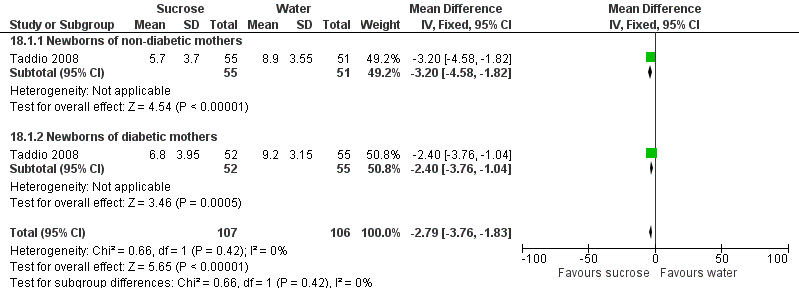
Forest plot of comparison: 18 Venipuncture: sucrose (24% to 30%) versus control (sterile water or no treatment), outcome: 18.1 PIPP score during venipuncture.

Forest plot of comparison: 23 Intramuscular injection (term infants): Sucrose (20‐25%) vs. water or no intervention, outcome: 23.2 PIPP during IM injection (term infants).

Forest plot of comparison: 30 ROP examination: sucrose (24% to 33%) (sucrose or sucrose + NNS) versus control (water or water + NNS), outcome: 30.1 PIPP score during eye examination.

Comparison 1 Heel lance (term infants): sucrose (12% to 12.5%) versus water/routine care, Outcome 1 Total crying time (s).

Comparison 1 Heel lance (term infants): sucrose (12% to 12.5%) versus water/routine care, Outcome 2 Percentage change in heart rate 1 min after heel lance.
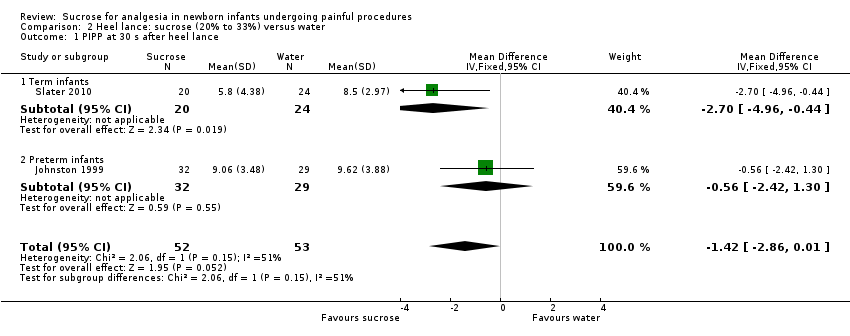
Comparison 2 Heel lance: sucrose (20% to 33%) versus water, Outcome 1 PIPP at 30 s after heel lance.
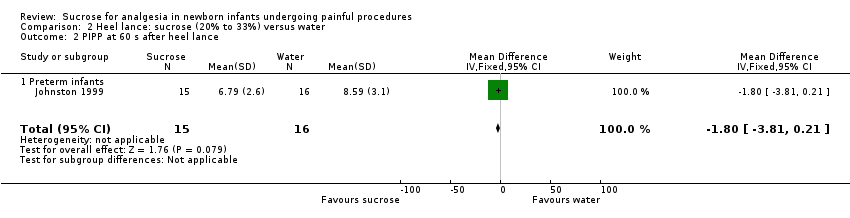
Comparison 2 Heel lance: sucrose (20% to 33%) versus water, Outcome 2 PIPP at 60 s after heel lance.

Comparison 2 Heel lance: sucrose (20% to 33%) versus water, Outcome 3 PIPP score during heel lance (1st heel lance).

Comparison 2 Heel lance: sucrose (20% to 33%) versus water, Outcome 4 DAN score at 30 s after heel lance.

Comparison 2 Heel lance: sucrose (20% to 33%) versus water, Outcome 5 NIPS during heel lance.

Comparison 2 Heel lance: sucrose (20% to 33%) versus water, Outcome 6 Duration of first cry (s).

Comparison 2 Heel lance: sucrose (20% to 33%) versus water, Outcome 7 Total crying time.
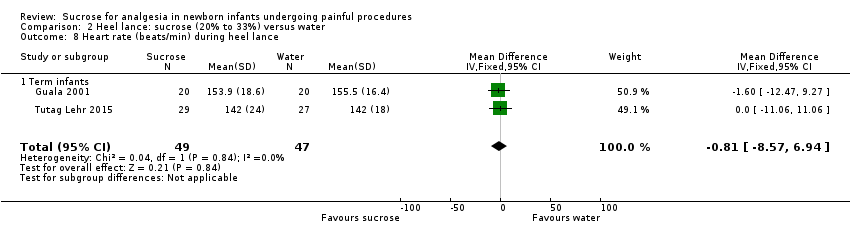
Comparison 2 Heel lance: sucrose (20% to 33%) versus water, Outcome 8 Heart rate (beats/min) during heel lance.
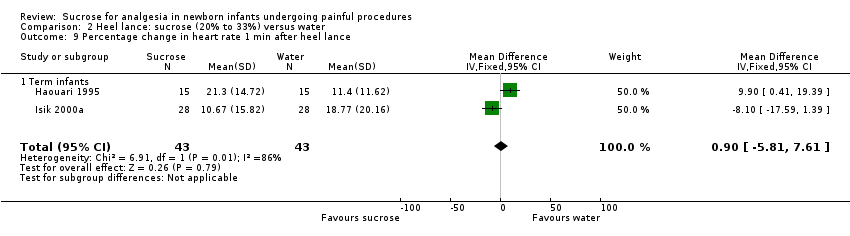
Comparison 2 Heel lance: sucrose (20% to 33%) versus water, Outcome 9 Percentage change in heart rate 1 min after heel lance.

Comparison 2 Heel lance: sucrose (20% to 33%) versus water, Outcome 10 Respiratory rate (breaths/min) during heel lance.

Comparison 2 Heel lance: sucrose (20% to 33%) versus water, Outcome 11 Oxygen saturation (%) during heel lance.

Comparison 2 Heel lance: sucrose (20% to 33%) versus water, Outcome 12 Skin blood flow during heel lance (perfusion units (PU)).

Comparison 2 Heel lance: sucrose (20% to 33%) versus water, Outcome 13 Nociceptive‐specific brain activity (mean weight).
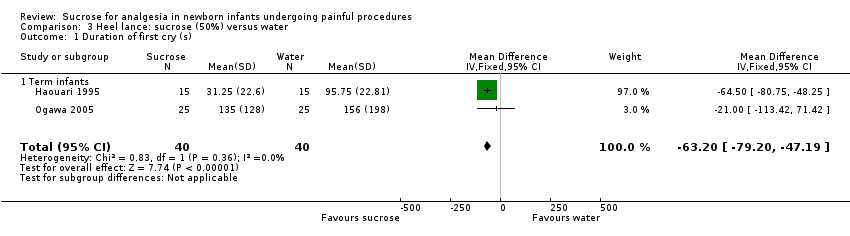
Comparison 3 Heel lance: sucrose (50%) versus water, Outcome 1 Duration of first cry (s).

Comparison 3 Heel lance: sucrose (50%) versus water, Outcome 2 Percentage change in heart rate 1 min after heel lance.

Comparison 4 Heel lance: sucrose (24%) versus breastfeeding, Outcome 1 PIPP.

Comparison 4 Heel lance: sucrose (24%) versus breastfeeding, Outcome 2 Comfort score.

Comparison 5 Heel lance: sucrose (24%) + NNS versus water + NNS, or pacifier dipped in sucrose versus pacifier dipped in water, Outcome 1 NFCS.
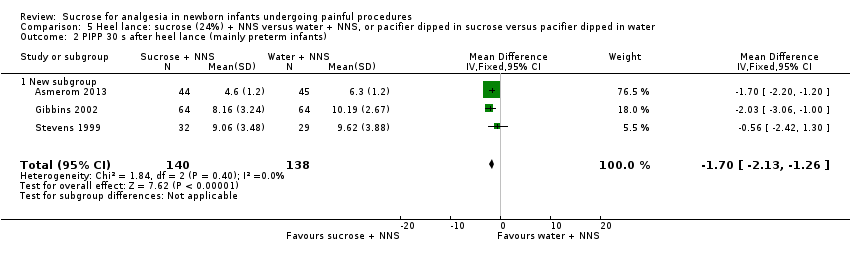
Comparison 5 Heel lance: sucrose (24%) + NNS versus water + NNS, or pacifier dipped in sucrose versus pacifier dipped in water, Outcome 2 PIPP 30 s after heel lance (mainly preterm infants).

Comparison 5 Heel lance: sucrose (24%) + NNS versus water + NNS, or pacifier dipped in sucrose versus pacifier dipped in water, Outcome 3 PIPP 60 s after heel lance.

Comparison 5 Heel lance: sucrose (24%) + NNS versus water + NNS, or pacifier dipped in sucrose versus pacifier dipped in water, Outcome 4 Crying time (s).

Comparison 6 Heel lance: sucrose (20%) versus human milk, Outcome 1 Crying time (s).
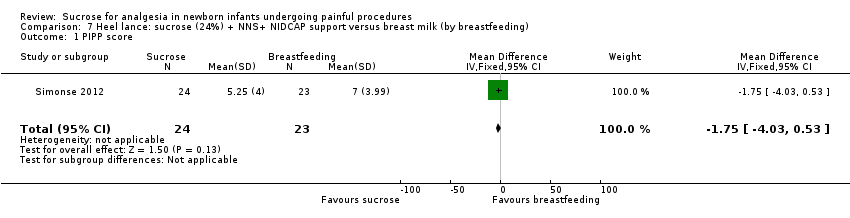
Comparison 7 Heel lance: sucrose (24%) + NNS+ NIDCAP support versus breast milk (by breastfeeding), Outcome 1 PIPP score.

Comparison 7 Heel lance: sucrose (24%) + NNS+ NIDCAP support versus breast milk (by breastfeeding), Outcome 2 COMFORTneo score.
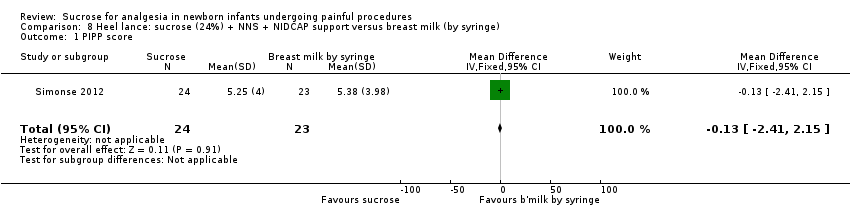
Comparison 8 Heel lance: sucrose (24%) + NNS + NIDCAP support versus breast milk (by syringe), Outcome 1 PIPP score.
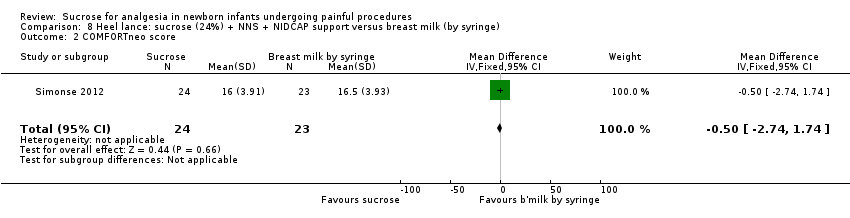
Comparison 8 Heel lance: sucrose (24%) + NNS + NIDCAP support versus breast milk (by syringe), Outcome 2 COMFORTneo score.
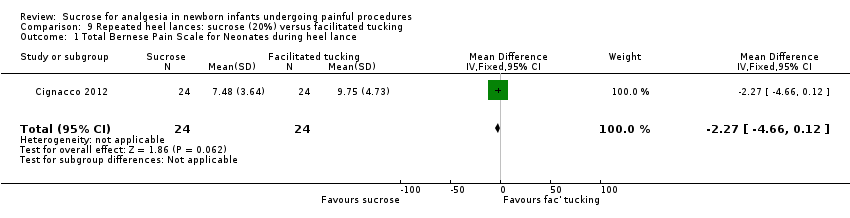
Comparison 9 Repeated heel lances: sucrose (20%) versus facilitated tucking, Outcome 1 Total Bernese Pain Scale for Neonates during heel lance.

Comparison 9 Repeated heel lances: sucrose (20%) versus facilitated tucking, Outcome 2 Total Bernese Pain Scale for Neonates during recovery.

Comparison 10 Repeated heel lances: sucrose (20%) versus facilitated tucking + sucrose (20%), Outcome 1 Total Bernese Pain Scale for Neonates during heel lance (preterm infants).
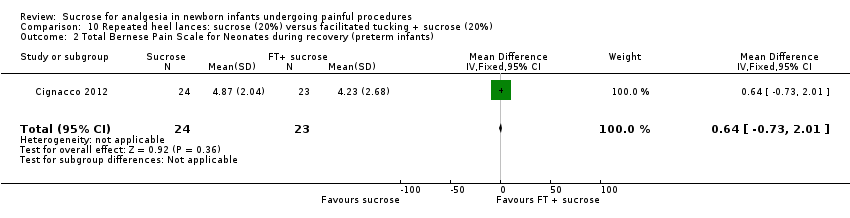
Comparison 10 Repeated heel lances: sucrose (20%) versus facilitated tucking + sucrose (20%), Outcome 2 Total Bernese Pain Scale for Neonates during recovery (preterm infants).

Comparison 11 Heel lance: sucrose (30% to 33%) versus glucose (30% to 33%), Outcome 1 Heart rate (beats/min) during heel lance.

Comparison 11 Heel lance: sucrose (30% to 33%) versus glucose (30% to 33%), Outcome 2 Crying time (s).

Comparison 11 Heel lance: sucrose (30% to 33%) versus glucose (30% to 33%), Outcome 3 Percentage change in heart rate 1 min after heel lance.

Comparison 12 Heel lance: sucrose (50%) versus glucose (50%), Outcome 1 Heart rate (beats/min) during heel lance.

Comparison 13 Heel lance (term infants): sucrose (24%) versus laser acupuncture, Outcome 1 NIPS score.

Comparison 13 Heel lance (term infants): sucrose (24%) versus laser acupuncture, Outcome 2 Crying time (s).

Comparison 14 Heel lance: sucrose (24%) versus sucrose (24%) + NNS, Outcome 1 Revised NFCS.
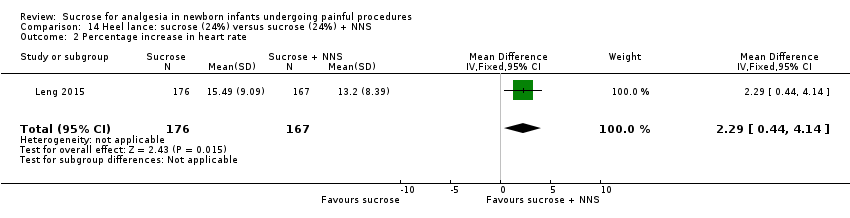
Comparison 14 Heel lance: sucrose (24%) versus sucrose (24%) + NNS, Outcome 2 Percentage increase in heart rate.

Comparison 14 Heel lance: sucrose (24%) versus sucrose (24%) + NNS, Outcome 3 Decrease in oxygen saturation in blood (%).
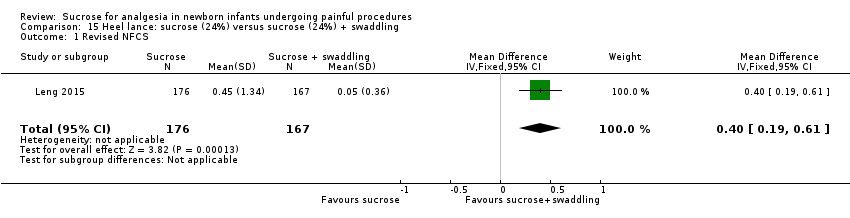
Comparison 15 Heel lance: sucrose (24%) versus sucrose (24%) + swaddling, Outcome 1 Revised NFCS.
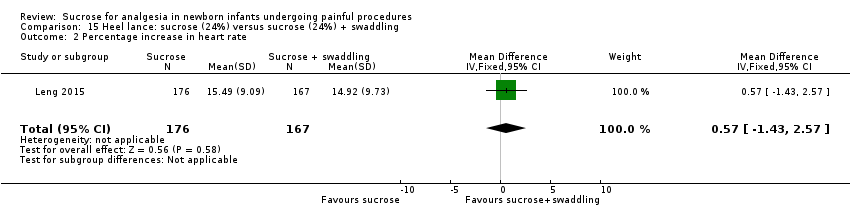
Comparison 15 Heel lance: sucrose (24%) versus sucrose (24%) + swaddling, Outcome 2 Percentage increase in heart rate.
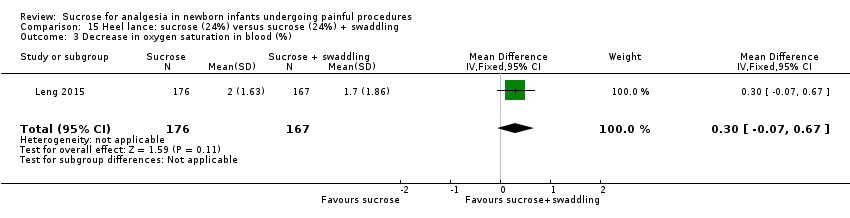
Comparison 15 Heel lance: sucrose (24%) versus sucrose (24%) + swaddling, Outcome 3 Decrease in oxygen saturation in blood (%).

Comparison 16 Heel lance: sucrose (24%) versus sucrose (24%) + NNS + swaddling, Outcome 1 Revised NFCS.
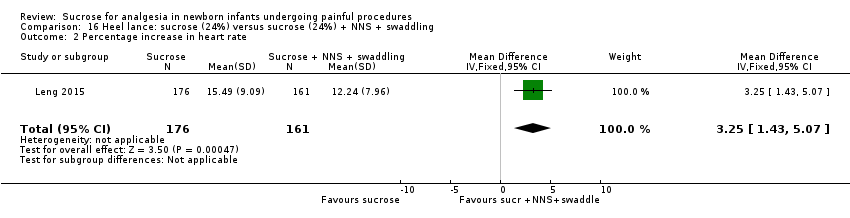
Comparison 16 Heel lance: sucrose (24%) versus sucrose (24%) + NNS + swaddling, Outcome 2 Percentage increase in heart rate.

Comparison 16 Heel lance: sucrose (24%) versus sucrose (24%) + NNS + swaddling, Outcome 3 Decrease in oxygen saturation in blood (%).
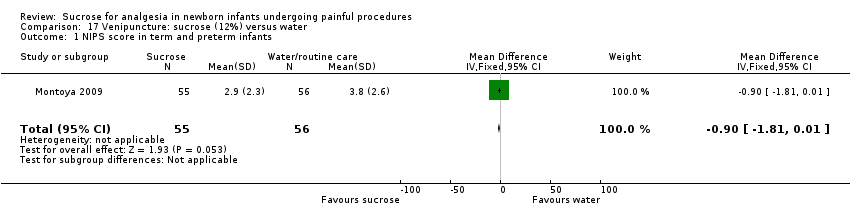
Comparison 17 Venipuncture: sucrose (12%) versus water, Outcome 1 NIPS score in term and preterm infants.
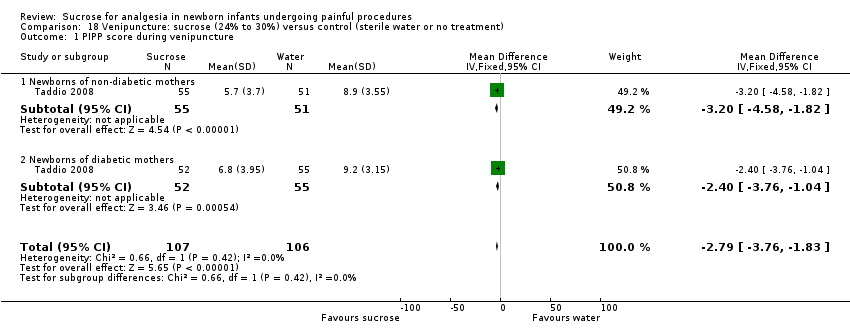
Comparison 18 Venipuncture: sucrose (24% to 30%) versus control (sterile water or no treatment), Outcome 1 PIPP score during venipuncture.

Comparison 18 Venipuncture: sucrose (24% to 30%) versus control (sterile water or no treatment), Outcome 2 Duration of cry (s).
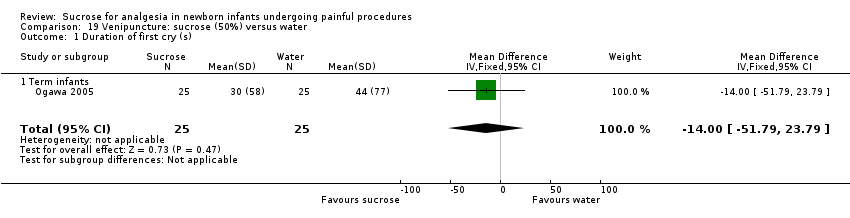
Comparison 19 Venipuncture: sucrose (50%) versus water, Outcome 1 Duration of first cry (s).
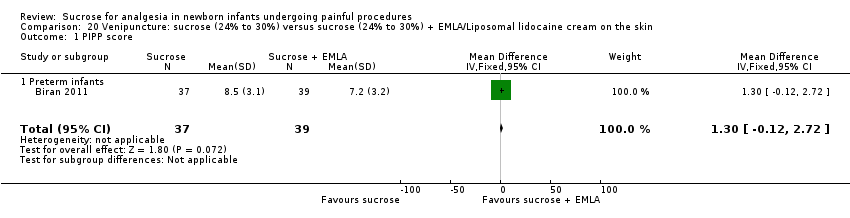
Comparison 20 Venipuncture: sucrose (24% to 30%) versus sucrose (24% to 30%) + EMLA/Liposomal lidocaine cream on the skin, Outcome 1 PIPP score.

Comparison 20 Venipuncture: sucrose (24% to 30%) versus sucrose (24% to 30%) + EMLA/Liposomal lidocaine cream on the skin, Outcome 2 PIPP score during recovery period.

Comparison 20 Venipuncture: sucrose (24% to 30%) versus sucrose (24% to 30%) + EMLA/Liposomal lidocaine cream on the skin, Outcome 3 DAN score during venipuncture.
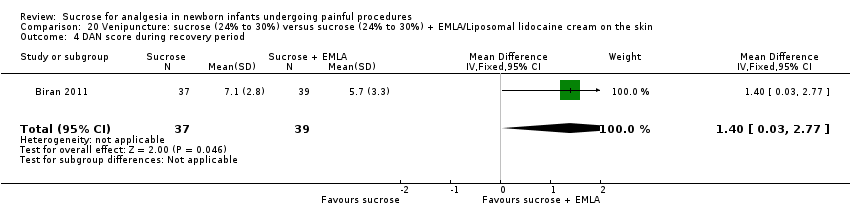
Comparison 20 Venipuncture: sucrose (24% to 30%) versus sucrose (24% to 30%) + EMLA/Liposomal lidocaine cream on the skin, Outcome 4 DAN score during recovery period.

Comparison 20 Venipuncture: sucrose (24% to 30%) versus sucrose (24% to 30%) + EMLA/Liposomal lidocaine cream on the skin, Outcome 5 Facial grimacing score.

Comparison 20 Venipuncture: sucrose (24% to 30%) versus sucrose (24% to 30%) + EMLA/Liposomal lidocaine cream on the skin, Outcome 6 Observer‐rated pain (VAS) (cm).

Comparison 20 Venipuncture: sucrose (24% to 30%) versus sucrose (24% to 30%) + EMLA/Liposomal lidocaine cream on the skin, Outcome 7 Mean crying times during all procedures (s).
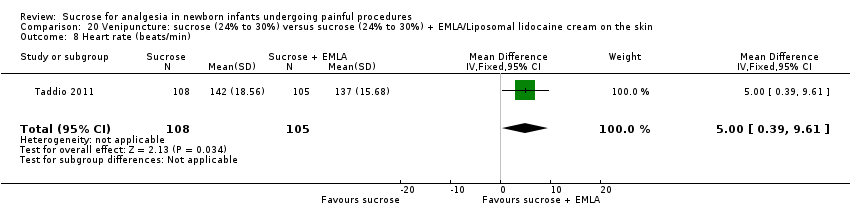
Comparison 20 Venipuncture: sucrose (24% to 30%) versus sucrose (24% to 30%) + EMLA/Liposomal lidocaine cream on the skin, Outcome 8 Heart rate (beats/min).

Comparison 20 Venipuncture: sucrose (24% to 30%) versus sucrose (24% to 30%) + EMLA/Liposomal lidocaine cream on the skin, Outcome 9 Oxygen saturation %.
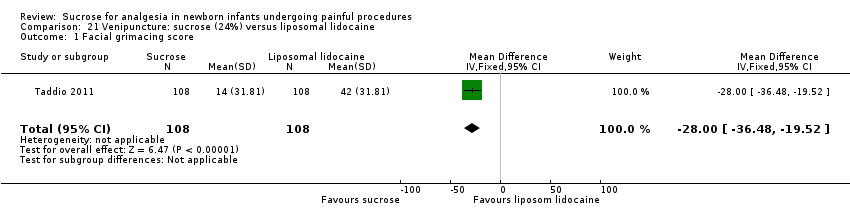
Comparison 21 Venipuncture: sucrose (24%) versus liposomal lidocaine, Outcome 1 Facial grimacing score.

Comparison 21 Venipuncture: sucrose (24%) versus liposomal lidocaine, Outcome 2 Observer‐rated pain (VAS) (cm).

Comparison 21 Venipuncture: sucrose (24%) versus liposomal lidocaine, Outcome 3 Cry duration (s).

Comparison 21 Venipuncture: sucrose (24%) versus liposomal lidocaine, Outcome 4 Heart rate (beats/min).

Comparison 21 Venipuncture: sucrose (24%) versus liposomal lidocaine, Outcome 5 Oxygen saturation (%).

Comparison 22 Arterial puncture in preterm infants: sucrose (24%) versus no intervention, Outcome 1 Heart rate (beats/min) after needle insertion.
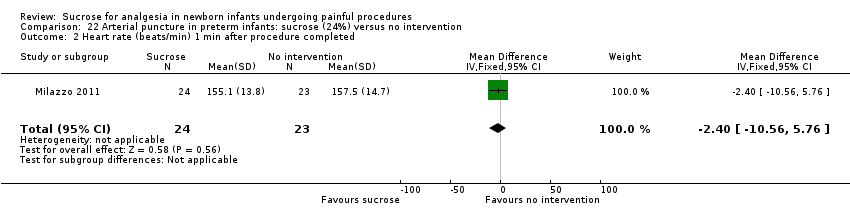
Comparison 22 Arterial puncture in preterm infants: sucrose (24%) versus no intervention, Outcome 2 Heart rate (beats/min) 1 min after procedure completed.

Comparison 22 Arterial puncture in preterm infants: sucrose (24%) versus no intervention, Outcome 3 Oxygen saturation in blood (%) after needle insertion.

Comparison 22 Arterial puncture in preterm infants: sucrose (24%) versus no intervention, Outcome 4 Oxygen saturation in blood (%) 1 min after procedure.

Comparison 23 Intramuscular injection (term infants): sucrose (20% to 25%) versus water or no intervention, Outcome 1 NIPS 1 min to 2 min after IM injection.
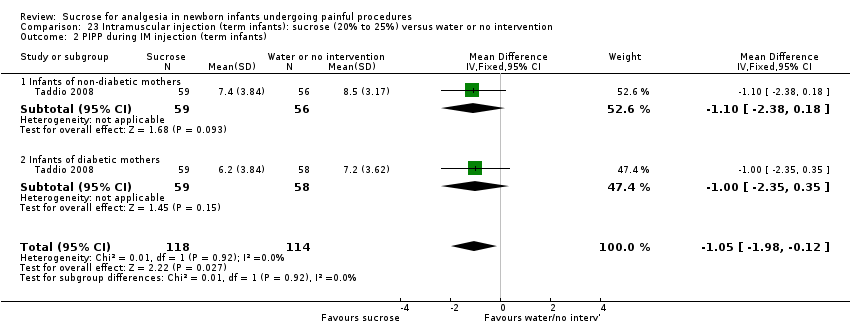
Comparison 23 Intramuscular injection (term infants): sucrose (20% to 25%) versus water or no intervention, Outcome 2 PIPP during IM injection (term infants).

Comparison 23 Intramuscular injection (term infants): sucrose (20% to 25%) versus water or no intervention, Outcome 3 Duration of cry (s).

Comparison 24 Intramuscular injection (term infants): sucrose (25%) versus glucose (25%), Outcome 1 NIPS 1 min to 2 min after immunization.

Comparison 25 Intramuscular injection (term infants): sucrose (25%) versus sucrose (25%) + warmth, Outcome 1 Crying time (s).

Comparison 25 Intramuscular injection (term infants): sucrose (25%) versus sucrose (25%) + warmth, Outcome 2 Grimacing time.
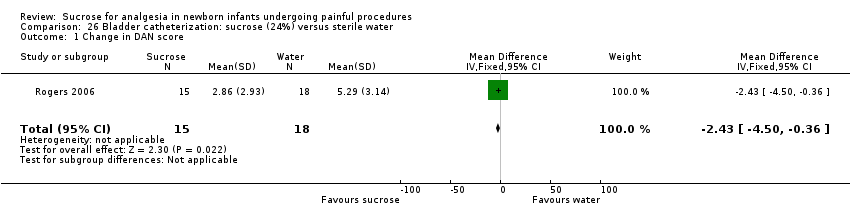
Comparison 26 Bladder catheterization: sucrose (24%) versus sterile water, Outcome 1 Change in DAN score.

Comparison 26 Bladder catheterization: sucrose (24%) versus sterile water, Outcome 2 Infants crying at maximal catheter insertion.

Comparison 27 Orogastric tube insertion in preterm infants: sucrose (24%) versus distilled water, Outcome 1 PIPP score intra procedure.

Comparison 27 Orogastric tube insertion in preterm infants: sucrose (24%) versus distilled water, Outcome 2 PIPP score 30 s post procedure.

Comparison 27 Orogastric tube insertion in preterm infants: sucrose (24%) versus distilled water, Outcome 3 PIPP score 1 min post procedure.
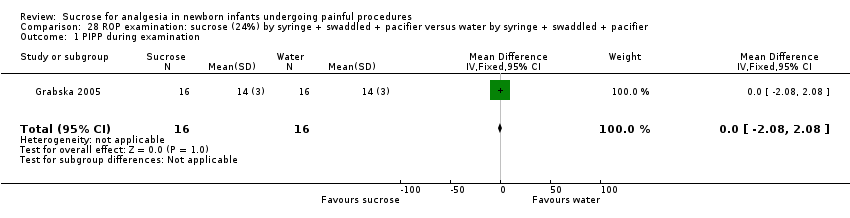
Comparison 28 ROP examination: sucrose (24%) by syringe + swaddled + pacifier versus water by syringe + swaddled + pacifier, Outcome 1 PIPP during examination.
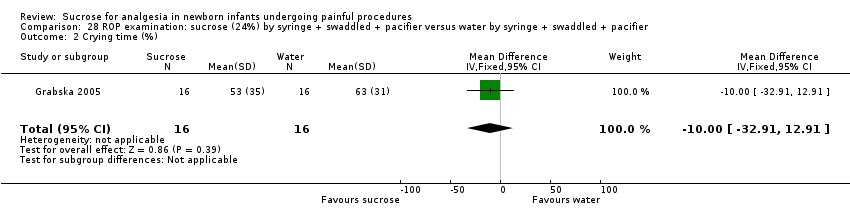
Comparison 28 ROP examination: sucrose (24%) by syringe + swaddled + pacifier versus water by syringe + swaddled + pacifier, Outcome 2 Crying time (%).

Comparison 28 ROP examination: sucrose (24%) by syringe + swaddled + pacifier versus water by syringe + swaddled + pacifier, Outcome 3 Heart rate (beats/min).

Comparison 28 ROP examination: sucrose (24%) by syringe + swaddled + pacifier versus water by syringe + swaddled + pacifier, Outcome 4 Mean blood pressure (mmHg).
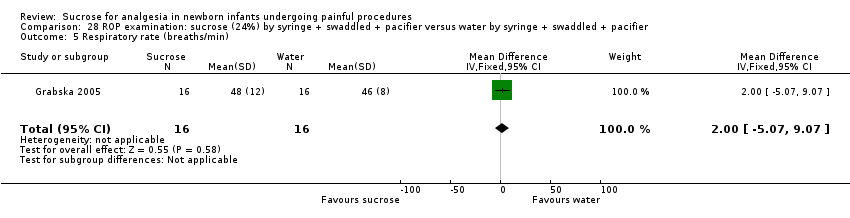
Comparison 28 ROP examination: sucrose (24%) by syringe + swaddled + pacifier versus water by syringe + swaddled + pacifier, Outcome 5 Respiratory rate (breaths/min).

Comparison 28 ROP examination: sucrose (24%) by syringe + swaddled + pacifier versus water by syringe + swaddled + pacifier, Outcome 6 Oxygen saturation (%).

Comparison 29 ROP examination: sucrose (24% ) + swaddled + held versus lying in the crib, Outcome 1 Total crying time.

Comparison 29 ROP examination: sucrose (24% ) + swaddled + held versus lying in the crib, Outcome 2 Oxygen saturation (%) during examination.

Comparison 30 ROP examination: sucrose (24% to 33%) (sucrose or sucrose + NNS) versus control (water or water + NNS), Outcome 1 PIPP score during eye examination.

Comparison 30 ROP examination: sucrose (24% to 33%) (sucrose or sucrose + NNS) versus control (water or water + NNS), Outcome 2 Crying time (s) during eye examination.
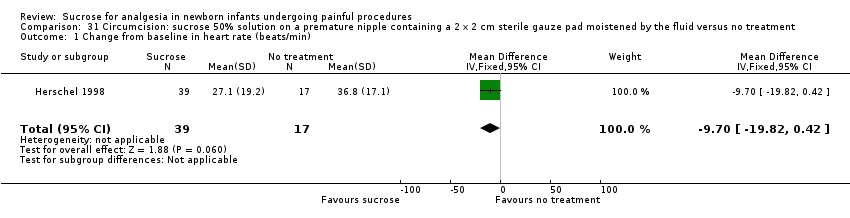
Comparison 31 Circumcision: sucrose 50% solution on a premature nipple containing a 2 x 2 cm sterile gauze pad moistened by the fluid versus no treatment, Outcome 1 Change from baseline in heart rate (beats/min).

Comparison 32 Circumcision: sucrose (24%) versus EMLA, Outcome 1 N‐PASS score during circumcision.
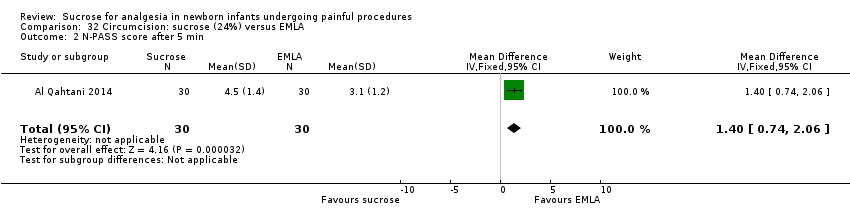
Comparison 32 Circumcision: sucrose (24%) versus EMLA, Outcome 2 N‐PASS score after 5 min.

Comparison 32 Circumcision: sucrose (24%) versus EMLA, Outcome 3 Heart rate (beats/min) during circumcision.
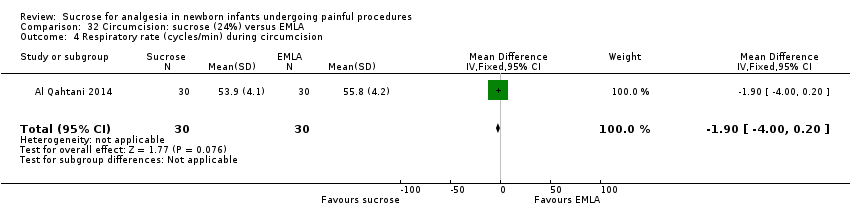
Comparison 32 Circumcision: sucrose (24%) versus EMLA, Outcome 4 Respiratory rate (cycles/min) during circumcision.
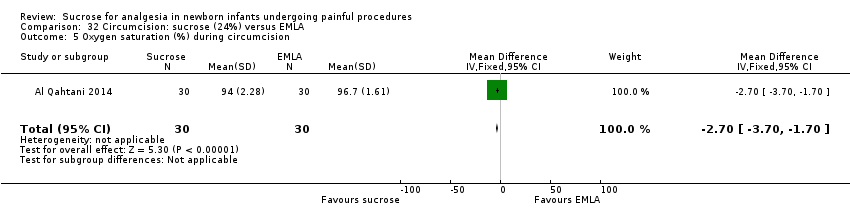
Comparison 32 Circumcision: sucrose (24%) versus EMLA, Outcome 5 Oxygen saturation (%) during circumcision.

Comparison 33 Circumcision: sucrose (24%) versus EMLA + sucrose (24%), Outcome 1 N‐PASS score during circumcision.

Comparison 33 Circumcision: sucrose (24%) versus EMLA + sucrose (24%), Outcome 2 N‐PASS score after 5 min.
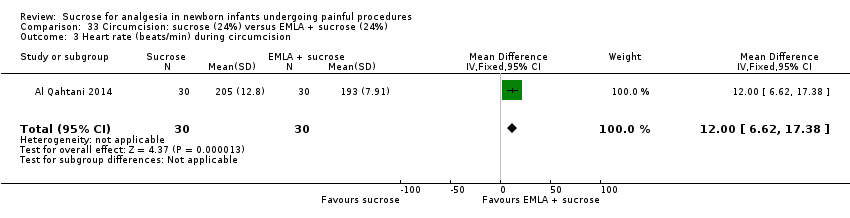
Comparison 33 Circumcision: sucrose (24%) versus EMLA + sucrose (24%), Outcome 3 Heart rate (beats/min) during circumcision.
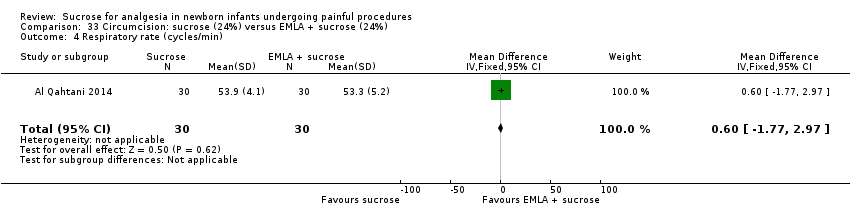
Comparison 33 Circumcision: sucrose (24%) versus EMLA + sucrose (24%), Outcome 4 Respiratory rate (cycles/min).

Comparison 33 Circumcision: sucrose (24%) versus EMLA + sucrose (24%), Outcome 5 Oxygen saturation (%) during circumcision.

Comparison 34 Circumcision: sucrose solution (50%) on a premature nipple containing a 2 x 2 cm sterile gauze pad moistened by the fluid versus dorsal penile nerve block (DPNB), Outcome 1 Change in heart rate (beats/min) from baseline.
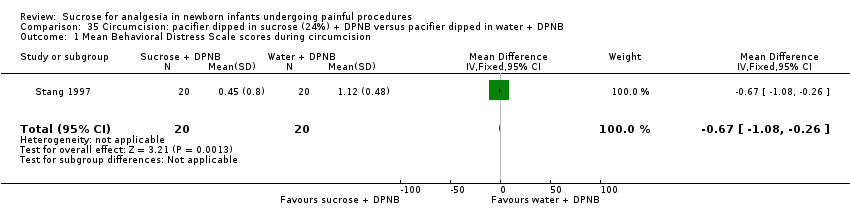
Comparison 35 Circumcision: pacifier dipped in sucrose (24%) + DPNB versus pacifier dipped in water + DPNB, Outcome 1 Mean Behavioral Distress Scale scores during circumcision.

Comparison 35 Circumcision: pacifier dipped in sucrose (24%) + DPNB versus pacifier dipped in water + DPNB, Outcome 2 Mean plasma cortisol levels n mol/dL.

Comparison 36 Echocardiography (term and preterm infants): sucrose (24%) versus no medication/placebo, Outcome 1 PIPP.
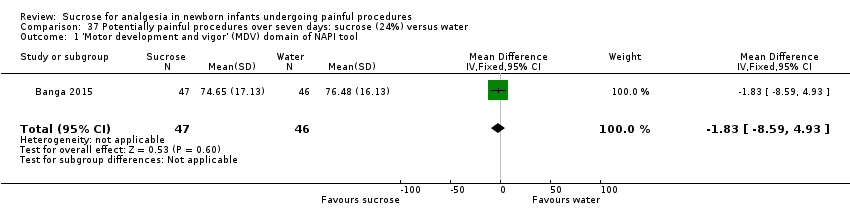
Comparison 37 Potentially painful procedures over seven days: sucrose (24%) versus water, Outcome 1 'Motor development and vigor' (MDV) domain of NAPI tool.

Comparison 37 Potentially painful procedures over seven days: sucrose (24%) versus water, Outcome 2 'Alertness and orientation' (AO) domain of NAPI.
| Sucrose (20% to 33%) compared with water for pain associated with heel lance | |||||
| Patient or population: neonates with heel lance‐associated pain Settings: hospital Intervention: sucrose (20% to 33%) Comparison: water | |||||
| Outcomes | Illustrative comparative risks (mean and range) | No of participants | Quality of the evidence | Comments | |
| Assumed risk | Corresponding risk | ||||
| Water | Sucrose (20% to 33%) | ||||
| PIPP at 30 s after heel lance Range of scale 0‐21 for infants < 28 weeks PMA and 0‐18 for infants > 36 weeks PMA. A lower score = less pain | The mean for PIPP ranged across control groups from | The WMD for PIPP in the intervention groups was lower: ‐1.42 (95% CI ‐2.86 to 0.01) | 105 | ⊕⊕⊝⊝ | Bias: there were some concerns about bias in both studies (see RoB tables) Consistency: there was moderate inconsistency between the study point estimates (12 = 51 %) Precision: there was low precision in the point estimate with wide 95% CIs) Indirectness: all trials were conducted in the target population (no concern about indirectness) |
| PIPP at 60 s after heel lance Range of scale 0‐21 for infants < 28 weeks PMA and 0‐18 for infants >3 6 weeks PMA A lower score = less pain | The mean for PIPP in the control group was 8.59 | The mean for PIPP in the intervention groups was lower: ‐1.80 (95% CI ‐3.81 to 0.21) | 31 (1) | ⊕⊕⊝⊝ | Bias: there were concerns about allocation concealment and performance bias in this single study Consistency: N/A as there was only one study Precision: there was lack of precision due to small sample size Indirectness: the study was conducted in the target population |
| PIPP score during heel lance (1st heel lance) Range of scale 0‐21 for infants < 28 weeks PMA and 0‐18 for infants > 36 weeks PMA A lower score = less pain | The mean for PIPP in the control group was | The mean for PIPP in the intervention group was the same as in the control group: 0.00 (95% CI ‐1.52 to 1.52) | 107 | ⊕⊕⊕⊝ | Bias: there were no concerns about bias in this study Consistency: as there was only one study in this analysis concerns about consistency were N/A Precision: this was a relatively large single study (no lack of precision) Indirectness: the study was conducted in the target population |
| DAN score at 30 s after heel lance Range of scale 0‐10 A lower score = less pain | The mean DAN score in the control group was 9.5 | The mean DAN score in the intervention group was lower: ‐1.90 (95% CI ‐8.58 to 4.78) | 32 | ⊕⊕⊝⊝ | Bias: concerns about blinding of performance and detection bias Consistency: as there was only one study in this analysis concerns about consistency were not N/A Precision: small sample size Indirectness: the study was conducted in the target population |
| NIPS during heel lance Range of scale 0‐7 A lower score = less pain | The mean NIPS score in the control group was | The mean NIPS score in the intervention group was lower: ‐2.00 (95% CI ‐2.42 to ‐1.58) | 56 (1) | ⊕⊕⊕⊝ | Bias: no concerns about bias Consistency: as there was only one study in this analysis concerns about consistency were N/A Precision: small sample size Indirectness: the study was conducted in the target population (no concern about indirectness) |
| *The basis for the assumed risk was 'The mean PIPP, DAN and NIPS scores across control groups according to the values reported in the Assumed risk column. The corresponding risk was the mean in the intervention groups for the PIPP, DAN and NIPS scores with their 95% CI'. | |||||
| GRADE Working Group grades of evidence | |||||
| Sucrose (24%) compared with breastfeeding for heel lance‐associated pain | |||||
| Patient or population: neonates with heel lance‐associated pain Settings: hospital Intervention: sucrose 24% Comparison: breastfeeding | |||||
| Outcomes | Illustrative comparative risks* (95% CI) | No of participants | Quality of the evidence | Comments | |
| Assumed risk | Corresponding risk | ||||
| Breastfeeding | Sucrose (24%) | ||||
| PIPP ‐ Preterm infants | The mean PIPP score in the breast feeding group was 7 Range of scale 0‐21 for infants < 28 weeks PMA and 0‐18 for infants > 36 weeks PMA A lower score = less pain | The mean PIPP score in the sucrose group was lower: ‐1.75 (95% CI ‐2.22 to ‐1.28) | 47 (1) | ⊕⊕⊝⊝ | Bias: there were concerns about performance and detection bias Consistency: as there was only one study in this analysis concerns about consistency were N/A Precision: small sample size Indirectness: the study was conducted in the target population (no concern about indirectness) |
| *The basis for the assumed risk was 'The mean PIPP score in the control group according to the value reported in the Assumed risk column. The corresponding risk was the mean in the intervention group for the PIPP score with its 95% CI'. | |||||
| GRADE Working Group grades of evidence | |||||
| Sucrose (24%) + NNS compared with water + NNS or pacifier dipped in sucrose compared with pacifier dipped in water for heel lance‐associated pain | |||||
| Patient or population: newborns with heel lance‐associated pain Settings: hospital Intervention: sucrose (24%) + NNS Comparison: water + NNS | |||||
| Outcomes | Illustrative comparative risks* (95% CI) | No of participants | Quality of the evidence | Comments | |
| Assumed risk | Corresponding risk | ||||
| Water + NNS | Sucrose + NNS | ||||
| NFCS Range of scale 0‐10 in term infants 0‐9 in preterm infants A lower score = less pain | The mean NFCS score in the water + NNS groups was 2.1 | The mean NFCS score in the sucrose + NNS group was lower than in the water + NNS group: ‐0.60 (95% CI ‐1.47 to 0.47) | 100 (1) | ⊕⊕⊝⊝ | Bias: many items scored 'unclear' on the RoB assessment Consistency: as there was only one study in this analysis concerns about consistency were N/A Precision: relatively large sample size (no lack of precision) Indirectness: the study was conducted in the target population (no concern about indirectness) |
| PIPP 30 s after heel lance (term and preterm infants) Range of scale 0‐21 for infants < 28 weeks PMA and 0‐18 for infants > 36 weeks PMA A lower score = less pain | The mean PIPP score ranged across control groups from 6.3 to 10.19 | The WM PIPP score in the sucrose + NNS group was lower than in the control group: ‐ 1.70 (95% CI ‐2.13 to ‐1.26) | 278 | ⊕⊕⊕⊕ | Bias: there was low risk of bias in all three studies. Consistency: the findings of the three studies were consistent, I2 = 0% (no heterogeneity). Precision: large sample size (no lack of precision). Indirectness: the studies were conducted in the target population (no concern about indirectness). |
| PIPP 60 s after heel lance Range of scale 0‐21 for infants < 28 weeks PMA and 0‐18 for infants > 36 weeks PMA A lower score = less pain | The mean PIPP score ranged across control groups from 10.54 to 11.2 | The WM PIPP score in the sucrose + NNS group was lower than in the control group: ‐ 2.14 (95% CI ‐3.34 to ‐0.94) | 164 (2) | ⊕⊕⊕⊕ | Bias: there was low risk of bias in both studies Consistency: the findings of the two studies were consistent, I2 = 0% (no heterogeneity) Precision: large sample size (no lack of precision) Indirectness: the studies were conducted in the target population (no concern about indirectness) |
| *The basis for the assumed risk was 'The mean NFCS and PIPP scores across control groups according to the values reported in the Assumed risk column. The corresponding risk was the mean in the intervention groups for the NFCS and PIPP scores with their 95% CI'. | |||||
| GRADE Working Group grades of evidence | |||||
| Sucrose (24%) + NNS + NIDCAP compared with breast milk (by breastfeeding) for heel lance‐associated pain | |||||
| Patient or population: neonates with heel lance‐associated pain Settings: hospital Intervention: sucrose (24%) + NNS + NIDCAP Comparison: breast milk (by breastfeeding) | |||||
| Outcomes | Illustrative comparative risks* (95% CI) | No of participants | Quality of the evidence | Comments | |
| Assumed risk | Corresponding risk | ||||
| Breast milk (by breastfeeding) | Sucrose (24%) + NNS + NIDCAP | ||||
| PIPP score Range of scale 0‐21 for infants < 28 weeks PMA and 0‐18 for infants > 36 weeks PMA A lower score = less pain | The mean PIPP score in the breast milk (by breast feeding) group was 7 | The mean PIPP score in the sucrose (24%) + NNS + NIDCAP group was lower than in the control group: ‐ 1.75 (95% CI ‐4.03 to 0.53) | 47 (1) | ⊕⊕⊝⊝ | Bias: there was a high risk of performance and detection bias as the interventions could not be blinded Consistency: as there was only one study in this analysis concern about consistency was N/A Precision: small sample size (lack of precision) Indirectness: the study was conducted in the target population (no concern about indirectness) |
| *The basis for the assumed risk was 'The mean PIPP score in the control group according to the value reported in the Assumed risk column. The corresponding risk was the mean in the intervention group for the PIPP score with its 95% CI'. | |||||
| GRADE Working Group grades of evidence | |||||
| Sucrose (24%) + NNS + NIDCAP support compared with breast milk (by syringe) for heel lance‐associated pain | |||||
| Patient or population: neonates with heel lance‐associated pain Settings: hospital Intervention: sucrose (24%) + NNS + NIDCAP support Comparison: breast milk (by syringe) | |||||
| Outcomes | Illustrative comparative risks* (95% CI) | No of participants | Quality of the evidence | Comments | |
| Assumed risk | Corresponding risk | ||||
| Breast milk (by syringe) | Sucrose (24%) + NNS + NIDCAP support | ||||
| PIPP score Range of scale 0‐21 for infants < 28 weeks PMA and 0‐18 for infants > 36 weeks PMA A lower score = less pain | The mean PIPP score in the breast milk (by syringe) group was 5.38 | The mean PIPP score in the sucrose (24%) + NNS + NIDCAP support group was lower than in the control group: ‐0.13 (95% CI ‐2.41 to 2.15) | 47 (1) | ⊕⊕⊝⊝ | Bias: there was a high risk of performance and detection bias as the interventions could not be blinded Consistency: as there was only one study in this analysis concern about consistency was N/A Precision: small sample size (lack of precision) Indirectness: the study was conducted in the target population (no concern about indirectness) |
| *The basis for the assumed risk was 'The mean PIPP score in the control group according to the value reported in the Assumed risk column. The corresponding risk was the mean in the intervention group for the PIPP score with its 95% CI'. | |||||
| GRADE Working Group grades of evidence | |||||
| Sucrose (24%) compared with laser acupuncture for pain associated with heel lance | |||||
| Patient or population: neonates with pain associated with heel lance Settings: hospital Intervention: sucrose (24%) Comparison: laser acupuncture | |||||
| Outcomes | Illustrative comparative risks* (95% CI) | No of participants | Quality of the evidence | Comments | |
| Assumed risk | Corresponding risk | ||||
| Laser acupuncture | Sucrose (24%) | ||||
| NIPS score Range of scale 0‐7 A lower score = less pain | The mean NIPS score was 4.52 in the laser acupuncture group | The mean NIPS score in the sucrose group was lower than in the laser group: ‐0.86 (95% CI ‐1.43 to ‐0.29) | 42 (1) | ⊕⊕⊝⊝ | Bias: There was high risk of selection bias and performance bias in this study Outcome assessments were made from video tapes (low risk of bias) Consistency: As there was only one study in this analysis concern about consistency was N/A Precision: small sample size (lack of precision) Indirectness: the study was conducted in the target population (no concern about indirectness) |
| *The basis for the assumed risk was 'The mean NIPS score in the control group according to the value reported in the Assumed risk column. The corresponding risk was the mean in the intervention group for the NIPS score with its 95% CI'. | |||||
| GRADE Working Group grades of evidence | |||||
| Sucrose (24%) compared with sucrose (24%) + NNS for pain associated with heel lance | |||||
| Patient or population: neonates with pain associated with heel lance Settings: hospital Intervention: sucrose (24%) Comparison: sucrose (24%) + NNS | |||||
| Outcomes | Illustrative comparative risks* (95% CI) | No of participants | Quality of the evidence | Comments | |
| Assumed risk | Corresponding risk | ||||
| Sucrose (24%) + NNS | Sucrose (24%) | ||||
| Revised NFCS Range of scale 0‐10 in term infants 0‐9 in preterm infants A lower score = less pain | The mean NFCS score in the sucrose (24%) + NNS group was 0.02 | The mean NFCS score in the sucrose (24%) only group was higher than in the sucrose (24%) + NNS group: 0.43 (95% CI 0.23 to 0.63) | 343 (1) | ⊕⊕⊕⊝ | Bias: there was a risk of performance and detection bias in this study as the coder could have distinguished the different groups Consistency: as this was a single study a rating of consistency was N/A Precision: this study had a very large sample size with a narrow 95% CI (no concerns about precision) Directness: the study was conducted in the target population ‐ no concerns about indirectness |
| *The basis for the assumed risk was 'The mean NFCS score in the control group according to the value reported in the Assumed risk column. The corresponding risk was the mean in the intervention group for the NFCS score with its 95% CI'. | |||||
| GRADE Working Group grades of evidence | |||||
| Sucrose (24%) compared with sucrose (24%) + swaddling for pain associated with heel lance | |||||
| Patient or population: neonates with pain associated with heel lance Settings: hospital Intervention: sucrose (24%) Comparison: sucrose (24%) + swaddling | |||||
| Outcomes | Illustrative comparative risks* (95% CI) | No of participants | Quality of the evidence | Comments | |
| Assumed risk | Corresponding risk | ||||
| Sucrose (24%) + swaddling | Sucrose (24%) | ||||
| Revised NFCS Range of scale 0‐10 in term infants 0‐9 in preterm infants A lower score = less pain | The mean NFCS score in the sucrose (24%) + swaddling group was 0.05 | The mean NFCS score in the sucrose (24%) group was higher than in the sucrose (24%) + swaddling group: 0.40 (95% CI 0.19 to 0.61) | 343 (1) | ⊕⊕⊕⊝ | Bias: there was a risk of performance and detection bias in this study as the coder could have distinguished the different groups Consistency: as this was a single study a rating of consistency was N/A Precision: this study had a very large sample size with a narrow 95% CI (no concerns about precision) Directness: the study was conducted in the target population ‐ no concerns about indirectness |
| *The basis for the assumed risk was 'The mean NFCS score in the control group according to the value reported in the Assumed risk column. The corresponding risk was the mean in the intervention group for the NFCS score with its 95% CI'. | |||||
| GRADE Working Group grades of evidence | |||||
| Sucrose (24%) compared with sucrose (24%) + NNS + swaddling for pain associated with heel lance | |||||
| Patient or population: neonates with pain associated with heel lance Settings: hospital Intervention: sucrose (24%) Comparison: sucrose (24%) + NNS + swaddling | |||||
| Outcomes | Illustrative comparative risks* (95% CI) | No of participants | Quality of the evidence | Comments | |
| Assumed risk | Corresponding risk | ||||
| Sucrose (24%) + NNS + swaddling | Sucrose (24%) | ||||
| Revised NFCS Range of scale 0‐10 in term infants 0‐9 in preterm infants A lower score = less pain | The mean NFCS score in the sucrose (24%) + NNS + swaddling group was 0.02 | The mean NFCS score in the sucrose (24%) group was higher than in the sucrose (24%) + NNS + swaddling group: 0.43 (95% CI 0.23 to 0.63) | 337 (1) | ⊕⊕⊕⊝ | Bias: there was a risk of performance and detection bias in this study as the coder could have distinguished the different groups Consistency: as this was a single study a rating of consistency was N/A Precision: this study had a very large sample size with a narrow 95% CI (no concerns about precision) Directness: the study was conducted in the target population ‐ no concerns about indirectness |
| *The basis for the assumed risk was 'The mean NFCS score in the control group according to the value reported in the Assumed risk column. The corresponding risk was the mean in the intervention group for the NFCS score with its 95% CI'. | |||||
| GRADE Working Group grades of evidence | |||||
| Sucrose (20%) compared with facilitated tucking for pain associated with repeated heel lances | |||||
| Patient or population: neonates with pain associated with repeated heel lances Settings: hospital Intervention: sucrose (20%) Comparison: facilitated tucking | |||||
| Outcomes | Illustrative comparative risks* (95% CI) | No of participants | Quality of the evidence | Comments | |
| Assumed risk | Corresponding risk | ||||
| Facilitated tucking | Sucrose (20%) | ||||
| Total Bernese Pain Scale for Neonates (BPSN) during heel lance Range: The BPSN contains 9 items; 3 physiologic (HR, RR, oxygen saturation) and 6 behavioural (grimacing, body movements, crying, skin colour, sleeping patterns, consolation) items. Each item is scored on a 3 point scale (0‐3) points. Higher scores for the behavioural items and greater changes in the physiological items indicate increased pain, whereas a total score of < 11 is considered nonpainful. | The mean Total Bernese Pain Scale in the control group was 9.75 | The mean Total Bernese Pain Scale was lower in the in the intervention group: MD ‐2.27 (95% CI ‐4.66 to 0.12) | 48 (1) | ⊕⊕⊕⊝ | Bias: there was some risk of bias in this study as the intervention was not blinded Consistency: as this was a single study consistency was N/A Precision: this was a small study and the CI was wide around the point estimate Directness: the study was conducted in the target population ‐ no concerns about indirectness |
| Total Bernese Pain Scale for Neonates during recovery from heel lance Range: See comments above. | The mean Total Bernese Pain Scalein the control group was 5.18 | The mean Total Bernese Pain Scale was lower in the intervention group: MD ‐0.31 (95% CI ‐1.72 to 1.10) | 48 | ⊕⊕⊕⊝ | Bias: There was some risk of bias in this study as the intervention was not blinded. Consistency: As this was a single study consistency was N/A. Precision: This was a small study and the CI was wide around the point estimate. Directness: The study was conducted in the target population ‐ no concerns about indirectness. |
| *The basis for the assumed risk was 'The mean Total Bernese Pain Scale for Neonates score in the control group according to the value reported in the Assumed risk column. The corresponding risk was the mean in the intervention group for the mean Total Bernese Pain Scale for Neonates score with its 95% CI'. | |||||
| GRADE Working Group grades of evidence | |||||
| Sucrose (20%) compared with facilitated tucking and sucrose (20%) for pain associated with repeated heel lances | |||||
| Patient or population: neonates with pain associated with repeated heel lances Settings: hospital Intervention: sucrose (20%) Comparison: facilitated tucking and sucrose (20%) | |||||
| Outcomes | Illustrative comparative risks* (95% CI) | No of participants | Quality of the evidence | Comments | |
| Assumed risk | Corresponding risk | ||||
| Facilitated tucking and sucrose (20%) | Sucrose (20%) | ||||
| Total Bernese Pain Scale for Neonates during heel lance (preterm infants) Range: The BPSN contains 9 items; 3 physiologic (HR, RR, oxygen saturation) and 6 behavioural (grimacing, body movements, crying, skin colour, sleeping patterns, consolation) items. Each item is scored on a 3 point scale (0‐3) points. Higher scores for the behavioural items and greater changes in the physiological items indicate increased pain, whereas a total score of < 11 is considered nonpainful. A lower score = less pain | The mean Total Bernese Pain Scale for Neonates in the control group was 7.53 | The mean Total Bernese Pain Scale for Neonates in the intervention group was lower than in the control group: MD ‐0.05 (95% CI ‐2.16 to 2.06) | 47 | ⊕⊕⊕⊝ | Bias: there was some risk of bias in this study as the intervention was not blinded Consistency: as this was a single study consistency was N/A Precision: this was a small study and the CI was wide around the point estimate Directness: the study was conducted in the target population ‐ no concerns about indirectness |
| Total Bernese Pain Scale for Neonates during recovery (preterm infants) Range: See information above. A lower score = less pain | The mean Total Bernese Pain Scale for Neonates in the control group was 4.23 | The mean Total Bernese Pain Scale for Neonates in the intervention groups was higher than in the control group: MD 0.64 (95% CI ‐0.73 to 2.01) | 47 | ⊕⊕⊕⊝ | Bias: there was some risk of bias in this study as the intervention was not blinded Consistency: as this was a single study consistency was N/A Precision: this was a small study and the CI was wide around the point estimate Directness: the study was conducted in the target population ‐ no concerns about indirectness |
| *The basis for the assumed risk was 'The mean Total Bernese Pain Scale for Neonates score in the control group according to the value reported in the Assumed risk column. The corresponding risk was the mean in the intervention group for the mean Total Bernese Pain Scale for Neonates score with its 95% CI'. | |||||
| GRADE Working Group grades of evidence | |||||
| Sucrose (12%) compared with water for pain associated with venipuncture | |||||
| Patient or population: neonates with pain associated with venipuncture Settings: hospital Intervention: sucrose (12%) Comparison: water | |||||
| Outcomes | Illustrative comparative risks* (95% CI) | No of participants | Quality of the evidence | Comments | |
| Assumed risk | Corresponding risk | ||||
| Water | Sucrose (12%) | ||||
| NIPS score in term and preterm infants Range of scale 0‐7 A lower score = less pain | The mean NIPS score was 3.8 in the water group | The mean NIPS score in the sucrose group was lower than in the water group: 0.90 (95% CI ‐1.81 to 0.01) | 111 (1) | ⊕⊕⊕⊝ | Bias: it is uncertain if outcome assessors were blinded Consistency: as this was a single study a rating of consistency was N/A Precision: this study had a relatively large sample size with a narrow 95% CI (no concerns about precision) Directness: the study was conducted in the target population ‐ no concerns about indirectness |
| *The basis for the assumed risk was 'The mean NIPS score in the control group according to the value reported in the Assumed risk column. The corresponding risk was the mean in the intervention group for the NIPS score with its 95% CI'. | |||||
| GRADE Working Group grades of evidence | |||||
| Sucrose (24% to 30%) compared with control (sterile water or no treatment) for pain associated with venipuncture | |||||
| Patient or population: neonates with pain associated with venipuncture Settings: hospital Intervention: sucrose (24% to 30%) Comparison: sterile water or no treatment | |||||
| Outcomes | Illustrative comparative risks* (95% CI) | No of participants | Quality of the evidence | Comments | |
| Assumed risk | Corresponding risk | ||||
| Sterile water or no treatment | Sucrose (24% to 30%) | ||||
| PIPP score during venipuncture Range of scale 0‐21 for infants < 28 weeks PMA and 0‐18 for infants > 36 weeks PMA A lower score = less pain | The mean PIPP score ranged across control groups from 8.9 to 9.2 | The WM PIPP score in the intervention group was lower than in the control group: 2.79 (95% CI‐3.76 to ‐1.83) | 213 (2 groups in 1 study) | ⊕⊕⊕⊕ | Bias: low risk of bias Consistency: this study reported on two groups of infants; one group was born to non‐diabetic mothers and the other group to diabetic mothers. There was no heterogeneity for the results of the two groups I2 = 0% Precision: this study (with the two groups combined) had a large sample size with a narrow 95% CI (no concerns about precision) Directness: the study was conducted in the target population ‐ no concerns about indirectness |
| *The basis for the assumed risk was 'The mean PIPP score in the control groups according to the values reported in the Assumed risk column. The corresponding risk was the mean in the intervention groups for the PIPP score with its 95% CI'. | |||||
| GRADE Working Group grades of evidence | |||||
| Sucrose (24% to 30%) compared with sucrose (24% to 30%) + EMLA/liposomal lidocaine cream on the skin for pain associated with venipuncture | |||||
| Patient or population: neonates with pain associated with venipuncture Settings: hospital Intervention: sucrose (24% to 30%) Comparison: sucrose (24% to 30%) + EMLA/liposomal lidocaine cream on the skin | |||||
| Outcomes | Illustrative comparative risks* (95% CI) | No of participants | Quality of the evidence | Comments | |
| Assumed risk | Corresponding risk | ||||
| Sucrose (24% to 30%) + EMLA/liposomal lidocaine cream on the skin | Sucrose (24% to 30%) | ||||
| PIPP score Range of scale 0‐21 for infants < 28 weeks PMA and 0‐18 for infants > 36 weeks PMA A lower score = less pain | The mean PIPP score was 7.2 in the control group | The mean PIPP score in the intervention group was higher than in the control group: 1.30 (95% CI ‐0.12 to 2.72) | 76 (1) | ⊕⊕⊕⊝ | Bias: low risk of bias Consistency: as this was the only study consistency was N/A Precision: this was a relatively small study and the CIs were wide around the point estimate Directness: the study was conducted in the target population ‐ no concerns about indirectness |
| PIPP score during post‐injection period Range of scale 0‐21 for infants < 28 weeks PMA and 0‐18 for infants > 36 weeks PMA A lower score = less pain | The mean PIPP score was 7.1 in the control group | The mean PIPP in the intervention group was higher than in the control group: 0.60 (95% CI ‐0.73 to 1.93) | 76 (1) | ⊕⊕⊕⊝ | Bias: low risk of bias Consistency: as this was the only study consistency was N/A Precision: this was a relatively small study and the CIs were wide around the point estimate Directness: the study was conducted in the target population ‐ no concerns about indirectness |
| DAN score during venipuncture (preterm infants) Range of scale 0‐10 A lower score = less pain | The mean DAN score was 6.4 in the control group | The mean DAN score in the intervention group was higher than in the control group: 1.30 (95% CI 0.26 to 2.34) | 76 (1) | ⊕⊕⊕⊝ | Bias: low risk of bias Consistency: as this was the only study consistency was N/A Precision: this was a relatively small study and the CIs were wide around the point estimate Directness: the study was conducted in the target population ‐ no concerns about indirectness |
| DAN score during the post‐injection period Range of scale 0‐10 A lower score = less pain | The mean DAN score in the control group was 5.7 | The mean DAN score in the intervention groups was higher than in the control group: 1.40 (95% CI 0.03 to 2.77) | 76 (1) | ⊕⊕⊕⊝ | Bias: low risk of bias Consistency: as this was the only study consistency was N/A Precision: this was a relatively small study and the CIs were wide around the point estimate Directness: the study was conducted in the target population ‐ no concerns about indirectness |
| *The basis for the assumed risk was 'The mean PIPP scores and the DAN scores in the control groups according to the values reported in the Assumed risk column. The corresponding risk was the means in the intervention groups for the PIPP scores and the DAN scores with their 95% CI'. | |||||
| GRADE Working Group grades of evidence | |||||
| Sucrose (20% to 25%) compared with water or no intervention for pain associated with intramuscular injection | |||||
| Patient or population: neonates with pain associated with intramuscular injection Settings: hospital Intervention: sucrose (20% to 25%) Comparison: water or no intervention | |||||
| Outcomes | Illustrative comparative risks* (95% CI) | No of participants | Quality of the evidence | Comments | |
| Assumed risk | Corresponding risk | ||||
| Water or no intervention | Sucrose (20% to 25%) | ||||
| NIPS during 1‐2 minutes after IM injection Range of scale 0‐7 A lower score = less pain | The mean NIPS score in the control group was 5.2 | The mean NIPS score in the intervention group was lower than in the control group: ‐2.30 (95% CI ‐2.93 to ‐1.67) | 60 (1) | ⊕⊕⊝⊝ | Bias: concerns about bias for random sequence generation, allocation concealment and lack of blinding for performance and detection Consistency: as this was the only study consistency was N/A Precision: this was a relatively small study and the CIs were wide around the point estimate Directness: the study was conducted in the target population ‐ no concerns about indirectness |
| PIPP during IM injection (term infants) ‐ Infants of non‐diabetic and diabetic mothers Range of scale 0‐21 for infants < 28 weeks PMA and 0‐18 for infants > 36 weeks PMA A lower score = less pain | The mean PIPP score ranged across control groups from 7.2 to 8.5 | The WM PIPP score in the intervention groups was lower than in the control group: ‐1.05 (95% CI ‐1.98 to ‐0.12) | 232 (2 groups in 1 study) | ⊕⊕⊕⊕ | Bias: no concerns about bias Consistency: there was high consistency between the two groups in this study. I2 = 0% Precision: this was a large study and the CIs were narrow around the point estimates Directness: the study was conducted in the target population ‐ no concerns about indirectness |
| *The basis for the assumed risk was 'The mean NIPP score and the PIPP scores in the control groups according to the values reported in the Assumed risk column. The corresponding risk was the mean in the intervention groups for the NIPP score and the PIPP scores with their 95% CI'. | |||||
| GRADE Working Group grades of evidence | |||||
| Sucrose (25%) compared with glucose (25%) for pain associated with intramuscular injection | |||||
| Patient or population: neonates with pain associated with intramuscular injection Settings: hospital Intervention:sucrose (25%) Comparison: glucose (25%) | |||||
| Outcomes | Illustrative comparative risks* (95% CI) | No of participants | Quality of the evidence | Comments | |
| Assumed risk | Corresponding risk | ||||
| Glucose (25%) | Sucrose (25%) | ||||
| NIPS during 1‐2 minutes after immunization Range of scale 0‐7 A lower score = less pain | The mean NIPS score was 3 in the control group | The mean NIPS score in the intervention group was lower than the mean score in the control group: ‐ 0.10 (95% CI ‐0.89 to 0.69) | 60 (1) | ⊕⊕⊝⊝ | Bias: concerns about bias for random sequence generation, allocation concealment and lack of blinding for performance and detection Consistency: no concerns as this was the only study Precision: this was a relatively small study and the CIs were wide around the point estimate Directness: the study was conducted in the target population ‐ no concerns about indirectness |
| *The basis for the assumed risk was 'The mean NIPS score in the control group according to the value reported in the Assumed risk column. The corresponding risk was the mean in the intervention group for the NIPS score with its 95% CI'. | |||||
| GRADE Working Group grades of evidence | |||||
| Sucrose (24%) compared with sterile water for pain associated with bladder catheterization | |||||
| Patient or population: neonates with pain associated with bladder catheterization Settings: hospital Intervention: sucrose (24%) Comparison: sterile water | |||||
| Outcomes | Illustrative comparative risks* (95% CI) | No of participants | Quality of the evidence | Comments | |
| Assumed risk | Corresponding risk | ||||
| Sterile water | Sucrose (24%) | ||||
| Change in DAN score Range of scale 0‐10 A lower score = less pain | The mean change in DAN score in the control group was 5.29 | The mean change in DAN score was lower in the intervention group than in the control group: ‐ 2.43 (95% CI ‐4.50 to ‐0.36) | 33 (1) | ⊕⊕⊕⊝ | Bias: There was a low risk of bias in this study Consistency: as this was a single study concerns about consistency were N/A Precision: this was a small study and the CI was wide around the point estimate Directness: the study was conducted in the target population ‐ no concerns about indirectness |
| *The basis for the assumed risk was 'The mean Change in DAN score in the control group according to the value reported in the Assumed risk column. The corresponding risk was the mean in the intervention group for the NIPS score with its 95% CI'. | |||||
| GRADE Working Group grades of evidence | |||||
| Sucrose (24%) compared with distilled water for pain associated with orogastric tube insertion | |||||
| Patient or population: neonates with pain associated with orogastric tube insertion Settings: hospital Intervention: sucrose (24%) Comparison: distilled water | |||||
| Outcomes | Illustrative comparative risks* (95% CI) | No of participants | Quality of the evidence | Comments | |
| Assumed risk | Corresponding risk | ||||
| Distilled water | Sucrose (24%) | ||||
| PIPP score intra procedure Range of scale 0‐21 for infants < 28 weeks PMA and 0‐18 for infants > 36 weeks PMA A lower score = less pain | The mean PIPP score was 7.9 in the control group | The mean PIPP score in the intervention group was lower than in the control group: ‐0.30 (95% CI ‐1.33 to 0.73) | 105 (1) | ⊕⊕⊕⊕ | Bias: there was a low risk of bias in this study. The protocol for the study was available to us and there were no deviations Consistency: as this was a single study concerns about consistency were N/A Precision: this was a moderately sized study and the CI was narrow around the point estimate Directness: the study was conducted in the target population ‐ no concerns about indirectness |
| PIPP score 30 seconds post procedure Range of scale 0‐21 for infants < 28 weeks PMA and 0‐18 for infants > 36 weeks PMA A lower score = less pain | The mean PIPP score was 5.6 in the control group | The mean PIPP score in the intervention group was lower than in the control group ‐1.30 (95% CI ‐2.31 to ‐0.29) | 105 (1) | ⊕⊕⊕⊕ | Bias: there was a low risk of bias in this study. The protocol for the study was available to us and there were no deviations Consistency: as this was a single study concerns about consistency were N/A Precision: this was a moderately sized study and the CI was narrow around the point estimate Directness: the study was conducted in the target population ‐ no concerns about indirectness |
| PIPP score 1 min post procedure Range of scale 0‐21 for infants < 28 weeks PMA and 0‐18 for infants > 36 weeks PMA A lower score = less pain | The mean PIPP score was 4.6 in the control group | The mean PIPP score in the intervention group was lower than in the control group: ‐0.50 (95% CI ‐1.40 to 0.40) | 105 (1) | ⊕⊕⊕⊕ | Bias: there was a low risk of bias in this study. The protocol for the study was available to us and there were no deviations Consistency: as this was a single study concerns about consistency were N/A Precision: this was a moderately sized study and the CI was narrow around the point estimate Directness: the study was conducted in the target population ‐ no concerns about indirectness |
| *The basis for the assumed risk was 'The mean PIPP scores in the control group according to the values reported in the Assumed risk column. The corresponding risk was the mean in the intervention groups for the PIPP scores with their 95% CI'. | |||||
| GRADE Working Group grades of evidence | |||||
| Sucrose (24%) by syringe + swaddled +pacifier compared with water by syringe + swaddled + pacifier for pain/distress associated with retinopathy of prematurity (ROP) examination | |||||
| Patient or population: neonates with pain/distress associated with ROP examination Settings: hospital Intervention: sucrose (24%) by syringe + swaddled + pacifier Comparison: water by syringe + swaddled + soother | |||||
| Outcomes | Illustrative comparative risks* (95% CI) | No of participants | Quality of the evidence | Comments | |
| Assumed risk | Corresponding risk | ||||
| Water by syringe + swaddled + pacifier | Sucrose (24%) by syringe + swaddled +pacifier | ||||
| PIPP during exam Range of scale 0‐21 for infants < 28 weeks PMA and 0‐18 for infants > 36 weeks PMA A lower score = less pain | The mean PIPP score was 14 in the control group. | The mean PIPP score in the intervention group was neither lower nor higher than in the control group: 0.00 (95% CI ‐2.08 to 2.08 | 32 | ⊕⊕⊝⊝ | Bias: the authors did not describe how the random sequence was generated, nor did they describe how allocation concealment was achieved Consistency: as this was the only study concerns about consistency were N/A Precision: this was a small study and the CI were wide around the point estimate Directness: the study was conducted in the target population ‐ no concerns about indirectness |
| *The basis for the assumed risk was 'The mean PIPP score in the control group according to the value reported in the Assumed risk column. The corresponding risk was the mean in the intervention group for the PIPP scores with its 95% CI'. | |||||
| GRADE Working Group grades of evidence | |||||
| Sucrose (24% to 33%) (sucrose or sucrose + NNS) compared with water (or water + NNS) for pain/distress associated with retinopathy of prematurity (ROP) examination | |||||
| Patient or population: neonates Settings: hospital Intervention: sucrose (24% to 33%) (sucrose or sucrose + NNS) Comparison: water (or water + NNS) | |||||
| Outcomes | Illustrative comparative risks* (95% CI) | No of participants | Quality of the evidence | Comments | |
| Assumed risk | Corresponding risk | ||||
| Water (or water + NNS) | Sucrose (24% to 33%) (or sucrose + NNS) | ||||
| PIPP score during eye examination Range of scale 0‐21 for infants < 28 weeks PMA and 0‐18 for infants > 36 weeks PMA A lower score = less pain | The mean PIPP score ranged across control groups from 11.4 to 16.4 | The WM PIPP score in the intervention groups was lower than in the control group: ‐2.15 (95% CI ‐2.86 to ‐1.43) | 134 (3) | ⊕⊕⊕⊝ | Bias: there were some concerns about risk of bias in these studies for random sequence generation and allocation concealment Consistency: the findings were consistent with each other; I2 = 46% (low heterogeneity) Precision: this was a moderately sized meta‐analysis and the CI was narrow around the typical point estimate Directness: the studies were conducted in the target population ‐ no concerns about indirectness |
| *The basis for the assumed risk was 'The mean PIPP score in the control group according to the value reported in the Assumed risk column. The corresponding risk was the mean in the intervention group for the PIPP scores with its 95% CI'. | |||||
| GRADE Working Group grades of evidence | |||||
| Sucrose (24%) compared with EMLA for pain associated with circumcision | |||||
| Patient or population: neonates undergoing circumcision Settings: hospital Intervention: sucrose (24%) Comparison: EMLA | |||||
| Outcomes | Illustrative comparative risks* (95% CI) | No of participants | Quality of the evidence | Comments | |
| Assumed risk | Corresponding risk | ||||
| EMLA | Sucrose (24%) | ||||
| N‐PASS score during circumcision Range of scale 0‐13 A lower score = less pain | The mean N‐PASS score in the control group was 5.8 | The mean N‐PASS score in the intervention group was higher: MD 2.40 (95% CI 1.85 to 2.95) | 60 | ⊕⊕⊝⊝ | Bias: there were concerns about risk of bias in this study for random sequence generation (unclear risk) and high risk of performance and detection bias Consistency: as this was the only study concerns about consistency were N/A Precision: this was a small study and the CI was wide around the point estimate Directness: the study was conducted in the target population ‐ no concerns about indirectness |
| N‐PASS score after 5 min Range of scale 0‐13 A lower score = less pain | The mean N‐PASS score in the control group was 3.1 | The mean N‐PASS score in the intervention group was higher: MD 1.40 (95% CI 0.74 to 2.06) | 60 | ⊕⊕⊝⊝ | Bias: there were concerns about risk of bias in this study for random sequence generation (unclear risk) and high risk of performance and detection bias Consistency: as this was the only study concerns about consistency were N/A Precision: this was a small study and the CI was wide around the point estimate Directness: the study was conducted in the target population ‐ no concerns about indirectness |
| *The basis for the assumed risk was 'The mean N‐PASS score in the control group according to the value reported in the Assumed risk column. The corresponding risk was the mean in the intervention group for the N‐PASS score with its 95% CI'. | |||||
| GRADE Working Group grades of evidence | |||||
| Sucrose (24%) compared with EMLA + sucrose (24%) for pain associated with circumcision | |||||
| Patient or population: neonates undergoing circumcision Settings: hospital Intervention: sucrose (24%) Comparison: EMLA + sucrose (24%) | |||||
| Outcomes | Illustrative comparative risks* (95% CI) | No of participants | Quality of the evidence | Comments | |
| Assumed risk | Corresponding risk | ||||
| EMLA + sucrose (24%) | Sucrose (24%) | ||||
| N‐PASS score during circumcision Range 0‐13 A lower score = less pain | The mean N‐PASS score in the control group was 5.2 | The mean N‐PASS score in the intervention group was higher: MD 3.00 (95% CI 2.42 to 3.58) | 60 | ⊕⊕⊝⊝ | Bias: there were concerns about risk of bias in this study for random sequence generation (unclear risk) and high risk of performance and detection bias Consistency: as this was the only study concerns about consistency were N/A Precision: this was a small study and the CI was wide around the point estimate Directness: the study was conducted in the target population ‐ no concerns about indirectness |
| N‐PASS score after 5 min Range 0‐13 A lower score = less pain | The mean N‐PASS score in the control group was 3.3 | The mean N‐PASS score in the intervention group was higher: MD 1.20 (95% CI 0.49 to 1.91) | 60 | ⊕⊕⊝⊝ | Bias: there were concerns about risk of bias in this study for random sequence generation (unclear risk) and high risk of performance and detection bias Consistency: as this was the only study concerns about consistency were N/A Precision: this was a small study and the CI was wide around the point estimate Directness: the study was conducted in the target population ‐ no concerns about indirectness |
| *The basis for the assumed risk was 'The mean N‐PASS score in the control group according to the value reported in the Assumed risk column. The corresponding risk was the mean in the intervention group for the N‐PASS score with its 95% CI'. | |||||
| GRADE Working Group grades of evidence | |||||
| Sucrose (24%) compared with for water stress associated with echocardiography | |||||
| Patient or population: neonates undergoing echocardiography Settings: hospital Intervention: sucrose (24%) Comparison: water | |||||
| Outcomes | Illustrative comparative risks* (95% CI) | No of participants | Quality of the evidence | Comments | |
| Assumed risk | Corresponding risk | ||||
| No intervention | Sucrose (24%) | ||||
| PIPP | The mean PIPP score was 7.4 in the control group Range of scale 0‐21 for infants < 28 weeks PMA and 0‐18 for infants > 36 weeks PMA A lower score = less pain | The mean PIPP score in the intervention group was lower than in the control group: ‐ 2.15 (95% CI ‐3.30 to ‐1.00) | 104 (1) | ⊕⊕⊝⊝ | Bias: there were concerns about allocation concealment bias and performance blinding in this study Consistency: as this was a single study concerns about consistency were N/A Precision: this was a moderately sized study and the CI was narrow around the point estimate Directness: the study was conducted in the target population ‐ no concerns about indirectness |
| *The basis for the assumed risk was 'The mean PIPP score in the control group according to the value reported in the Assumed risk column. The corresponding risk was the mean in the intervention group for the PIPP scores with its 95% CI'. | |||||
| GRADE Working Group grades of evidence | |||||
| Sucrose (24%) compared with water for potentially painful procedures for a period of seven days | |||||
| Patient or population: neonates with pain associated with potentially painful procedures for 7 days Settings: hospital Intervention: sucrose (24%) Comparison: water | |||||
| Outcomes | Illustrative comparative risks* (95% CI) | No of participants | Quality of the evidence | Comments | |
| Assumed risk | Corresponding risk | ||||
| Water | Sucrose (24%) | ||||
| Motor development and vigor (MDV) domain of the NAPI tool Normative mean and SD at 36 weeks PMA 63 (14.5) Higher scores are associated with more mature behaviour | The mean MDV score at 40 weeks PMA was 76.48 in the control group | The mean MDV score at 40 weeks PMA in the intervention group was lower than in the control group: ‐1.83 (95% CI ‐8.59 to 4.93) | 93 (1) | ⊕⊕⊕⊕ | Bias: there were no concerns about bias in this study Consistency: as this was a single study concerns about consistency were N/A Precision: this was a moderately sized study and the CI was narrow around the point estimate Directness: the study was conducted in the target population ‐ no concerns about indirectness |
| Alertness and orientation (AO) domain of the NAPI tool Normative mean and SD at 36 weeks PMA 54 (19.4) Higher scores are associated with more mature behaviour | The mean AO score at 40 weeks PMA was 67.77 in the control group | The mean AO score at 40 weeks PMA in the intervention group was higher than in the control group: 3.09 (95% CI ‐6.49 to 12.67) | 93 (1) | ⊕⊕⊕⊕ | Bias: there were no concerns about bias in this study Consistency: as this was a single study concerns about consistency was N/A Precision: this was a moderately sized study and the CI was narrow around the point estimate Directness: the study was conducted in the target population ‐ no concerns about indirectness |
| *The basis for the assumed risk was 'The mean MDV and the mean AO scores in the control group according to the values reported in the Assumed risk column. The corresponding risk was the means in the intervention groups for the MDV and AO scores with their 95% CI'. | |||||
| GRADE Working Group grades of evidence | |||||
| Study | Participants | Procedure | Interventions | Outcomes | Metrics used | Results |
| 42 term newborns, undergoing heel lancing between postnatal days 3 to 8 as part of neonatal screening | Heel lance |
| NIPS Crying time | Mean and SD | The NIPS score was significantly lower in the sucrose group 3.66 ± 1.01 vs 4.52 ± 0.87 in the laser group (P = 0.006) The crying time was significantly lower in the sucrose group 46.66 s ± 37.82 vs 97.95 s ± 34.23 in the laser group (P = 0.000) Data included in RevMan‐analyses | |
|
| 75 full‐term infants | Heel lance |
The volume of 3mL was provided in 3 doses (1 mL prior to, 1 mL immediately before, and 1mL after the procedure) | NFCS, crying time, duration of crying, HR |
Median and IQR | Median crying time, duration of first cry and tachycardia, and time needed to return to baseline = longest in the distilled water group. Significantly shorter in the hind milk group when compared to distilled water group (P = 0.022, P = 0.008, P 0.009 and P = 0.038, respectively) No statistically significant differences observed between the hind milk and sucrose group for all measures Maximum HR in hind milk group was significantly lower than distilled water group (184 beats/min vs. 196 beats/min, P = 0.031) Significant reduction in average NFCS score. 1st min NFCS score and 5th min NFCS score in the hind milk group compared to the distilled water group (P = 0.006, P = 0.017 and P = 0.021, respectively) No data included in RevMan‐analyses |
| 131 preterm infants ≤ 36.5 weeks’ gestation who:
| Heel lance |
| PIPP after 2 min, plasma hypoxanthine, uric acid, xanthine, allantoin HR, oxygen saturation | Mean and lowest and highest values | Oral sucrose given before a single heel lance significantly decreased behavioural markers of pain | |
| 72 term infants, 22 h to 40 h old | Heel lance | 2 mL of one of the following solutions:
n = 8 for all groups | Crying time (%) during blood collection and 1, 2 and 3 min after heel lance Mean % of crying time per min at 1, 2 and 3 min after heel lance (recovery period) | Mean proportions
Graphically reported | Significantly less crying time during blood collection in the sucrose group (47%) compared to the water group (92%, P = 0.015) No data could be used in RevMan‐analyses | |
| 40 term newborn infants, 34 h to 55 h old | Heel lance | Prior to heel lance:
| % time crying 3 min after heel lance Mean change in HR % time grimacing | Mean percentage Mean change (beats/min) Graphically reported | 2 mL 12% (0.24 g) sucrose alone diminished cry duration from heel lance compared to water (8% vs. 50%, P = 0.003) and water with pacifier (8% vs. 35%, P = 0.002). Pacifier with 12% sucrose more effective in reducing cry duration compared to water with pacifier (5% vs. 35%, P = 0.001) or water alone (50%, P = 0.002) Mean HR increased significantly from treatment to heel lance in infants receiving water alone (mean increase of 17 beats/min, P = 0.002) and water with pacifier (mean increase of 20 beats/min, P = 0.005). Mean increase in HR also increased for the 12% sucrose and pacifier group (mean difference of 7.4 beats/min, P = 0.05) but not for infants receiving 12% sucrose alone (mean difference of 5.9 beats/min, P = 0.142) 12% sucrose reduced grimacing compared to water (P = 0.0003). 12% sucrose with pacifier reduced grimacing compared to water (P = 0.001) and pacifier alone (P = 0.04) No data could be used in RevMan‐analyses | |
| 16 preterm infants, 27 to 34 weeks' GA, PNA approximately 42 days | Heel lance |
| % time crying Recovery time until crying stopped Increase in HR Recovery time for HR TcPO2 (max increase ‐ kPa); TcPO2 (max decrease ‐ kPa); TcPO2 (difference between baseline and 10 min after end of intervention ‐ kPa); TcPCO2 (max decrease ‐ kPa); TcPCO2 (difference between baseline and 10 min after the end of intervention), recovery time for respirations Cerebral near‐infrared spectroscopy (cerebral oxyhaemoglobin, deoxyhaemoglobin, total blood volume) | Median, IQR | Cry duration (% of total duration of intervention) significantly reduced in 2 mL 50% (1.0 g) sucrose group (71.5%) compared to control group (93.5%, P = 0.002) Median increase in HR (beats/min) after heel lance was significantly reduced in the 2 mL 50% (1.0 g) sucrose group (35 beats/min) compared to water (51 beats/min), P = 0.005 No significant differences between groups with respect to measures for TcPO2 (P = 0.05) and TcPCO2 (P = 0.21) Decrease in cerebral blood volume was not significant between sucrose and placebo groups Data were not presented for effects of sucrose or water prior to cross over. No data could be used in RevMan‐analyses | |
| 71 preterm infants between 24 weeks 0/7 and 32 weeks 0/7 PMA | Repeated heel lances |
| Bernese Pain Scale for Neonates. Data collection occurred during:
The BPSN contains 9 items: 3 physiologic (HR, respiratory rate, and oxygen saturation) and 6 behavioral (grimacing, body movements, crying, skin colour, sleeping patterns, consolation) items. 3 phases (baseline, heel stick, recovery) of 5 heel stick procedures were videotaped for each infant | Mean, SD | Sucrose with and without FT had pain‐relieving effects even in preterm infants of GA ≤ 32 weeks having repeated pain exposures. These interventions remained effective during repeated heel sticks across time. FT was not as effective Data included in RevMan‐analyses | |
| 101 term infants Mean PMA:
| Heel lance |
| Duration of first cry (s), % crying time in first 2 min, and % crying time during blood sampling HR (beats/min) increase from baselines at 30 s following commencement of procedure Oxygen saturation decrease PIPP during blood sampling, 2 min after heel lance | Median, range | Median duration (s) of first cry: breastfeeding group; 3 (range 0 to 120) compared to sucrose group; 21 (range 0 to 120), P = 0.004 % crying during first 2 min: breastfeeding group 4 (range 0 to 100) compared to sucrose; 45 (range 0 to 100) (P < 0.0001) % crying during sampling: breastfeeding group; 8 (range 0 to 100) compared to sucrose 56.5 (range 0 to 100) (P = 0.0003) Median increase in HR (beats/min) from baseline to 30 s after start of heel lance was significantly lower in breastfeeding group; 13 (range ‐12 to 54) compared to sucrose group; 22 (range ‐32 to 65) (P = 0.005) Median decrease in oxygen saturation (%) from baseline to 30 s after start of heel lance was significantly greater in sucrose group; ‐3 (range ‐30 to 1) compared to breastfeeding group; ‐1 (range ‐14 to 2)) (P = 0.001) Median PIPP scores significantly lower in breastfeeding group (3.0) compared to sucrose group (8.5) (P < 0.0001 Data could not be used in RevMan analyses | |
| 190 preterm and term infants, mean GA 33.7 weeks, < 7 days PNA | Heel lance | 2 min prior to heel lance:
| PIPP scores at 30 and 60 s after heel lance Incidence of adverse events | Reported means, SD | Statistically significant difference in mean PIPP scores at both 30 s (P < 0.001) and 60 s (P < 0.001) after heel lance in favour of sucrose group and sucrose + NNS group. Post hoc Tukey tests showed infants who received sucrose + pacifier had significantly lower PIPP scores after heel lance at 30 s (mean 8.16, SD 3.24) compared to infants receiving sucrose alone (mean 9.77, SD 3.04, P = 0.007), or water + NNS (mean 10.19, SD 2.67, P < 0.001). At 60 s after heel lance, PIPP scores were significantly lower for sucrose + NNS group (mean 8.78, SD 4.03) compared to the sucrose alone group (mean 11.20, SD 3.25, P = 0.005) and water + NNS group (mean 11.20, SD 3.47, P = 0.007). No significant differences in PIPP scores found between sucrose alone group or water + NNS group at both follow‐up times 3 neonates in the sucrose alone group desaturated during the study period. No adverse events occurred with neonates randomized to the sucrose + NNS group Data used in RevMan‐analyses | |
| 94 term newborns, mean GA 39.4 weeks, 2nd or 3rd day of life | Heel lance |
All solutions given 3 times at 30‐s intervals | % time crying 1, 2, 3 min after heel lance Mean HR before intervention, 1, 2, 3 min after heel lance, mean vagal tone index before intervention, 1, 2, 3 min after heel lance Pain concatenation scores for facial activity before intervention, 1, 2, 3 min after heel lance | Not reported | Crying decreased over time (P < 0.001) but no significant interaction noted for time with holding, taste or holding and taste. Effect of taste on crying was significant (P < 0.05) in favour of sucrose group. Effect of holding not statistically significant (P = 0.09)). No statistically significant interaction between taste and holding to reduce crying (P = 0.37). Effect of combined interventions was additive Although no significant differences in mean HR due to holding or sucrose as main effects, there was significant interaction between holding and taste (P < 0.004), indicating synergistic effect that was also dependent on pre‐intervention HR (P < 0.004). No significant main effects noted for vagal tone; as with HR, effect of vagal tone was dependent on pre‐intervention vagal tone for both holding and taste interventions (P < 0.03). Pre‐intervention levels interacted to decrease HR and vagal tone in infants who had higher rates before interventions Pain concatenation scores measuring facial expressions of pain decreased over time (P < 0.001). Only the effect of holding reduced pain scores (P <0.02). No difference as to whether infant received sucrose (taste main effect P = 0.68) No data could be used in RevMan‐analyses | |
| 84 term newborns, approximately 17 to 19 h old | Heel lance |
| Duration of cry from procedure phase to 3 min postprocedure Vagal tone and vagal tone index Salivary cortisol levels | Mean and SE reported for time crying (s) | Significant decrease in duration of cry for the sugar‐coated pacifier group compared to the control group (P = 0.001) and the water‐moistened pacifier group (P = 0.006). Lower vagal tone during heel lance in the sugar‐coated pacifier group compared to the control group (P = 0.008) and oral sucrose group (P = 0.018). Lower vagal tone index in the sugar‐coated pacifier group compared to control group at heel lance (P = 0.019), and 6 to 10 min after (P = 0.007) and 11 to 15 min (P = 0.049) after heel lance No significant differences were found in salivary cortisol levels across groups (no P value reported) Mean duration of cry used in RevMan‐analyses | |
| 140 term, 38 to 41 weeks' GA | Heel lance |
| HR before, during and 3 min after heel lance | Mean, SD | No significant differences were found between groups for differences in HR at each of the 3 phases of the heel lance (P value reported for 3 min after heel lance, P = 0.087; the difference between 3 min after heel lance and during heel lance, P = 0.068) Data used in RevMan‐analyses | |
| 60 term infants, 37 to 42 weeks' gestation, 1 to 6 days of age | Heel lance | 2 min prior to heel lance:
All solutions were given by syringe on the tongue over < 1 min | Total time crying over 3 min. Time of first cry after lance % change in HR at 1, 3, 5 min after heel lance | Median, IQR Reported means and SEM | After heel lance, significant decreases in total crying time and duration of first cry in 50% sucrose group compared with water (P = 0.02). Significant reduction in median time crying at end of first min (P < 0.02) in 50% sucrose group (35 s; range 14 to 60) compared with water (60 s; range 50 to 60). In second min, duration of cry was significantly less in 50% sucrose group (0 s; range 0 to 25) and in 25% sucrose group (18 s; range 0 to 55) compared to water (60 s; range 40 to 60), P = 0.003 and P = 0.02, respectively A significant trend towards a reduction in crying time with greater concentrations of sucrose (P = 0.007). There was a similar trend in the reduction of the duration of first cry with increasing concentrations of sucrose (P = 0.004) Significant decrease in % change in HR 3 min after heel lancing (P = 0.02) in the 50% sucrose group (mean 0.1%, SEM 3.3) compared to water group (mean 17.5%, SEM 6.0) We transcribed SEMs to SDs and included data in RevMan‐analyses | |
| 99 sick hospitalised infants Mean GA (SD):
(author provided data on a subset of infants from a larger study (n = 128) that fulfilled our inclusion criteria) | Heel lance |
For infants weighing ≤ 1500 g the dose was reduced to 0.5 mL | Duration of cry until 5‐s pause, incidence and duration of crying time during the heel lance and squeeze and during the 3‐min recovery period HR at baseline, heel lance, during heel lance and 1, 2, 3 min post heel lance Oxygen saturation (%) at baseline, heel lance, during heel lance and 1, 2, 3 min post heel lance 4‐point subset of the NFCS (brow bulge, eye squeeze, nasolabial furrow, stretch mouth) at heel lance, during heel lance and 1, 2, 3 min post heel lance | Mean, SD (collected from authors) | Mean (SD) length of first cry (s) was higher in the water group (70.5 (83.6)) compared to the sucrose group (46.8 (63.1)). The sucrose group cried 57.1% of the procedure time compared to 58.8% in the water group. The mean (SD) total duration of cry during the heel lance was 84.7 s (68.8) in the sucrose group and 87.4 s (87.1) in the water group. The mean (SD) HR upon heel lance was 163.0 (17.9) beats/min in the sucrose group and 159.5 (19.2) beats/min in the water group. HR at 30 s from the beginning of the procedure was 175.4 (22.2) and 172.8 (23.6) beats/min in the sucrose and water groups, respectively. The HR in both groups decreased after the procedure to 152.1 (22.5) beats/min in the sucrose group and 154.2 (29.1) beats/min in the water group 2 min post heel lance Results of oxygen saturation (%) were similar between the 2 groups Mean (SD) facial scores were significantly reduced at heel lance (2.74 (1.8)) in the sucrose group compared to the water group (2.94 (1.6)) (P = 0.02) and at 1 min (P = 0.04) and 2 min (P = 0.046) post heel lance. No significant differences occurred at 3 min post heel lance Data included in RevMan‐analyses | |
| 113 healthy term newborns GA 37 to 42 weeks, median PNA 2 days, range 2 to 5 days | Heel lance | Solution syringed into the anterior third of the tongue for 1 min prior to heel lance:
| Mean cry time during 3 min after lance Mean maximum HR 3 min from heel lance Mean recovery time for HR % change in HR at 1, 2, 3 min after heel lance | Reported means and SEM | Infants who received 30% sucrose (mean crying time of 61 s) cried significantly less than those who received 30% glucose (mean crying time of 95 s), 10% glucose (mean crying time of 103 s) or sterile water (mean crying time of 105 s) (P = 0.02) No significant difference between groups with respect to maximum HR after heel lance (P = 0.71), or mean recovery time (P = 0.09). No significant difference found in % change in HR at 1 or 3 min after heel lance (P = 0.14, P = 0.53, respectively). At 2 min after heel lance, % change in HR favoured group receiving sucrose (P = 0.05) compared to other groups Data used in RevMan‐analyses | |
| 85 preterm infants, 25 to 34 weeks' GA, 2 to 10 days of age | Heel lance | Solutions via syringe into the mouth just prior to heel lance:
| HR at baseline and 3 x 30‐s blocks Behavioural facial actions (NFCS) at baseline and 3 x 30‐s blocks | Means and SD not reported | Although HR increased across all phases of procedure (P < 0.04), there were no significant differences noted between groups (P = 0.566) Decrease in % facial action in 24% sucrose alone group and combined 24% sucrose and rocking group compared to water group (P < 0.02) No data could be used in RevMan‐analyses | |
| 48 preterm neonates mean GA 31 weeks, range 25 to 34 weeks, within 10 days of birth | Heel lance |
| PIPP scores in 5 x 30 s blocks | Reported means, SD in graph form | Statistically significant difference between groups (P < 0.0001) for mean PIPP scores. Post hoc analysis found significantly lower PIPP scores with repeated doses of 24% sucrose compared to placebo groups across all blocks of time (P < 0.05). PIPP scores for repeated doses of 24% sucrose were significantly lower compared to single doses of 24% sucrose (8.25 vs. 6.25) only at last block of time (P < 0.05). PIPP scores for single doses of 4% sucrose compared to placebo showed trend towards statistical significance in favour of 24% sucrose (P = 0.07) Data obtained from the author on 31 infants that could be used in RevMan‐analyses | |
| 560 term neonates: GA: 37 to 42 weeks; birthweight: 2500 g‐4000 g; age 3 to 28 days | Heel lance |
| Increase in HR (beats/min) Decrease in oxygen saturation (%) Pain levels (test not specified) | Reported means and full ranges, not IQRs | The average HR increase 3, 5 and 10 min after procedure in the 25% and 50% glucose groups, 12% and 24% and 30% sucrose groups was significantly lower than those in the placebo group (P < 0.01 or 0.05). The average HR increase 3 min after procedure in the sucrose groups was lower than that in the glucose groups (P < 0.01). At 3 min after heel lance neonates who received 30% sucrose had a significantly lower average HR increase than those who received 12% and 24% sucrose (both P < 0.05). The average oxygen saturation decrease 3, 5, 10 min after procedure was significantly lower than those in the placebo group (P < 0.01). The average oxygen saturation decrease 3 min after procedure in the sucrose groups was significantly lower than that in the glucose groups (P < 0.01). The average pain score 3, 5, 10 min after procedure was significantly lower than those in the placebo group (P < 0.01). The average pain score 3 min after procedure in the sucrose groups was significantly lower than that in the glucose groups (P < 0.01). We could not include in RevMan‐analyses data for 30% sucrose vs. sterile water for increase in HR and decrease in oxygen saturation at 3 min after heel lance as data were reported as means and full ranges In addition results were reported late at 3, 5 and 10 min after heel lance | |
| 671 term neonates: GA 37 to 42 weeks at birth; PNA 3 to 28 days; birthweight 2500 g to 4000 g; Apgar score ≥ 8 at 5 min after birth; resting HR 120 to 140 beats/min; resting O2 saturation ≥ 95%; required neonatal congenital metabolism disease screening or blood glucose test | Shallow (blood glucose test) and deep (congenital metabolism disease screening) heel lance |
| Revised NFCS, increase in HR (%), decrease in oxygen saturation (%) | Factor analysis mean and SD | A significant synergistic analgesic effect was observed between the sucrose + NNS and sucrose + swaddling groups in both the shallow (P = 0.015) and deep heel lance (P = 0.007) procedure. The sucrose + NNS + swaddling group exhibited the lowest pain score. For the deep heel lance procedure, the sucrose + NNS group had a significantly lower increase in HR % and decrease in oxygen saturation (%) than the sucrose group (P = 0.000, P = 0.001), while this difference was not observed in the shallow heel lance procedure. No difference was found between the sucrose and sucrose + swaddling groups, in terms of different physiological parameters NNS and swaddling had synergistic effects on pain relief when used with oral sucrose. For the deep heel lance procedure, oral sucrose combined with NNS and swaddling provided the best pain relief effect For the shallow heel lance procedure, addition of NNS and swaddling did not improve the effects Data included in RevMan‐analyses | |
| 110 infants (PMA 26.4 to 37 weeks) | Heel lance |
The 3 interventions outlined above were used in different combinations: NNS + FT (n = 22) FT + sucrose (n = 21) NNS + sucrose (n = 21) NNS + sucrose + FT (n = 23) Control: routine care (n = 23) | Infants’ behavioural states (quiet sleep, active sleep, transition state, active awake, quiet awake, fussing or crying) | Graph form, CI, rate ratio and SE | Infants receiving NNS + sucrose + FT or NNS + sucrose experienced No data could be used in RevMan‐analyses | |
| Healthy, term neonates, GA 37 to 41 weeks | Heel lance |
These interventions were used in different combinations (BF + SSC; Sucrose + SSC; SSC; Sucrose) | NIPS; HR; crying time (s); crying in blood sampling; number of heel lances (%) | Median and IQR | The breastfeeding + SSC group achieved a significant lower median NIPS score (value = 1) compared with other groups (value = 2, 4 and 4, respectively). The percentage of neonates with moderate to severe pain was lower in the breastfeeding + SSC group. Both the breastfeeding + SSC group and No data used in RevMan‐analyses | |
| 104 term neonates, PNA > 24 h. Mean PNA: sucrose group: 48 h; distilled water group: 44 h
| Heel lance |
| Time of first cry (s), total cry (s) HR before heel lance, 2 min after heel lance and 4 min after heel lance oxygen saturation (%) before heel lance, 2 min after heel lance and 4 min after heel lance DAN scale before the heel lance and 30 s, 1 min, 2 min, 4 min after heel lance | Mean, SD | No significant difference between sucrose group and any other group for time of first cry NNS or rocking significantly reduced total duration of cry, P < 0.05 No significant difference in HR between the groups at any time point No significant difference in oxygen sasturation (%) between the groups at any time point Significantly reduced DAN scores at 30 s after the heel lance for the sucrose group (mean 7.6, SD 14, P < 0.05); however, this was not sustained at 1, 2 and 4 min NNS or rocking significantly decreased the DAN scores at 2 and 4 min post heel lance, P < 0.05 Reported data that could be used in RevMan‐analyses | |
| 31 healthy, preterm newborns, mean GA 30.5 weeks, mean PMA 32.3 weeks | Heel lance |
The solutions were administered via syringe onto the anterior portion of the tongue Cross over study ‐ Infants received all 3 interventions at different times Data from the first treatment in each infant could not be derived | Duration of first cry and total crying time HR, oxygen saturation (%), RR (breaths/min) and NFCS scores at baseline, during heel lance, and 1, 2, 3, 4 and 5 min post heel lance | Mean, SD | Significantly increased duration of first cry and total crying time in the water group compared to the sucrose and glucose groups (P = 0.005 and P = 0.007, respectively). No significant differences in cry characteristics were observed between the sucrose and glucose groups Significantly higher HR in the water group (mean 175, SD 20.8) compared to the sucrose (mean 166, SD 17.6) and glucose groups (mean 165, SD 17.5) at 1 min following heel lance (P = 0.007). No significant differences between the sucrose and glucose groups The study found no significant results for respiratory rate or oxygen saturation between groups. Significantly higher NFCS score in the placebo group in the 4th min following heel lance (mean 1.3, SD 2.0) and 5th min following heel lance (mean 1.0, SD 1.0) compared to the sucrose (mean 0.5, SD 1.7; mean 0.3, SD 1.3, respectively) and glucose groups (mean 0.2, SD 0.5; mean 0.1, SD 0.3, respectively) (P = 0.009 at 4th min and P = 0.046 at 5th min). There were no significant differences between the sucrose and glucose groups Data could not be used in RevMan‐analyses. | |
| 102 healthy, term infants, GA 37 to 42 weeks, median PNA 1.6 days, range 1 to 15 days | Heel lance |
All solutions syringed onto anterior part of tongue for 1 min Heel prick performed 2 min after intervention | Median cry time during 3 min after lance % change HR 1, 2 and 3 min after heel lance | Median, IQR | Significant decrease in crying times for 25% sucrose group (median 36, IQR 18 to 43) compared to human milk (median 62, IQR 29 to 107) and sterile water (median 52, IQR 32 to 158) (P = 0.0009). Recovery time for crying was significantly reduced in 25% sucrose group (median 72, IQR 48 to 116) compared to human milk (median 112, IQR 72 to 180) and sterile water (median 124, IQR 82 to 180) (P = 0.004) % change in HR after heel lance was significantly lower in the group receiving 25% sucrose compared to groups receiving human milk and sterile water at 1, 2 and 3 min (P = 0.008, P = 0.01, P = 0.002, respectively) No data were used in RevMan‐analyses | |
| 100 newborn term infants, mean PNA 6 days, range 4 to 9 days | Heel lance |
In addition to the intervention to which the infants were assigned, parents were instructed to comfort the infant as much as possible | Median crying time during heel lance, fraction of crying during sampling, crying time during first min after end of sampling, total crying time Change in HR at 0 and 1 min Oxygen saturation (%) at 0 and 1 min NIPS scores 1 min after heel lance and 1 min after blood sampling | Median, 5th and 95th percentiles | Median duration of first cry in group receiving 50% sucrose was significantly lower (18 s (2 to 75)) compared to placebo group (22 s (11 to 143)) (P = 0.03). Median crying time during heel lance in the sucrose group was lower (26 s (2 to 183)) compared to placebo group (40 s (12 to 157)) (P = 0.07). Median fraction of crying during sampling in 50% sucrose group was significantly lower (43% (4 to 100)) compared to placebo group (83% (20 to 100)) (P = 0.004). Median crying time during first min after end of sampling in 50% sucrose group was significantly lower (3 s (0 ‐ 58)) compared to placebo group (16 s (0 to 59)) (P = 0.004). Median total time crying in 50% sucrose group was significantly lower (30 s (2 to 217)) compared to placebo group (71 s (13 to 176)) (P = 0.007) No significant HR differences between groups (P = 0.6) No significant differences between groups with respect to changes in oxygen saturation (%) (P = 0.9) Median NIPS scores 1 min after heel lance were lower in 50% sucrose group compared to placebo group (3 (0 to 7) and 6 (0 to 7), respectively; P = 0.04). Median NIPS scores 1 min after end of blood sampling were lower in 50% sucrose group (0 (0 to 7)) compared to placebo group (2 (0 to 7)) (P = 0.05) As means were not reported we could not include the results in RevMan‐analyses | |
| 15 preterm infants, GA 32 to 34 weeks, > 24 h of age | Heel lance |
The solutions were administered via syringe into the baby’s mouth for 1 min Cross‐over study | Duration of first cry and % time crying 5 min after lance HR (at ‐2, 0, 1, 3 and 5 min from heel lance) Behavioural scores (4 facial expressions and the presence of crying) ‐2, ‐1 , 0, 1, 2, 3 and 5 min Quality/intensity of sucking | |||
| 60 term infants, GA 37 to 42 weeks, 2 to 5 days old | Heel lance |
| Duration of first cry after lance, % time crying over 3 min after heel lance % change in HR over 5 min (at ‐2, 0, 1, 3 and 5 min from heel lance) Behavioural scores (4 facial expressions and the presence of crying) ‐2, ‐1, 0, 1, 2, 3 and 5 min | Median, IQR | Significant decrease in duration of first cry and % crying during 3 min after heel lance in the 25% sucrose, 50% sucrose and Calpol groups (P = 0.02) (data in graph form only) Significant increase in HR for 3 min after heel lance in water group compared with 50% sucrose group and Calpol group (P = 0.009) Pain score (0 to 5) was significantly higher in water group (score = 2, range 1 to 5) than in other 3 groups: 50% sucrose group (score = 0, range 0 to 3); 25% sucrose group (score = 0, range 0 to 2); Calpol group (score = 0, range 0 to 1) (P = 0.05) No data were used in RevMan‐analyses | |
| 30 preterm infants, GA 32 to 36 weeks, PNA > 24 h | Heel lance |
The cross‐over concerned mode of delivery of the solution ‐ intraorally or via NG tube. Infants stayed in their original group assigned to receive either sucrose or sterile water | % cry over 5 min after sampling Behavioural scores (4 facial expressions and the presence of cry) at 1, 3 and 5 min after the lance for a total behavioural score | Median, IQR | Median % cry in intraoral water group was 22% (IQR 10.6 to 40) and 27% (IQR 11.6 to 47) for infants in NG tube water group. Median % cry in intraoral 25% sucrose group was 6% (IQR 0.6 to 15) and 18.3% (IQR 11.6 to 41.6) for NG tube 25% sucrose group. Significant reduction in crying time (P = 0.006) noted in the 25% sucrose group compared with water group when infants received 25% sucrose intraorally, not via NG‐tube route. For infants in 25% sucrose group, significant reduction in crying time noted (P = 0.008) when solution given intraorally compared to via NG tube route Behavioural scores for the intraoral water group was 9 (IQR 6 to 12) and 10 (IQR 6 to 14) for NG tube water group. Behavioural scores for intraoral 25% sucrose group was 5 (IQR 3 to 6) and 9 (IQR 8 to 10) for NG tube sucrose group. Significant reduction in behavioural scores noted in 25% sucrose group (P = 0.002) compared with water group when infants received 25% sucrose intraorally but not via NG route. For infants in 25% sucrose group, there was significant reduction in behavioural score (P = 0.001) when solution was given intraorally compared to via NG tube Cross‐over design: data from the first assignment prior to cross‐over were presented. These data were not used in RevMan‐analyses | |
| 52 term infants, GA 37 to 42 weeks, 2 to 7 days of age | Heel lance |
| % crying during sampling and 3 min after sampling | Medians only | No significant differences in median % time crying between group receiving 7.5% sucrose (74.3%) compared to group receiving water (73.2%). No significant differences between groups in duration of cry after 1 min (P = 0.65), 2 min (P = 0.52) and 3 min (P = 0.72). No difference in time to cessation of crying (P = 0.16) No data could be used in RevMan‐analyses | |
| 71 preterm infants GA 32 to 36 + 6/7 weeks at birth undergoing heel lance with an automated piercing device. | Heel lance |
All 46 infants (in groups 2 and 3) were analyzed | PIPP score; COMFORTneo Score, HR and oxygen saturation (%) | Mean and 95% CI | There was no significant difference in mean PIPP score between neonates receiving breast milk (6.1) and those receiving sucrose (5.5), with a mean difference of 0.6 (95% confidence interval ‐1.6 to 2.8; P = .58). No data were provided for HR and oxygen saturation 95% CI were transformed to SD and used in RevMan‐analyses | |
| 44 term infants, GA 37 to 43 weeks, < 8 days old | Heel lance |
| HR change, PIPP score, nociceptive‐specific brain activity, latency to change in facial expression (s), facial non‐responders, nociceptive reflex withdrawal activity | Mean, 95% CI, mean weight | Only mean baseline HR given: 24% sucrose 132. 6 beats/min (124.3 to 140.9); sterile water 131.8 (122.2 to 141.5) (P = 0.90) Only mean baseline oxygen saturation (%) given: 24% sucrose 99.4 (98.8 to 100.1); sterile water 97.4 (95.0 to 99.8) (P = 0.13) PIPP score during insertion: baseline PIPP score: 24% sucrose 1.3 (0.8 to 1.7), sterile water 1.3 (0.8 to 1.8) (P = 0.91); PIPP during procedure: 24% sucrose 5.8 (3.7 to 7.8), sterile water 8.5 (7.3 to 9.8) (P = 0.02) No significant differences in nociceptive‐specific brain activity (P = 0.46) latency to change in facial expression (P = 0.86), mean nociceptive reflex withdrawal activity (P = 0.49) or mean latency to nociceptive reflex withdrawal activity (P = 0.56); significant difference in facial non‐responders for 24% sucrose 35%, for sterile water 0% (P < 0.0001) Results presented as mean and 95% CIs Data used in RevMan‐analyses | |
| 122 preterm neonates, GA 27 to 31 weeks, ≤ 28 days of age | Heel lance |
NB: all infants were contained in SnuggleUp device for all interventions Each infant received all 4 interventions in random order (serving as his/her own control); there was 1 control group and 3 intervention groups | PIPP scores at 30 s and 60 s | Reported means, SD | Main effect of treatment for mean PIPP scores (P < 0.0001). Post hoc analysis revealed significant reduction in PIPP scores 30 s after heel lance in sucrose group (pacifier dipped in 24% sucrose ‐ estimated at 0.02 g), (mean 7.87, SD 3.35), compared to control group (mean 9.80, SD 3.55) (P < 0.0001). Statistically significant reduction in PIPP scores in pacifier and water group (mean 8.44, SD 3.55) compared to control group (mean 9.80, SD 3.55) (P = 0.003). Trend towards lower PIPP scores with sucrose and pacifier group compared to water and pacifier group (P < 0.05) The first author provided data for 61 infants for PIPP at 30 s after heel lance and for 45 infants at 60 s after heel lance for infants before cross‐over | |
| 66 preterm infants, GA 26 to 30 weeks, PNA < 72 h | Heel lance |
These interventions were given every time there was a painful procedure during the first 28 days of life | PIPP at days 7, 14, 21 and 28 at routine heel lance Adverse effects Neurobiological risk status | Not reported | Significant main effect of group (there was a significant difference in a particular group) (P = 0.03) with differences occurring between the sucrose + pacifier group and the standard care group (at 60 s P = 0.01). Mean PIPP scores were generally higher in the standard care group Adverse effects: no group differences for adverse events, clinical outcomes or neurobiological risk status No data used in RevMan‐analyses | |
| 48 preterm infants, median GA of 32 weeks, median PNA of 14 days | Heel lance |
All infants were given water prior to a second heel lance | Differences in crying time for pre‐heel lance to heel lance procedure Changes in HR from pre‐heel lance to heel lance procedure Difference in skin conductance from pre‐heel lance to heel lance procedure | Not reported | Significantly less crying in infants receiving 25% sucrose (P < 0.05) and food (milk) + 25% sucrose (P < 0.05) No significant differences between groups in changes in HR from pre heel lance to heel lance procedure (P value not reported) No statistically significant smaller increase in skin conductance variables compared to their water control session (P value not reported) No data could be included in RevMan‐analyses | |
| 180 full‐term neonates, birthweight > 2000 g and age > 24 h | Heel lance |
| PIPP Total crying time Adverse events | Median, IQR | Median (IQR) PIPP score was 3 (2 to 4) in the sucrose + NNS group compared with 7 (6.5 to 8) in the sucrose only group, 9 (7 to 11) in the NNS group and 13 (10.5 to 15) in the no intervention group. The sucrose + NNS group had a significant decrease in the median PIPP score compared with other groups (P = 0.000). Median PIPP score decreased significantly with any intervention compared with no intervention (P = 0.000) A total of 5 episodes of adverse events were reported No data were used in RevMan‐analyses | |
| 56 term infants ≤ 7 days old: appropriate for gestational age | Heel lance |
| Primary outcome – mean skin blood flow (SBF); NIPS Skin blood flow (SBF), perfusion units (PU) measured by Laser Doppler Imager (LDI) during heel lance HR, RR (breaths per minute), oxygen saturation (%) | Mean, SE, median, IQR | Mean SBF and median NIPS scores immediately post heel lance were lower in sucrose‐treated infants (167.9 PU ± 15.5 vs. 205.4 PU ± 16.0, P = 0.09; NIPS 1 (IQR 0‐4) vs. NIPS 3 (IQR 0‐6), P = 0.02) although no significant difference in mean SBF. During heel lance NIPS score was predictive of SBF. An increase of 1 in NIPS score was associated with 11 PU increase in SBF (R = 0.21; P = 0.09) for sucrose and 16 PU increase for placebo‐treated infants (R = 0.20; P = 0.014). Increased SBF assessed by LDI is a pain response among term neonates following routine heel lance that was not completely attenuated by oral sucrose administration. Increased SBF is associated with NIPS scores. Sucrose analgesic efficacy evidenced by decreased NIPS scores for the sucrose group. Association of SBF with NIPS scores suggests LDI is potentially useful for assessing newborn procedural pain SEs were transformed to SDs and were used in RevMan‐analyses for skin blood flow For heart rate, respiratory rate and oxygen saturation results were presented as means and SDs and were used in RevMan‐analyses | |
| 150 term infants | Heel lance |
| Mean crying time between groups Modified NFCS | Mean, SD | Statistically significant differences in crying time between facilitated tucking and 2 intervention groups (P < 0.001). No significant difference between NNS + water and NNS + sucrose groups (P = 0.735) Statistically significant differences in pain score between control group and 2 intervention groups (P < 0.001). No significant difference between sucking with placebo and sucking with sucrose groups (P = 0.105) Data used in RevMan‐analyses | |
| 120 infants, GA 37 to 42 weeks Mean GA (SD):
| Heel lance |
| NIPS score, HR, respiratory rate, crying time | Mean, SD | No differences in HR and O2 saturation between groups After the procedure, the mean crying time of the sucrose group was shorter than those of the other groups. Comparing the crying times of the control and experimental groups according to the procedure time showed no statistically significant differences between the values for before and during the procedure (F = 1.50, P > 0.05); (F = 2.43, P > 0.05) Before the procedure, the lowest NIPS mean was in the sucrose group and the highest NIPS mean was in the pacifier group. During the procedure, no statistically significant differences were found between the groups for NIPS means (P > 0.05). After the procedure, the sucrose group showed the lowest response to pain, while the mother's milk group had the highest response. Comparing the NIPS means of the control and experimental groups according to the procedure times, statistically significant differences were found between the groups for values obtained before and after the procedure (F = 3.49, P < 0.05); (F = 6.71, P < 0.05) Outcome data were presented according to different procedure times and no data could be included in RevMan‐analyses | |
| Abbreviations CI = confidence interval BF = Breastfeeeding SSC = skin‐to‐skin contact | ||||||
| Study | Participants | Procedure | Interventions | Outcomes | Metrics used | Results | |
| 28 preterm, 29 to 36 weeks' PMA infants, PNA 1 to 26 days | Venipuncture | 2 min prior to venipuncture:
| Time crying for 3 min after venipuncture HR: pre solution, post solution, 5 min after venipuncture Mean SpO2 and respiratory rate pre solution, post solution, 5 min after venipuncture | Median, IQR Mean, SEM Mean, SD | Significant group effect noted, (F(2, 25) = 4.26; P = 0.0256) for cry duration 3 min after venipuncture. Cry duration was significantly reduced in 24% sucrose group (19.1 s) compared to 12% sucrose (63.1 s) and water (72.9 s) groups (P < 0.05) Significant group effect for HR, F(2, 25) = 6.37, P = 0.006. Overall time effect, F(2, 50) = 14.15, P < 0.001. No significant interaction between treatment group and time. Post hoc Tukey test showed that group receiving 12% sucrose had lower HR compared to the 24% sucrose group or water group at all 3 time points (pre solution, P = 0.048; post solution, P = 0.010; 5 min after, P = 0.007) No significant differences noted between groups over time for SpO2 and respiratory rates (no P values reported) For time crying no SDs were reported by the authors Differences in oxygen saturation, respiratory rate and HR between 24% sucrose and water were reported only at 5 min after venipuncture and therefore the findings were not included in RevMan‐analyses | ||
| 39 preterm neonates, mean 30.5 weeks' PMA, mean PNA 27.2 days | Venipuncture | 4 min prior to venipuncture:
Cross‐over trial | Duration of first cry (beginning to end of first cry); total duration of crying (onset of first cry to cessation of all crying) Mean change in HR from pre procedure, procedure and postprocedure phase of venipuncture Mean SpO2 (%) at pre procedure, procedure and postprocedure NFCS changes across 3 phases of venipuncture | Mean (SD) Mean (95% CI) | Mean duration of first cry lower in infants who received sucrose (18.6 s (24.4)) compared to infants who received water (52.3 s (56.2)) (estimated treatment effect = 33.7, P < 0.001). Mean total duration of crying was significantly lower in infants who received sucrose (31.9 s (41.9)) compared to infants who received water (72.5 s (66.7)) (estimated treatment effect = 40.6, P < 0.001) Mean change in HR from pre procedure to procedure was lower in the infants receiving sucrose compared to water (estimated treatment effect = 7.5, P = 0.003). Mean change in HR from pre procedure to postprocedure was lower in the infants who received sucrose compared to water (estimated treatment effect = 4.16, P = 0.036) No significant differences between groups with respect to changes in SpO2 from pre‐procedure to procedure phase (P = 0.17) Changes in mean NFCS scores were significantly lower in the sucrose group compared to water group from pre procedure to procedure phase (estimated treatment effect = 1.08, P = 0.013) and between the pre procedure and postprocedure phase (estimated treatment effect = 2.39, P < 0.001) Data prior to cross‐over for the two groups were not presented so we could not include the data in RevMan‐analyses | ||
| 50 term infants between 12 h to 8 days old
| Venipuncture |
Method of administration (i.e. pacifier/syringe) was not reported | Duration of cry, DAN scale, number of infants crying. HR and SpO2 were measured before, during and after the procedure | Mean and SD for duration of cry, IQR for DAN scale | 13 (52%) infants in sucrose group did not cry compared to 4 (16%) in no treatment group, P = 0.001, mean duration of cry was not significantly different between groups (P = 0.65) HR increased during procedure (P = 0.008) followed by decrease postprocedure (P = 0.001) in no treatment group; no significant changes in sucrose group (P = 0.39). Decrease in SpO2 in the no treatment group (P = 0.001) during the procedure; no significant changes in sucrose group (P = 0.3) Significantly lower DAN scores in the 30% sucrose group (score of 3 (1.5 to 5.5) compared to the no treatment group (score of 7 (5 to 9.5) (P = 0.0001) Duration of cry could be used in RevMan‐analyses | ||
| 76 preterm infants, mean (SD) PMA:
| Venipuncture |
The sucrose solution was given 2 min before the procedure via syringe. | DAN scale, PIPP, crying time Adverse effects | Mean and SD | Mean (SD) DAN pain scores for the sucrose group and the sucrose + EMLA group were 7.7 (2.1) and 6.4 (2.5), respectively, during venipuncture and 7.1 (2.8) and 5.7 (3.3) during the recovery period. Significant time effect (P = 0.047) and treatment effect (P = 0.018) effect in favour of sucrose + EMLA group; no significant differences using PIPP No adverse effects after sucrose administration were observed Data used for meta‐analysis | ||
| 150 term newborn infants, 3 or 4 days old | Venipuncture |
Sucrose was administered over 30 s 2 min prior to the procedure | DAN scale | Median, IQR | Median pain scores with IQRs during venipuncture were: no treatment 7 (5 to 10); sterile water group 7 (6 to 10); 30% glucose group 5 (3 to 7); 30% sucrose (0.6 g) group 5 (2 to 8); pacifier alone group 2 (1 to 4); 30% sucrose with pacifier group 1 (1 to 2). All groups had significantly lower pain scores compared to sterile water group: 30% glucose (P = 0.005), 30% sucrose (P = 0.01), pacifier (P < 0.0001), 30% sucrose with pacifier (P < 0.0001). The pacifier alone group had significantly lower pain scores than infants receiving 30% glucose (P = 0.0001) or 30% sucrose (P = 0.001). Trend towards lower pain scores for infants receiving 30% sucrose with pacifier compared to pacifier alone (P < 0.06) No data were used in RevMan‐analyses | ||
| 36 preterm infants, median (range): PMA 32 (27 to 36), mean (SD) PMA 32.4 (2.9) Note: two different mean PMAs reported in the article | Venipuncture | Infants randomly allocated to 6 different regimens:
during a stay in intensive care of up to 15 days For the sucrose and water solutions, the tip of a 1 mL syringe without the needle was placed in the infant’s mouth and the solution was instilled with gentle movements to stimulate sucking for 30 s. Each treatment was given 2 min prior to the procedure. Every infant participating in the study received each of 6 different regimens during a maximum stay of 15 days from admission or the end of the NICU stay | HR, SpO2, PIPP, respiratory rate, blood pressure, glucose check Crying time was assessed at 0, 1, 3, 5, 10 min | Range, mean | PIPP score: significantly different between treatment groups P = 0.0005, over time P < 0.0005 24% sucrose + pacifier resulted in lowest pain scores (P < 0.05) No difference in respiratory rate (P = 0.193), no difference in blood pressure (P = 0.246); no difference in glucose check (P = 0.227) The sucrose groups had significantly shorter crying times compared to the other groups (P = 0.001) This was a cross‐over study and each infant got all the 6 different interventions No data that we could use in RevMan‐analyses | ||
| 111 preterm and term neonates (55 in treatment group and 56 in control group) | Venipuncture | 5 min before venipuncture:
| Overall NIPS score | Means and SDs | NIPS scores significantly lower for infants who received sucrose (2.9 (SD 2.3)) versus water (3.8 (SD 2.6)) (t = ‐2.063, P = 0.041) Data used in RevMan‐analyses (Article written in Spanish) | ||
| 330 infants, mean PMA (SD) 39.5 (1.2):
| Venipuncture |
Placebos were used for liposomal lidocaine and sucrose (i.e., double‐dummy design), so that all infants received a topically administered cream (liposomal lidocaine or placebo cream) and oral solution (sucrose or placebo water) Non‐randomised group of healthy neonates undergoing venipuncture were administered water | Facial grimacing, cry duration (s), Observer‐rated pain using a VAS (0 to 10 cm), HR (beats/min), oxygen saturation (%) Safety/adverse events | Means and 95% CI | The mean facial grimacing score differed among the randomised groups (P < 0.001). Post hoc analyses demonstrated a significantly lower score for the sucrose group compared with liposomal lidocaine group (MD 27; 95% CI ‐36 to ‐19; P < 0.001) and for the sucrose plus liposomal lidocaine group compared with the liposomal lidocaine group (MD 23; 95% CI ‐31 to ‐14; P < 0.001). No evidence of difference between the sucrose and sucrose + liposomal lidocaine groups (P = 0.3) Cry duration differed among groups (P < 0.001). Infants in the sucrose and sucrose + liposomal lidocaine groups cried less than infants in the liposomal lidocaine group (MD ‐38 s; 95% CI ‐52 to ‐25; P < 0.001; and MD 39 s; 95% CI ‐ 52 to ‐ 25; P < 0.001, respectively). There was no evidence of a difference in cry duration between the sucrose and sucrose + liposomal lidocaine group (MD 0 s; 95% CI ‐13 to 14; P = 0.95) No difference in VAS, HR or oxygen saturation (%) When compared with the non‐randomised placebo‐control group, the liposomal lidocaine group had significantly lower facial grimacing (mean difference ‐17; 95% CI ‐27 to ‐7; P < 0.001) and VAS scores (‐1.7 cm; 95% CI ‐2.5 to ‐0.9; P < 0.001). HR, oxygen saturation (%) and procedure duration were significantly higher in the liposomal lidocaine group compared to the control group. Cry duration and procedure success rate did not differ beyond chance No significant adverse events reported We transcribed 95% CI to SDs and included results in RevMan‐analyses | ||
| Abbreviations CI = confidence interval | |||||||
| Study | Participants | Procedure | Interventions | Outcomes | Metrics used | Results |
| 100 healthy full‐term infants:
|
Heel lance or venipuncture | 2 min before procedure:
| Duration of first cry (s), first crying time/total procedure time (%) and the ratio of crying: no crying NFCS score:
| Reported medians, range and mean, SD Reported in graph form, median and IQR | Significant reduction in duration of first cry in heel lance group given sucrose compared to heel lance alone (P < 0.001) Significantly reduced NFCS scores in sucrose group during heel lance (median 47, IQR 31 to 60) and during compression to stop bleeding (median 32, IQR 8 to 54) compared to the water group (median 58, IQR 54 to 65, median 52, IQR 41 to 61, respectively) (P < 0.001) Sucrose did not significantly reduce NFCS scores during or after venipuncture We included data for sucrose vs water for heel lance and for venipuncture for duration of first cry | |
| Abbreviations GA = gestational age | ||||||
| Study | Participants | Procedure | Interventions | Outcomes | Metrics used | Results |
| 47 neonates, GA 30 to 36 weeks, 48 h old | Arterial puncture | Sucrose group: 0.5 mL oral sucrose solution (Sweet‐Ease, preservative‐free, 24% sucrose solution 99044, Children’s Medical Ventures, Norwell, Massachusetts) in a 1‐mL syringe by the nurse caring for the infant (n = 24) Control group: no oral solution (n = 23) | NIPS, HR, Oxygen saturation (%) | Mean, SD NIPS scores presented in graph form only | Sucrose group had significantly less crying than the control group, both during, and immediately after arterial puncture (P .006 and .022, respectively). No significant changes in other pain subscales, HR, or oxygen saturation were found during or after the arterial puncture (P = ‐0.05) Data for HR and oxygen saturation could be used in RevMan‐analyses | |
| Abbreviations GA = gestational age | ||||||
| Study | Participants | Procedure | Interventions | Outcomes | Metrics used | Results |
| 285 term infants
Various age groups based on required immunisations. Age groups were:
Only data for neonates at 2 weeks of age are included in this review
| Subcutaneous injection |
The solutions were given 2 min prior to the procedure | Cry duration (during and after procedure) |
% time crying | The overall P value for % time crying was significant (F = 5.92, P < 0.005) for the 2‐week‐old age group. Pairwise comparisons of the % time spent crying of sucrose and water groups versus the no treatment group showed significant differences (P < 0.01 for both comparisons)
This was the only age group (< 2 weeks) in which significant differences were observed between sucrose, water and no treatment groups Means and SDs were not reported. No data could be used in RevMan‐analyses | |
| 33 preterm neonates, mean (SD) GA at birth 30 weeks (6 days), GA at injection 32 weeks (6 days) | Subcutaneous injections |
Each infant was its own control | Duration of cry from needle introduction until to 2 min after its removal HR before injection, during injection and after injection SpO2 before injection, during injections and after injection DAN and NFCS scores during injection | Mean, SD | Crying time was significantly lower in the sucrose + EMLA + NNS group (P = 0.0002). The mean (SD) crying time in each group was as follows: 3.93 s (2.97) in the NNS group, 2.81 s (4.81) in the EMLA + NNS group, 2.32 s (7.51) in the sucrose + NNS group and 0.89 s (2.66) in the sucrose + EMLA + NNS group There were no significant differences in HR between the 4 groups The only significant difference in SpO2 between groups occurred during injection, which was lower in the NNS group (P = 0.02) Significant reduction in DAN and NFCS scores in EMLA + NNS, sucrose + NNS, and sucrose + EMLA + pacifier groups compared to NNS alone No data could be used in RevMan‐analyses | |
| Abbreviations DAN = Douleur Aiguë du Nouveau‐né Scale | ||||||
| Study | Participants | Procedure | Interventions | Outcomes | Metrics used | Results |
| 47 healthy full‐term infants | Immunization for hepatitis B |
3 infants were subsequently excluded from data analysis (1 in the sucrose group and 2 in the warmth) | Cumulative crying time (s) Mean HR Mean respiratory sinus arrhythmia Cumulative distribution of grimace time | Graphs only | Infants in the warmth group cried significantly less than those in the sucrose or NNS groups after vaccination. HR patterns reflected this analgesia. Core temperature did not differ between study groups. "Providing natural warmth to newborn infants during a painful procedure decreases the crying and grimacing on par with the 'gold' standard treatments of sucrose or pacifier" (Gray 2012). No data could be used in RevMan‐analyses | |
| 29 healthy, full‐term newborns | Immunization for hepatitis B |
| Duration (s)of grimace and cry | Means and SDs | The sucrose + warmth group cried significantly less 12.8 s (SD 2.2) vs. 28.0 s (SD 6.9) and grimaced less 14.9 s (SD 2.4) vs 31.1 s (SD 7.2) than the sucrose only group Data included in RevMan‐analyses | |
| 165 healthy newborn infants PMA ≥ 36 weeks and birthweight ≥ 2200 g | Immunization for hepatitis B |
| NFCS Cry duration HR RR | Cry duration (s) was reported as mean (SD) Other outcomes reported in graph form or in multiple regression models | Pain was significantly lower among infants in the NNS (P < 0.001) and sucrose (P < 0.001) groups than that in the routine care group after adjusting for time effects, infant sleep/wake state, number of prior painful experiences, and baseline pain scores. Infants in the NNS and sucrose groups had significantly lower mean HR and RR than the controls. Cry duration of infants receiving sucrose was significantly shorter than those in the NNS (P < 0.001) and routine care groups (P < 0.001) Data for cry duration included in RevMan‐analyses | |
| 90 full‐term neonates | Immunization for hepatitis B |
Solutions applied 2 min before hepatitis B vaccination | NIPS during 1‐2 min after vaccination | Mean, SD | Comparison of pain severity, mean and SD of pain, showed greater intensity of pain in the glucose group than the sucrose group (3 ± 1.66 vs. 2.90 ± 1.44), but this difference was not significant statistically (P = 0.78). Pain intensity was higher in the control group than in the intervention groups (P < 0.001) NIPS during 1‐2 min after vaccine injection were used in RevMan‐analyses | |
| Abbreviations HR = heart rate | ||||||
| Study | Participants | Procedures | Intervention | Outcomes | Metrics used | Results |
| 83 infants ≤ 90 days of age requiring bladder catheterization. 3 infants were withdrawn after randomisation as a result of inappropriate enrolment or withdrawal of consent Subgroup analysis performed: infants 1 to 30, 31 to 60 and 61 to 90 days of age | Bladder catheterization | 2 min before procedure:
| % of subjects crying at maximal insertion Change in DAN scores | Change in mean (SD) for DAN score | Subgroup analysis of youngest infants (1 to 30 days) in sucrose group showed smaller changes in DAN score compared to water group (2.86 vs. 5.29; P = 0.035) Subgroup analysis of infants (1 to 30 days) showed infants in sucrose group were significantly less likely to cry during maximal catheter insertion compared to water group (28.6% vs. 78.6%; P = 0.008) Change in DAN score and number of infants crying at maximal catheter insertion used in meta‐analysis | |
| Abbreviations DAN = Douleur Aiguë du Nouveau‐né Scale | ||||||
| Study | Participants | Procedure | Interventions | Outcomes | Metrics used | Results |
| 24 preterm infants. PMA 28 to 32 weeks | NG tube insertion | 6 interventions:
The solutions were administered via syringe on the tip of the tongue immediately before tube insertion Cross‐over design: each infant acted as his or her own control over a 3‐week period during which the tube was changed 6 times | PIPP scores | Median, range | Median PIPP score during the procedure was 9 and decreased gradually towards 4 after 5 min. The NNS + 30% sucrose intervention provided most effective pain reduction (P < 0.001 vs. no treatment). Highest pain score recorded in sterile water group Becasue of the cross‐over design of the study no data could be used in RevMan‐analyses | |
| 20 infants, mean (SD) PMA 30.7 weeks (2.3) | NG tube insertion | 2 min prior to procedure:
Volume of solution was adjusted for current body weight:
The infants were randomised several times to either sterile water or 24% sucrose. This was not done in a cross‐over fashion 51 NG insertions (26 were in the sucrose group and 25 were in the water group) were performed in the 20 infants enrolled in the study | Incidence of cry Baseline HR and change in HR from baseline during NG tube insertion Baseline SpO2 and change in SpO2 from baseline during NG tube insertion NFCS during NG tube insertion and after insertion | % Mean, SD Median | There was a non‐significant trend (P = 0.069) for fewer sucrose‐treated infants to cry during NG tube insertion (8/26), compared with the water group (14/25) Infants in the sucrose group had higher mean pre‐treatment baseline HR than water group but showed no change in HR during NG tube insertion (mean change ‐0.7 beats/min). The HR of the placebo group increased during NG tube insertion (mean change + 11). This difference approached statistical significance (P = 0.055) No significant changes in mean SpO2 occurred in either group Sucrose group had a significant lower median NFCS score during NG tube insertion compared with the water group (1 (range 0 to 4) vs. 3 (range 0 to 4), median difference 1 (95% CI 0 to 2); P = 0.004) After NG tube insertion, the NFCS scores fell to a median of 0 in both groups To see if NFCS is specific for pain, authors analyzed the 4 components on their own. Nasolabial folds showed a significant inhibition in the sucrose group (present in 4/26 (15%) compared with 12/25 (48%) in the water group; P = 0.012) Data could not be used for RevMan‐analyses as infants were randomised to the two different groups several times | |
| 120 clinically stable preterms (PMA < 37 weeks) within the first 7 postnatal days | OG tube insertion | 2 min before OGT insertion:
| The primary outcome was painful response assessed by PIPP, while the secondary outcomes were heart rate and SpO2 changes. The pain response to the procedure according to the PIPP scale was evaluated at pre‐procedure, intra procedure, post 30 s, post 1 min and post 2 min. The secondary outcomes were the maximum heart rate and the minimum oxygen saturation recorded during the procedure. | Mean, SD | The mean intraprocedure PIPP scores were significantly higher than the mean pre procedure PIPP scores, in the PMA groups of > 34 weeks, and 32 to 33 6/7 weeks, in both the water (7.25 vs. 3, and 8.14 vs. 3.14, respectively) and sucrose arm (8.06 vs.3.21, and 7.18 vs. 4.18, respectively). The mean PIPP scores assessed at 30 s postprocedure in the sucrose group were significantly lower than the water group (4.32 vs. 5.6, P = 00.014). No significant adverse events were seen. Data could be used in RevMan‐analyses for PIPP scores but not for heart rate and SpO2 changes. No significant difference was observed between the baseline and maximum HR, and between baseline and lowest SpO2, across the two study groups. However, there was a significant increase in mean HR from baseline in both the study groups during the procedure to 2 min postprocedure (19.44 beats/min in placebo group vs.22.5 beats/min in sucrose group) Data used in RevMan‐analyses | |
| Abbreviations PMA = post menstrual age | ||||||
| Study | Participants | Procedure | Interventions | Outcomes | Metrics used | Results |
| 40 preterm infants, median PMA 29 weeks (24 to 34 weeks):
| Eye examination for ROP | 2 min before start of eye examination:
| PIPP during examination of eye | Mean, SD, 95% CI | Mean (SD) PIPP scores were: 15.3 (1.9), 14.3 (1.6), 12.3 (2.9), and 12.1 (3.4) for groups the sterile water group, sucrose group, water + NNS group, and sucrose + NNS group, respectively Significant differences in PIPP scores between the groups, P = 0.023 Infants in pacifier groups scored significantly lower than groups without pacifiers, P = 0.003 (95% CI ‐4.23 to ‐0.96) No significant differences between groups receiving sucrose vs. groups receiving water (P = 0.321) Data used in RevMan‐analyses | |
| 64 infants undergoing ROP eye examination. The groups had similar GA (28.5 ± 2.8 weeks), mean birthweight (1304 g ± 466 g) or corrected GA (35.4 ± 3.7 weeks) at examination | Eye examination for ROP | Topical anaesthetic (proxymetacaine; Alcaine(®) drop 0.5%: ALCON CANADA Inc., Mississauga, Canada) was applied 30 s before the eye examination in all infants
| Mean PIPP score during examination; secondary outcome measurements were frequency of tachycardia (> 180 beats/min), bradycardia (< 100 beats/min), desaturations (< 85% for > 10 s) and crying time. | Mean, SD | The intervention group had a significantly lower mean PIPP score during examination of the first eye, following insertion of the speculum (sucrose + NNS group: 13.7 ± 2.1 vs. water + NNS group: 16.4 ± 1.8, P = 0.001). | |
| 23 neonates, PMA mean (SD) 26.4 weeks (1.5) PNA 28 to 93 days | Eye examination for ROP |
Cross‐over design Mydriatic eye drops (phenylephrine HCl 1%, cyclopentolate HCl 0.2%) and local anaesthetic eye drops (proxymetacaine HCl 0.5%; 2 drops) given to both groups prior to examination | SpO2 desaturation by ≥ 10% pre‐examination, at eye speculum insertion and postexamination PIPP scores at 5 and 1 min pre‐examination, eye speculum insertion, and 1 and 5 min postexamination | Percentage of population Means, SD reported | No significant difference in SpO2 desaturation by ≥ 10% pre‐examination, at eye speculum insertion between water group and sucrose group PIPP score at the eye examination significantly lower in the sucrose group (mean 8.3, SD 4.5) compared to the water group (mean 10.5, SD 4.0), P = 0.01); however, this effect was not sustained at 1 and 5 min post examination Results for the two groups prior to cross‐over were not reported. No data could be used in RevMan‐analyses | |
| 32 preterm infants, mean PMA 28 weeks, mean PNA 50.8 days
| Eye examination for ROP |
Doses were adjusted by weight:
All infants were swaddled and offered a pacifier All infants received tropicamide 0.5% and phenylephrine 2.5% eye drops approximately 30 min before examination. Topical tetracaine was instilled into the eyes just prior to the examination | % of the eye examination the infant spent crying
Mean HR, at baseline, post eye drop instillation, post study drug, during eye examination and post‐eye examination* RR and SpO2 at baseline, post‐eye drop instillation, post study drug, during eye examination and post‐eye examination* PIPP at baseline, during eye examination, post‐eye examination* *measures were taken at 1‐min intervals and were means for each study period ‐ study period times (in min) were not defined | Mean, SD | No significant difference in crying time between the sucrose and water groups. Significant increases in HR, in both groups from baseline (P < 0.01) No differences between the sucrose and water groups in HR at any time point Significant reduction in SpO2 in sucrose group after the study drug (mean 95%, SD 4%) compared to the water group (mean 97%, SD 3%) Significant reduction in SpO2 in sucrose group during the eye examination (mean 93%, SD 5%; P < 0.05) compared to the water group (mean 96%, SD 3%; P < 0.05) No significant difference in RR and SpO2 at 2 min post examination No significant differences in PIPP scores between the sucrose and placebo groups before, during and after eye examinations Data for PIPP during examination used in RevMan‐analyses | |
| 30 preterm infants:
| Eye examination for ROP |
1st dose given 1.5 min before local anaesthetic eye drops, 2nd dose right at placement of the eye speculum, 3rd dose 120 s after 2nd dose All infants received proxymetacaine hydrochloride 0.5% eye drops and were swaddled before the eye examination | PIPP at baseline, at eye drop instillation, at examination of left eye and at 30, 60, 90 and 120 s after the examination | Mean, SEM | Statistically significant differences in mean PIPP scores were found between sucrose group (mean 8.8, SEM 0.7) and the water group (mean 11.4, SEM 0.6) during the eye examination (P = 0.0077). However, this was not sustained after the eye examination
Data presented that could be used in RevMan‐analyses | |
| 40 preterm infants, corrected mean age:
| Eye examination for ROP |
Infants were given mydriatic eye drops (cyclopentolate 0.2% and phenylephrine 1%) 60 min and 30 min prior to examination. Every neonate received local anaesthetic eye drops (tetracaine hydrochloride 1%) 30 s prior to examination. The interventions were given 2 min prior to the start of the eye examinations. The infants were swaddled in both groups | N‐PASS, HR and SpO2 at baseline, number of episodes of bradycardia and desaturation, adverse events | Median, range | Significantly lower N‐PASS score at speculum insertion in sucrose compared to water group (6.5 vs. 5.0; P = 0.002); during procedure (9.5 vs. 7.5; P = 0.003). No significant differences between sucrose group and water group for episodes of desaturation, bradycardia, and adverse outcomes Data were not used in RevMan‐analyses | |
| 30 preterm infants < 32 weeks PMA:
| Eye examination for ROP | Prior to examination: instillation of 0.5% proxymetacaine and 1% tropicamide, then 15 min later eye drop instillation of 0.5% tropicamide, 2.5% phenylephrine and 0.5% tropicamide
| Total crying time out of 5 min starting at the onset of the ROP examination HR 30 min before eye drop instillation and 5 min before ROP examination, during examination, and 5 min after the ROP examination SpO2 and RR at 30 min before eye drop instillation, 5 min before the ROP exam, 3 measurements during the ROP exam, and 5 min after the ROP exam | Reported means and SEM Not reported SpO2 means and SEM reported RR not reported | No significant differences in crying time between sucrose and water groups (P = 0.127)
There was no significant difference in HR between groups No significant differences between treatment group and the control group for SpO2 and respiratory rate at any point Transcribed SEM to SD | |
| CI = confidence interval | ||||||
| Study | Participants | Procedure | Interventions | Outcomes | Metrics used | Results |
| 90 full‐term newborn males who underwent circumcision. PMA 38 weeks or more, 5‐min Apgar score of 8 or higher, PNA of 12 h or more, birthweight > 2500 g and free from jaundice, anomalies of the penis and analgesia or sedation in the previous 48 h | Circumcision |
| N‐PASS used to assess the severity of pain and neonatal response to pain, 5 min before, during and 5 min after the circumcision for all newborns. The scale measures both physiologic (HR, RR, blood pressure and oxygen saturation) and behavioural (crying irritability, behaviour state, facial expression and extremities tone) responses to pain | Mean, SD (Abstract says median) (Tables state mean and SD) | N‐PASS scores were significantly lower in Data used in RevMan‐analyses | |
| 120 healthy male newborns, ≥ 38 weeks PMA | Circumcision |
| HR at baseline, restraint, skin preparation for procedure, lateral clamping, lysis of adhesions, dorsal clamping, dorsal cut, retraction, application of Gomco bell and clamp, tightening of clamp, excision of foreskin, removal of clamp, removal of bell, placement of dressing and overall change in HR from baseline SpO2 at baseline and throughout procedure; change from baseline during the circumcision procedure | Mean, SD, mean differences and 95% CI | Mean change in HR from baseline through all follow‐up times were significantly different between groups (P < 0.001) Mean (95% CIs) HR differences:
Sucrose had a statistically significant effect compared to the no treatment controls (P < 0.001) Significant differences between groups in changes in SpO2 from baseline to circumcision (P < 0.001) Mean (95% CI) SpO2 differences between the 3 groups from baseline:
Differences between both the DPNB and sucrose groups compared to control were significant (P < 0.05) Control vs. sucrose: ‐3.3 (‐5.0 to ‐1.6) was statistically significant (P < 0.001) Data used in RevMan‐analyses | |
| 57 term infants, mean age at time of procedure 30 h to 43 h | Circumcision |
All infants had EMLA cream applied 1 to 3 h before procedure | Time spent crying during procedure Time spent grimacing Procedure stages:
| Median and means, graphically Not reported | Cumulative mean time crying for forceps to unrestraint interval in the Gomco + sucrose group was 56 s (median = 53 s) compared to 86 s (median = 78 s) in the Gomco + water group (P = 0.0001) Crying time in Mogen + sucrose and Mogen + water groups were not significantly different Overall, mean crying time significantly decreased in infants treated with sucrose compared to infants treated with water (P = 0.0001) Significantly less time spent grimacing in the Gomco + sucrose group compared to the Gomco + water group (P = 0.0001) No significant differences between Mogen + sucrose and the Mogen + water groups Overall, mean time grimacing was significantly reduced in infants treated with sucrose compared to infants treated with water (P = 0.0001) No data were presented that could be used in RevMan‐analyses | |
| 80 healthy, term, newborn male infants, mean PMA 39.5 weeks | Circumcision |
| Plasma cortisol level 30 min after beginning circumcision Behavioural arousal and behavioural distress scores were recorded at five scoring periods:
| Mean, SD | Plasma cortisol levels not significantly different between groups Data used in RevMan‐analyses | |
| Abbreviations CI = confidence interval PMA = Post menstrual age | ||||||
| Study | Participants | Procedure | Interventions | Outcomes | Metrics used | Results |
| 106 infants between 32 and 37 weeks PMA Sucrose group: mean (SD) age (h) at enrolment 3.78 (2.92), mean (SD) birthweight (g) 1555.58 (242.79) Water group: mean (SD) age (h) at enrolment 3.16 (2.18), mean (SD) birthweight 1575.24 (241.89) | Repeated potentially painful procedures during the first 7 days after enrolment Mean (SD) number of procedures:
The authors did not describe which different potentially painful procedures were included (we have written to the corresponding author ([email protected]) to get a description of these procedures) |
| Primary outcome was score of motor development and vigor (MDV) and alertness and orientation (AO) domains of NAPI scale performed at 40 weeks PMA In addition, the highest HR and lowest SpO2 obtained during the procedure were recorded till 30 s after the prick, for newborns in both the groups (not reported) | Means, SDs, 95% CIs | A total of 93 newborns were analyzed. The baseline characteristics of the groups were comparable. No statistically significant difference was observed in the assessment at 40 weeks PMA, among the groups. Use of sucrose analgesia, for repeated painful procedures on newborns, does not lead to any significant difference in the short‐term neurobehavioral outcome Data used in RevMan‐analyses | |
| 33 preterm infants, median PMA 30 weeks | Venipuncture, arterial puncture, heel lance, intravenous cannulation, endotracheal tube introduction, endotracheal tube suctioning, gavage insertion for feeding, removal of electrode leads and tape | On day 1, no treatment was given to any neonate in order to collect baseline data. After that, on days 2 to 4 before every minor painful procedure infants received either:
| Pain was assessed over 4 days during morning blood collection (heel lance) Incidence of cry (% neonates crying), HR (% neonates with HR ≥ 160 beats per min), NFCS (% neonates with score ≥ 3), Activated Behavioural State (% neonates with score ≥ 4). The assessment was divided into five phases: Baseline Antisepsis, Puncture, Dressing, and Recovery. The neonates’ | No means or standard deviations reported NFCS results reported in graph form only | The data analysis used cut‐off scores for painful and distressful Data could not be used in RevMan‐analyses No side effects of using sucrose were detected | |
| 103 infants:
| Every time the infant was to undergo an invasive (e.g. heel lance, intravenous cannulation, arterial puncture, injection) or non‐invasive but presumably uncomfortable procedure (e.g. endotracheal tube suctioning, tape or |
The solution was in a syringe and administered into the infant’s mouth at the beginning of the procedure, 2 min into the procedure, and another 2 min into the procedure. If the procedure was > 15 min, up to another 3 0.1 mL doses were to be given 2 min apart | Neurobehavioural development assessed by the sub scales of alertness and orientation and motor development and vigour of the NAPI, SNAP and NBRS SNAP was measured for each 24‐hour period during the study week and NBRS was measured at 2 weeks’ PNA and at discharge | Beta, CI (multiple regression) | On the basis of analysis of covariance with PMA at birth and the number of invasive procedures as covariates, there were no group differences (between sucrose and water) for any of the secondary outcomes of Neuro‐Biological Risk Scores (NBRS) at two weeks; postnatal age (P = 0.426) or at discharge (P = 0.965). In the sucrose group only, higher number of doses of sucrose predicted lower scores on motor development and vigor, and alertness and orientation at 36 weeks’, lower motor development and vigor at 40 weeks’, and higher NBRS at 2 weeks’ postnatal age. Higher number of invasive procedures was predictive of higher NBRS both times in the water group. No significant differences found between the sucrose and water groups for Neurobehavioral Assessment of the Preterm Infant (NAPI). Data could not be used in RevMan‐analyses | |
| 240 newborn infants born to non‐diabetic and diabetic mothers, PMA ≥ 36 weeks | 3 heel lances, venipuncture and intramuscular vitamin K injection Multiple painful stimuli |
| PIPP scores overall, during IM injection, during venipuncture and all 3 heel lances Safety | Mean, SD, 95% CI | Overall PIPP scores were significantly lower among newborns given sucrose (mean 6.8, SD 2.9) compared to water (mean 8.1, SD 2.5) (MD ‐1.3, 95% CI ‐2.0 to ‐0.6; P < 0.001) PIPP scores during IM injection did not differ between the sucrose and water group for non‐diabetic (P = 0.10) or diabetic mothers (P = 0.15) PIPP scores during venipuncture were significantly lower among infants of non‐diabetic mothers who received sucrose compared to water (mean score 5.7, 95% CI 4.7 to 6.7 vs. mean score 8.9, 95% CI 7.9 to 9.9; P < 0.001). Similar results were found among infants of diabetic mothers (sucrose: mean score 6.8, 95% CI 5.7 to 7.9 vs. water: mean score 9.2, 95% CI 8.4 to 10.1; P < 0.001) During first 3 heel lances, newborns from diabetic mothers receiving sucrose or water did not have significantly different PIPP scores Results for different painful stimuli reported separately Data could be used in RevMan‐analyses | |
| Abbreviations CI = confidence interval | ||||||
| Study | Participants | Procedure | Interventions | Outcomes | Metrics used | Results |
| Neonates with established enteral feeding, not on any respiratory support and with PMA 32 to 42 weeks requiring echocardiography | Echocardiography |
| PIPP | Mean, SD | The mean (SD) PIPP score was significantly lower in the sucrose group 5.25 (1.92) vs 7.40 (3.78) in the control group 4 (7.6%) neonates spat up the sucrose solution after administration. No episodes of hyperglycaemia, necrotizing enterocolitis, or feed intolerance were reported after sucrose administration Data could be used in RevMan‐analyses | |
| Abbreviations PIPP = Premature Infant Pain Profile | ||||||
| Outcome or subgroup title | No. of studies | No. of participants | Statistical method | Effect size |
| 1 Total crying time (s) Show forest plot | 1 | 42 | Mean Difference (IV, Fixed, 95% CI) | ‐48.09 [‐93.04, ‐3.14] |
| 1.1 Term infants | 1 | 42 | Mean Difference (IV, Fixed, 95% CI) | ‐48.09 [‐93.04, ‐3.14] |
| 2 Percentage change in heart rate 1 min after heel lance Show forest plot | 1 | 30 | Mean Difference (IV, Fixed, 95% CI) | 6.4 [‐13.69, 26.49] |
| 2.1 Term infants | 1 | 30 | Mean Difference (IV, Fixed, 95% CI) | 6.4 [‐13.69, 26.49] |
| Outcome or subgroup title | No. of studies | No. of participants | Statistical method | Effect size |
| 1 PIPP at 30 s after heel lance Show forest plot | 2 | 105 | Mean Difference (IV, Fixed, 95% CI) | ‐1.42 [‐2.86, 0.01] |
| 1.1 Term infants | 1 | 44 | Mean Difference (IV, Fixed, 95% CI) | ‐2.70 [‐4.96, ‐0.44] |
| 1.2 Preterm infants | 1 | 61 | Mean Difference (IV, Fixed, 95% CI) | ‐0.56 [‐2.42, 1.30] |
| 2 PIPP at 60 s after heel lance Show forest plot | 1 | 31 | Mean Difference (IV, Fixed, 95% CI) | ‐1.80 [‐3.81, 0.21] |
| 2.1 Preterm infants | 1 | 31 | Mean Difference (IV, Fixed, 95% CI) | ‐1.80 [‐3.81, 0.21] |
| 3 PIPP score during heel lance (1st heel lance) Show forest plot | 1 | 107 | Mean Difference (IV, Fixed, 95% CI) | 0.0 [‐1.52, 1.52] |
| 3.1 Newborns of diabetic mothers | 1 | 107 | Mean Difference (IV, Fixed, 95% CI) | 0.0 [‐1.52, 1.52] |
| 4 DAN score at 30 s after heel lance Show forest plot | 1 | 32 | Mean Difference (IV, Fixed, 95% CI) | ‐1.90 [‐8.58, 4.78] |
| 4.1 Term infants | 1 | 32 | Mean Difference (IV, Fixed, 95% CI) | ‐1.90 [‐8.58, 4.78] |
| 5 NIPS during heel lance Show forest plot | 1 | 56 | Mean Difference (IV, Fixed, 95% CI) | ‐2.0 [‐2.42, ‐1.58] |
| 5.1 Term infants | 1 | 56 | Mean Difference (IV, Fixed, 95% CI) | ‐2.0 [‐2.42, ‐1.58] |
| 6 Duration of first cry (s) Show forest plot | 2 | 142 | Mean Difference (IV, Fixed, 95% CI) | ‐8.63 [‐19.88, 2.61] |
| 6.1 Term infants | 1 | 32 | Mean Difference (IV, Fixed, 95% CI) | ‐5.0 [‐17.40, 7.40] |
| 6.2 Preterm infants | 1 | 110 | Mean Difference (IV, Fixed, 95% CI) | ‐25.41 [‐52.06, 1.24] |
| 7 Total crying time Show forest plot | 2 | 88 | Mean Difference (IV, Fixed, 95% CI) | ‐22.11 [‐32.52, ‐11.70] |
| 7.1 Term infants | 2 | 88 | Mean Difference (IV, Fixed, 95% CI) | ‐22.11 [‐32.52, ‐11.70] |
| 8 Heart rate (beats/min) during heel lance Show forest plot | 2 | 96 | Mean Difference (IV, Fixed, 95% CI) | ‐0.81 [‐8.57, 6.94] |
| 8.1 Term infants | 2 | 96 | Mean Difference (IV, Fixed, 95% CI) | ‐0.81 [‐8.57, 6.94] |
| 9 Percentage change in heart rate 1 min after heel lance Show forest plot | 2 | 86 | Mean Difference (IV, Fixed, 95% CI) | 0.90 [‐5.81, 7.61] |
| 9.1 Term infants | 2 | 86 | Mean Difference (IV, Fixed, 95% CI) | 0.90 [‐5.81, 7.61] |
| 10 Respiratory rate (breaths/min) during heel lance Show forest plot | 1 | 56 | Mean Difference (IV, Fixed, 95% CI) | ‐1.0 [‐7.64, 5.64] |
| 10.1 Term infants | 1 | 56 | Mean Difference (IV, Fixed, 95% CI) | ‐1.0 [‐7.64, 5.64] |
| 11 Oxygen saturation (%) during heel lance Show forest plot | 1 | 56 | Mean Difference (IV, Fixed, 95% CI) | ‐5.0 [‐12.79, 2.79] |
| 11.1 Term infants | 1 | 56 | Mean Difference (IV, Fixed, 95% CI) | ‐5.0 [‐12.79, 2.79] |
| 12 Skin blood flow during heel lance (perfusion units (PU)) Show forest plot | 1 | 56 | Mean Difference (IV, Fixed, 95% CI) | ‐32.0 [‐68.87, 4.87] |
| 12.1 Term infants | 1 | 56 | Mean Difference (IV, Fixed, 95% CI) | ‐32.0 [‐68.87, 4.87] |
| 13 Nociceptive‐specific brain activity (mean weight) Show forest plot | 1 | 44 | Mean Difference (IV, Fixed, 95% CI) | 0.02 [‐0.05, 0.09] |
| 13.1 Term infants | 1 | 44 | Mean Difference (IV, Fixed, 95% CI) | 0.02 [‐0.05, 0.09] |
| Outcome or subgroup title | No. of studies | No. of participants | Statistical method | Effect size |
| 1 Duration of first cry (s) Show forest plot | 2 | 80 | Mean Difference (IV, Fixed, 95% CI) | ‐63.20 [‐79.20, ‐47.19] |
| 1.1 Term infants | 2 | 80 | Mean Difference (IV, Fixed, 95% CI) | ‐63.20 [‐79.20, ‐47.19] |
| 2 Percentage change in heart rate 1 min after heel lance Show forest plot | 1 | 30 | Mean Difference (IV, Fixed, 95% CI) | 2.60 [‐11.43, 16.63] |
| 2.1 Term infants | 1 | 30 | Mean Difference (IV, Fixed, 95% CI) | 2.60 [‐11.43, 16.63] |
| Outcome or subgroup title | No. of studies | No. of participants | Statistical method | Effect size |
| 1 PIPP Show forest plot | 1 | 47 | Mean Difference (IV, Fixed, 95% CI) | ‐1.75 [‐2.22, ‐1.28] |
| 1.1 Preterm infants | 1 | 47 | Mean Difference (IV, Fixed, 95% CI) | ‐1.75 [‐2.22, ‐1.28] |
| 2 Comfort score Show forest plot | 1 | 47 | Mean Difference (IV, Fixed, 95% CI) | ‐2.60 [‐3.06, ‐2.14] |
| 2.1 Preterm infants | 1 | 47 | Mean Difference (IV, Fixed, 95% CI) | ‐2.60 [‐3.06, ‐2.14] |
| Outcome or subgroup title | No. of studies | No. of participants | Statistical method | Effect size |
| 1 NFCS Show forest plot | 1 | 100 | Mean Difference (IV, Fixed, 95% CI) | ‐0.60 [‐1.47, 0.27] |
| 1.1 Term infants | 1 | 100 | Mean Difference (IV, Fixed, 95% CI) | ‐0.60 [‐1.47, 0.27] |
| 2 PIPP 30 s after heel lance (mainly preterm infants) Show forest plot | 3 | 278 | Mean Difference (IV, Fixed, 95% CI) | ‐1.70 [‐2.13, ‐1.26] |
| 2.1 New subgroup | 3 | 278 | Mean Difference (IV, Fixed, 95% CI) | ‐1.70 [‐2.13, ‐1.26] |
| 3 PIPP 60 s after heel lance Show forest plot | 2 | 164 | Mean Difference (IV, Fixed, 95% CI) | ‐2.14 [‐3.34, ‐0.94] |
| 4 Crying time (s) Show forest plot | 2 | 142 | Mean Difference (IV, Fixed, 95% CI) | ‐1.41 [‐9.87, 7.04] |
| 4.1 Term infants | 2 | 142 | Mean Difference (IV, Fixed, 95% CI) | ‐1.41 [‐9.87, 7.04] |
| Outcome or subgroup title | No. of studies | No. of participants | Statistical method | Effect size |
| 1 Crying time (s) Show forest plot | 1 | 35 | Mean Difference (IV, Fixed, 95% CI) | ‐8.0 [‐21.07, 5.07] |
| 1.1 Term infants | 1 | 35 | Mean Difference (IV, Fixed, 95% CI) | ‐8.0 [‐21.07, 5.07] |
| Outcome or subgroup title | No. of studies | No. of participants | Statistical method | Effect size |
| 1 PIPP score Show forest plot | 1 | 47 | Mean Difference (IV, Fixed, 95% CI) | ‐1.75 [‐4.03, 0.53] |
| 2 COMFORTneo score Show forest plot | 1 | 47 | Mean Difference (IV, Fixed, 95% CI) | ‐2.60 [‐4.84, ‐0.36] |
| Outcome or subgroup title | No. of studies | No. of participants | Statistical method | Effect size |
| 1 PIPP score Show forest plot | 1 | 47 | Mean Difference (IV, Fixed, 95% CI) | ‐0.13 [‐2.41, 2.15] |
| 2 COMFORTneo score Show forest plot | 1 | 47 | Mean Difference (IV, Fixed, 95% CI) | ‐0.5 [‐2.74, 1.74] |
| Outcome or subgroup title | No. of studies | No. of participants | Statistical method | Effect size |
| 1 Total Bernese Pain Scale for Neonates during heel lance Show forest plot | 1 | 48 | Mean Difference (IV, Fixed, 95% CI) | ‐2.27 [‐4.66, 0.12] |
| 2 Total Bernese Pain Scale for Neonates during recovery Show forest plot | 1 | 48 | Mean Difference (IV, Fixed, 95% CI) | ‐0.31 [‐1.72, 1.10] |
| Outcome or subgroup title | No. of studies | No. of participants | Statistical method | Effect size |
| 1 Total Bernese Pain Scale for Neonates during heel lance (preterm infants) Show forest plot | 1 | 47 | Mean Difference (IV, Fixed, 95% CI) | ‐0.05 [‐2.16, 2.06] |
| 2 Total Bernese Pain Scale for Neonates during recovery (preterm infants) Show forest plot | 1 | 47 | Mean Difference (IV, Fixed, 95% CI) | 0.64 [‐0.73, 2.01] |
| Outcome or subgroup title | No. of studies | No. of participants | Statistical method | Effect size |
| 1 Heart rate (beats/min) during heel lance Show forest plot | 1 | 40 | Mean Difference (IV, Fixed, 95% CI) | 6.20 [‐6.19, 18.59] |
| 1.1 Term infants | 1 | 40 | Mean Difference (IV, Fixed, 95% CI) | 6.20 [‐6.19, 18.59] |
| 2 Crying time (s) Show forest plot | 1 | 56 | Mean Difference (IV, Fixed, 95% CI) | ‐34.89 [‐61.67, ‐8.11] |
| 2.1 Term infants | 1 | 56 | Mean Difference (IV, Fixed, 95% CI) | ‐34.89 [‐61.67, ‐8.11] |
| 3 Percentage change in heart rate 1 min after heel lance Show forest plot | 1 | 56 | Mean Difference (IV, Fixed, 95% CI) | ‐6.58 [‐14.85, 1.69] |
| 3.1 Term infants | 1 | 56 | Mean Difference (IV, Fixed, 95% CI) | ‐6.58 [‐14.85, 1.69] |
| Outcome or subgroup title | No. of studies | No. of participants | Statistical method | Effect size |
| 1 Heart rate (beats/min) during heel lance Show forest plot | 1 | 40 | Mean Difference (IV, Fixed, 95% CI) | 16.30 [1.93, 30.67] |
| 1.1 Term infants | 1 | 40 | Mean Difference (IV, Fixed, 95% CI) | 16.30 [1.93, 30.67] |
| Outcome or subgroup title | No. of studies | No. of participants | Statistical method | Effect size |
| 1 NIPS score Show forest plot | 1 | 42 | Mean Difference (IV, Fixed, 95% CI) | ‐0.86 [‐1.43, ‐0.29] |
| 2 Crying time (s) Show forest plot | 1 | 42 | Mean Difference (IV, Fixed, 95% CI) | ‐51.29 [‐73.11, ‐29.47] |
| Outcome or subgroup title | No. of studies | No. of participants | Statistical method | Effect size |
| 1 Revised NFCS Show forest plot | 1 | 343 | Mean Difference (IV, Fixed, 95% CI) | 0.43 [0.23, 0.63] |
| 2 Percentage increase in heart rate Show forest plot | 1 | 343 | Mean Difference (IV, Fixed, 95% CI) | 2.29 [0.44, 4.14] |
| 3 Decrease in oxygen saturation in blood (%) Show forest plot | 1 | 343 | Mean Difference (IV, Fixed, 95% CI) | 0.48 [0.10, 0.86] |
| Outcome or subgroup title | No. of studies | No. of participants | Statistical method | Effect size |
| 1 Revised NFCS Show forest plot | 1 | 343 | Mean Difference (IV, Fixed, 95% CI) | 0.4 [0.19, 0.61] |
| 2 Percentage increase in heart rate Show forest plot | 1 | 343 | Mean Difference (IV, Fixed, 95% CI) | 0.57 [‐1.43, 2.57] |
| 3 Decrease in oxygen saturation in blood (%) Show forest plot | 1 | 343 | Mean Difference (IV, Fixed, 95% CI) | 0.30 [‐0.07, 0.67] |
| Outcome or subgroup title | No. of studies | No. of participants | Statistical method | Effect size |
| 1 Revised NFCS Show forest plot | 1 | 337 | Mean Difference (IV, Fixed, 95% CI) | 0.43 [0.23, 0.63] |
| 2 Percentage increase in heart rate Show forest plot | 1 | 337 | Mean Difference (IV, Fixed, 95% CI) | 3.25 [1.43, 5.07] |
| 3 Decrease in oxygen saturation in blood (%) Show forest plot | 1 | 337 | Mean Difference (IV, Fixed, 95% CI) | 0.79 [0.44, 1.14] |
| Outcome or subgroup title | No. of studies | No. of participants | Statistical method | Effect size |
| 1 NIPS score in term and preterm infants Show forest plot | 1 | 111 | Mean Difference (IV, Fixed, 95% CI) | ‐0.9 [‐1.81, 0.01] |
| Outcome or subgroup title | No. of studies | No. of participants | Statistical method | Effect size |
| 1 PIPP score during venipuncture Show forest plot | 1 | 213 | Mean Difference (IV, Fixed, 95% CI) | ‐2.79 [‐3.76, ‐1.83] |
| 1.1 Newborns of non‐diabetic mothers | 1 | 106 | Mean Difference (IV, Fixed, 95% CI) | ‐3.2 [‐4.58, ‐1.82] |
| 1.2 Newborns of diabetic mothers | 1 | 107 | Mean Difference (IV, Fixed, 95% CI) | ‐2.40 [‐3.76, ‐1.04] |
| 2 Duration of cry (s) Show forest plot | 1 | 50 | Mean Difference (IV, Fixed, 95% CI) | ‐16.5 [‐71.41, 38.41] |
| 2.1 Term infants | 1 | 50 | Mean Difference (IV, Fixed, 95% CI) | ‐16.5 [‐71.41, 38.41] |
| Outcome or subgroup title | No. of studies | No. of participants | Statistical method | Effect size |
| 1 Duration of first cry (s) Show forest plot | 1 | 50 | Mean Difference (IV, Fixed, 95% CI) | ‐14.0 [‐51.79, 23.79] |
| 1.1 Term infants | 1 | 50 | Mean Difference (IV, Fixed, 95% CI) | ‐14.0 [‐51.79, 23.79] |
| Outcome or subgroup title | No. of studies | No. of participants | Statistical method | Effect size |
| 1 PIPP score Show forest plot | 1 | 76 | Mean Difference (IV, Fixed, 95% CI) | 1.30 [‐0.12, 2.72] |
| 1.1 Preterm infants | 1 | 76 | Mean Difference (IV, Fixed, 95% CI) | 1.30 [‐0.12, 2.72] |
| 2 PIPP score during recovery period Show forest plot | 1 | 76 | Mean Difference (IV, Fixed, 95% CI) | 0.60 [‐0.73, 1.93] |
| 3 DAN score during venipuncture Show forest plot | 1 | 76 | Mean Difference (IV, Fixed, 95% CI) | 1.30 [0.26, 2.34] |
| 3.1 Preterm infants | 1 | 76 | Mean Difference (IV, Fixed, 95% CI) | 1.30 [0.26, 2.34] |
| 4 DAN score during recovery period Show forest plot | 1 | 76 | Mean Difference (IV, Fixed, 95% CI) | 1.40 [0.03, 2.77] |
| 5 Facial grimacing score Show forest plot | 1 | 213 | Mean Difference (IV, Fixed, 95% CI) | ‐5.0 [‐13.48, 3.48] |
| 6 Observer‐rated pain (VAS) (cm) Show forest plot | 1 | 213 | Mean Difference (IV, Fixed, 95% CI) | ‐0.7 [‐1.55, 0.15] |
| 7 Mean crying times during all procedures (s) Show forest plot | 2 | 289 | Mean Difference (IV, Fixed, 95% CI) | 1.83 [‐10.42, 14.09] |
| 7.1 Term infants | 1 | 213 | Mean Difference (IV, Fixed, 95% CI) | 0.0 [‐13.79, 13.79] |
| 7.2 Preterm infants | 1 | 76 | Mean Difference (IV, Fixed, 95% CI) | 8.69 [‐17.97, 35.35] |
| 8 Heart rate (beats/min) Show forest plot | 1 | 213 | Mean Difference (IV, Fixed, 95% CI) | 5.0 [0.39, 9.61] |
| 9 Oxygen saturation % Show forest plot | 1 | 213 | Mean Difference (IV, Fixed, 95% CI) | 0.20 [‐0.33, 0.73] |
| Outcome or subgroup title | No. of studies | No. of participants | Statistical method | Effect size |
| 1 Facial grimacing score Show forest plot | 1 | 216 | Mean Difference (IV, Fixed, 95% CI) | ‐28.0 [‐36.48, ‐19.52] |
| 2 Observer‐rated pain (VAS) (cm) Show forest plot | 1 | 216 | Mean Difference (IV, Fixed, 95% CI) | ‐0.40 [‐1.25, 0.45] |
| 3 Cry duration (s) Show forest plot | 1 | 216 | Mean Difference (IV, Fixed, 95% CI) | ‐39.0 [‐52.43, ‐25.57] |
| 4 Heart rate (beats/min) Show forest plot | 1 | 216 | Mean Difference (IV, Fixed, 95% CI) | 3.0 [‐1.95, 7.95] |
| 5 Oxygen saturation (%) Show forest plot | 1 | 216 | Mean Difference (IV, Fixed, 95% CI) | 0.5 [‐0.03, 1.03] |
| Outcome or subgroup title | No. of studies | No. of participants | Statistical method | Effect size |
| 1 Heart rate (beats/min) after needle insertion Show forest plot | 1 | 47 | Mean Difference (IV, Fixed, 95% CI) | ‐1.90 [‐11.73, 7.93] |
| 2 Heart rate (beats/min) 1 min after procedure completed Show forest plot | 1 | 47 | Mean Difference (IV, Fixed, 95% CI) | ‐2.40 [‐10.56, 5.76] |
| 3 Oxygen saturation in blood (%) after needle insertion Show forest plot | 1 | 47 | Mean Difference (IV, Fixed, 95% CI) | ‐1.0 [‐4.65, 2.65] |
| 4 Oxygen saturation in blood (%) 1 min after procedure Show forest plot | 1 | 47 | Mean Difference (IV, Fixed, 95% CI) | ‐2.90 [‐5.95, 0.15] |
| Outcome or subgroup title | No. of studies | No. of participants | Statistical method | Effect size |
| 1 NIPS 1 min to 2 min after IM injection Show forest plot | 1 | 60 | Mean Difference (IV, Fixed, 95% CI) | ‐2.30 [‐2.93, ‐1.67] |
| 2 PIPP during IM injection (term infants) Show forest plot | 1 | 232 | Mean Difference (IV, Fixed, 95% CI) | ‐1.05 [‐1.98, ‐0.12] |
| 2.1 Infants of non‐diabetic mothers | 1 | 115 | Mean Difference (IV, Fixed, 95% CI) | ‐1.10 [‐2.38, 0.18] |
| 2.2 Infants of diabetic mothers | 1 | 117 | Mean Difference (IV, Fixed, 95% CI) | ‐1.0 [‐2.35, 0.35] |
| 3 Duration of cry (s) Show forest plot | 1 | 110 | Mean Difference (IV, Fixed, 95% CI) | ‐163.83 [‐192.58, ‐135.08] |
| Outcome or subgroup title | No. of studies | No. of participants | Statistical method | Effect size |
| 1 NIPS 1 min to 2 min after immunization Show forest plot | 1 | 60 | Mean Difference (IV, Fixed, 95% CI) | ‐0.10 [‐0.89, 0.69] |
| Outcome or subgroup title | No. of studies | No. of participants | Statistical method | Effect size |
| 1 Crying time (s) Show forest plot | 1 | 29 | Mean Difference (IV, Fixed, 95% CI) | 15.2 [11.52, 18.88] |
| 2 Grimacing time Show forest plot | 1 | 29 | Mean Difference (IV, Fixed, 95% CI) | 16.20 [12.35, 20.05] |
| Outcome or subgroup title | No. of studies | No. of participants | Statistical method | Effect size |
| 1 Change in DAN score Show forest plot | 1 | 33 | Mean Difference (IV, Fixed, 95% CI) | ‐2.43 [‐4.50, ‐0.36] |
| 2 Infants crying at maximal catheter insertion Show forest plot | 1 | 33 | Risk Difference (M‐H, Fixed, 95% CI) | ‐0.51 [‐0.81, ‐0.22] |
| Outcome or subgroup title | No. of studies | No. of participants | Statistical method | Effect size |
| 1 PIPP score intra procedure Show forest plot | 1 | 105 | Mean Difference (IV, Fixed, 95% CI) | ‐0.30 [‐1.33, 0.73] |
| 2 PIPP score 30 s post procedure Show forest plot | 1 | 105 | Mean Difference (IV, Fixed, 95% CI) | ‐1.30 [‐2.31, ‐0.29] |
| 3 PIPP score 1 min post procedure Show forest plot | 1 | 105 | Mean Difference (IV, Fixed, 95% CI) | ‐0.5 [‐1.40, 0.40] |
| Outcome or subgroup title | No. of studies | No. of participants | Statistical method | Effect size |
| 1 PIPP during examination Show forest plot | 1 | 32 | Mean Difference (IV, Fixed, 95% CI) | 0.0 [‐2.08, 2.08] |
| 2 Crying time (%) Show forest plot | 1 | 32 | Mean Difference (IV, Fixed, 95% CI) | ‐10.0 [‐32.91, 12.91] |
| 3 Heart rate (beats/min) Show forest plot | 1 | 32 | Mean Difference (IV, Fixed, 95% CI) | ‐6.0 [‐19.33, 7.33] |
| 4 Mean blood pressure (mmHg) Show forest plot | 1 | 32 | Mean Difference (IV, Fixed, 95% CI) | ‐5.00 [‐18.48, 4.48] |
| 5 Respiratory rate (breaths/min) Show forest plot | 1 | 32 | Mean Difference (IV, Fixed, 95% CI) | 2.0 [‐5.07, 9.07] |
| 6 Oxygen saturation (%) Show forest plot | 1 | 32 | Mean Difference (IV, Fixed, 95% CI) | ‐1.00 [‐5.86, ‐0.14] |
| Outcome or subgroup title | No. of studies | No. of participants | Statistical method | Effect size |
| 1 Total crying time Show forest plot | 1 | 30 | Mean Difference (IV, Fixed, 95% CI) | ‐33.90 [‐76.22, 8.42] |
| 2 Oxygen saturation (%) during examination Show forest plot | 1 | 30 | Mean Difference (IV, Fixed, 95% CI) | ‐1.71 [‐5.85, 2.43] |
| Outcome or subgroup title | No. of studies | No. of participants | Statistical method | Effect size |
| 1 PIPP score during eye examination Show forest plot | 3 | 134 | Mean Difference (IV, Fixed, 95% CI) | ‐2.15 [‐2.86, ‐1.43] |
| 1.1 Sucrose via syringe versus control (sterile water via syringe) | 1 | 20 | Mean Difference (IV, Fixed, 95% CI) | ‐1.0 [‐2.54, 0.54] |
| 1.2 Sucrose + pacifier versus control (sterile water + pacifier) | 3 | 114 | Mean Difference (IV, Fixed, 95% CI) | ‐2.47 [‐3.27, ‐1.66] |
| 2 Crying time (s) during eye examination Show forest plot | 1 | 64 | Mean Difference (IV, Fixed, 95% CI) | ‐21.10 [‐33.10, ‐9.10] |
| Outcome or subgroup title | No. of studies | No. of participants | Statistical method | Effect size |
| 1 Change from baseline in heart rate (beats/min) Show forest plot | 1 | 56 | Mean Difference (IV, Fixed, 95% CI) | ‐9.70 [‐19.82, 0.42] |
| Outcome or subgroup title | No. of studies | No. of participants | Statistical method | Effect size |
| 1 N‐PASS score during circumcision Show forest plot | 1 | 60 | Mean Difference (IV, Fixed, 95% CI) | 2.40 [1.85, 2.95] |
| 2 N‐PASS score after 5 min Show forest plot | 1 | 60 | Mean Difference (IV, Fixed, 95% CI) | 1.4 [0.74, 2.06] |
| 3 Heart rate (beats/min) during circumcision Show forest plot | 1 | 60 | Mean Difference (IV, Fixed, 95% CI) | 6.0 [0.19, 11.81] |
| 4 Respiratory rate (cycles/min) during circumcision Show forest plot | 1 | 60 | Mean Difference (IV, Fixed, 95% CI) | ‐1.90 [‐4.00, 0.20] |
| 5 Oxygen saturation (%) during circumcision Show forest plot | 1 | 60 | Mean Difference (IV, Fixed, 95% CI) | ‐2.70 [‐3.70, ‐1.70] |
| Outcome or subgroup title | No. of studies | No. of participants | Statistical method | Effect size |
| 1 N‐PASS score during circumcision Show forest plot | 1 | 60 | Mean Difference (IV, Fixed, 95% CI) | 3.00 [2.42, 3.58] |
| 2 N‐PASS score after 5 min Show forest plot | 1 | 60 | Mean Difference (IV, Fixed, 95% CI) | 1.20 [0.49, 1.91] |
| 3 Heart rate (beats/min) during circumcision Show forest plot | 1 | 60 | Mean Difference (IV, Fixed, 95% CI) | 12.0 [6.62, 17.38] |
| 4 Respiratory rate (cycles/min) Show forest plot | 1 | 60 | Mean Difference (IV, Fixed, 95% CI) | 0.60 [‐1.77, 2.97] |
| 5 Oxygen saturation (%) during circumcision Show forest plot | 1 | 60 | Mean Difference (IV, Fixed, 95% CI) | ‐3.40 [‐4.39, ‐2.41] |
| Outcome or subgroup title | No. of studies | No. of participants | Statistical method | Effect size |
| 1 Change in heart rate (beats/min) from baseline Show forest plot | 1 | 79 | Mean Difference (IV, Fixed, 95% CI) | 17.40 [11.16, 23.64] |
| Outcome or subgroup title | No. of studies | No. of participants | Statistical method | Effect size |
| 1 Mean Behavioral Distress Scale scores during circumcision Show forest plot | 1 | 40 | Mean Difference (IV, Fixed, 95% CI) | ‐0.67 [‐1.08, ‐0.26] |
| 2 Mean plasma cortisol levels n mol/dL Show forest plot | 1 | 40 | Mean Difference (IV, Fixed, 95% CI) | 68.90 [‐53.93, 191.73] |
| Outcome or subgroup title | No. of studies | No. of participants | Statistical method | Effect size |
| 1 PIPP Show forest plot | 1 | 104 | Mean Difference (IV, Fixed, 95% CI) | ‐2.15 [‐3.30, 1.00] |
| Outcome or subgroup title | No. of studies | No. of participants | Statistical method | Effect size |
| 1 'Motor development and vigor' (MDV) domain of NAPI tool Show forest plot | 1 | 93 | Mean Difference (IV, Fixed, 95% CI) | ‐1.83 [‐8.59, 4.93] |
| 2 'Alertness and orientation' (AO) domain of NAPI Show forest plot | 1 | 93 | Mean Difference (IV, Fixed, 95% CI) | 3.09 [‐6.49, 12.67] |