Antibiotika bei vorzeitigem Blasensprung
Abstract
Background
Premature birth carries substantial neonatal morbidity and mortality. Subclinical infection is associated with preterm rupture of membranes (PROM). Prophylactic maternal antibiotic therapy might lessen infectious morbidity and delay labour, but could suppress labour without treating underlying infection.
Objectives
To evaluate the immediate and long‐term effects of administering antibiotics to women with PROM before 37 weeks, on maternal infectious morbidity, neonatal morbidity and mortality, and longer‐term childhood development.
Search methods
We searched the Cochrane Pregnancy and Childbirth Group's Trials Register (30 September 2013).
Selection criteria
Randomised controlled trials comparing antibiotic administration with placebo that reported clinically relevant outcomes were included as were trials of different antibiotics. Trials in which no placebo was used were included for the outcome of perinatal death alone.
Data collection and analysis
We extracted data from each report without blinding of either the results or the treatments that women received. We sought unpublished data from a number of authors.
Main results
We included 22 trials, involving 6872 women and babies.
The use of antibiotics following PROM is associated with statistically significant reductions in chorioamnionitis (average risk ratio (RR) 0.66, 95% confidence interval (CI) 0.46 to 0.96, and a reduction in the numbers of babies born within 48 hours (average RR 0.71, 95% CI 0.58 to 0.87) and seven days of randomisation (average RR 0.79, 95% CI 0.71 to 0.89). The following markers of neonatal morbidity were reduced: neonatal infection (RR 0.67, 95% CI 0.52 to 0.85), use of surfactant (RR 0.83, 95% CI 0.72 to 0.96), oxygen therapy (RR 0.88, 95% CI 0.81 to 0.96), and abnormal cerebral ultrasound scan prior to discharge from hospital (RR 0.81, 95% CI 0.68 to 0.98). Co‐amoxiclav was associated with an increased risk of neonatal necrotising enterocolitis (RR 4.72, 95% CI 1.57 to 14.23).
One study evaluated the children's health at seven years of age (ORACLE Children Study) and found antibiotics seemed to have little effect on the health of children.
Authors' conclusions
Routine prescription of antibiotics for women with preterm rupture of the membranes is associated with prolongation of pregnancy and improvements in a number of short‐term neonatal morbidities, but no significant reduction in perinatal mortality. Despite lack of evidence of longer‐term benefit in childhood, the advantages on short‐term morbidities are such that we would recommend antibiotics are routinely prescribed. The antibiotic of choice is not clear but co‐amoxiclav should be avoided in women due to increased risk of neonatal necrotising enterocolitis.
PICO
Laienverständliche Zusammenfassung
Antibiotika bei vorzeitigem Blasensprung
Bestimmte Antibiotika, die Frauen gegeben werden, deren Fruchtblase vorzeitig geplatzt ist, verbessern die Gesundheit Neugeborener. Neugeborene, die zu früh geboren werden, leiden in den ersten Tagen häufiger an einem schlechteren Gesundheitszustand und manchmal sogar lebenslang. Vorzeitige Wehen und Geburt (vor der 37. Schwangerschaftswoche) können auf eine unentdeckte Infektion sowie auf einen vorzeitigen Blasensprung zurückzuführen sein. Der Review mit 22 Studien, die 6872 Frauen und ihre Neugeborenen einbezogen, zeigte auf kurze Zeit, dass bestimmte Antibiotika, die Frauen gegeben werden, wenn die Fruchtblase vorzeitig platzt, die Zeit für den Verbleib der Neugeborenen in der Gebärmutter verlängerten. Sie verringerten die Infektionen, aber konnten nicht mehr Kinder retten. Ein Antibiotikum (Co‐Amoxiclav) erhöhte die Anzahl der Neugeborenen mit einer seltenen Darmentzündung (nekrotisierende Enterokolitis). Obwohl Antibiotika langfristig (im Alter von sieben Jahren) eine geringe Wirkung auf die Gesundheit von Kindern zu haben scheinen, sprechen die kurzfristigen Vorteile dafür, dass wir eine routinemäßige Antibiotikagabe empfehlen.
Authors' conclusions
Background
The rate of preterm birth is 5% to 9% of all births in Europe, and 12% to 13% in the USA; the rates in both continents are increasing, partly due to the higher number of multiple births associated with assisted conceptions (Goldenberg 2008). About 30% to 35% of preterm births are the result of maternal or fetal disease, but 40% to 45% of premature births result from spontaneous preterm labour (SPL) and 25% to 30% from preterm rupture of the membranes (PROM). Once the membranes have ruptured prematurely, 50% of women will go into labour within 24 to 48 hours and 70% to 90% within seven days (Dale 1989). For families struggling to cope with having a baby in special care, this will be one of the most difficult, emotional and stressful times of their lives (Taylor 2001), whatever the longer‐term outcome. The sequelae of preterm birth also pose significant challenges. Children born preterm are at increased risk of major disabilities, such as cerebral palsy, with the risk increasing with decreasing gestation at birth (Costeloe 2012; Marlow 2005). Many preterm children without disability develop important behavioural and educational difficulties (Saigal 2008).The prevention of preterm birth and reduction of associated disability are therefore important health priorities.
The causes of PROM are multifactorial. Infection appears to have an important role, either as a cause or as a consequence of PROM. Some organisms may produce collagenases, mucinases and proteases, which weaken the amnion and chorion and may lead to PROM. On the other hand, infection may occur secondary to membrane rupture. Ascending infection may lead to occult deciduitis, intra‐amniotic infection or fetal infection.
A possible mechanism for the link between infection and preterm delivery is bacterial stimulation of the biosynthesis of prostaglandins, either directly via phospholipase A2 and C (Bejar 1981), or indirectly via substances such as interleukin‐1, tumour necrosis factor and platelet activating factor, all of which may be found in infected amniotic fluid (Yoon 2000).
There is increasing evidence that, in addition to preterm birth, perinatal infection is an independent antecedent of other disability, particularly cerebral palsy and chronic lung disease (Dammann 2005; Romero 2007). One theory was that perinatal prescription of antibiotics could prevent neurological and respiratory disability by two mechanisms, either by prolonging pregnancy, or by preventing or eliminating infection, or both. In contrast, it was also thought possible that prolongation of pregnancy might increase rather than decrease disability by continuing fetal exposure to inflammatory cytokines, which have already been implicated in the genesis of neurological damage (Dammann 1997; Wu 2002) and chronic lung disease (Kotecha 1996; Speer 2003).
In addition to a generic effect of antibiotics, there may, in theory, be differences in the effects of different antibiotics. For example, macrolide antibiotics such as clindamycin and erythromycin, which reduce bacterial virulence, may have advantages over the beta lactam antibiotics (co‐amoxiclav, cephalosporins) which, by destroying bacteria, release endotoxins and prostaglandins and may worsen outcomes (McGregor 1997). Thus, separate comparisons of these antibiotics are included in the review.
The use of antibiotics for women with preterm labour with intact membranes is addressed by another review (King 2002).
Objectives
To assess the effects of administering antibiotics to women with preterm rupture of membranes on fetal and neonatal morbidity and mortality, maternal infectious morbidity and mortality, and long‐term childhood development.
Methods
Criteria for considering studies for this review
Types of studies
We considered all randomised controlled comparisons of antibiotic administration versus placebo, given to women with preterm rupture of membranes, for inclusion in this review. We also included comparisons of different antibiotics. For the unambiguous and important outcome of perinatal death alone, we included trials in the review that were randomised but not placebo‐controlled. We excluded trials that used inappropriate methods of randomisation. We included trials where the method of randomisation was not specified in detail in the expectation that their inclusion in this review would encourage the authors to make available further information on the method of randomisation. We excluded trials where non‐randomised cohorts were amalgamated with randomised participants if the results of the randomised participants were not reported separately. We included trials in which post‐randomisation exclusions occurred, provided there was no evidence that these occurred preferentially in one or other arm of the trials. We excluded studies where outcomes for over 20% of participants were not reported.
Types of participants
Women with preterm (less than 37 weeks) rupture of the membranes.
Types of interventions
Comparison of:
-
any antibiotic versus placebo.
We planned to undertake subgroup comparisons for the primary outcome as follows:
-
all penicillins (excluding co‐amoxiclav) versus placebo;
-
beta lactam (including co‐amoxiclav) antibiotics versus placebo;
-
macrolide (including erythromycin) antibiotics versus placebo.
Additional comparisons:
-
beta lactam (including co‐amoxiclav) antibiotics versus macrolide antibiotics (including erythromycin);
-
all penicillins (except co‐amoxiclav) versus macrolide antibiotics (including erythromycin).
-
Antibiotic versus no antibiotic (including non‐placebo controlled trials) ‐ perinatal death only:
-
Subgroup comparison of non‐placebo controlled trials only.
-
-
Different treatment regimens of same antibiotic.
Types of outcome measures
Primary outcomes
-
Maternal death.
-
Serious maternal morbidity:
-
septicaemia;
-
need for intensive care;
-
organ failure, need for ventilation;
-
need for hysterectomy.
-
-
Perinatal death or death before discharge from hospital.
-
Perinatal morbidity:
-
neonatal infection including pneumonia;
-
necrotising enterocolitis;
-
oxygen treatment greater than 36 weeks' postconceptual age;
-
major cerebral abnormality on ultrasound prior to discharge.
-
Secondary outcomes
-
Major maternal adverse drug reaction.
-
Maternal infection after delivery prior to discharge.
-
Chorioamnionitis (infection of the womb).
-
Caesarean section.
-
Days from randomisation to birth.
-
Days from birth to discharge from hospital.
-
Birth within 48 hours.
-
Birth within seven days.
-
Birth before 37 weeks.
-
Birthweight.
-
Birthweight less than 2500 g.
-
Need for intensive care.
-
Days in neonatal intensive care unit.
-
Positive neonatal blood culture.
-
Respiratory distress syndrome.
-
Treatment with surfactant.
-
Days of ventilation.
-
Days of oxygen therapy.
-
Oxygen treatment greater than 28 days.
-
Neonatal encephalopathy.
-
Long‐term health outcomes (as defined by trial authors) after at least two years.
Search methods for identification of studies
Electronic searches
We searched the Cochrane Pregnancy and Childbirth Group’s Trials Register by contacting the Trials Search Co‐ordinator (30 September 2013).
The Cochrane Pregnancy and Childbirth Group’s Trials Register is maintained by the Trials Search Co‐ordinator and contains trials identified from:
-
monthly searches of the Cochrane Central Register of Controlled Trials (CENTRAL);
-
weekly searches of MEDLINE;
-
weekly searches of Embase;
-
handsearches of 30 journals and the proceedings of major conferences;
-
weekly current awareness alerts for a further 44 journals plus monthly BioMed Central email alerts.
Details of the search strategies for CENTRAL, MEDLINE and Embase, the list of handsearched journals and conference proceedings, and the list of journals reviewed via the current awareness service can be found in the ‘Specialized Register’ section within the editorial information about the Cochrane Pregnancy and Childbirth Group.
Trials identified through the searching activities described above are each assigned to a review topic (or topics). The Trials Search Co‐ordinator searches the register for each review using the topic list rather than keywords.
We did not apply any language restrictions.
Data collection and analysis
For the methods used when assessing the trials identified in a previous version of this review (Kenyon 2003), see Appendix 1.
For the previous update (Kenyon 2010), we used the following methods when assessing the reports identified by the updated search (Amon 1988b; Beazley 1998; Bergstrom 1991; Cardamakis 1990; Christmas 1990; Fuhr 2006; Gilbert 2005; Gordon 1974; Halis 2001; Hauth 1997; Hnat 2005; Kenyon 2008a; Kenyon 2008c; Kim 2008; Lockwood 1993b; Morales 1988; Ogasawara 1996; Ogasawara 1997; Ogasawara 1999; Owen 1993b; Sanchez‐Ramos 1990; Svare 1997b; Thurnau 1997). For this update, we would have used the following methods if we had identified new studies for inclusion.
Selection of studies
Two review authors (S Kenyon (SK) and M Boulvain (MB)) independently assessed for inclusion all the potential studies we identified as a result of the search strategy. We resolved any disagreement through discussion or, if required, we consulted the third review author (JP Neilson (JPN)).
Data extraction and management
We designed a form to extract data. For eligible studies, review authors SK and MB extracted the data using the agreed form. We resolved discrepancies through discussion or, if required, we consulted the third review author (JPN). We entered data into Review Manager software (RevMan 2011) and checked for accuracy.
When information regarding any of the above was unclear, we attempted to contact authors of the original reports asking them to provide further details.
Assessment of risk of bias in included studies
Two review authors (SK and MB) independently assessed risk of bias for each study using the criteria outlined in the Cochrane Handbook for Systematic Reviews of Interventions (Higgins 2011). We resolved any disagreement by discussion or by involving the third review author (JPN).
(1) Sequence generation (checking for possible selection bias)
We describe for each included study the method used to generate the allocation sequence in sufficient detail to allow an assessment of whether it should produce comparable groups.
We assessed the method as:
-
low risk of bias (any truly random process, e.g. random number table; computer random number generator);
-
high risk of bias (any non‐random process, e.g. odd or even date of birth; hospital or clinic record number);
-
unclear risk of bias.
(2) Allocation concealment (checking for possible selection bias)
We describe for each included study the method used to conceal the allocation sequence in sufficient detail and determine whether intervention allocation could have been foreseen in advance of, or during recruitment, or changed after assignment.
We assessed the methods as:
-
low risk of bias (e.g. telephone or central randomisation; consecutively numbered sealed opaque envelopes);
-
high risk of bias (open random allocation; unsealed or non‐opaque envelopes, alternation; date of birth);
-
unclear risk of bias.
(3) Blinding (checking for possible performance bias)
We describe for each included study the methods used, if any, to blind study participants and personnel from knowledge of which intervention a participant received. We judged studies at low risk of bias if they were blinded, or if we judge that the lack of blinding could not have affected the results. We assessed blinding separately for different outcomes or classes of outcomes.
We assessed the methods as:
-
low, high or unclear risk of bias for participants;
-
low, high or unclear risk of bias for personnel;
-
low, high or unclear risk of bias for outcome assessors.
(4) Incomplete outcome data (checking for possible attrition bias through withdrawals, dropouts, protocol deviations)
We describe for each included study, and for each outcome or class of outcomes, the completeness of data including attrition and exclusions from the analysis. We have stated whether attrition and exclusions were reported, the numbers included in the analysis at each stage (compared with the total randomised participants), reasons for attrition or exclusion where reported, and whether missing data were balanced across groups or were related to outcomes. We decided a cut‐off for exclusion of a study for the level of missing data at 20%. Where sufficient information has been reported, or can be supplied by the trial authors, we planned to re‐include missing data in the analyses which we undertake. We assessed methods as:
-
low risk of bias;
-
high risk of bias:
-
unclear risk of bias.
(5) Selective reporting bias
We describe for each included study how we investigated the possibility of selective outcome reporting bias and what we found.
We assessed the methods as:
-
low risk of bias (where it is clear that all of the study’s pre‐specified outcomes and all expected outcomes of interest to the review have been reported);
-
high risk of bias (where not all the study’s pre‐specified outcomes have been reported; one or more reported primary outcomes were not pre‐specified; outcomes of interest are reported incompletely and so cannot be used; study fails to include results of a key outcome that would have been expected to have been reported);
-
unclear risk of bias.
(6) Other sources of bias
We describe for each included study any important concerns we have about other possible sources of bias.
We assessed whether each study was free of other problems that could put it at risk of bias:
-
yes;
-
no;
-
unclear.
(7) Overall risk of bias
We made explicit judgements about whether studies are at high risk of bias, according to the criteria given in the Cochrane Handbook (Higgins 2011). With reference to (1) to (6) above, we assessed the likely magnitude and direction of the bias and whether we considered it is likely to impact on the findings (Figure 1). We considered this to be unlikely and, therefore, have not undertaken sensitivity analyses.

Methodological quality graph: review authors' judgements about each methodological quality item presented as percentages across all included studies.
Measures of treatment effect
Dichotomous data
For dichotomous data, we present results as summary risk ratio with 95% confidence intervals.
Continuous data
For continuous data, we use the mean difference if outcomes are measured in the same way between trials. We use the standardised mean difference to combine trials that measure the same outcome, but use different methods.
Unit of analysis issues
Cluster‐randomised trials
We would have included cluster‐randomised trials in the analyses along with individually‐randomised trials. Their sample sizes would have been adjusted using the methods described in the Cochrane Handbook (Higgins 2011) using an estimate of the intracluster correlation co‐efficient (ICC) derived from the trial (if possible), or from another source. If ICCs from other sources had been used, we would have reported this and conducted sensitivity analyses to investigate the effect of variation in the ICC. If we had identified both cluster‐randomised trials and individually‐randomised trials, we would have synthesised the relevant information. We would have considered it reasonable to combine the results from both if there was little heterogeneity among the study designs and the interaction between the effect of intervention and the choice of randomisation unit was considered to be unlikely.
We would have also acknowledged heterogeneity in the randomisation unit and performed a separate meta‐analysis.
Cross‐over trials
If we had identified any cross‐over trials on this topic, and deemed such trials eligible for inclusion, we would have included them in the analyses with parallel group trials, using methods described by Elbourne 2002.
Multi‐arm studies
For the subgroup comparisons undertaken, to avoid double counting, we divided out data from the shared group approximately evenly among the comparisons as described in theCochrane Handbook (Higgins 2011).
Dealing with missing data
For included studies, we noted levels of attrition. We planned to explore the impact of including studies with high levels of missing data in the overall assessment of treatment effect by using sensitivity analysis.
For all outcomes we have carried out analyses, as far as possible, on an intention‐to‐treat basis, i.e. we attempted to include all participants randomised to each group in the analyses. The denominator for each outcome in each trial was the number randomised minus any participants whose outcomes are known to be missing.
Assessment of heterogeneity
We used the I² and Tau² statistic to measure heterogeneity among the trials in each analysis. We performed subgroup analysis to obtain meta‐analysis results for more clinically comparable studies, to reduce heterogeneity where it existed.
Assessment of reporting biases
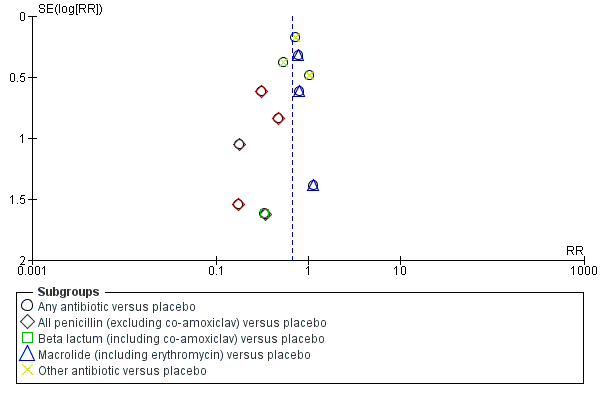
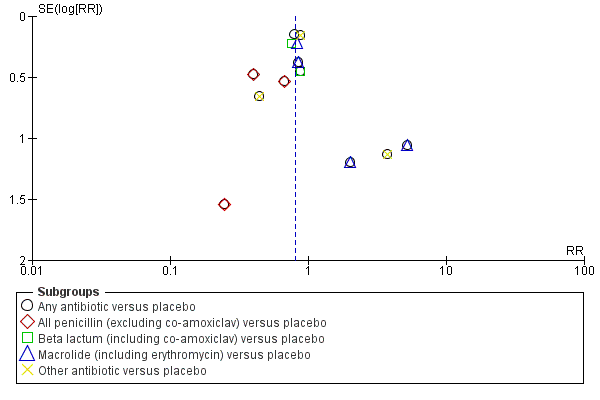
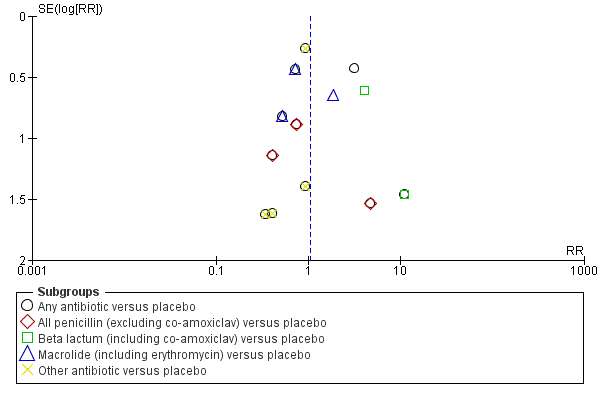
Where we suspected reporting bias (see ‘Selective reporting bias’ above), we attempted to contact study authors asking them to provide missing outcome data. Where this was not possible, and we thought the missing data likely to introduce serious bias, we planned to explore the impact of including such studies in the overall assessment of results by a sensitivity analysis. Funnel plots for primary outcomes only show no evidence of publication bias: Figure 2,Figure 3; Figure 4; Figure 5.

Funnel plot of comparison: 1 Any antibiotic versus placebo, outcome: 1.3 Perinatal death/death before discharge.
Funnel plot of comparison: 1 Any antibiotic versus placebo, outcome: 1.4 Neonatal infection including pneumonia.

Funnel plot of comparison: 1 Any antibiotic versus placebo, outcome: 1.5 Neonatal necrotising enterocolitis.
Funnel plot of comparison: 1 Any antibiotic versus placebo, outcome: 1.7 Major cerebral abnormality on ultrasound before discharge.
Data synthesis
We carried out statistical analysis using the Review Manager software (RevMan 2011). As we suspected clinical or methodological heterogeneity between studies sufficient to suggest that treatment effects may differ between trials, we used random‐effects meta‐analysis.
Subgroup analysis and investigation of heterogeneity
We conducted planned subgroup analyses classifying whole trials by interaction tests available in RevMan 2011.
Sensitivity analysis
We made explicit judgements about whether studies were at high risk of bias, according to the criteria given in the Cochrane Handbook (Higgins 2011). With reference to (1) to (6) above, we assessed the likely magnitude and direction of the bias and whether we considered it was likely to impact on the findings (Figure 1). We considered this to be unlikely and therefore, have not undertaken sensitivity analyses.
Results
Description of studies
The search identified 51 trials. We included 22 trials in the review, involving 6872 women and their babies, and excluded 29. Of the trials included, the majority were small with the exception of Kenyon 2001, which randomised 4826 women, and Mercer 1997, which randomised 614 women. Women were recruited between 20 and 37 weeks of gestation and inclusion criteria varied from clinicians definition of PROM to amniocentesis being carried out as part of an infection screen (Mercer 1992). The majority of women were not in active labour. Ten trials tested broad spectrum penicillins either alone or in combination (Cox 1995; Ernest 1994; Fuhr 2006; Grable 1996; Johnston 1990; Kenyon 2001; Kurki 1992; Lockwood 1993a; Mercer 1997; Svare 1997a). Five trials tested macrolide antibiotics (erythromycin) either alone or in combination (Garcia‐Burguillo 1995; Kenyon 2001; McGregor 1991; Mercer 1992; Mercer 1997) and one tested clindamycin and gentamycin (Ovalle‐Salas 1997). The duration of treatment varied between two doses (Kurki 1992) and 10 days (Kenyon 2001) with five trials opting for a maximum of seven days of treatment (Fuhr 2006; McGregor 1991; Mercer 1997; Ovalle‐Salas 1997; Svare 1997a). Four trials treated women until delivery (Ernest 1994; Garcia‐Burguillo 1995; Johnston 1990; Mercer 1992). In four of the trials, women were treated with oral antibiotic alone (Garcia‐Burguillo 1995; Kenyon 2001; McGregor 1991; Mercer 1992). In three of the trials, women were treated with intravenous antibiotic alone (Fuhr 2006; Kurki 1992; Lockwood 1993a). In six of the trials, women were treated with a combination of intravenous and oral antibiotics (Cox 1995; Ernest 1994; Johnston 1990; Mercer 1997; Ovalle‐Salas 1997; Svare 1997a).
The six non‐placebo controlled but randomised studies, which contributed data to the outcome measure perinatal death alone, were: Amon 1988a; Camli 1997; Christmas 1992; Magwali 1999; Morales 1989; Owen 1993a.
Two trials compared three versus five days of ampicillin (Lewis 2003; Segel 2003).
Outcomes were divided into primary and secondary. Primary outcomes, as listed above, were chosen based on importance and ability to predict longer term neonatal morbidity. Additional outcome measures chosen included maternal infection, prolongation of pregnancy and measures of neonatal mortality and morbidity. One study had undertaken follow‐up past discharge from hospital (Kurki 1992) but the results are not reported by treatment group but rather by duration of membrane rupture. One study has undertaken long‐term follow‐up at seven years of age in the UK (Kenyon 2001). The study evaluated functional impairment, behaviour, respiratory symptoms, hospital admissions, convulsions and other specific medical conditions. These are the only data on long‐term follow‐up from any of the included trials. Seven‐year assessment was not specifically a prespecified outcome, but is captured under the outcome of long‐term health after at least two years.
For details of included and excluded studies, seeCharacteristics of included studies and Characteristics of excluded studies.
Risk of bias in included studies
The method of randomisation was described in all trials with the exception of Amon 1988a, Camli 1997, Cox 1995, Kurki 1992, Fuhr 2006, Magwali 1999, Morales 1989 and Ovalle‐Salas 1997. All trials had matched placebos and were blinded apart from the six non‐placebo controlled studies described above. No detail on losses to follow‐up or exclusions were available from two trials (Cox 1995; Johnston 1990). The protocols were only available for one study (Kenyon 2001) to allow assessment of selective reporting. Lack of information that would allow fuller assessment may reflect changes in reporting of trials.
Effects of interventions
We included 22 trials involving 6872 women and their babies.
We adopted a random‐effects model, as we expected heterogeneity due to variability in participant characteristics, different antibiotics, year of the study and different countries etc.
Any antibiotic versus placebo
We included 16 trials in this comparison, which randomised more than 6300 women and their babies.
Primary Outcomes
No maternal deaths occurred in the three trials reporting this outcome, and there were no data reported on serious maternal morbidity.
There was no significant difference between groups in perinatal death (risk ratio (RR) 0.93, 95% confidence interval (CI) 0.76 to 1.14, 12 trials, data for 6301 babies). Neonatal infection (RR 0.67, 95% CI 0.52 to 0.85) (12 trials/1680 babies) was statistically significantly reduced in the babies whose mothers received antibiotics. Only one trial (Kenyon 2001) assessed the use of surfactant and it found a statistically significant reduction (RR 0.83, 95% CI 0.72 to 0.96) (one trial/4809 babies) as was the numbers of babies requiring oxygen therapy overall (RR 0.88, 95% CI 0.81 to 0.96) (one trial/4809 babies). There were no clear differences between groups for other neonatal outcomes including neonatal respiratory distress syndrome (RR 0.95, 95% CI 0.83 to 1.09), necrotising enterocolitis (RR 1.09, 95% CI 0.65 to 1.83), and the number of babies requiring ventilation (RR 0.90, 95% CI 0.80 to 1.02). There was a significant reduction in the number of babies with an abnormal cerebral ultrasound scan prior to discharge from hospital (RR 0.81, 95% CI 0.68 to 0.98; Tau² = 0.00, I² = 0%) (12 trials/6289 babies).
Secondary Outcomes
Thre was no evidence of any difference between groups for birth before 37 weeks' gestation and there were no reports of major adverse drug reactions. The use of antibiotics following preterm rupture of membranes (PROM) was associated with a statistically significant reduction in chorioamnionitis (RR 0.66, 95% CI 0.46 to 0.96; Tau² = 0.14, I² = 45%) (11 trials/1559 women). The rate of caesarean section was similar in the two groups (RR 0.96, 95% CI 0.88 to 1.05). The mean maternal length of hospital stay and the interval between randomisation and the birth were not reported in any of the trials included in this comparison.
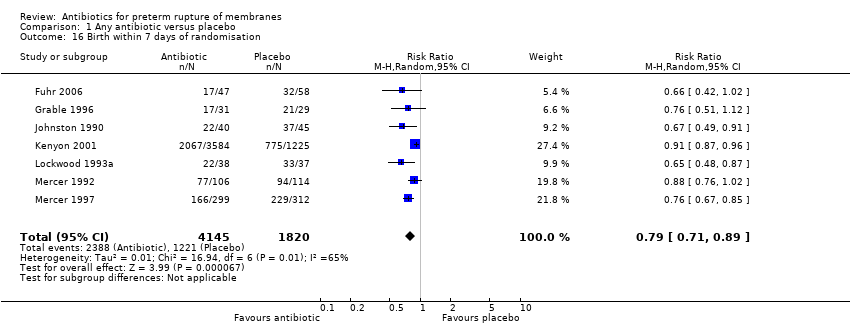
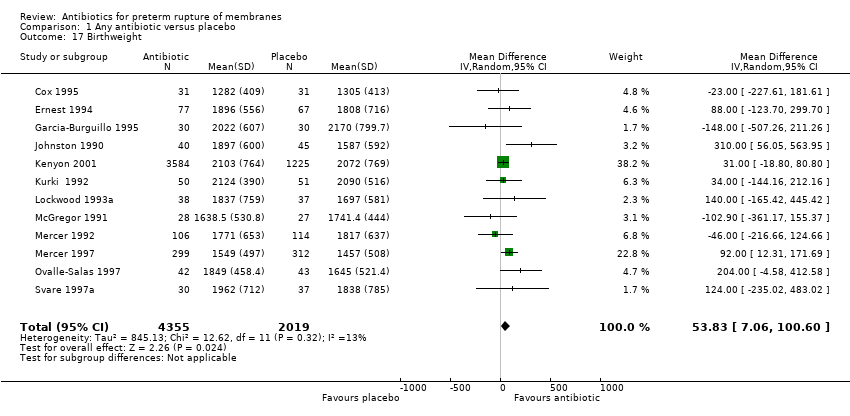
There was a significant reduction in the numbers of babies born within 48 hours (RR 0.71, 95% CI 0.58 to 0.87; Tau² = 0.03, I² = 50%) (seven trials/5927 babies) and seven days (RR 0.79, 95% CI 0.71 to 0.89; Tau² = 0.01, I² = 65%) (seven trials/5965 babies) of randomisation. The babies in the treatment groups spent 5.05 days less in neonatal intensive care (mean difference (MD) ‐5.05, 95% CI ‐9.77 to ‐0.33) (three trials/225 babies) and their birthweight was greater by 54 g (MD 53.83, 95% CI 7.06 to 100.60) (12 trials/6374 babies).
Long‐term follow‐up at seven years of age has been completed by one study (ORACLE ‐ Kenyon 2008a) and showed that antibiotics seemed to have little effect on the health of the children (RR 1.01, 95% CI 0.91 to 1.12) (one trial/3171 children).
Subgroup comparisons
These were undertaken for the primary outcomes only and show no evidence of differences in treatment effects between the subgroups, with the exception of necrotising enterocolitis, where there is a strong suggestion that this is increased with beta lactum antibiotics (including co‐amoxiclav) (RR 4.72, 95% CI 1.57 to 14.23).
Additional comparisons
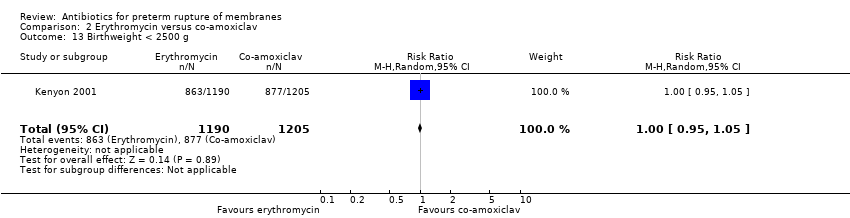
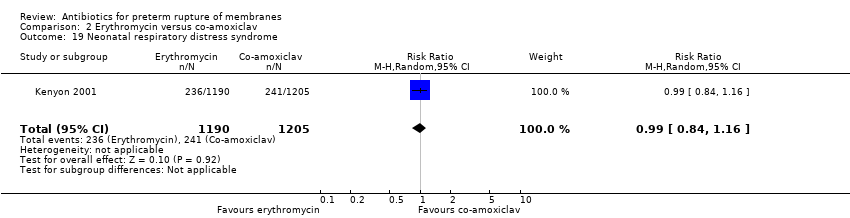
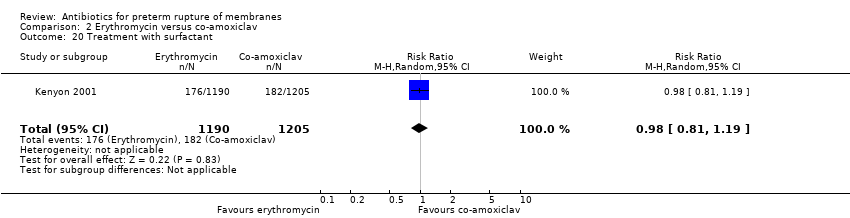
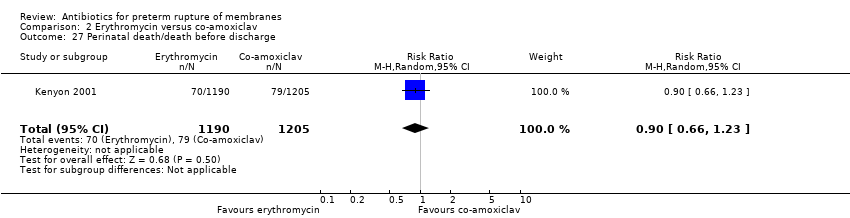
Erythromycin versus co‐amoxiclav
We included one trial (Kenyon 2001), involving 2415 women that focused on this comparison. Delivery within 48 hours was less common after co‐amoxiclav (RR 1.14, 95% CI 1.02 to 1.28) but the difference was not statistically significant at seven days (RR 1.06, 95% CI 0.99 to 1.13). There was no significant difference in any index of neonatal morbidity except for necrotising enterocolitis, which was statistically significantly less frequent after erythromycin (RR 0.46, 95% CI 0.23 to 0.94). Long‐term follow‐up has been completed by one study (Kenyon 2001) and showed little effect on the health of children (RR 0.89, 95% CI 0.79 to 1.01) (one trial/1612 children).
Perinatal mortality alone
No statistically significant reduction in perinatal mortality prior to discharge from hospital could be found when additional data were included from the six studies that were randomised but not placebo controlled (RR 0.89, 95% CI 0.74 to 1.08) (18 trials/6872 babies). Subgroup comparison of this group alone also shows no statistical difference.
Differing regimens
Two trials (Lewis 2003; Segel 2003) compared three versus seven‐day regimens of ampicillin treatment (130 women). From the limited available outcome data, there was no obvious disadvantage to the three‐day regimen.
Discussion
This review shows that routine antibiotic administration to women with PROM reduces some markers of maternal and neonatal morbidity. This does not translate into a statistically significant reduction in perinatal mortality. Most trials, however, report fewer deaths in the treatment group and the summary result shows a trend towards a beneficial effect. We included all randomised trials in the evaluation of perinatal death as this outcome is unlikely to be influenced by knowledge of the treatment allocation. Such a reduction in major markers of maternal and neonatal morbidity when antibiotics are administered makes a reduction in death possible, even if the result was statistically non‐significant from pooling of available data.
By far the largest trial included is the UK MRC ORACLE (Kenyon 2001), which randomised 4826 women. The significant increase in neonatal necrotising enterocolitis found in the co‐amoxiclav arm of this trial is plausible since co‐amoxiclav is known to select for Enterobacter, Citrobacter and Pseudomonas (Hoy 2001). One suggested mechanism of pathogenesis of neonatal necrotising enterocolitis is abnormal microbial colonisation of the intestinal tract by one or several species unhindered by competitors. Co‐amoxiclav, because of its large spectrum may influence such colonisation. Furthermore, the immature gut is sensitive to bacterial toxins, resulting in mucosal damage and the initiation of necrotising enterocolitis.
Particularly in the light of the UK MRC ORACLE's finding of reduced abnormal cerebral ultrasound scans before discharge from hospital, it is important that long‐term follow‐up is undertaken. The UK MRC ORACLE Children Study followed up children, who were born to women with PROM randomised within the UK to the MRC ORACLE trial, at seven years of age and found no evidence of either benefit or harm. This same study also assessed long‐term outcomes in children born to women with spontaneous preterm labour (SPL) and intact membranes randomised to the original ORACLE trial (Kenyon 2008b) and found evidence of harm. The prescription of erythromycin (with or without co‐amoxiclav) was associated with a statistically significant increase in the proportions of children with any level of functional impairment from 38% to 42%. Similarly, there was a statistically significant increase in the proportions of children with cerebral palsy from 1.7% to 3.3% associated with erythromycin and from 1.9% to 3.2% with co‐amoxiclav. There was a suggestion that more children who developed cerebral palsy had been born to mothers who had received both antibiotics. In the light of these findings, it is important to be certain about the diagnosis of ruptured membranes before prescribing antibiotics.
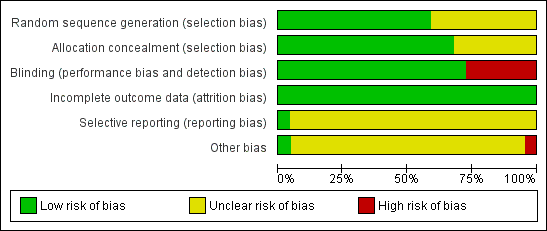
Methodological quality graph: review authors' judgements about each methodological quality item presented as percentages across all included studies.

Funnel plot of comparison: 1 Any antibiotic versus placebo, outcome: 1.3 Perinatal death/death before discharge.

Funnel plot of comparison: 1 Any antibiotic versus placebo, outcome: 1.4 Neonatal infection including pneumonia.
Funnel plot of comparison: 1 Any antibiotic versus placebo, outcome: 1.5 Neonatal necrotising enterocolitis.

Funnel plot of comparison: 1 Any antibiotic versus placebo, outcome: 1.7 Major cerebral abnormality on ultrasound before discharge.

Comparison 1 Any antibiotic versus placebo, Outcome 1 Maternal death.

Comparison 1 Any antibiotic versus placebo, Outcome 3 Perinatal death/death before discharge.

Comparison 1 Any antibiotic versus placebo, Outcome 4 Neonatal infection including pneumonia.

Comparison 1 Any antibiotic versus placebo, Outcome 5 Neonatal necrotising enterocolitis.

Comparison 1 Any antibiotic versus placebo, Outcome 6 Oxygen treatment > 36 weeks' postconceptual age.

Comparison 1 Any antibiotic versus placebo, Outcome 7 Major cerebral abnormality on ultrasound before discharge.

Comparison 1 Any antibiotic versus placebo, Outcome 8 Birth before 37 weeks' gestation.
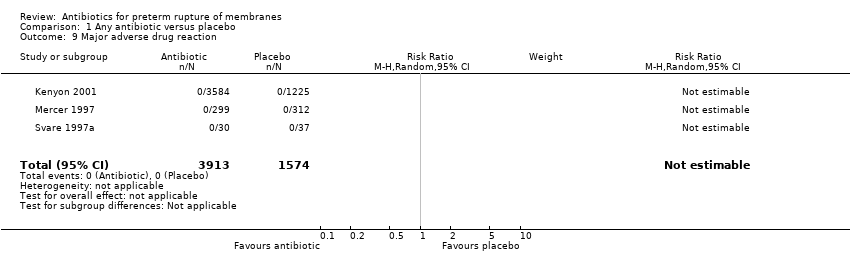
Comparison 1 Any antibiotic versus placebo, Outcome 9 Major adverse drug reaction.

Comparison 1 Any antibiotic versus placebo, Outcome 10 Maternal infection after delivery prior to discharge.

Comparison 1 Any antibiotic versus placebo, Outcome 11 Chorioamnionitis.

Comparison 1 Any antibiotic versus placebo, Outcome 12 Caesarean section.

Comparison 1 Any antibiotic versus placebo, Outcome 15 Birth within 48 hours of randomisation.
Comparison 1 Any antibiotic versus placebo, Outcome 16 Birth within 7 days of randomisation.
Comparison 1 Any antibiotic versus placebo, Outcome 17 Birthweight.

Comparison 1 Any antibiotic versus placebo, Outcome 18 Birthweight < 2500 g.

Comparison 1 Any antibiotic versus placebo, Outcome 19 Neonatal intensive care.

Comparison 1 Any antibiotic versus placebo, Outcome 20 Days in neonatal intensive care unit.
Comparison 1 Any antibiotic versus placebo, Outcome 21 Positive neonatal blood culture.

Comparison 1 Any antibiotic versus placebo, Outcome 22 Neonatal respiratory distress syndrome.

Comparison 1 Any antibiotic versus placebo, Outcome 23 Treatment with surfactant.
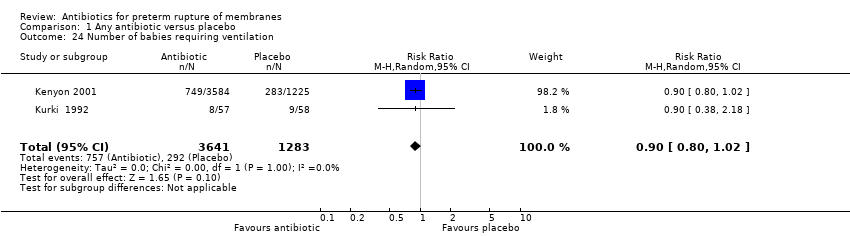
Comparison 1 Any antibiotic versus placebo, Outcome 24 Number of babies requiring ventilation.

Comparison 1 Any antibiotic versus placebo, Outcome 25 Number of babies requiring oxygen therapy.

Comparison 1 Any antibiotic versus placebo, Outcome 26 Neonatal oxygenation > 28 days.
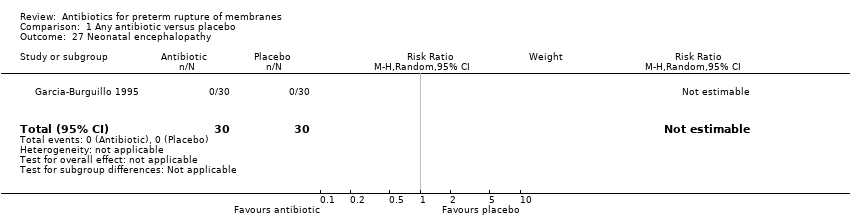
Comparison 1 Any antibiotic versus placebo, Outcome 27 Neonatal encephalopathy.

Comparison 1 Any antibiotic versus placebo, Outcome 28 Serious childhood disability at 7 years.

Comparison 2 Erythromycin versus co‐amoxiclav, Outcome 3 Major adverse drug reaction.

Comparison 2 Erythromycin versus co‐amoxiclav, Outcome 4 Maternal infection after delivery prior to discharge.

Comparison 2 Erythromycin versus co‐amoxiclav, Outcome 6 Caesarean section.
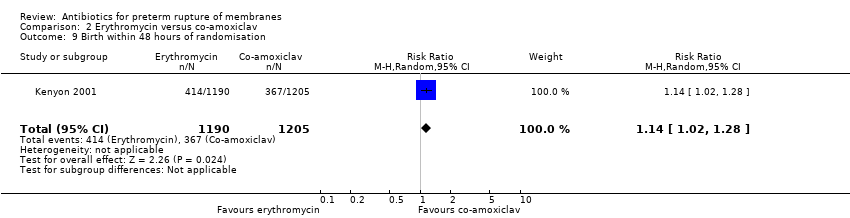
Comparison 2 Erythromycin versus co‐amoxiclav, Outcome 9 Birth within 48 hours of randomisation.

Comparison 2 Erythromycin versus co‐amoxiclav, Outcome 10 Birth within 7 days of randomisation.
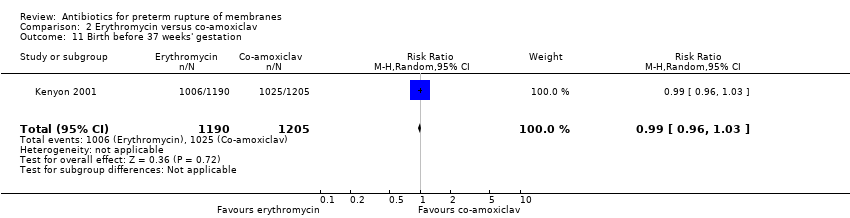
Comparison 2 Erythromycin versus co‐amoxiclav, Outcome 11 Birth before 37 weeks' gestation.

Comparison 2 Erythromycin versus co‐amoxiclav, Outcome 12 Birthweight.
Comparison 2 Erythromycin versus co‐amoxiclav, Outcome 13 Birthweight < 2500 g.

Comparison 2 Erythromycin versus co‐amoxiclav, Outcome 14 Neonatal intensive care.

Comparison 2 Erythromycin versus co‐amoxiclav, Outcome 17 Positive neonatal blood culture.

Comparison 2 Erythromycin versus co‐amoxiclav, Outcome 18 Neonatal necrotising enterocolitis.
Comparison 2 Erythromycin versus co‐amoxiclav, Outcome 19 Neonatal respiratory distress syndrome.
Comparison 2 Erythromycin versus co‐amoxiclav, Outcome 20 Treatment with surfactant.

Comparison 2 Erythromycin versus co‐amoxiclav, Outcome 21 Number of babies requiring ventilation.

Comparison 2 Erythromycin versus co‐amoxiclav, Outcome 22 Number of babies requiring oxygen therapy.

Comparison 2 Erythromycin versus co‐amoxiclav, Outcome 23 Neonatal oxygenation > 28 days.

Comparison 2 Erythromycin versus co‐amoxiclav, Outcome 24 Oxygen treatment > 36 weeks' postconceptual age.

Comparison 2 Erythromycin versus co‐amoxiclav, Outcome 26 Major cerebral abnormality on ultrasound before discharge.
Comparison 2 Erythromycin versus co‐amoxiclav, Outcome 27 Perinatal death/death before discharge.

Comparison 2 Erythromycin versus co‐amoxiclav, Outcome 28 Serious childhood disability at 7 years.

Comparison 4 Antibiotics versus no antibiotic, Outcome 1 Perinatal death/death before discharge.
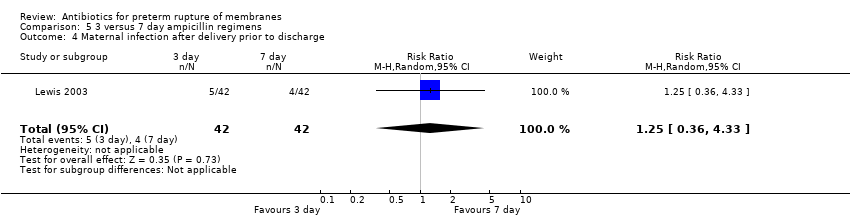
Comparison 5 3 versus 7 day ampicillin regimens, Outcome 4 Maternal infection after delivery prior to discharge.
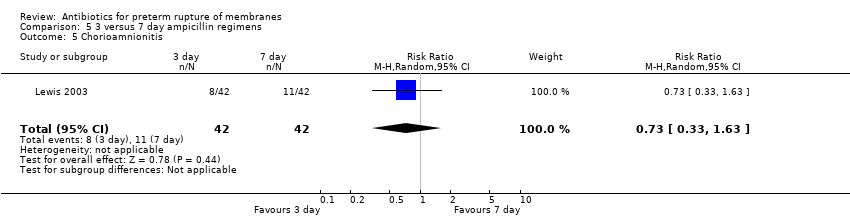
Comparison 5 3 versus 7 day ampicillin regimens, Outcome 5 Chorioamnionitis.
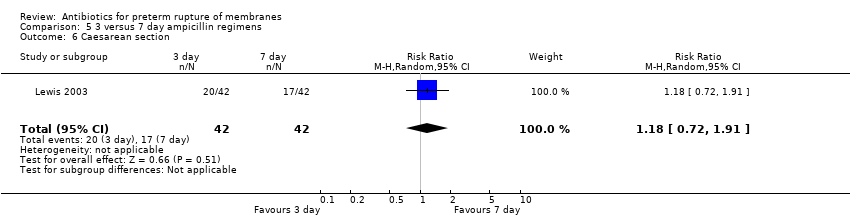
Comparison 5 3 versus 7 day ampicillin regimens, Outcome 6 Caesarean section.

Comparison 5 3 versus 7 day ampicillin regimens, Outcome 9 Birth within 48 hours of randomisation.

Comparison 5 3 versus 7 day ampicillin regimens, Outcome 10 Birth within 7 days of randomisation.

Comparison 5 3 versus 7 day ampicillin regimens, Outcome 14 Neonatal intensive care.
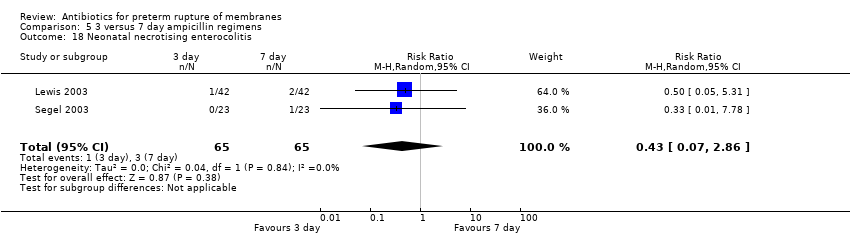
Comparison 5 3 versus 7 day ampicillin regimens, Outcome 18 Neonatal necrotising enterocolitis.

Comparison 5 3 versus 7 day ampicillin regimens, Outcome 19 Neonatal respiratory distress syndrome.

Comparison 5 3 versus 7 day ampicillin regimens, Outcome 26 Neonatal intraventricular haemorrhage.

Comparison 5 3 versus 7 day ampicillin regimens, Outcome 27 Perinatal death/death before discharge.
| Outcome or subgroup title | No. of studies | No. of participants | Statistical method | Effect size |
| 1 Maternal death Show forest plot | 3 | Risk Ratio (M‐H, Random, 95% CI) | Subtotals only | |
| 1.1 Any antibiotic versus placebo | 3 | 763 | Risk Ratio (M‐H, Random, 95% CI) | 0.0 [0.0, 0.0] |
| 1.2 All penicillin (excluding co‐amoxiclav) versus placebo | 1 | 85 | Risk Ratio (M‐H, Random, 95% CI) | 0.0 [0.0, 0.0] |
| 1.3 Beta lactum (including co‐amoxiclav) versus placebo | 0 | 0 | Risk Ratio (M‐H, Random, 95% CI) | 0.0 [0.0, 0.0] |
| 1.4 Macrolide (including erythromycin) versus placebo | 0 | 0 | Risk Ratio (M‐H, Random, 95% CI) | 0.0 [0.0, 0.0] |
| 1.5 Other antibiotic versus placebo | 2 | 678 | Risk Ratio (M‐H, Random, 95% CI) | 0.0 [0.0, 0.0] |
| 2 Serious maternal morbidity | 0 | Risk Ratio (M‐H, Random, 95% CI) | Subtotals only | |
| 2.1 Any antibiotic versus placebo | 0 | 0 | Risk Ratio (M‐H, Random, 95% CI) | 0.0 [0.0, 0.0] |
| 2.2 All penicillin (excluding co‐amoxiclav) versus placebo | 0 | 0 | Risk Ratio (M‐H, Random, 95% CI) | 0.0 [0.0, 0.0] |
| 2.3 Beta lactum (including co‐amoxiclav) versus placebo | 0 | 0 | Risk Ratio (M‐H, Random, 95% CI) | 0.0 [0.0, 0.0] |
| 2.4 Macrolide (including erythromycin) versus placebo | 0 | 0 | Risk Ratio (M‐H, Random, 95% CI) | 0.0 [0.0, 0.0] |
| 2.5 Other antibiotic versus placebo | 0 | 0 | Risk Ratio (M‐H, Random, 95% CI) | 0.0 [0.0, 0.0] |
| 3 Perinatal death/death before discharge Show forest plot | 12 | Risk Ratio (M‐H, Random, 95% CI) | Subtotals only | |
| 3.1 Any antibiotic versus placebo | 12 | 6301 | Risk Ratio (M‐H, Random, 95% CI) | 0.93 [0.76, 1.14] |
| 3.2 All penicillin (excluding co‐amoxiclav) versus placebo | 4 | 332 | Risk Ratio (M‐H, Random, 95% CI) | 0.78 [0.31, 1.97] |
| 3.3 Beta lactum (including co‐amoxiclav) versus placebo | 2 | 1880 | Risk Ratio (M‐H, Random, 95% CI) | 0.62 [0.15, 2.56] |
| 3.4 Macrolide (including erythromycin) versus placebo | 4 | 2138 | Risk Ratio (M‐H, Random, 95% CI) | 0.83 [0.43, 1.60] |
| 3.5 Other antibiotic versus placebo | 3 | 762 | Risk Ratio (M‐H, Random, 95% CI) | 1.13 [0.68, 1.88] |
| 4 Neonatal infection including pneumonia Show forest plot | 12 | Risk Ratio (M‐H, Random, 95% CI) | Subtotals only | |
| 4.1 Any antibiotic versus placebo | 12 | 1680 | Risk Ratio (M‐H, Random, 95% CI) | 0.67 [0.52, 0.85] |
| 4.2 All penicillin (excluding co‐amoxiclav) versus placebo | 5 | 521 | Risk Ratio (M‐H, Random, 95% CI) | 0.30 [0.13, 0.68] |
| 4.3 Beta lactum (including co‐amoxiclav) versus placebo | 1 | 62 | Risk Ratio (M‐H, Random, 95% CI) | 0.33 [0.01, 7.88] |
| 4.4 Macrolide (including erythromycin) versus placebo | 3 | 334 | Risk Ratio (M‐H, Random, 95% CI) | 0.79 [0.45, 1.37] |
| 4.5 Other antibiotic versus placebo | 3 | 763 | Risk Ratio (M‐H, Random, 95% CI) | 0.71 [0.53, 0.95] |
| 5 Neonatal necrotising enterocolitis Show forest plot | 11 | Risk Ratio (M‐H, Random, 95% CI) | Subtotals only | |
| 5.1 Any antibiotic versus placebo | 11 | 6229 | Risk Ratio (M‐H, Random, 95% CI) | 1.09 [0.65, 1.83] |
| 5.2 All penicillin (excluding co‐amoxiclav) versus placebo | 3 | 262 | Risk Ratio (M‐H, Random, 95% CI) | 0.85 [0.25, 2.97] |
| 5.3 Beta lactum (including co‐amoxiclav) versus placebo | 2 | 1880 | Risk Ratio (M‐H, Random, 95% CI) | 4.72 [1.57, 14.23] |
| 5.4 Macrolide (including erythromycin) versus placebo | 3 | 2076 | Risk Ratio (M‐H, Random, 95% CI) | 0.88 [0.45, 1.69] |
| 5.5 Other antibiotic versus placebo | 4 | 823 | Risk Ratio (M‐H, Random, 95% CI) | 0.89 [0.54, 1.47] |
| 6 Oxygen treatment > 36 weeks' postconceptual age Show forest plot | 1 | Risk Ratio (M‐H, Random, 95% CI) | Subtotals only | |
| 6.1 Any antibiotic versus placebo | 1 | 4809 | Risk Ratio (M‐H, Random, 95% CI) | 0.91 [0.70, 1.17] |
| 6.2 All penicillin (excluding co‐amoxiclav) versus placebo | 0 | 0 | Risk Ratio (M‐H, Random, 95% CI) | 0.0 [0.0, 0.0] |
| 6.3 Beta lactum (including co‐amoxiclav) versus placebo | 1 | 1818 | Risk Ratio (M‐H, Random, 95% CI) | 0.92 [0.63, 1.36] |
| 6.4 Macrolide (including erythromycin) versus placebo | 1 | 1803 | Risk Ratio (M‐H, Random, 95% CI) | 0.89 [0.61, 1.32] |
| 6.5 Other antibiotic versus placebo | 0 | 0 | Risk Ratio (M‐H, Random, 95% CI) | 0.0 [0.0, 0.0] |
| 7 Major cerebral abnormality on ultrasound before discharge Show forest plot | 12 | Risk Ratio (M‐H, Random, 95% CI) | Subtotals only | |
| 7.1 Any antibiotic versus placebo | 12 | 6289 | Risk Ratio (M‐H, Random, 95% CI) | 0.81 [0.68, 0.98] |
| 7.2 All penicillin (excluding co‐amoxiclav) versus placebo | 3 | 262 | Risk Ratio (M‐H, Random, 95% CI) | 0.49 [0.25, 0.96] |
| 7.3 Beta lactum (including co‐amoxiclav) versus placebo | 2 | 1880 | Risk Ratio (M‐H, Random, 95% CI) | 0.78 [0.52, 1.16] |
| 7.4 Macrolide (including erythromycin) versus placebo | 4 | 2136 | Risk Ratio (M‐H, Random, 95% CI) | 0.93 [0.60, 1.44] |
| 7.5 Other antibiotic versus placebo | 4 | 823 | Risk Ratio (M‐H, Random, 95% CI) | 0.85 [0.45, 1.64] |
| 8 Birth before 37 weeks' gestation Show forest plot | 3 | 4931 | Risk Ratio (M‐H, Random, 95% CI) | 1.00 [0.98, 1.03] |
| 9 Major adverse drug reaction Show forest plot | 3 | 5487 | Risk Ratio (M‐H, Random, 95% CI) | 0.0 [0.0, 0.0] |
| 10 Maternal infection after delivery prior to discharge Show forest plot | 4 | 5547 | Risk Ratio (M‐H, Random, 95% CI) | 0.91 [0.80, 1.02] |
| 11 Chorioamnionitis Show forest plot | 11 | 1559 | Risk Ratio (M‐H, Random, 95% CI) | 0.66 [0.46, 0.96] |
| 12 Caesarean section Show forest plot | 11 | 6317 | Risk Ratio (M‐H, Random, 95% CI) | 0.96 [0.88, 1.05] |
| 13 Days from birth till discharge of mother | 0 | 0 | Mean Difference (IV, Random, 95% CI) | 0.0 [0.0, 0.0] |
| 14 Days from randomisation to birth | 0 | 0 | Mean Difference (IV, Random, 95% CI) | 0.0 [0.0, 0.0] |
| 15 Birth within 48 hours of randomisation Show forest plot | 7 | 5927 | Risk Ratio (M‐H, Random, 95% CI) | 0.71 [0.58, 0.87] |
| 16 Birth within 7 days of randomisation Show forest plot | 7 | 5965 | Risk Ratio (M‐H, Random, 95% CI) | 0.79 [0.71, 0.89] |
| 17 Birthweight Show forest plot | 12 | 6374 | Mean Difference (IV, Random, 95% CI) | 53.83 [7.06, 100.60] |
| 18 Birthweight < 2500 g Show forest plot | 2 | 4876 | Risk Ratio (M‐H, Random, 95% CI) | 1.00 [0.96, 1.04] |
| 19 Neonatal intensive care Show forest plot | 4 | 5023 | Risk Ratio (M‐H, Random, 95% CI) | 0.98 [0.84, 1.13] |
| 20 Days in neonatal intensive care unit Show forest plot | 3 | 225 | Mean Difference (IV, Random, 95% CI) | ‐5.05 [‐9.77, ‐0.33] |
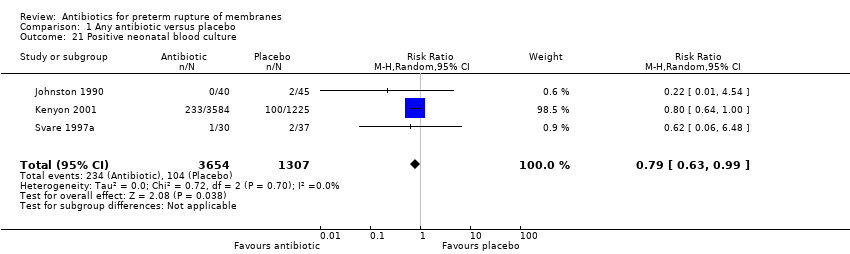
| 21 Positive neonatal blood culture Show forest plot | 3 | 4961 | Risk Ratio (M‐H, Random, 95% CI) | 0.79 [0.63, 0.99] |
| 22 Neonatal respiratory distress syndrome Show forest plot | 12 | 6287 | Risk Ratio (M‐H, Random, 95% CI) | 0.95 [0.83, 1.09] |
| 23 Treatment with surfactant Show forest plot | 1 | 4809 | Risk Ratio (M‐H, Random, 95% CI) | 0.83 [0.72, 0.96] |
| 24 Number of babies requiring ventilation Show forest plot | 2 | 4924 | Risk Ratio (M‐H, Random, 95% CI) | 0.90 [0.80, 1.02] |
| 25 Number of babies requiring oxygen therapy Show forest plot | 1 | 4809 | Risk Ratio (M‐H, Random, 95% CI) | 0.88 [0.81, 0.96] |
| 26 Neonatal oxygenation > 28 days Show forest plot | 3 | 5487 | Risk Ratio (M‐H, Random, 95% CI) | 0.79 [0.61, 1.03] |
| 27 Neonatal encephalopathy Show forest plot | 1 | 60 | Risk Ratio (M‐H, Random, 95% CI) | 0.0 [0.0, 0.0] |
| 28 Serious childhood disability at 7 years Show forest plot | 1 | 3171 | Risk Ratio (M‐H, Random, 95% CI) | 1.01 [0.91, 1.12] |
| Outcome or subgroup title | No. of studies | No. of participants | Statistical method | Effect size |
| 1 Maternal death | 0 | 0 | Risk Ratio (M‐H, Random, 95% CI) | 0.0 [0.0, 0.0] |
| 2 Serious maternal morbidity | 0 | 0 | Risk Ratio (M‐H, Random, 95% CI) | 0.0 [0.0, 0.0] |
| 3 Major adverse drug reaction Show forest plot | 1 | 2395 | Risk Ratio (M‐H, Random, 95% CI) | 0.0 [0.0, 0.0] |
| 4 Maternal infection after delivery prior to discharge Show forest plot | 1 | 2395 | Risk Ratio (M‐H, Random, 95% CI) | 1.02 [0.87, 1.20] |
| 5 Chorioamnionitis | 0 | 0 | Risk Ratio (M‐H, Random, 95% CI) | 0.0 [0.0, 0.0] |
| 6 Caesarean section Show forest plot | 1 | 2395 | Risk Ratio (M‐H, Random, 95% CI) | 1.02 [0.90, 1.16] |
| 7 Days from randomisation to birth | 0 | 0 | Mean Difference (IV, Random, 95% CI) | 0.0 [0.0, 0.0] |
| 8 Days from birth till discharge of mother | 0 | 0 | Mean Difference (IV, Random, 95% CI) | 0.0 [0.0, 0.0] |
| 9 Birth within 48 hours of randomisation Show forest plot | 1 | 2395 | Risk Ratio (M‐H, Random, 95% CI) | 1.14 [1.02, 1.28] |
| 10 Birth within 7 days of randomisation Show forest plot | 1 | 2395 | Risk Ratio (M‐H, Random, 95% CI) | 1.06 [0.99, 1.13] |
| 11 Birth before 37 weeks' gestation Show forest plot | 1 | 2395 | Risk Ratio (M‐H, Random, 95% CI) | 0.99 [0.96, 1.03] |
| 12 Birthweight Show forest plot | 1 | 2395 | Mean Difference (IV, Random, 95% CI) | 19.0 [‐41.92, 79.92] |
| 13 Birthweight < 2500 g Show forest plot | 1 | 2395 | Risk Ratio (M‐H, Random, 95% CI) | 1.00 [0.95, 1.05] |
| 14 Neonatal intensive care Show forest plot | 1 | 2395 | Risk Ratio (M‐H, Random, 95% CI) | 1.00 [0.95, 1.05] |
| 15 Days in neonatal intensive care unit | 0 | 0 | Mean Difference (IV, Random, 95% CI) | 0.0 [0.0, 0.0] |
| 16 Neonatal infection including pneumonia | 0 | 0 | Risk Ratio (M‐H, Random, 95% CI) | 0.0 [0.0, 0.0] |
| 17 Positive neonatal blood culture Show forest plot | 1 | 2395 | Risk Ratio (M‐H, Random, 95% CI) | 0.84 [0.62, 1.15] |
| 18 Neonatal necrotising enterocolitis Show forest plot | 1 | 2395 | Risk Ratio (M‐H, Random, 95% CI) | 0.46 [0.23, 0.94] |
| 19 Neonatal respiratory distress syndrome Show forest plot | 1 | 2395 | Risk Ratio (M‐H, Random, 95% CI) | 0.99 [0.84, 1.16] |
| 20 Treatment with surfactant Show forest plot | 1 | 2395 | Risk Ratio (M‐H, Random, 95% CI) | 0.98 [0.81, 1.19] |
| 21 Number of babies requiring ventilation Show forest plot | 1 | 2395 | Risk Ratio (M‐H, Random, 95% CI) | 1.00 [0.86, 1.17] |
| 22 Number of babies requiring oxygen therapy Show forest plot | 1 | 2395 | Risk Ratio (M‐H, Random, 95% CI) | 0.98 [0.87, 1.10] |
| 23 Neonatal oxygenation > 28 days Show forest plot | 1 | 2395 | Risk Ratio (M‐H, Random, 95% CI) | 0.86 [0.66, 1.12] |
| 24 Oxygen treatment > 36 weeks' postconceptual age Show forest plot | 1 | 2395 | Risk Ratio (M‐H, Random, 95% CI) | 0.97 [0.70, 1.34] |
| 25 Neonatal encephalopathy | 0 | 0 | Risk Ratio (M‐H, Random, 95% CI) | 0.0 [0.0, 0.0] |
| 26 Major cerebral abnormality on ultrasound before discharge Show forest plot | 1 | 2395 | Risk Ratio (M‐H, Random, 95% CI) | 1.10 [0.74, 1.63] |
| 27 Perinatal death/death before discharge Show forest plot | 1 | 2395 | Risk Ratio (M‐H, Random, 95% CI) | 0.90 [0.66, 1.23] |
| 28 Serious childhood disability at 7 years Show forest plot | 1 | 1612 | Risk Ratio (M‐H, Random, 95% CI) | 0.89 [0.79, 1.01] |
| Outcome or subgroup title | No. of studies | No. of participants | Statistical method | Effect size |
| 1 Perinatal death/death before discharge Show forest plot | 18 | Risk Ratio (M‐H, Random, 95% CI) | Subtotals only | |
| 1.1 Antibiotics versus no antibiotics (all studies) | 18 | 6872 | Risk Ratio (M‐H, Random, 95% CI) | 0.89 [0.74, 1.08] |
| 1.2 Antibiotics versus no treatment (no placebo) | 6 | 571 | Risk Ratio (M‐H, Random, 95% CI) | 0.69 [0.41, 1.14] |
| Outcome or subgroup title | No. of studies | No. of participants | Statistical method | Effect size |
| 1 Maternal death | 0 | 0 | Risk Ratio (M‐H, Random, 95% CI) | 0.0 [0.0, 0.0] |
| 2 Serious maternal morbidity | 0 | 0 | Risk Ratio (M‐H, Random, 95% CI) | 0.0 [0.0, 0.0] |
| 3 Major adverse drug reaction | 0 | 0 | Risk Ratio (M‐H, Random, 95% CI) | 0.0 [0.0, 0.0] |
| 4 Maternal infection after delivery prior to discharge Show forest plot | 1 | 84 | Risk Ratio (M‐H, Random, 95% CI) | 1.25 [0.36, 4.33] |
| 5 Chorioamnionitis Show forest plot | 1 | 84 | Risk Ratio (M‐H, Random, 95% CI) | 0.73 [0.33, 1.63] |
| 6 Caesarean section Show forest plot | 1 | 84 | Risk Ratio (M‐H, Random, 95% CI) | 1.18 [0.72, 1.91] |
| 7 Days from randomisation to birth | 0 | 0 | Mean Difference (IV, Random, 95% CI) | 0.0 [0.0, 0.0] |
| 8 Days from birth till discharge of mother | 0 | 0 | Mean Difference (IV, Random, 95% CI) | 0.0 [0.0, 0.0] |
| 9 Birth within 48 hours of randomisation Show forest plot | 1 | 84 | Risk Ratio (M‐H, Random, 95% CI) | 1.14 [0.46, 2.87] |
| 10 Birth within 7 days of randomisation Show forest plot | 1 | 84 | Risk Ratio (M‐H, Random, 95% CI) | 1.0 [0.70, 1.42] |
| 11 Birth before 37 weeks' gestation | 0 | 0 | Risk Ratio (M‐H, Random, 95% CI) | 0.0 [0.0, 0.0] |
| 12 Birthweight | 0 | 0 | Mean Difference (IV, Random, 95% CI) | 0.0 [0.0, 0.0] |
| 13 Birthweight < 2500 g | 0 | 0 | Risk Ratio (M‐H, Random, 95% CI) | 0.0 [0.0, 0.0] |
| 14 Neonatal intensive care Show forest plot | 1 | 84 | Risk Ratio (M‐H, Random, 95% CI) | 1.0 [0.84, 1.19] |
| 15 Days in neonatal intensive care unit | 0 | 0 | Mean Difference (IV, Random, 95% CI) | 0.0 [0.0, 0.0] |
| 16 Neonatal infection including pneumonia | 0 | 0 | Risk Ratio (M‐H, Random, 95% CI) | 0.0 [0.0, 0.0] |
| 17 Positive neonatal blood culture | 0 | 0 | Risk Ratio (M‐H, Random, 95% CI) | 0.0 [0.0, 0.0] |
| 18 Neonatal necrotising enterocolitis Show forest plot | 2 | 130 | Risk Ratio (M‐H, Random, 95% CI) | 0.43 [0.07, 2.86] |
| 19 Neonatal respiratory distress syndrome Show forest plot | 2 | 130 | Risk Ratio (M‐H, Random, 95% CI) | 0.96 [0.62, 1.49] |
| 20 Treatment with surfactant | 0 | 0 | Risk Ratio (M‐H, Random, 95% CI) | 0.0 [0.0, 0.0] |
| 21 Number of babies requiring ventilation | 0 | 0 | Risk Ratio (M‐H, Random, 95% CI) | 0.0 [0.0, 0.0] |
| 22 Number of babies requiring oxygen therapy | 0 | 0 | Risk Ratio (M‐H, Random, 95% CI) | 0.0 [0.0, 0.0] |
| 23 Neonatal oxygenation > 28 days | 0 | 0 | Risk Ratio (M‐H, Random, 95% CI) | 0.0 [0.0, 0.0] |
| 24 Oxygen treatment > 36 weeks' postconceptual age | 0 | 0 | Risk Ratio (M‐H, Random, 95% CI) | 0.0 [0.0, 0.0] |
| 25 Neonatal encephalopathy | 0 | 0 | Risk Ratio (M‐H, Random, 95% CI) | 0.0 [0.0, 0.0] |
| 26 Neonatal intraventricular haemorrhage Show forest plot | 2 | 130 | Risk Ratio (M‐H, Random, 95% CI) | 0.33 [0.04, 3.12] |
| 27 Perinatal death/death before discharge Show forest plot | 2 | 130 | Risk Ratio (M‐H, Random, 95% CI) | 0.40 [0.05, 2.94] |
| 28 Serious childhood disability at 7 years | 0 | 0 | Risk Ratio (M‐H, Random, 95% CI) | 0.0 [0.0, 0.0] |