| 1 Continued smoking in late pregnancy Show forest plot | 65 | 21258 | Risk Ratio (M‐H, Random, 95% CI) | 0.94 [0.93, 0.96] |
|
| 1.1 Individually randomised trials | 56 | 15915 | Risk Ratio (M‐H, Random, 95% CI) | 0.94 [0.92, 0.96] |
| 1.2 Cluster‐randomised trials | 9 | 5343 | Risk Ratio (M‐H, Random, 95% CI) | 0.97 [0.94, 1.00] |
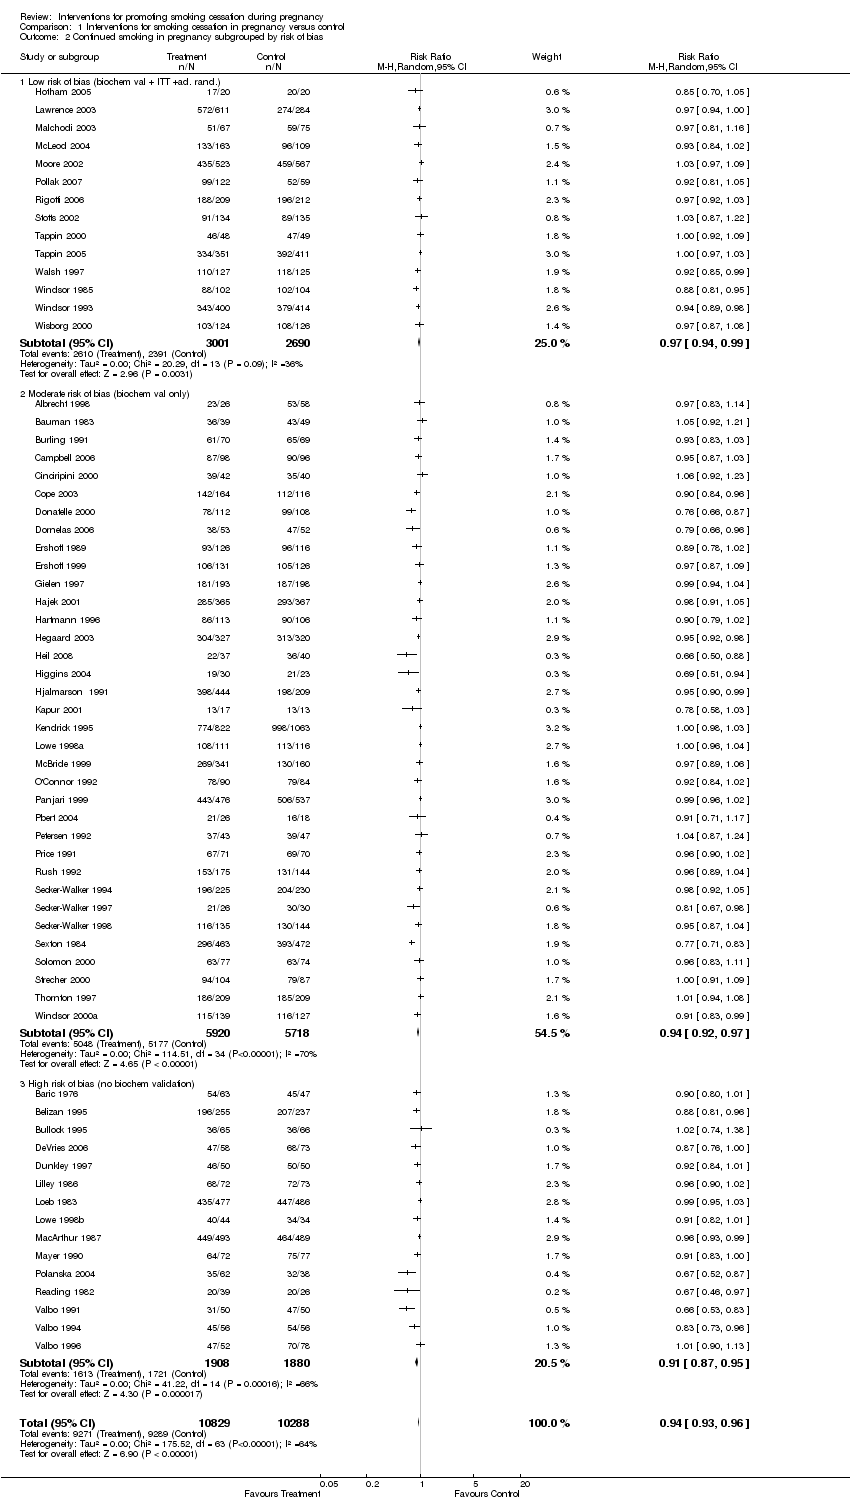
| 2 Continued smoking in pregnancy subgrouped by risk of bias Show forest plot | 64 | 21117 | Risk Ratio (M‐H, Random, 95% CI) | 0.94 [0.93, 0.96] |
|
| 2.1 Low risk of bias (biochem val + ITT +ad. rand.) | 14 | 5691 | Risk Ratio (M‐H, Random, 95% CI) | 0.97 [0.94, 0.99] |
| 2.2 Moderate risk of bias (biochem val only) | 35 | 11638 | Risk Ratio (M‐H, Random, 95% CI) | 0.94 [0.92, 0.97] |
| 2.3 High risk of bias (no biochem validation) | 15 | 3788 | Risk Ratio (M‐H, Random, 95% CI) | 0.91 [0.87, 0.95] |
| 3 Continued smoking in late pregnancy by intensity of intervention Show forest plot | 65 | 21258 | Risk Ratio (M‐H, Random, 95% CI) | 0.94 [0.93, 0.96] |
|
| 3.1 High intensity | 44 | 14453 | Risk Ratio (M‐H, Random, 95% CI) | 0.94 [0.92, 0.96] |
| 3.2 Medium intensity | 18 | 5670 | Risk Ratio (M‐H, Random, 95% CI) | 0.95 [0.92, 0.98] |
| 3.3 Low intensity | 3 | 1135 | Risk Ratio (M‐H, Random, 95% CI) | 0.95 [0.83, 1.09] |
| 4 Continued smoking in late pregnancy subgrouped by main intervention strategy Show forest plot | 65 | 21257 | Risk Ratio (M‐H, Random, 95% CI) | 0.94 [0.93, 0.96] |
|
| 4.1 Cognitive behaviour strategies | 30 | 9570 | Risk Ratio (M‐H, Random, 95% CI) | 0.95 [0.93, 0.97] |
| 4.2 Stages of change | 11 | 5073 | Risk Ratio (M‐H, Random, 95% CI) | 0.99 [0.97, 1.00] |
| 4.3 Feedback | 4 | 572 | Risk Ratio (M‐H, Random, 95% CI) | 0.92 [0.84, 1.02] |
| 4.4 Rewards | 4 | 1285 | Risk Ratio (M‐H, Random, 95% CI) | 0.76 [0.71, 0.81] |
| 4.5 Pharmacotherapy (NRT, Bupropion etc) nicotine replacement therapy | 5 | 1147 | Risk Ratio (M‐H, Random, 95% CI) | 0.95 [0.92, 0.98] |
| 4.6 Other | 11 | 3610 | Risk Ratio (M‐H, Random, 95% CI) | 0.96 [0.93, 0.98] |
| 5 Continued smoking (relapse) for spontaneous quitters in late pregnancy Show forest plot | 8 | 1064 | Risk Ratio (M‐H, Random, 95% CI) | 0.91 [0.75, 1.10] |
|
| 6 Mean birthweight Show forest plot | 21 | 15119 | Mean Difference (IV, Random, 95% CI) | 39.26 [15.77, 62.74] |
|
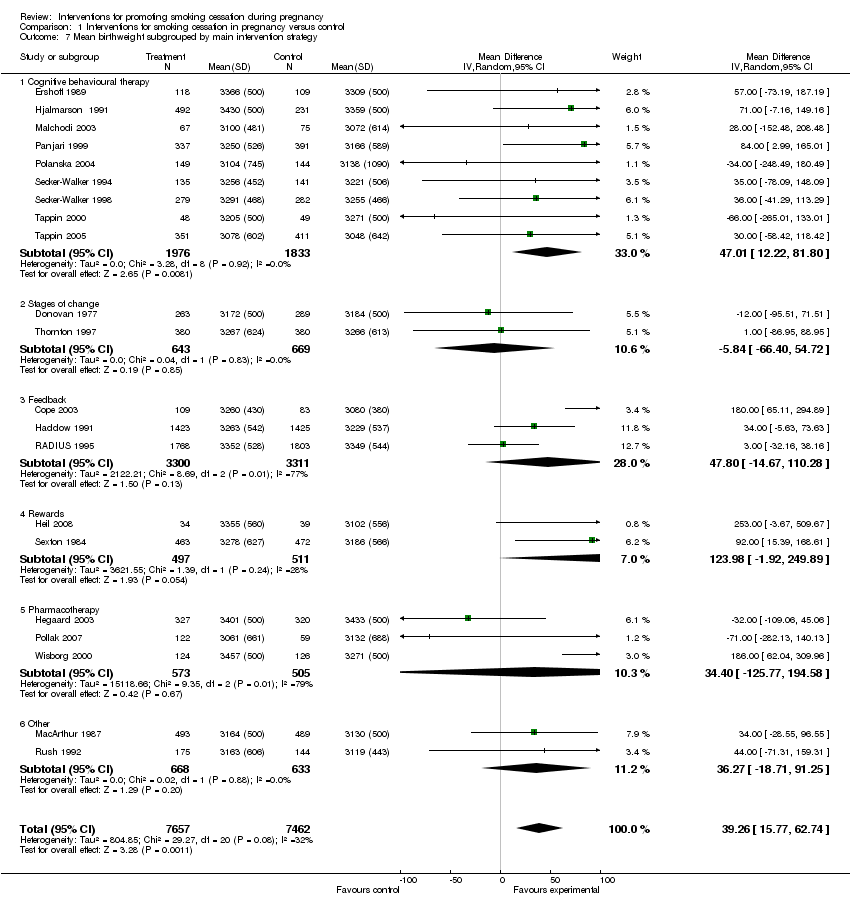
| 7 Mean birthweight subgrouped by main intervention strategy Show forest plot | 21 | 15119 | Mean Difference (IV, Random, 95% CI) | 39.26 [15.77, 62.74] |
|
| 7.1 Cognitive behavioural therapy | 9 | 3809 | Mean Difference (IV, Random, 95% CI) | 47.01 [12.22, 81.80] |
| 7.2 Stages of change | 2 | 1312 | Mean Difference (IV, Random, 95% CI) | ‐5.84 [‐66.40, 54.72] |
| 7.3 Feedback | 3 | 6611 | Mean Difference (IV, Random, 95% CI) | 47.80 [‐14.67, 110.28] |
| 7.4 Rewards | 2 | 1008 | Mean Difference (IV, Random, 95% CI) | 123.98 [‐1.92, 249.89] |
| 7.5 Pharmacotherapy | 3 | 1078 | Mean Difference (IV, Random, 95% CI) | 34.40 [‐125.77, 194.58] |
| 7.6 Other | 2 | 1301 | Mean Difference (IV, Random, 95% CI) | 36.27 [‐18.71, 91.25] |
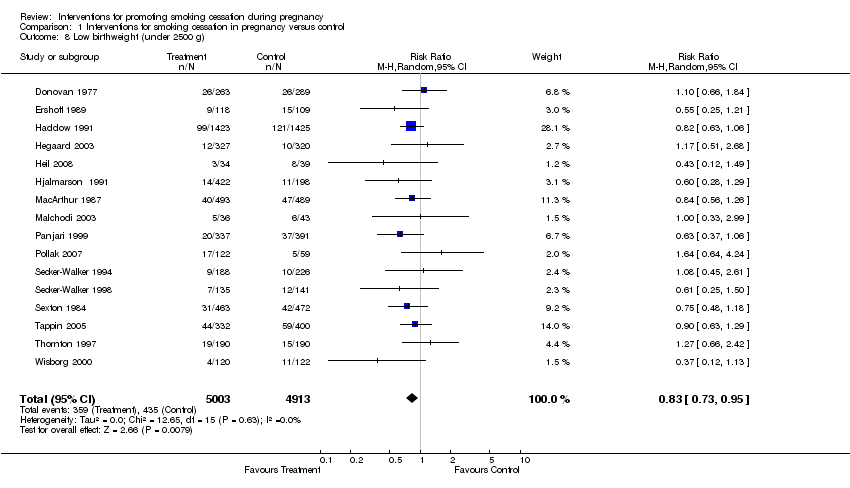
| 8 Low birthweight (under 2500 g) Show forest plot | 16 | 9916 | Risk Ratio (M‐H, Random, 95% CI) | 0.83 [0.73, 0.95] |
|
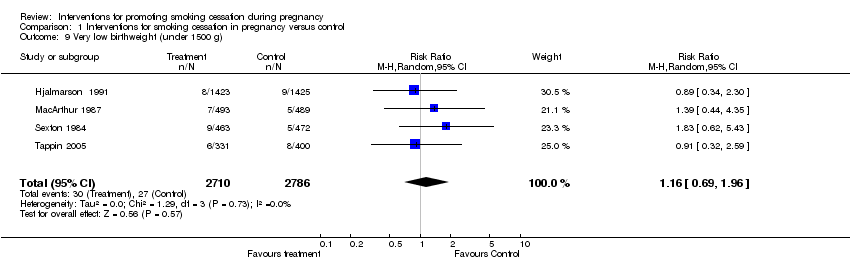
| 9 Very low birthweight (under 1500 g) Show forest plot | 4 | 5496 | Risk Ratio (M‐H, Random, 95% CI) | 1.16 [0.69, 1.96] |
|
| 10 Perinatal deaths Show forest plot | 3 | 4335 | Risk Ratio (M‐H, Random, 95% CI) | 1.13 [0.72, 1.77] |
|
| 11 Preterm birth (under 37 or under 36 weeks) Show forest plot | 14 | 11930 | Risk Ratio (M‐H, Random, 95% CI) | 0.86 [0.74, 0.98] |
|
| 12 Stillbirths Show forest plot | 6 | 4706 | Risk Ratio (M‐H, Random, 95% CI) | 1.10 [0.69, 1.76] |
|
| 13 Neonatal deaths Show forest plot | 3 | 4143 | Risk Ratio (M‐H, Random, 95% CI) | 1.17 [0.34, 4.01] |
|
| 14 NICU admissions Show forest plot | 4 | 1394 | Risk Ratio (M‐H, Random, 95% CI) | 0.85 [0.61, 1.18] |
|
| 15 Smoking reduction: numbers of women reducing smoking in late pregnancy Show forest plot | 13 | | Risk Ratio (M‐H, Random, 95% CI) | Subtotals only |
|
| 15.1 Self‐reported some reduction in smoking (various definitions) | 5 | 1487 | Risk Ratio (M‐H, Random, 95% CI) | 1.52 [1.29, 1.78] |
| 15.2 Self‐reported > 50% reduction in smoking | 3 | 779 | Risk Ratio (M‐H, Random, 95% CI) | 1.23 [0.91, 1.67] |
| 15.3 Biochemically validated reduction | 5 | 1549 | Risk Ratio (M‐H, Random, 95% CI) | 1.27 [0.84, 1.91] |
| 16 Smoking reduction: biochemical measures in late pregnancy Show forest plot | 4 | 2511 | Std. Mean Difference (IV, Random, 95% CI) | ‐0.11 [‐0.24, 0.02] |
|
| 16.1 Mean cotinine levels | 3 | 1742 | Std. Mean Difference (IV, Random, 95% CI) | ‐0.05 [‐0.14, 0.05] |
| 16.2 Mean thiocynate level | 1 | 769 | Std. Mean Difference (IV, Random, 95% CI) | ‐0.29 [‐0.44, ‐0.15] |
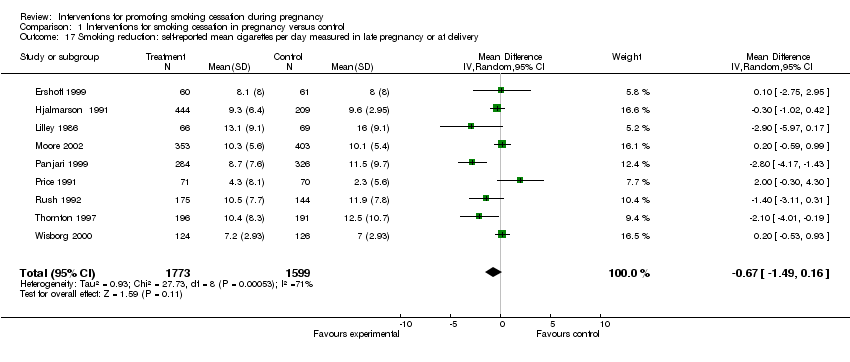
| 17 Smoking reduction: self‐reported mean cigarettes per day measured in late pregnancy or at delivery Show forest plot | 9 | 3372 | Mean Difference (IV, Random, 95% CI) | ‐0.67 [‐1.49, 0.16] |
|
| 18 Maintained smoking cessation at 1‐5 months postpartum Show forest plot | 20 | 6097 | Risk Ratio (M‐H, Random, 95% CI) | 1.65 [1.22, 2.24] |
|
| 18.1 Individually randomised trials | 15 | 4726 | Risk Ratio (M‐H, Random, 95% CI) | 1.43 [1.08, 1.91] |
| 18.2 Cluster‐randomised trials | 5 | 1371 | Risk Ratio (M‐H, Random, 95% CI) | 2.08 [0.78, 5.56] |
| 19 Maintained smoking cessation at 6 to 12 months postpartum Show forest plot | 8 | 2624 | Risk Ratio (M‐H, Random, 95% CI) | 1.39 [0.82, 2.38] |
|
| 19.1 Individually randomised trials | 8 | 2624 | Risk Ratio (M‐H, Random, 95% CI) | 1.39 [0.82, 2.38] |
| 19.2 Cluster‐randomised trials | 0 | 0 | Risk Ratio (M‐H, Random, 95% CI) | 0.0 [0.0, 0.0] |