Hypothermie für Schädel‐Hirn‐Trauma
Abstract
Background
Hypothermia has been used in the treatment of brain injury for many years. Encouraging results from small trials and laboratory studies led to renewed interest in the area and some larger trials.
Objectives
To determine the effect of mild hypothermia for traumatic brain injury (TBI) on mortality, long‐term functional outcomes and complications.
Search methods
We ran and incorporated studies from database searches to 21 March 2016. We searched the Cochrane Injuries Group's Specialised Register, Cochrane Central Register of Controlled Trials (CENTRAL, The Cochrane Library), MEDLINE (OvidSP), Embase Classic+Embase (OvidSP), PubMed, ISI Web of science (SCI‐EXPANDED, SSCI, CPCI‐S & CPSI‐SSH), clinical trials registers, and screened reference lists. We also re‐ran these searches pre‐publication in June 2017; the result from this search is presented in 'Studies awaiting classification'.
Selection criteria
We included randomised controlled trials of participants with closed TBI requiring hospitalisation who were treated with hypothermia to a maximum of 35 ºC for at least 12 consecutive hours. Treatment with hypothermia was compared to maintenance with normothermia (36.5 to 38 ºC).
Data collection and analysis
Two review authors assessed data on mortality, unfavourable outcomes according to the Glasgow Outcome Scale, and pneumonia.
Main results
We included 37 eligible trials with a total of 3110 randomised participants; nine of these were new studies since the last update (2009) and five studies had been previously excluded but were re‐assessed and included during the 2017 update. We identified two ongoing studies from searches of clinical trials registers and database searches and two studies await classification.
Studies included both adults and children with TBI. Most studies commenced treatment immediately on admission to hospital or after craniotomies and all treatment was maintained for at least 24 hours. Thirty‐three studies reported data for mortality, 31 studies reported data for unfavourable outcomes (death, vegetative state or severe disability), and 14 studies reported pneumonia. Visual inspection of the results for these outcomes showed inconsistencies among studies, with differences in the direction of effect, and we did not pool these data for meta‐analysis. We considered duration of hypothermia therapy and the length of follow‐up in collected data for these subgroups; differences in study data remained such that we did not perform meta‐analysis.
Studies were generally poorly reported and we were unable to assess risk of bias adequately. Heterogeneity was evident both in the trial designs and participant inclusion. Inconsistencies in results may be explained by heterogeneity among study participants or bias introduced by individual study methodology but we did not explore this in detail in subgroup or sensitivity analyses. We used the GRADE approach to judge the quality of the evidence for each outcome and downgraded the evidence for mortality and unfavourable outcome to very low. We downgraded the evidence for the pneumonia outcome to low.
Authors' conclusions
Despite a large number studies, there remains no high‐quality evidence that hypothermia is beneficial in the treatment of people with TBI. Further research, which is methodologically robust, is required in this field to establish the effect of hypothermia for people with TBI.
PICO
Laienverständliche Zusammenfassung
Hypothermie (Abkühlung der Körpertemperatur) für Personen mit einer Verletzung des Gehirns
Fragestellung
Was ist die Wirkung von milder Hypothermie (Abkühlung der Körpertemperatur) nach einer Hirnverletzung darauf, ob eine Person stirbt, schlechte gesundheitsbezogene Endpunkte hat oder eine ernsthafte Infektion im Brustbereich (Lungenentzündung) bekommt?
Hintergrund
Hypothermie wird seit vielen Jahren verwendet, um Personen mit einer schwerwiegenden Hirnverletzung zu behandeln. Dies beinhaltet die Abkühlung des Kopfes oder des ganzen Körpers auf eine Temperatur unterhalb der normalen Körpertemperatur. Wir wollten beurteilen, ob für Personen, die nach einer Hirnverletzung mit Hypothermie behandelt wurden, die Wahrscheinlichkeit niedriger ist, zu sterben oder schlechte gesundheitsbezogene Endpunkte zu haben (die wir als Tod, Koma oder schwerwiegende Behinderung definierten) und ob die Verwendung von Hypothermie das Risiko einer Lungenentzündung erhöhen könnte.
Datum der Suche
Die Evidenz ist auf dem Stand von März 2016.
Studienmerkmale
Wir schlossen 37 Studien mit insgesamt 3110 Teilnehmern ein. In jeder Studie wurden Patienten zufällig in zwei Gruppen eingeteilt: eine Gruppe behielt eine normale Körpertemperatur von 36,5 bis 38°C und die andere Gruppe wurde für mindestens 12 Stunden auf ein Maximum von 35°C abgekühlt.
Hauptergebnisse
Wir kombinierten nicht die Ergebnisse dieser Studien, um herauszufinden, ob Hypothermie die Endpunkte der Patienten verbessert. Dies ist darauf zurückzuführen, dass die Ergebnisse große Unterschiede aufwiesen, die wir nicht erklären konnten. Wir identifizierten einige Unterschiede in der Durchführung der Studien und in den Teilnehmern, die die Studienautoren rekrutiert hatten. Wir untersuchten aber nicht, ob diese Unterschiede jene in den Ergebnissen erklären können. Wir hatten nicht genügend Evidenz von guter Qualität, die ausreichend ähnlich war, um sicher zu sein, dass die Behandlung von Personen mit schwerer Hirnverletzung mit Hypothermie das Auftreten von Tod oder schwerer Behinderung verringert, oder das Auftreten von Lungenentzündungen erhöht.
Qualität der Evidenz
Viele der Studien waren nicht gut berichtet und wir waren nicht in der Lage einzuschätzen, ob die Unterschiede in der Qualität der Studien unsere Ergebnisse beeinflusst haben könnten. Wir verwendeten den GRADE‐Ansatz, um die Qualität der Evidenz zu beurteilen. Wir bewerteten die Evidenz zu Tod oder schwerer Behinderung als von sehr niedriger Qualität und die Evidenz zu Lungenentzündung als von niedriger Qualität.
Authors' conclusions
Summary of findings
| Hypothermia for traumatic brain injury | |||
| Patient or population: patients with traumatic brain injury | |||
| Outcomes | No of Participants | Quality of the evidence | Comments |
| Mortality at end of follow‐up | 2944 | ⊕⊝⊝⊝ | Data not combined in meta‐analysis. Visual inspection of data showed variation in differences of effect not explained by subgroup analysis |
| Unfavourable outcome at end of follow‐up | 2620 | ⊕⊝⊝⊝ | Data not combined in meta‐analysis. Visual inspection of data showed variation in differences of effect not explained by subgroup analysis |
| Pneumonia | 693 | ⊕⊕⊝⊝ | Data not combined in meta‐analysis. Visual inspection of data showed variation in differences of effect |
| GRADE Working Group grades of evidence | |||
| aWe identified 33 studies that reported data for mortality, with comparable data available for 32 studies | |||
Background
Description of the condition
Traumatic brain injury (TBI) is a major cause of death and disability amongst a predominantly young population. An estimated 10 million people worldwide experience severe brain injury every year (Langlois 2006). There is, however, a lack of evidence about effective therapies in the acute care of brain‐injured patients, especially children (Adelson 2003). A long‐term effort to review the literature and produce management guidelines by the American Association of Neurological Surgeons (Bullock 1996; Bullock 2007; Carney 2016; Kirkpatrick 1997) could make few definitive statements about treatment effectiveness that were supported by strong evidence from randomised studies. These guidelines include recommendations based on high‐quality evidence related to steroids, and moderate‐quality evidence related to decompressive craniectomy, nutrition, infection prophylaxis, and seizure prophylaxis; other recommendations were based on a low‐quality body of evidence.
Description of the intervention
Methods used to induce therapeutic cooling include use of cooling blankets, ice lavage or air‐cooling devices. Mild to moderate hypothermia, cooling to 32 to 35 ºC, has been used in the treatment of brain injury for over 50 years (Fay 1945). Although there were several promising experimental studies (Clasen 1968; Laskowski 1960) and case series (Sedzimir 1959; Shapiro 1974), no controlled clinical studies were performed and the therapy fell from favour. During the 1990s several investigators reported encouraging results from phase II and III randomised clinical trials (Clifton 1995; Marion 1997; Shiozaki 1993), corroborated by consistent findings of high levels of cerebral protection associated with systemic cooling in well‐validated laboratory models of global ischaemia (Busto 1987). The early trials were small, single‐centre investigations, which were sufficiently promising to lead to larger, multicentre trials.
How the intervention might work
Originally it was thought that the primary mechanism of action of temperature control therapy was a reduction in cerebral metabolic rate (Bering 1961). There is now evidence that mild hypothermia might also influence the excessive post‐traumatic release of excitatory neurotransmitters (Busto 1989) and attenuate the opening of the blood‐brain barrier (Smith 1996). The main risks associated with induced systemic hypothermia are an increased risk of sepsis and pneumonia, coagulation abnormalities, and possible myocardial ischaemia and atrial fibrillation (Schubert 1995).
Why it is important to do this review
A previous version of this review did not find clear evidence of the beneficial effects of hypothermia (Sydenham 2009b). Interest has continued in the use of hypothermia for TBI as well as in other conditions with neurological damage, and research has continued. It was important to update the review to include the most recent published data.
Objectives
To determine the effect of mild hypothermia for TBI on mortality, long‐term functional outcomes and complications.
Methods
Criteria for considering studies for this review
Types of studies
We searched for all randomised controlled trials (RCTs) of mild hypothermia versus control.
Types of participants
We included participants with any closed TBI requiring hospitalisation. We included studies in which participants had open and closed head injuries if fewer than 10% of participants were described as having an open head injury.
Types of interventions
We included therapeutic cooling, either locally or systemically, by means of a fluid‐filled cooling blanket, a 'bear‐hugger' air‐cooling device, ice water lavage, any combination of the above, or other methods, to a target temperature of at most 35 ºC for a period of at least 12 consecutive hours. Cooling could have begun immediately upon admission to the intensive care unit or be deferred until intracranial pressure (ICP) became uncontrollable by conventional management. We compared maintenance of hypothermia with maintenance of normothermia. We defined normothermia as a target temperature of 36.5 to 38 ºC.
Types of outcome measures
Primary outcomes
-
All‐cause mortality at the end of the follow‐up period.
-
Unfavourable outcome at the end of the follow‐up period.
Unfavourable outcome was defined as a Glasgow Outcome Scale (GOS) score of "severe disability", "persistent vegetative state", or "death"; or an equivalent measure if a GOS score was not presented.
Secondary outcomes
-
Frequency of pneumonia.
Search methods for identification of studies
To reduce publication and retrieval bias we did not restrict our search by language, date or publication status.
Electronic searches
The Cochrane Injuries Group's Information Specialist searched the following databases:
-
Cochrane Injuries Group specialised register (21 March 2016);
-
Cochrane Central Register of Controlled Trials (CENTRAL, The Cochrane Library) (issue 2 of 12, 2016);
-
Ovid MEDLINE(R), Ovid MEDLINE(R) In‐Process & Other Non‐Indexed Citations, Ovid MEDLINE(R) Daily and Ovid OLDMEDLINE(R) (1946 to 21 March 2016);
-
Embase Classic + Embase (OvidSP) (1947 to 21 March 2016);
-
ISI Web of Science: Science Citation Index Expanded (SCI‐EXPANDED) (1970 to March 2016); and
-
ISI Web of Science: Conference Proceedings Citation Index‐Science (CPCI‐S) (1990 to March 2016).
We re‐ran this search prior to publication on 1 June 2017, screened the results and placed relevant studies in Characteristics of studies awaiting classification. We will incorporate these in the next review update as appropriate.
One review author (Sharon R Lewis (SRL)) searched the following clinical trials registers:
-
Clinicaltrials.gov (www.clinicaltrials.gov) (accessed 21 September 2016);
-
ISRCTN Registry (http://www.isrctn.com/) (accessed 21 September 2016);
-
WHO International Clinical Trials Registry Platform (http://apps.who.int/trialsearch/) (accessed 21 September 2016).
Search strategies and notes are reported in Appendix 1. We adapted the MEDLINE search strategy as necessary for the other databases. We also used search filters, a modified version of the Cochrane Highly Sensitive Search Strategies, for identifying randomised trials in MEDLINE and Embase (Lefebvre 2011). Previous search strategies are reported in Appendix 2.
Searching other resources
We completed forward citation tracking of all new included studies identified from the searches in 2016. We completed backward citation searches of relevant review articles identified from these searches (Clifton 2011b; Crossley 2014; Georgiou 2013).
Data collection and analysis
Selection of studies
Two review authors screened the search results (SRL with Andrew Butler (AB), David Evans (DE), or Phil Alderson (PA)). We then retrieved full‐text copies of relevant records. We independently compared the trial design with the inclusion criteria for this review. We resolved disagreements by discussion.
Data extraction and management
Two review authors (SRL with AB, DE, PA or Oliver Schofield‐Robinson (OSR)) extracted the following information from each trial:
-
Methods: type of study design, setting, dates of study, funding sources.
-
Participants: number randomised to each group, baseline characteristics (to include age, gender, type of injury, Glasgow Coma Score on admission).
-
Intervention: details to include method of cooling, target temperature, time of initiation, duration of cooling and details of re‐warming.
-
Outcomes: all outcomes reported by study authors.
We considered applicability of information from individual studies and generalisability of the data to our intended study population (i.e. the potential for indirectness in our review). In the case of several publications of the same study, we identified a key reference and checked the data in this report for consistency against the other associated publications.
Extracted data were entered into Review Manager (RevMan) by SRL.
Assessment of risk of bias in included studies
We assessed study quality, study limitations and the extent of potential bias using the Cochrane ’Risk of bias’ tool (Higgins 2011). We considered the following domains:
-
Sequence generation (selection bias).
-
Allocation concealment (selection bias).
-
Blinding of participants, personnel and outcomes assessors (performance and detection bias).
-
Incomplete outcome data (attrition bias).
-
Selective outcome reporting (reporting bias).
For each domain, two review authors (SRL with AB, DE, OSR or PA) judged whether study authors had made sufficient attempts to minimize bias in their study design. Where necessary these judgements were made against each separate outcome. We made judgements using three measures: high, low, or unclear risk of bias.
Measures of treatment effect
We collected dichotomous data for mortality, unfavourable outcome and pneumonia. Study authors assessed participants using the Glasgow Outcome Scale, or equivalent, to report the number of participants who had an unfavourable outcome; this combined the number of participants who had died, those who were assessed as being in a persistent vegetative state and those with a severe disability.
Unit of analysis issues
We paid attention to outcome data collected at more than one time point within a study. For our primary analysis we reported data for the final time point only. In subgroup analyses we considered each time point but could not calculate effect estimates as this would lead to a unit of analysis error.
Dealing with missing data
We collected data as presented in each study report. We noted participant loss, or other missing data in the Characteristics of included studies and assessed risk of bias on any noted attrition. We used available case data reported by study authors for analysis.
Assessment of heterogeneity
We assessed evidence of methodological and clinical heterogeneity during the data extraction of each included study report. We assessed statistical heterogeneity by calculation of the I² statistic. We judged heterogeneity over 60% to be substantial (Higgins 2011).
As well as consideration of methodological, clinical and statistical heterogeneity, we assessed potential inconsistency by inspection of point estimates and the overlap of confidence intervals (CIs) between studies.
Assessment of reporting biases
We attempted to source the published protocol of each of our included studies using clinical trial registers. We compared protocols of prospectively registered studies against published study results to assess the risk of selective reporting bias.
We generated a funnel plot to assess the risk of publication bias in the review; an asymmetric funnel plot may indicate potential publication of only positive results (Egger 1997).
Data synthesis
We collected event data for each study and used Review Manager (RevMan) to calculate odds ratios to express effect size. The odds ratio was chosen because of the large variation in baseline event data between trials. We calculated CIs at 95% and used a P value of 0.05 or below to judge if a result was statistically significant. We considered whether there was imprecision in the results of analysis by assessing the CI around an effects measure; a wide CI would suggest a higher level of imprecision in our results, and a small number of studies would also reduce the precision (Guyatt 2011).
Subgroup analysis and investigation of heterogeneity
We performed subgroup analyses to determine whether the treatment effect varies with: duration of hypothermia; and length of follow up.
Sensitivity analysis
We explored the potential effects of decisions made as part of the review process as follows.
-
We considered subgroup analysis of mortality and unfavourable outcome for studies that had reported data at more than one time point. We removed data, so that only one of each time points were included. We planned to compare the effect estimates from the sensitivity analysis with the effect estimates from the subgroup analysis. We would have reported any differences that altered interpretation of the results.
-
We excluded all studies that we judged to be at high or unclear risk of selection bias. We planned to compare the effect estimates from the sensitivity analysis with the effect estimates from the main analysis. We would have reported differences that altered interpretation of the results.
Results
Description of studies
Results of the search
We included an additional nine studies for the 2017 update (Adelson 2013; Andrews 2015; Beca 2015; Clifton 2011; Idris 2014; Lee 2010; Li 2009; Yan 2010; Zhao 2011).
We re‐assessed eight studies that had been excluded during a previous update due to insufficient description of methods of sequence generation. We included five of these in this update to ensure consistency across all studies (Chen 2001; Li 2008; Qiu 2005; Wang 2005; Zhi 2003) and excluded three (Meissner 1998; Wang 2007; Yan 2007), see Characteristics of excluded studies.
In total, we included 37 randomised controlled trials (RCTs) (Adelson 2005 HYPO 1; Adelson 2005 HYPO 2; Adelson 2013; Aibiki 2000; Andrews 2015; Beca 2015; Biswas 2002; Chen 2001; Clifton 1992; Clifton 1993; Clifton 2001; Clifton 2011; Harris 2009; Hashiguchi 2003; Hirayama 1994; Hutchison 2008; Idris 2014; Ishikura 1998; Jiang 2000; Lee 2010; Li 2008; Li 2009; Marion 1997; Meissner 2003a; Meissner 2003b; Qiu 2005; Qiu 2007; Shiozaki 1993; Shiozaki 1999; Shiozaki 2001; Smrcka 2005; Wang 2005; Yan 2001; Yan 2010; Zhang 2000; Zhao 2011; Zhi 2003). See Figure 1.

Study flow diagram.
Included studies
Details of individual studies are presented in Characteristics of included studies.
The 37 included RCTs randomised 3110 participants. Of these, seven studies included only children (Adelson 2005 HYPO 1; Adelson 2005 HYPO 2; Adelson 2013; Beca 2015; Biswas 2002; Hutchison 2008; Li 2009); and 13 included only adult participants (Andrews 2015; Chen 2001; Clifton 1992; Clifton 1993; Clifton 2001; Clifton 2011; Harris 2009; Hirayama 1994; Marion 1997; Meissner 2003b; Qiu 2007; Yan 2010; Zhao 2011). Ten studies included both children and adults (Aibiki 2000; Hashiguchi 2003; Shiozaki 1993; Shiozaki 1999 (participants over 10 years of age); Idris 2014; Lee 2010; Yan 2001 (participants over 12 years of age); Li 2008 (participants over 16 years of age); Shiozaki 2001 (participants from birth); and Qiu 2005 (participants over 14 years of age). Other studies did not specify inclusion of children or adults, although reported mean ages suggested that most participants were adults in studies by Jiang 2000, Smrcka 2005 and Zhi 2003. We could not determine participants' ages in Ishikura 1998, Meissner 2003a, Wang 2005 and Zhang 2000.
We included all studies in which participants had TBI, although we were not always able to determine if injuries were only 'closed'. One study specified inclusion of both 'open' and 'closed' injuries (Harris 2009); most were non‐penetrating injuries. Most studies specified that participants were required to have a Glasgow Coma Score (GCS) of eight or less on admission or after resuscitation (Adelson 2005 HYPO 1; Adelson 2005 HYPO 2; Adelson 2013; Aibiki 2000; Biswas 2002; Clifton 1992; Clifton 1993; Clifton 2001; Clifton 2011; Harris 2009; Hashiguchi 2003; Hirayama 1994; Hutchison 2008; Idris 2014; Ishikura 1998; Jiang 2000; Lee 2010; Li 2008; Li 2009; Marion 1997; Qiu 2005; Qiu 2007; Shiozaki 1993; Shiozaki 1999; Shiozaki 2001; Smrcka 2005; Wang 2005; Yan 2001; Yan 2010; Zhang 2000; Zhao 2011; Zhi 2003). Two studies specified a GCS of less than nine (Beca 2015; Meissner 2003b) and one study reported that participants were required to have an average GCS of three to eight (Chen 2001). One study did not specify a GCS as part of inclusion criteria and 34.4% of their included participants had a score of nine or more (Andrews 2015). Participant inclusion criteria were not available for Meissner 2003a.
Most studies specified that hypothermia was commenced immediately or shortly after admission (Adelson 2005 HYPO 1; Adelson 2005 HYPO 2; Adelson 2013; Aibiki 2000; Beca 2015; Biswas 2002; Chen 2001; Clifton 1992; Clifton 1993; Clifton 2001; Clifton 2011; Hirayama 1994; Idris 2014; Jiang 2000; Li 2008; Li 2009; Marion 1997; Meissner 2003a; Meissner 2003b; Shiozaki 1999; Shiozaki 2001; Smrcka 2005; Yan 2001; Yan 2010; Zhao 2011). Both Lee 2010 and Qiu 2007 included participants who required craniotomies as part of treatment and hypothermia was commenced post‐surgery in these participants. Qiu 2005 and Zhi 2003 commenced treatment either immediately or delayed if surgery was required. Three studies had an extended time for study inclusion of up to 24 hours post‐injury (Adelson 2005 HYPO 2; Qiu 2005; Zhi 2003), Harris 2009 included participants up to 48 hours post‐injury and Andrews 2015 included participants who had been injured up to 10 days previously. Hashiguchi 2003 required participants to have stabilized intracranial pressure (ICP) before any intervention. We were unable to determine time of hypothermia treatment in the remaining studies.
Thirty‐three studies reported data for our primary outcome of mortality (Adelson 2005 HYPO 1; Adelson 2005 HYPO 2; Adelson 2013; Aibiki 2000; Andrews 2015; Beca 2015; Biswas 2002; Chen 2001; Clifton 1992; Clifton 1993; Clifton 2001; Clifton 2011; Harris 2009; Hashiguchi 2003; Hirayama 1994; Hutchison 2008; Ishikura 1998; Jiang 2000; Lee 2010; Li 2009; Marion 1997; Meissner 2003b; Qiu 2005; Qiu 2007; Shiozaki 1993; Shiozaki 1999; Shiozaki 2001; Smrcka 2005; Yan 2001; Yan 2010; Zhang 2000; Zhao 2011; Zhi 2003). Thirty‐one studies reported unfavourable outcomes or which 30 studies used the Glasgow Outcome Scale (GOS) (Adelson 2005 HYPO 1; Adelson 2005 HYPO 2; Adelson 2013; Aibiki 2000; Andrews 2015; Biswas 2002; Chen 2001; Clifton 1992; Clifton 1993; Clifton 2001; Clifton 2011; Harris 2009; Hashiguchi 2003; Hirayama 1994; Hutchison 2008; Idris 2014; Jiang 2000; Lee 2010; Li 2008; Marion 1997; Qiu 2005; Qiu 2007; Shiozaki 1993; Shiozaki 1999; Shiozaki 2001; Smrcka 2005; Wang 2005; Yan 2010; Zhao 2011; Zhi 2003) and one study used a scoring system that was equivalent to the GOS (Beca 2015). Fourteen studies reported data for pneumonia (Adelson 2005 HYPO 1; Adelson 2005 HYPO 2; Adelson 2013; Aibiki 2000; Beca 2015; Clifton 1992; Clifton 1993; Hashiguchi 2003; Hutchison 2008; Idris 2014; Jiang 2000; Shiozaki 1993; Shiozaki 1999; Shiozaki 2001).
We were able to access the full‐text of 34 studies. One study (Ishikura 1998) was published only as an abstract but had sufficient data to justify inclusion and one study (Zhang 2000) was published in Chinese; we did not seek translation of Zhang 2000 for this update and the data for this study were taken from the English abstract only.
Excluded studies
We excluded 53 full‐text articles that were identified for further assessment in the 2017 update because they were the wrong study design. We list eight key articles (from the 53 articles), with nine references, in Characteristics of excluded studies (ACTRN12615001119583p; Maekawa 2015; Meissner 1998; NCT01333488NCT02353793; Rincon 2014; Wang 2007; Yan 2007). Three of these were from clinical trials registers (ACTRN12615001119583p; NCT01333488; NCT02353793) and three were excluded in a previous version of the review but reconsidered for the 2017 update (Meissner 1998; Wang 2007; Yan 2007). Reasons for excluding these studies were assessment of the wrong intervention (ACTRN12615001119583p; Maekawa 2015) and assessment of the wrong participant group (Rincon 2014; NCT02353793). There was insufficient information in Wang 2007 and Yan 2007 to assess eligibility and both appeared to not include relevant outcomes. Meissner 1998 did not appear to be an RCT and NCT01333488 had been terminated early with inadequate accrual. See Figure 1.
Ongoing studies
We identified two RCTs that are ongoing (Lei 2015; Nichol 2015). Both studies are recruiting adult participants with severe brain injury to receive hypothermia or normothermia treatment. Details are presented in Characteristics of ongoing studies.
Studies awaiting classification
We have included two studies awaiting classification. We identified one study during forward citation tracking (Gál 2012). We were unable to establish if this abstract was a later publication of Smrcka 2005 or an additional new study. We have not included Gál 2012 in this update; and we have written to the study authors for more information. We identified one study in the pre‐publication search in June 2017 (Tang 2017). We will incorporate this study into the review in a future update, as appropriate. See Characteristics of studies awaiting classification.
Risk of bias in included studies
We assessed each of the following domains and presented a summary of the risk of bias assessments and a 'Risk of bias' graph. Assessments of performance bias and detection bias were made by reported outcome, with blank spaces indicating that the outcome was not reported by study authors. See Characteristics of included studies and Figure 2 and Figure 3.
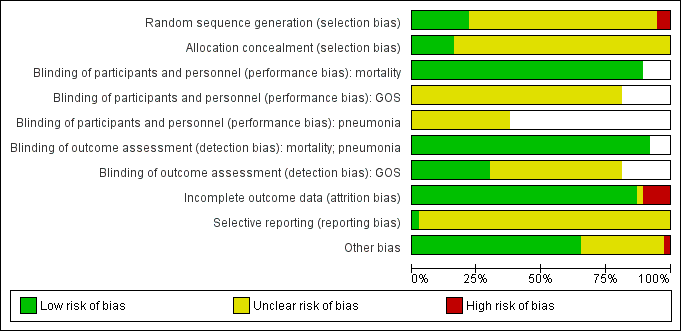
Risk of bias graph: review authors' judgements about each risk of bias item presented as percentages across all 37 included studies.

Risk of bias summary: review authors' judgements about each risk of bias item for each included study.
Note: blank spaces in risk of bias table indicate that the relevant outcome was not reported by study authors
Allocation
Eight trials had adequately described an appropriate method of randomisation (Adelson 2013; Andrews 2015; Beca 2015; Clifton 2011; Harris 2009; Hutchison 2008; Marion 1997; Qiu 2007). Ishikura 1998 had insufficient details in the abstract on randomisation but the number of participants in each group was uneven and we suspected an inadequate method of randomisation. Li 2009 had randomised participants on the basis of date of admission which introduced risk of bias. We therefore judged Ishikura 1998 and Li 2009 to have high risk of bias. All other studies provided insufficient detail and risk of bias was unclear.
We judged only six studies to have adequately described a method of concealing the sequence generation from attending investigators or personnel (Adelson 2013; Andrews 2015; Beca 2015; Clifton 2011; Hutchison 2008; Qiu 2007). All other studies had either reported insufficient detail or had not reported methods of allocation concealment.
Blinding
It was not possible to blind personnel or awake participants from the intervention. For mortality, we decided that this lack of blinding would not introduce any performance bias and therefore judged all studies that reported mortality to have low risk of performance bias (Adelson 2005 HYPO 1; Adelson 2005 HYPO 2; Adelson 2013; Aibiki 2000; Andrews 2015; Beca 2015; Biswas 2002; Chen 2001; Clifton 1992; Clifton 1993; Clifton 2001; Clifton 2011; Harris 2009; Hashiguchi 2003; Hirayama 1994; Hutchison 2008; Ishikura 1998; Jiang 2000; Lee 2010; Li 2009; Marion 1997; Meissner 2003b; Qiu 2005; Qiu 2007; Shiozaki 1993; Shiozaki 1999; Shiozaki 2001; Smrcka 2005; Yan 2001; Yan 2010; Zhang 2000; Zhao 2011; Zhi 2003). However, we could not ascertain whether there were increased risks of performance bias for other outcomes and we therefore recorded studies that reported data for pneumonia and unfavourable outcomes as unclear for performance bias.
We did not think that inability to blind outcome assessors would influence the reporting and assessment of mortality or pneumonia, and we therefore judged all studies that reported these outcomes to have low risk of detection bias (Adelson 2005 HYPO 1; Adelson 2005 HYPO 2; Adelson 2013; Aibiki 2000; Andrews 2015; Beca 2015; Biswas 2002; Chen 2001; Clifton 1992; Clifton 1993; Clifton 2001; Clifton 2011; Harris 2009; Hashiguchi 2003; Hirayama 1994; Hutchison 2008; Idris 2014; Ishikura 1998; Jiang 2000; Lee 2010; Li 2009; Marion 1997; Meissner 2003b; Qiu 2005; Qiu 2007; Shiozaki 1993; Shiozaki 1999; Shiozaki 2001; Smrcka 2005; Yan 2001; Yan 2010; Zhang 2000; Zhao 2011; Zhi 2003). However, assessment of unfavourable outcomes could be influenced by knowledge of group allocation and we therefore judged detection bias based on information presented in the relevant papers. Eleven studies had reported that investigators assessing unfavourable outcomes had been blinded and we judged these to have low risk of detection bias (Adelson 2005 HYPO 1; Adelson 2005 HYPO 2; Adelson 2013; Andrews 2015; Biswas 2002; Clifton 1993; Clifton 2001; Hutchison 2008; Jiang 2000; Marion 1997; Zhao 2011). The remaining studies did not provide information about any attempts to reduce detection bias for this outcome and we therefore recorded an unclear judgement for these studies.
Incomplete outcome data
We judged 31 studies to have low risk of attrition bias (Adelson 2005 HYPO 1; Adelson 2005 HYPO 2; Adelson 2013; Andrews 2015; Biswas 2002; Chen 2001; Clifton 1992; Clifton 1993; Clifton 2001; Clifton 2011; Hashiguchi 2003; Hirayama 1994; Idris 2014; Jiang 2000; Lee 2010; Li 2008; Li 2009; Marion 1997; Meissner 2003b; Qiu 2005; Qiu 2007; Shiozaki 1993; Shiozaki 1999; Shiozaki 2001; Smrcka 2005; Wang 2005; Yan 2001; Yan 2010; Zhang 2000; Zhao 2011; Zhi 2003). These studies had either reported no losses or had reported a small number of losses with explanations. We judged four studies to have high risk of attrition bias (Beca 2015; Harris 2009; Hutchison 2008; Ishikura 1998) with a large percentage of losses or losses unevenly spread between groups. We had insufficient information on attrition in two studies and recorded an unclear judgement for these (Aibiki 2000; Meissner 2003a).
Selective reporting
Only four studies reported details of clinical trial registration and were prospectively registered (Adelson 2013; Andrews 2015; Beca 2015; Clifton 2011). We judged the reported outcomes in Beca 2015 to be comparable to those listed in the protocol and therefore judged this study to have low risk of reporting bias. However, there were some inconsistencies between the clinical trial register documents and the study reports in Adelson 2013, Andrews 2015 and Clifton 2011 and we were unable to assess whether there was risk of reporting bias in these studies. One study (Hutchison 2008) had provided a clinical trials registration number but this was a retrospective registration and therefore did not facilitate judgment of reporting bias. We were unable to identify trial registration, prospective or retrospective, of any of the remaining 32 included studies and therefore recorded an unclear judgement for reporting bias.
Other potential sources of bias
We did not identify any additional sources of bias in 24 studies (Adelson 2005 HYPO 1; Adelson 2005 HYPO 2; Adelson 2013; Aibiki 2000; Beca 2015; Clifton 1992; Clifton 1993; Clifton 2001; Hashiguchi 2003; Hirayama 1994; Jiang 2000; Lee 2010; Li 2008; Li 2009; Marion 1997; Meissner 2003b; Qiu 2005; Qiu 2007; Shiozaki 1993; Shiozaki 1999; Smrcka 2005; Yan 2001; Zhao 2011; Zhi 2003) and judged these to have low risk of additional bias. Eleven studies reported some imbalances in baseline characteristics and we were unable to judge how this might influence the results or we had insufficient information on baseline characteristics, or study details, to assess the risk of bias; we recorded an unclear judgement for these (Biswas 2002; Chen 2001; Clifton 2011; Harris 2009; Hutchison 2008; Idris 2014; Ishikura 1998; Meissner 2003a; Wang 2005; Yan 2010; Zhang 2000). One study (Shiozaki 2001) reported that method of temperature management was at the discretion of the physician and we did not know whether this may influence outcome results; we recorded this as unclear risk of bias. One study made a change to the inclusion criteria part way through the trial to include participants up to 10 days after injury (Andrews 2015); this had the potential to introduce bias into the results and therefore we judged this to be high risk of bias.
Effects of interventions
See: Summary of findings for the main comparison Hypothermia for traumatic brain injury
Primary outcomes
1. Mortality at end of follow‐up
We included 33 studies, with 2988 participants, that reported mortality.
Mortality is contained within assessment of the Glasgow Outcome Scale (GOS) and therefore overlaps with our second outcome (i.e. unfavourable outcome). We collected data from studies that reported mortality separately as part of the GOS data. Reported time points for this outcome varied: within hospital (Marion 1997); at 22 days (Shiozaki 2001); at 28 days (Andrews 2015; Harris 2009); at one month (Adelson 2005 HYPO 1; Adelson 2005 HYPO 2; Biswas 2002; Clifton 1993; Hirayama 1994; Li 2009; Meissner 2003b; Yan 2001; Zhang 2000), three months (Adelson 2013; Biswas 2002; Clifton 1992; Marion 1997; Shiozaki 2001; Zhao 2011), six months (Aibiki 2000; Andrews 2015; Biswas 2002; Chen 2001; Clifton 2001; Clifton 2011; Hashiguchi 2003; Hutchison 2008; Lee 2010; Marion 1997; Shiozaki 1993; Shiozaki 1999; Smrcka 2005; Zhi 2003), and 12 months (Beca 2015; Biswas 2002; Jiang 2000; Marion 1997; Qiu 2007); at two years follow‐up (Qiu 2005); and at an unclearly‐reported time point up to seven years (Yan 2010). Some studies reported mortality at more than one time point; we only collected data for the latest time point, which represented end of follow‐up. We did not collect data for Ishikura 1998 as it was unclearly reported.
We identified inconsistencies in our visual inspection of results with differences in direction of effect between studies. We did not perform meta‐analysis. Individual study data are reported in Analysis 1.1. There were few studies with low risk of bias for sequence generation and allocation concealment. We were also concerned that some studies, for example Andrews 2015, had differences in study design leading to some excessive diversity that made pooling unwise. Using GRADE, we downgraded the evidence for mortality to very low quality, see summary of findings Table for the main comparison.
2. Unfavourable outcome at final follow‐up
We included 31 studies, with 2869 participants, that reported unfavourable outcome. Assessments were made at one, three, six and 12 months and at two years follow‐up. Some studies reported unfavourable outcome at more than one time point; we only collected data for the final time point, which represented end of follow‐up. We did not collect data for Adelson 2005 HYPO 1, Adelson 2005 HYPO 2, Chen 2001 and Harris 2009 which were not reported as event data.
We identified inconsistencies from visual inspection of results and there was a substantial level of statistical heterogeneity (I² = 66%). Therefore, we did not perform meta‐analysis. Individual study data are reported in Analysis 1.2. There were few studies with low risk of bias for sequence generation and allocation concealment. We were also concerned that some studies, for example Andrews 2015, had differences in study design leading to some excessive diversity that made pooling unwise. Using GRADE, we downgraded the evidence for unfavourable outcome to very low quality, see summary of findings Table for the main comparison.
Secondary outcomes
1. Frequency of pneumonia
We included 14 studies, with 768 participants, that reported pneumonia. It was not possible to collect data for Adelson 2005 HYPO 1 and Adelson 2005 HYPO 2 because the data for pneumonia were combined with other complications. We identified inconsistencies in visual inspection of results and did not pool data for meta‐analysis. Individual study data are reported in Analysis 1.3. There were few studies with low risk of bias for sequence generation and allocation concealment and we used GRADEpro GDT 2015 to downgrade the evidence for pneumonia to low quality, see summary of findings Table for the main comparison.
Subgroup analysis
1. Duration of hypothermia
Four studies described therapeutic cooling for 24 hours (Clifton 1992; Harris 2009; Hutchison 2008; Marion 1997) and 28 studies described cooling for more than 24 hours (Adelson 2005 HYPO 1; Adelson 2005 HYPO 2; Adelson 2013; Aibiki 2000; Andrews 2015; Beca 2015; Biswas 2002; Chen 2001; Clifton 1993; Clifton 2001; Clifton 2011; Hashiguchi 2003; Hirayama 1994; Jiang 2000; Lee 2010; Li 2009; Meissner 2003a; Meissner 2003b; Qiu 2005; Qiu 2007; Shiozaki 1993; Shiozaki 1999; Shiozaki 2001; Smrcka 2005; Yan 2001; Yan 2010; Zhang 2000; Zhao 2011). One study (Idris 2014) reported duration of intervention of at least 24 hours and we included this study in the 'more than 24 hours' subgroup. We did not have relevant information for Ishikura 1998 or Li 2008 and could not include these studies in subgroup analyses for any outcomes.
We remained concerned about differences identified in the visual inspection of the results of our included studies and therefore did not perform pooled subgroup analysis for each outcome. Also, we were concerned about the unclear risk of bias for most studies. Individual study data are reported in Analysis 2.1, Analysis 2.2, and Analysis 2.3.
2. Length of follow‐up
Studies reported mortality at four different time points. Three time points were clearly dictated by measurements on the GOS assessment; the fourth time point was stated or assumed to be within the initial study period (assumed to be within 28 days). Qiu 2005 reported follow‐up at two years which we combined with data measured at 12 months. The time point was unclearly reported in Chen 2001 but we assumed it was six months from other information in the study report. The four subgroups for mortality were: one, three, six and 12 months or more; and for unfavourable outcome were: three, six and 12 months or more (with no event data for one month). However, as some studies reported outcome data at more than one time point, it was not appropriate to complete statistical tests of subgroup interactions. Visual inspection of the data for mortality when separated by length of follow‐up suggested there were no differences between groups at one, three and six months. We noted differences between groups at 12 months or more but we could not explain this and we remained concerned about unclear risk of bias across most studies included in the subgroup analysis and inconsistencies from visual inspection of the data. See Analysis 3.1.
Similarly, it was not appropriate to carry out statistical tests for length of follow‐up subgroups for unfavourable outcome. Visual inspection of the data showed some differences between groups, with fewer unfavourable outcomes at three months and 12 months but not at six months. Again, we remained concerned about risks of bias across studies and unexplained heterogeneity that may have influenced this result. See Analysis 3.2.
Sensitivity analysis
The subgroup analysis data divided by length of follow‐up time presented more meaningful results overall but as these analyses included data from more than one study the overall effect estimates could not be calculated without including a unit‐of‐analysis error.
In sensitivity analyses, we removed studies that had been included at more than one time point so that data were recorded at one time point only. Therefore in Analysis 3.1, in which study data were recorded for mortality, we assessed the impact of removing data for Andrews 2015, Biswas 2002, Marion 1997 and Shiozaki 2001 at each time point. We remained concerned about differences in direction of results and did not calculate effect estimates in meta‐analysis. Simlarly, we considered the impact of removing data for Biswas 2002 at each time point for unfavourable outcome but did not calculate effect estimates owing to differences in the remaining studies.
We removed studies that had an unclear or high risk of selection bias, therefore we collected data for eight possible studies for our primary outcomes (Adelson 2013; Andrews 2015; Beca 2015; Clifton 2011; Harris 2009; Hutchison 2008; Marion 1997; Qiu 2007). There remained apparent differences between the study results that did not justify calculation of a pooled effect estimate. We did not consider the impact of other types of bias in these eight studies or in the remaining studies in a sensitivity analysis.
Discussion
Summary of main results
We included 37 studies that assessed the effect of hypothermia on participants with TBI.
We identified inconsistencies from visual inspection of the results of our included studies and did not perform meta‐analysis for review outcomes. Studies showed differences in the direction of effect and attempts to explore this through subgroup analysis by duration of hypothermia and length of follow‐up, and sensitivity analysis by assessment of risk of bias, did not explain these differences. We used GRADEpro GDT 2015 to downgrade the evidence for each of our outcomes by one level for inconsistency.
Overall completeness and applicability of evidence
We completed a thorough search for the 2017 update of this review, carrying out both backward and forward citation tracking of included studies. We used the search strategies delineated in a previous version of this review (Sydenham 2009b). All 37 studies included in the review provided evidence applicable to patients who have sustained a closed TBI and who had been treated with a method to induce hypothermia after injury. Most studies initiated treatment immediately after injury, although some studies commenced treatment within 24 hours or 48 hours and one study included participants who had received a brain injury within 10 days (Andrews 2015). Andrews 2015 also included some participants who had been assessed with a Glasgow Coma Score of nine or above on admission. This introduced an element of indirectness into the results and we used GRADEpro GDT 2015 to downgrade the evidence by one level.
It is possible that inconsistencies that we identified in the results may be explained by the differences in participants between included studies and we did not explore this during subgroup or sensitivity analysis. For example, we did not attempt to analyse data according to age of participants and we included data for adults and children within the same analyses, and we did not explore differences that may relate to the cause or type of injury. Our review considered outcome data for mortality, poor outcome, and pneumonia; we did not consider additional outcome data such as quality of life or potential adverse effects such as coagulation abnormalities, myocardial ischaemia or atrial fibrillation. We propose that future review updates include additional outcomes, and appropriate additional subgroup analyses to explore differences between study participants, for completeness of evidence.
Quality of the evidence
Only eight studies adequately described methods of randomisation. We accepted that it was not feasible to blind personnel to the intervention in these studies, however detection bias could have been minimized by blinding of outcome assessors, particularly for the assessment of unfavourable outcome. Few studies had described this adequately. We were unable to assess the risk of selective reporting bias in 33 of the studies due to lack of prospective trial registration and we identified baseline imbalances in some studies and it was not clear if these imbalances could have influenced results. One study (Andrews 2015) had reported an important change to the inclusion criteria part way through the study, increasing the potential length of time after brain injury from 72 hours to 10 days and the trial was stopped early because of apparent harm, which may introduce bias. We used GRADEpro GDT 2015 in our assessment of study limitations to downgrade the evidence by a further level. Overall, we judged the quality of the evidence for mortality and unfavourable outcome as very low and the quality of the evidence for pneumonia as low.
Again, it is possible that inconsistencies that we identified in the results may be explained by issues of quality in our included studies and we did not explore this in detail during sensitivity analysis.
Potential biases in the review process
We are confident that we identified eligible studies for this update using a thorough search strategy which was not limited by language, date of publication or publication status. We reconsidered studies during the 2017 update which had been previously excluded owing to lack of detail on randomisation methods which led to inclusion of a further five studies. However, we did not seek translation of one of these studies (Zhang 2000) and our assessment of study methodology and risk of bias for this study was therefore limited.
We did not carry out a grey literature search, nor contact authors in the field to identify any unpublished studies, although visual analysis of a funnel plot did not suggest any particular risk of publication bias (Figure 4). We did not seek additional information from study authors regarding their study protocols, methods and results to clarify risk of bias, and we judged all studies equally on the information provided in the full report.
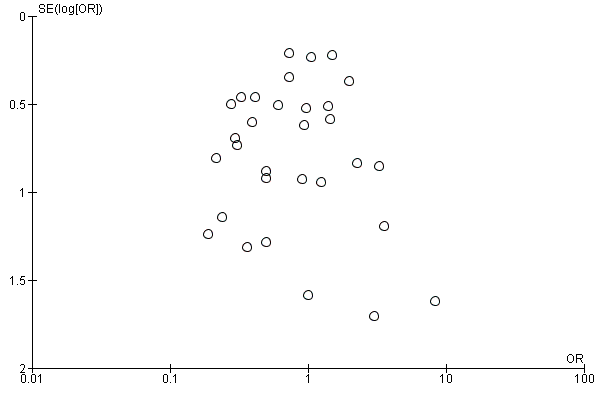
Funnel plot of comparison 1: Therapeutic cooling versus no cooling, outcome: 1.1 Mortality.
Agreements and disagreements with other studies or reviews
Systematic reviews by Crossley 2014 and Georgiou 2013 both confirm low quality evidence in this field. Both reviews show evidence of a reduction in mortality and poor outcome when hypothermia is induced. However, both reviews included fewer studies than this Cochrane Review and did not include more recent studies published since 2012. Georgiou 2013 included analysis of only higher quality studies demonstrating no evidence of an effect of hypothermia on mortality or unfavourable outcome.
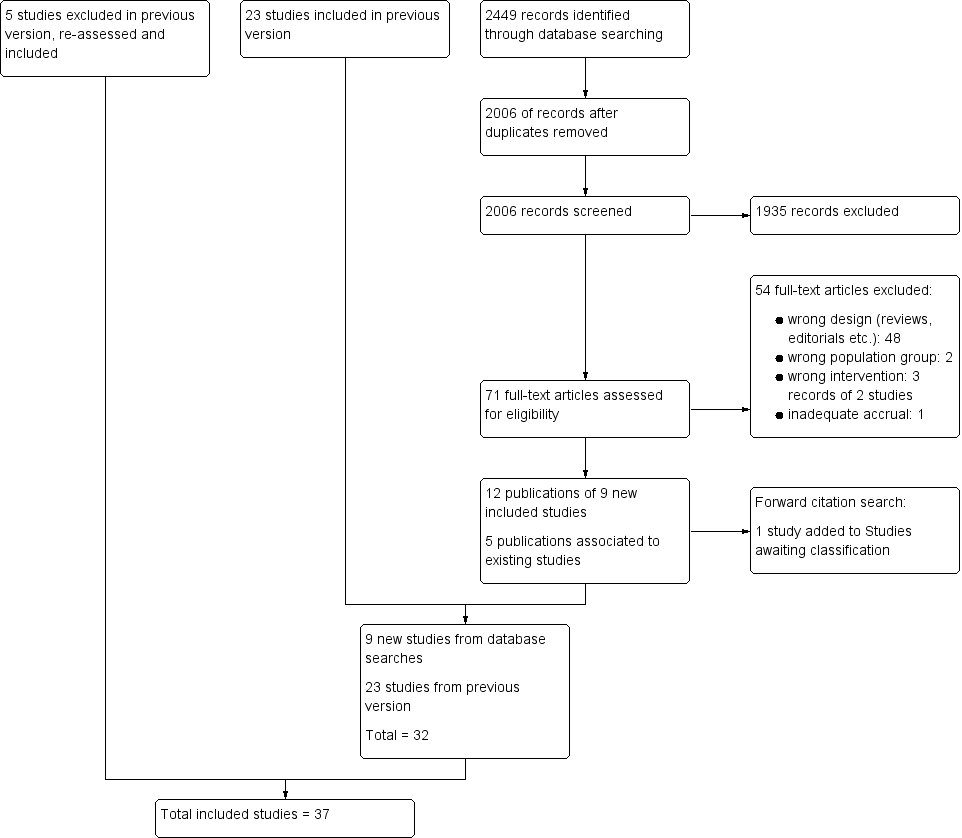
Study flow diagram.

Risk of bias graph: review authors' judgements about each risk of bias item presented as percentages across all 37 included studies.
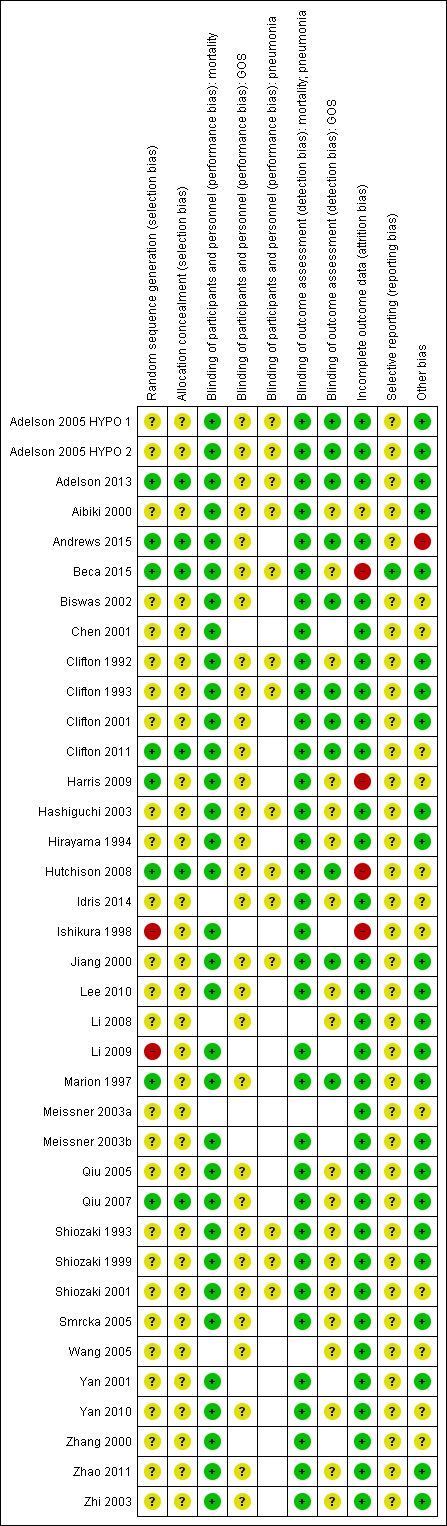
Risk of bias summary: review authors' judgements about each risk of bias item for each included study.
Note: blank spaces in risk of bias table indicate that the relevant outcome was not reported by study authors

Funnel plot of comparison 1: Therapeutic cooling versus no cooling, outcome: 1.1 Mortality.

Comparison 1 Therapeutic cooling versus no cooling, Outcome 1 Mortality.

Comparison 1 Therapeutic cooling versus no cooling, Outcome 2 Unfavourable outcome.

Comparison 1 Therapeutic cooling versus no cooling, Outcome 3 Pneumonia.

Comparison 2 Therapeutic cooling versus no cooling: by duration, Outcome 1 Mortality.

Comparison 2 Therapeutic cooling versus no cooling: by duration, Outcome 2 Unfavourable outcome.

Comparison 2 Therapeutic cooling versus no cooling: by duration, Outcome 3 Pneumonia.

Comparison 3 Therapeutic cooling versus no cooling: by length of follow‐up, Outcome 1 Mortality.

Comparison 3 Therapeutic cooling versus no cooling: by length of follow‐up, Outcome 2 Unfavourable outcome.
| Hypothermia for traumatic brain injury | |||
| Patient or population: patients with traumatic brain injury | |||
| Outcomes | No of Participants | Quality of the evidence | Comments |
| Mortality at end of follow‐up | 2944 | ⊕⊝⊝⊝ | Data not combined in meta‐analysis. Visual inspection of data showed variation in differences of effect not explained by subgroup analysis |
| Unfavourable outcome at end of follow‐up | 2620 | ⊕⊝⊝⊝ | Data not combined in meta‐analysis. Visual inspection of data showed variation in differences of effect not explained by subgroup analysis |
| Pneumonia | 693 | ⊕⊕⊝⊝ | Data not combined in meta‐analysis. Visual inspection of data showed variation in differences of effect |
| GRADE Working Group grades of evidence | |||
| aWe identified 33 studies that reported data for mortality, with comparable data available for 32 studies | |||
| Outcome or subgroup title | No. of studies | No. of participants | Statistical method | Effect size |
| 1 Mortality Show forest plot | 32 | Odds Ratio (M‐H, Fixed, 95% CI) | Subtotals only | |
| 2 Unfavourable outcome Show forest plot | 27 | Odds Ratio (M‐H, Fixed, 95% CI) | Subtotals only | |
| 3 Pneumonia Show forest plot | 12 | Odds Ratio (M‐H, Fixed, 95% CI) | Subtotals only | |
| Outcome or subgroup title | No. of studies | No. of participants | Statistical method | Effect size |
| 1 Mortality Show forest plot | 32 | Odds Ratio (M‐H, Fixed, 95% CI) | Totals not selected | |
| 1.1 24 hours | 4 | Odds Ratio (M‐H, Fixed, 95% CI) | 0.0 [0.0, 0.0] | |
| 1.2 More than 24 hours | 28 | Odds Ratio (M‐H, Fixed, 95% CI) | 0.0 [0.0, 0.0] | |
| 2 Unfavourable outcome Show forest plot | 26 | Odds Ratio (M‐H, Fixed, 95% CI) | Totals not selected | |
| 2.1 24 hours | 3 | Odds Ratio (M‐H, Fixed, 95% CI) | 0.0 [0.0, 0.0] | |
| 2.2 More than 24 hours | 23 | Odds Ratio (M‐H, Fixed, 95% CI) | 0.0 [0.0, 0.0] | |
| 3 Pneumonia Show forest plot | 12 | Odds Ratio (M‐H, Fixed, 95% CI) | Totals not selected | |
| 3.1 24 hours | 2 | Odds Ratio (M‐H, Fixed, 95% CI) | 0.0 [0.0, 0.0] | |
| 3.2 More than 24 hours | 10 | Odds Ratio (M‐H, Fixed, 95% CI) | 0.0 [0.0, 0.0] | |
| Outcome or subgroup title | No. of studies | No. of participants | Statistical method | Effect size |
| 1 Mortality Show forest plot | 32 | Risk Ratio (IV, Fixed, 95% CI) | Totals not selected | |
| 1.1 One month | 13 | Risk Ratio (IV, Fixed, 95% CI) | 0.0 [0.0, 0.0] | |
| 1.2 Three months | 6 | Risk Ratio (IV, Fixed, 95% CI) | 0.0 [0.0, 0.0] | |
| 1.3 Six months | 14 | Risk Ratio (IV, Fixed, 95% CI) | 0.0 [0.0, 0.0] | |
| 1.4 Twelve months or more | 7 | Risk Ratio (IV, Fixed, 95% CI) | 0.0 [0.0, 0.0] | |
| 2 Unfavourable outcome Show forest plot | 26 | Risk Ratio (IV, Fixed, 95% CI) | Totals not selected | |
| 2.1 Three months | 9 | Risk Ratio (IV, Fixed, 95% CI) | 0.0 [0.0, 0.0] | |
| 2.2 Six months | 15 | Risk Ratio (IV, Fixed, 95% CI) | 0.0 [0.0, 0.0] | |
| 2.3 Twelve months | 6 | Risk Ratio (IV, Fixed, 95% CI) | 0.0 [0.0, 0.0] | |