Scolaris Content Display Scolaris Content Display

Study flow diagram.
Figuras y tablas -
Figure 1

Study flow diagram.

Risk of bias summary: review authors' judgements about each risk of bias item for each included study.
Figuras y tablas -
Figure 2

Risk of bias summary: review authors' judgements about each risk of bias item for each included study.

original image
Figuras y tablas -
Figure 3

Forest plot of comparison: 1 Inhaled anti‐pseudomonal antibiotic versus placebo, outcome: 1.6 Mean change in FVC (% predicted).
Figuras y tablas -
Figure 4

Forest plot of comparison: 1 Inhaled anti‐pseudomonal antibiotic versus placebo, outcome: 1.6 Mean change in FVC (% predicted).

Comparison 1 Inhaled anti‐pseudomonal antibiotic (IAPA) versus placebo, Outcome 1 Mean absolute FEV1 (% predicted).
Figuras y tablas -
Analysis 1.1

Comparison 1 Inhaled anti‐pseudomonal antibiotic (IAPA) versus placebo, Outcome 1 Mean absolute FEV1 (% predicted).

Comparison 1 Inhaled anti‐pseudomonal antibiotic (IAPA) versus placebo, Outcome 2 Mean change in FEV1 (% predicted).
Figuras y tablas -
Analysis 1.2

Comparison 1 Inhaled anti‐pseudomonal antibiotic (IAPA) versus placebo, Outcome 2 Mean change in FEV1 (% predicted).

Comparison 1 Inhaled anti‐pseudomonal antibiotic (IAPA) versus placebo, Outcome 3 Mean change in % predicted FEV1.
Figuras y tablas -
Analysis 1.3

Comparison 1 Inhaled anti‐pseudomonal antibiotic (IAPA) versus placebo, Outcome 3 Mean change in % predicted FEV1.

Comparison 1 Inhaled anti‐pseudomonal antibiotic (IAPA) versus placebo, Outcome 4 Rate of change of FEV1 (% predicted per year).
Figuras y tablas -
Analysis 1.4

Comparison 1 Inhaled anti‐pseudomonal antibiotic (IAPA) versus placebo, Outcome 4 Rate of change of FEV1 (% predicted per year).

Comparison 1 Inhaled anti‐pseudomonal antibiotic (IAPA) versus placebo, Outcome 5 Mean absolute FVC (% predicted) at end of treatment.
Figuras y tablas -
Analysis 1.5

Comparison 1 Inhaled anti‐pseudomonal antibiotic (IAPA) versus placebo, Outcome 5 Mean absolute FVC (% predicted) at end of treatment.

Comparison 1 Inhaled anti‐pseudomonal antibiotic (IAPA) versus placebo, Outcome 6 Mean change in FVC (% predicted).
Figuras y tablas -
Analysis 1.6

Comparison 1 Inhaled anti‐pseudomonal antibiotic (IAPA) versus placebo, Outcome 6 Mean change in FVC (% predicted).

Comparison 1 Inhaled anti‐pseudomonal antibiotic (IAPA) versus placebo, Outcome 7 Rate of change of FVC (% predicted per year).
Figuras y tablas -
Analysis 1.7

Comparison 1 Inhaled anti‐pseudomonal antibiotic (IAPA) versus placebo, Outcome 7 Rate of change of FVC (% predicted per year).

Comparison 1 Inhaled anti‐pseudomonal antibiotic (IAPA) versus placebo, Outcome 8 Frequency of one or more hospital admissions.
Figuras y tablas -
Analysis 1.8

Comparison 1 Inhaled anti‐pseudomonal antibiotic (IAPA) versus placebo, Outcome 8 Frequency of one or more hospital admissions.

Comparison 1 Inhaled anti‐pseudomonal antibiotic (IAPA) versus placebo, Outcome 9 Hospital admissions, mean number of days in hospital.
Figuras y tablas -
Analysis 1.9

Comparison 1 Inhaled anti‐pseudomonal antibiotic (IAPA) versus placebo, Outcome 9 Hospital admissions, mean number of days in hospital.

Comparison 1 Inhaled anti‐pseudomonal antibiotic (IAPA) versus placebo, Outcome 10 Frequency of one or more courses of intravenous antibiotics.
Figuras y tablas -
Analysis 1.10

Comparison 1 Inhaled anti‐pseudomonal antibiotic (IAPA) versus placebo, Outcome 10 Frequency of one or more courses of intravenous antibiotics.

Comparison 1 Inhaled anti‐pseudomonal antibiotic (IAPA) versus placebo, Outcome 11 Pulmonary exacerbations.
Figuras y tablas -
Analysis 1.11

Comparison 1 Inhaled anti‐pseudomonal antibiotic (IAPA) versus placebo, Outcome 11 Pulmonary exacerbations.

Comparison 1 Inhaled anti‐pseudomonal antibiotic (IAPA) versus placebo, Outcome 12 Lost school or working days.
Figuras y tablas -
Analysis 1.12

Comparison 1 Inhaled anti‐pseudomonal antibiotic (IAPA) versus placebo, Outcome 12 Lost school or working days.

Comparison 1 Inhaled anti‐pseudomonal antibiotic (IAPA) versus placebo, Outcome 13 Deaths.
Figuras y tablas -
Analysis 1.13

Comparison 1 Inhaled anti‐pseudomonal antibiotic (IAPA) versus placebo, Outcome 13 Deaths.

Comparison 1 Inhaled anti‐pseudomonal antibiotic (IAPA) versus placebo, Outcome 14 Frequency of tobramycin‐resistant P. aeruginosa at end of study.
Figuras y tablas -
Analysis 1.14

Comparison 1 Inhaled anti‐pseudomonal antibiotic (IAPA) versus placebo, Outcome 14 Frequency of tobramycin‐resistant P. aeruginosa at end of study.

Comparison 1 Inhaled anti‐pseudomonal antibiotic (IAPA) versus placebo, Outcome 15 Frequency of new isolates of drug resistant organisms (at end of study).
Figuras y tablas -
Analysis 1.15

Comparison 1 Inhaled anti‐pseudomonal antibiotic (IAPA) versus placebo, Outcome 15 Frequency of new isolates of drug resistant organisms (at end of study).

Comparison 1 Inhaled anti‐pseudomonal antibiotic (IAPA) versus placebo, Outcome 16 Number experiencing adverse event (at end of study).
Figuras y tablas -
Analysis 1.16

Comparison 1 Inhaled anti‐pseudomonal antibiotic (IAPA) versus placebo, Outcome 16 Number experiencing adverse event (at end of study).

Comparison 2 Colistimethate sodium dry powder (CDPI) versus tobramycin for inhalation solution (TIS), Outcome 1 Number of pulmonary exacerbations.
Figuras y tablas -
Analysis 2.1

Comparison 2 Colistimethate sodium dry powder (CDPI) versus tobramycin for inhalation solution (TIS), Outcome 1 Number of pulmonary exacerbations.

Comparison 2 Colistimethate sodium dry powder (CDPI) versus tobramycin for inhalation solution (TIS), Outcome 2 Time to first pulmonary exacerbation.
Figuras y tablas -
Analysis 2.2

Comparison 2 Colistimethate sodium dry powder (CDPI) versus tobramycin for inhalation solution (TIS), Outcome 2 Time to first pulmonary exacerbation.

Comparison 2 Colistimethate sodium dry powder (CDPI) versus tobramycin for inhalation solution (TIS), Outcome 3 Deaths.
Figuras y tablas -
Analysis 2.3

Comparison 2 Colistimethate sodium dry powder (CDPI) versus tobramycin for inhalation solution (TIS), Outcome 3 Deaths.

Comparison 2 Colistimethate sodium dry powder (CDPI) versus tobramycin for inhalation solution (TIS), Outcome 4 Adverse events (at end of study).
Figuras y tablas -
Analysis 2.4

Comparison 2 Colistimethate sodium dry powder (CDPI) versus tobramycin for inhalation solution (TIS), Outcome 4 Adverse events (at end of study).

Comparison 3 Inhaled TOBI® (IV preparation) versus tobramycin for inhalation solution (TIS), Outcome 1 FEV1 % predicted.
Figuras y tablas -
Analysis 3.1

Comparison 3 Inhaled TOBI® (IV preparation) versus tobramycin for inhalation solution (TIS), Outcome 1 FEV1 % predicted.

Comparison 3 Inhaled TOBI® (IV preparation) versus tobramycin for inhalation solution (TIS), Outcome 2 FVC.
Figuras y tablas -
Analysis 3.2

Comparison 3 Inhaled TOBI® (IV preparation) versus tobramycin for inhalation solution (TIS), Outcome 2 FVC.

Comparison 4 Tobramycin inhalation powder (TIP) versus tobramycin for inhalation solution (TIS), Outcome 1 FEV1 (% predicted) relative change.
Figuras y tablas -
Analysis 4.1

Comparison 4 Tobramycin inhalation powder (TIP) versus tobramycin for inhalation solution (TIS), Outcome 1 FEV1 (% predicted) relative change.

Comparison 4 Tobramycin inhalation powder (TIP) versus tobramycin for inhalation solution (TIS), Outcome 2 Hospitalisations.
Figuras y tablas -
Analysis 4.2

Comparison 4 Tobramycin inhalation powder (TIP) versus tobramycin for inhalation solution (TIS), Outcome 2 Hospitalisations.

Comparison 4 Tobramycin inhalation powder (TIP) versus tobramycin for inhalation solution (TIS), Outcome 3 Pulmonary exacerbations.
Figuras y tablas -
Analysis 4.3

Comparison 4 Tobramycin inhalation powder (TIP) versus tobramycin for inhalation solution (TIS), Outcome 3 Pulmonary exacerbations.

Comparison 4 Tobramycin inhalation powder (TIP) versus tobramycin for inhalation solution (TIS), Outcome 4 Deaths.
Figuras y tablas -
Analysis 4.4

Comparison 4 Tobramycin inhalation powder (TIP) versus tobramycin for inhalation solution (TIS), Outcome 4 Deaths.

Comparison 4 Tobramycin inhalation powder (TIP) versus tobramycin for inhalation solution (TIS), Outcome 5 Adverse events (at end of study).
Figuras y tablas -
Analysis 4.5

Comparison 4 Tobramycin inhalation powder (TIP) versus tobramycin for inhalation solution (TIS), Outcome 5 Adverse events (at end of study).

Comparison 5 Inhaled aztreonam lysine (AZLI) versus tobramycin for inhalation solution (TIS), Outcome 1 FEV1 % predicted ‐ mean relative change from baseline.
Figuras y tablas -
Analysis 5.1

Comparison 5 Inhaled aztreonam lysine (AZLI) versus tobramycin for inhalation solution (TIS), Outcome 1 FEV1 % predicted ‐ mean relative change from baseline.

Comparison 5 Inhaled aztreonam lysine (AZLI) versus tobramycin for inhalation solution (TIS), Outcome 2 FEV1 % predicted ‐ mean actual change from baseline.
Figuras y tablas -
Analysis 5.2

Comparison 5 Inhaled aztreonam lysine (AZLI) versus tobramycin for inhalation solution (TIS), Outcome 2 FEV1 % predicted ‐ mean actual change from baseline.

Comparison 5 Inhaled aztreonam lysine (AZLI) versus tobramycin for inhalation solution (TIS), Outcome 3 Need for additional antibiotics.
Figuras y tablas -
Analysis 5.3

Comparison 5 Inhaled aztreonam lysine (AZLI) versus tobramycin for inhalation solution (TIS), Outcome 3 Need for additional antibiotics.

Comparison 5 Inhaled aztreonam lysine (AZLI) versus tobramycin for inhalation solution (TIS), Outcome 4 Number of days of additional antibiotics.
Figuras y tablas -
Analysis 5.4

Comparison 5 Inhaled aztreonam lysine (AZLI) versus tobramycin for inhalation solution (TIS), Outcome 4 Number of days of additional antibiotics.

Comparison 5 Inhaled aztreonam lysine (AZLI) versus tobramycin for inhalation solution (TIS), Outcome 5 Weight (relative change from baseline).
Figuras y tablas -
Analysis 5.5

Comparison 5 Inhaled aztreonam lysine (AZLI) versus tobramycin for inhalation solution (TIS), Outcome 5 Weight (relative change from baseline).

Comparison 5 Inhaled aztreonam lysine (AZLI) versus tobramycin for inhalation solution (TIS), Outcome 6 Quality of Life ‐ CFQR respiratory symptom scale.
Figuras y tablas -
Analysis 5.6

Comparison 5 Inhaled aztreonam lysine (AZLI) versus tobramycin for inhalation solution (TIS), Outcome 6 Quality of Life ‐ CFQR respiratory symptom scale.

Comparison 5 Inhaled aztreonam lysine (AZLI) versus tobramycin for inhalation solution (TIS), Outcome 7 TSQM ‐ effectiveness.
Figuras y tablas -
Analysis 5.7

Comparison 5 Inhaled aztreonam lysine (AZLI) versus tobramycin for inhalation solution (TIS), Outcome 7 TSQM ‐ effectiveness.

Comparison 5 Inhaled aztreonam lysine (AZLI) versus tobramycin for inhalation solution (TIS), Outcome 8 TSQM ‐ global satisfaction.
Figuras y tablas -
Analysis 5.8

Comparison 5 Inhaled aztreonam lysine (AZLI) versus tobramycin for inhalation solution (TIS), Outcome 8 TSQM ‐ global satisfaction.

Comparison 5 Inhaled aztreonam lysine (AZLI) versus tobramycin for inhalation solution (TIS), Outcome 9 TSQM ‐ side effects.
Figuras y tablas -
Analysis 5.9

Comparison 5 Inhaled aztreonam lysine (AZLI) versus tobramycin for inhalation solution (TIS), Outcome 9 TSQM ‐ side effects.

Comparison 5 Inhaled aztreonam lysine (AZLI) versus tobramycin for inhalation solution (TIS), Outcome 10 TSQM ‐ convenience.
Figuras y tablas -
Analysis 5.10

Comparison 5 Inhaled aztreonam lysine (AZLI) versus tobramycin for inhalation solution (TIS), Outcome 10 TSQM ‐ convenience.

Comparison 5 Inhaled aztreonam lysine (AZLI) versus tobramycin for inhalation solution (TIS), Outcome 11 Log10Pseudomonas aeruginosa CFU/g sputum.
Figuras y tablas -
Analysis 5.11

Comparison 5 Inhaled aztreonam lysine (AZLI) versus tobramycin for inhalation solution (TIS), Outcome 11 Log10Pseudomonas aeruginosa CFU/g sputum.

Comparison 5 Inhaled aztreonam lysine (AZLI) versus tobramycin for inhalation solution (TIS), Outcome 12 Adverse events (at end of study).
Figuras y tablas -
Analysis 5.12

Comparison 5 Inhaled aztreonam lysine (AZLI) versus tobramycin for inhalation solution (TIS), Outcome 12 Adverse events (at end of study).

Comparison 6 Levofloxacin for inhalation solution (LIS) versus tobramycin for inhalation solution (TIS), Outcome 1 Absolute change in FEV1 % predicted.
Figuras y tablas -
Analysis 6.1

Comparison 6 Levofloxacin for inhalation solution (LIS) versus tobramycin for inhalation solution (TIS), Outcome 1 Absolute change in FEV1 % predicted.

Comparison 6 Levofloxacin for inhalation solution (LIS) versus tobramycin for inhalation solution (TIS), Outcome 2 Relative change in FEV1 % predicted.
Figuras y tablas -
Analysis 6.2

Comparison 6 Levofloxacin for inhalation solution (LIS) versus tobramycin for inhalation solution (TIS), Outcome 2 Relative change in FEV1 % predicted.

Comparison 6 Levofloxacin for inhalation solution (LIS) versus tobramycin for inhalation solution (TIS), Outcome 3 Absolute change in FVC % predicted.
Figuras y tablas -
Analysis 6.3

Comparison 6 Levofloxacin for inhalation solution (LIS) versus tobramycin for inhalation solution (TIS), Outcome 3 Absolute change in FVC % predicted.

Comparison 6 Levofloxacin for inhalation solution (LIS) versus tobramycin for inhalation solution (TIS), Outcome 4 Relative change in FVC % predicted.
Figuras y tablas -
Analysis 6.4

Comparison 6 Levofloxacin for inhalation solution (LIS) versus tobramycin for inhalation solution (TIS), Outcome 4 Relative change in FVC % predicted.

Comparison 6 Levofloxacin for inhalation solution (LIS) versus tobramycin for inhalation solution (TIS), Outcome 5 Hospitalisations due to respiratory exacerbations.
Figuras y tablas -
Analysis 6.5

Comparison 6 Levofloxacin for inhalation solution (LIS) versus tobramycin for inhalation solution (TIS), Outcome 5 Hospitalisations due to respiratory exacerbations.

Comparison 6 Levofloxacin for inhalation solution (LIS) versus tobramycin for inhalation solution (TIS), Outcome 6 Weight decrease.
Figuras y tablas -
Analysis 6.6

Comparison 6 Levofloxacin for inhalation solution (LIS) versus tobramycin for inhalation solution (TIS), Outcome 6 Weight decrease.

Comparison 6 Levofloxacin for inhalation solution (LIS) versus tobramycin for inhalation solution (TIS), Outcome 7 Change in P aeruginosa sputum density (log10 CFU/g).
Figuras y tablas -
Analysis 6.7

Comparison 6 Levofloxacin for inhalation solution (LIS) versus tobramycin for inhalation solution (TIS), Outcome 7 Change in P aeruginosa sputum density (log10 CFU/g).

Comparison 6 Levofloxacin for inhalation solution (LIS) versus tobramycin for inhalation solution (TIS), Outcome 8 Adverse events (at end of study).
Figuras y tablas -
Analysis 6.8

Comparison 6 Levofloxacin for inhalation solution (LIS) versus tobramycin for inhalation solution (TIS), Outcome 8 Adverse events (at end of study).

Comparison 7 Continuous aztreonam (AZLI)/tobramycin (TIS) versus intermittent tobramycin (TIS), Outcome 1 Mean change from baseline ‐ FEV1 % predicted.
Figuras y tablas -
Analysis 7.1

Comparison 7 Continuous aztreonam (AZLI)/tobramycin (TIS) versus intermittent tobramycin (TIS), Outcome 1 Mean change from baseline ‐ FEV1 % predicted.

Comparison 7 Continuous aztreonam (AZLI)/tobramycin (TIS) versus intermittent tobramycin (TIS), Outcome 2 Rate of hospitalisation per participant year.
Figuras y tablas -
Analysis 7.2

Comparison 7 Continuous aztreonam (AZLI)/tobramycin (TIS) versus intermittent tobramycin (TIS), Outcome 2 Rate of hospitalisation per participant year.

Comparison 7 Continuous aztreonam (AZLI)/tobramycin (TIS) versus intermittent tobramycin (TIS), Outcome 3 Need for additional antibiotics for an exacerbation.
Figuras y tablas -
Analysis 7.3

Comparison 7 Continuous aztreonam (AZLI)/tobramycin (TIS) versus intermittent tobramycin (TIS), Outcome 3 Need for additional antibiotics for an exacerbation.

Comparison 7 Continuous aztreonam (AZLI)/tobramycin (TIS) versus intermittent tobramycin (TIS), Outcome 4 Rate of protocol defined pulmonary exacerbations per participant year.
Figuras y tablas -
Analysis 7.4

Comparison 7 Continuous aztreonam (AZLI)/tobramycin (TIS) versus intermittent tobramycin (TIS), Outcome 4 Rate of protocol defined pulmonary exacerbations per participant year.

Comparison 7 Continuous aztreonam (AZLI)/tobramycin (TIS) versus intermittent tobramycin (TIS), Outcome 5 Quality of life ‐ CFQ‐R respiratory symptom score.
Figuras y tablas -
Analysis 7.5

Comparison 7 Continuous aztreonam (AZLI)/tobramycin (TIS) versus intermittent tobramycin (TIS), Outcome 5 Quality of life ‐ CFQ‐R respiratory symptom score.

Comparison 7 Continuous aztreonam (AZLI)/tobramycin (TIS) versus intermittent tobramycin (TIS), Outcome 6 Incidence of other respiratory pathogens (at end of study).
Figuras y tablas -
Analysis 7.6

Comparison 7 Continuous aztreonam (AZLI)/tobramycin (TIS) versus intermittent tobramycin (TIS), Outcome 6 Incidence of other respiratory pathogens (at end of study).

Comparison 7 Continuous aztreonam (AZLI)/tobramycin (TIS) versus intermittent tobramycin (TIS), Outcome 7 Adverse events (at end of study).
Figuras y tablas -
Analysis 7.7

Comparison 7 Continuous aztreonam (AZLI)/tobramycin (TIS) versus intermittent tobramycin (TIS), Outcome 7 Adverse events (at end of study).

Comparison 7 Continuous aztreonam (AZLI)/tobramycin (TIS) versus intermittent tobramycin (TIS), Outcome 8 Treatment‐emergent adverse events (at end of study).
Figuras y tablas -
Analysis 7.8

Comparison 7 Continuous aztreonam (AZLI)/tobramycin (TIS) versus intermittent tobramycin (TIS), Outcome 8 Treatment‐emergent adverse events (at end of study).

Summary of findings for the main comparison. Summary of findings: anti‐pseudomonal antibiotics versus placebo

Anti‐pseudomonal antibiotics compared with placebo for long‐term therapy in CF

Patient population: adults and children with CF and P aeruginosa

Settings: outpatients

Intervention: inhaled anti‐pseudomonal antibiotics

Comparison: placebo

Outcomes

Illustrative comparative risks* (95% CI)

Relative effect
(95% CI)

No of participants
(studies)

Quality of the evidence
(GRADE)

Comments

Assumed risk

Corresponding risk

Placebo

Inhaled anti‐pseudomonal antibiotics

FEV1 (% predicted)

Follow‐up: at 3 months and up to 36 months

4 trials found a significant improvement in FEV1 with inhaled antibiotics compared to placebo, although no data were available for 3 of these.

1 trial reported that the rate of decline in FEV1 favoured antibiotics.

The remaining 6 trials showed no significant difference between inhaled antibiotics and placebo.

NA

1130
(11)

⊕⊕⊝⊝
low1

The included trials all measured FEV1 but in different ways and for different lengths of time. It was not possible to combine the trials in a meta‐analysis.

FVC (% predicted)

Follow‐up: at 3 months and up to 36 months

5 of the 10 trials found significant changes in FVC at the end of the trial period, favouring inhaled antibiotics when compared to placebo.

1 trial found no significant difference in absolute values of FVC % predicted between inhaled antibiotics and control but found that mean change in FVC % predicted was significantly different (favouring antibiotics).

1 trial found a combination of gentamycin and carbenicillin versus placebo to be significantly different and favouring antibiotics yet ceftazidime versus placebo was not significantly different.

3 trials found no significant difference between antibiotics and placebo with regard to FVC % predicted.

NA

1097
(10)

⊕⊕⊝⊝
low1

FVC was measured differently across the trials.

Pulmonary exacerbations: frequency of one or more hospital admissions

Follow‐up: over 3 months and up to 12 months

397 per 1000

262 per 1000
(187 to 369 per 1000)

RR 0.66 (0.47 to 0.93)

946
(3)

⊕⊕⊝⊝
low1

Quality of life:

lost school or working days.

Follow‐up: over 3 months and up to 12 months

The mean number of lost school or working days in the control group was 10 days.

The mean number of lost school or working days in the inhaled antibiotic group was 5.3 days lower (8.59 lower to 2.01 lower).

NA

245
(1)

⊕⊕⊝⊝
low2,3

Survival: number of deaths

Follow‐up: over 3 months and up to 12 months

17 per 1000

3 per 1000
(1 to 19 per 1000)

RR 0.17 (0.03 to 1.09)

767
(2)

⊕⊕⊝⊝
low2,3

Antibiotic resistance: frequency of tobramycin‐resistant P aeruginosa

Follow‐up: at end of trial (12 months)

105 per 1000

205 per 1000
(90 to 464 per 1000)

RR 1.95 (0.86 to 4.42)

672
(2)

⊕⊕⊕⊝
moderate2

Adverse events

Follow‐up: at the end of the trial (84 days to 33 months)

There were no significant differences between inhaled antibiotics and placebo for auditory impairment, pneumothorax, haemoptysis.

Tinnitus and voice alteration were significantly more common in the inhaled antibiotics groups.

NA

1014

(6)

⊕⊝⊝⊝
very low1,3

Rate of auditory impairment reported in 5 trials for 996 participants.

Rate of pneumothorax reported in 3 trials for 558 participants.

Rate of haemoptysis reported in 1 trial for 520 participants.

Rate of tinnitus reported in 1 trial for 520 participants.

Rate of voice alteration reported in 2 trials for 701 participants.

*The basis for the assumed risk (e.g. the median control group risk across studies) is provided in footnotes. The corresponding risk (and its 95% CI) is based on the assumed risk in the comparison group and the relative effect of the intervention (and its 95% CI).
CF: cystic fibrosis; CI: confidence interval; FEV1 : forced expiratory volume at 1 second; FVC: forced vital capacity; P aeruginosa: Pseudomonas aeruginosa; RR: risk ratio.

GRADE Working Group grades of evidence
High quality: further research is very unlikely to change our confidence in the estimate of effect.
Moderate quality: further research is likely to have an important impact on our confidence in the estimate of effect and may change the estimate.
Low quality: further research is very likely to have an important impact on our confidence in the estimate of effect and is likely to change the estimate.
Very low quality: we are very uncertain about the estimate.

1. Downgraded twice due to most trials included in the comparison being at unclear or high risk of bias. Three trials were at high or unclear risk of bias across all domains. All of the 11 trials were at high or unclear risk of bias for randomisation or allocation concealment (or both) and also blinding of participants or outcome assessors (or both).
2. Downgraded once because of unclear risk of bias across some domains (randomisation or allocation concealment (or both) and blinding of participants or outcome assessment (or both)) of the included trials.
3. Downgraded once due to imprecision due to low event rates.

Figuras y tablas -
Summary of findings for the main comparison. Summary of findings: anti‐pseudomonal antibiotics versus placebo
Summary of findings 2. Summary of findings: colistimethate dry powder for inhalation (Colobreathe®) versus tobramycin for inhalation solution

Colistimethate dry powder (Colobreathe®) compared with TIS for long‐term therapy in CF

Patient population: children and adults with CF and P aeruginosa infection

Settings: outpatients

Intervention: colistimethate dry powder for inhalation (one 1.6625 MU capsule twice daily for 24 weeks)

Comparison: TIS (3 cycles of 28‐days of TIS (300 mg/5 mL) twice daily followed by a 28‐day off period)

Outcomes

Illustrative comparative risks* (95% CI)

Relative effect
(95% CI)

No of participants
(studies)

Quality of the evidence
(GRADE)

Comments

Assumed risk

Corresponding risk

TIS

Colistimethate dry powder for inhalation (Colobreathe®)

FEV1 (% predicted):

mean change from baseline

Follow‐up: 24 weeks

Adjusted mean difference between the groups (ITT population LOCF) for the change in FEV1 % predicted, MD ‐0.98% (95% CI‐2.74% to 0.86%).

There was no significant difference between the 2 groups for this outcome.

NA

374
(1)

⊕⊕⊝⊝
low1,2

The data were not normally distributed and were analysed using log‐transformation analysis. We have reported the results directly from the paper.

FVC (% predicted):

mean change from baseline

Follow‐up: 24 weeks

There was no significant difference between groups for FVC % predicted in the ITT population (LOCF), MD 0.01 L (95% CI ‐0.09 to 0.10).

NA

374

(1)

⊕⊕⊝⊝
low1,2

The data were not normally distributed and were analysed using log‐transformation analysis. We have reported the results directly from the paper.

Pulmonary exacerbations: number of pulmonary exacerbations

Follow‐up: 24 weeks

262 per 1000

312 per 1000
(225 to 430 per 1000)

RR 1.19 (0.86 to 1.64)

374
(1)

⊕⊕⊕⊝
moderate1

Quality of life: adjusted mean change in CFQ‐R score at the end of treatment

Follow‐up: 24 weeks

The adjusted mean changes at the end of the trial favoured the Colobreathe® group in terms of treatment burden (P = 0.091).

This difference was significant at Week 4 (P < 0.001).

NA

374
(1)

⊕⊕⊝⊝
low1,3

The trial was not powered to detect differences in overall quality of life.

Results reported directly from paper.

Survival:

number of deaths

Follow‐up: over 3 months and up to 12 months

10 per 1000

2 per 1000
(0 to 43 per 1000)

RR 0.21 (0.01 to 4.32)

374
(1)

⊕⊕⊝⊝
low1,4

Antibiotic resistance:

change in mean MIC50 and MIC90 at the end of the trial

Follow‐up: 24 weeks

The mean MIC50 (breakpoint of ≥ 8 mg/L) changed in the TIS group by 0.5 compared to 0.0 in the Colobreathe® group.

The mean MIC90 (breakpoint of ≥ 8 mg/L) changed in the both groups by 4.0

NA

374

(1)

⊕⊕⊝⊝
low1,3

Adverse events: number of treatment related adverse events.

Follow‐up: 24 weeks

466 per 1000

820 per 1000
(699 to 969 per 1000)

RR 1.76

(1.50 to 2.08)

379
(1)

⊕⊕⊝⊝
low1,4

Treatment‐related adverse events were significantly lower in the TIS group than the Colobreathe® group P < 0.0001.

*The basis for the assumed risk (e.g. the median control group risk across studies) is provided in footnotes. The corresponding risk (and its 95% CI) is based on the assumed risk in the comparison group and the relative effect of the intervention (and its 95% CI).
CI: confidence interval; FEV1 : forced expiratory volume at 1 second; FVC: forced vital capacity; ITT: intention‐to‐treat; LOCF: last observation carried forward; MIC: minimum inhibitory concentration; P aeruginosa: Pseudomonas aeruginosa; RR: risk ratio; TIS: tobramycin for inhalation solution.

GRADE Working Group grades of evidence
High quality: further research is very unlikely to change our confidence in the estimate of effect.
Moderate quality: further research is likely to have an important impact on our confidence in the estimate of effect and may change the estimate.
Low quality: further research is very likely to have an important impact on our confidence in the estimate of effect and is likely to change the estimate.
Very low quality: we are very uncertain about the estimate.

1. Downgraded once due to an unclear or high risk of bias across four out of the seven domains, particularly randomisation, allocation concealment and participant blinding.
2. Downgraded once due to LOCF analysis increasing risk of bias
3. Downgraded once for imprecision; the trial was underpowered to detect differences in overall quality of life.
4. Downgraded once for imprecision due to low event rates.

Figuras y tablas -
Summary of findings 2. Summary of findings: colistimethate dry powder for inhalation (Colobreathe®) versus tobramycin for inhalation solution
Summary of findings 3. Summary of findings: inhaled TOBI® (IV preparation) versus tobramycin for inhalation solution

Inhaled TOBI® (IV preparation) compared with TIS for long‐term therapy in CF

Patient population: adults and children with CF and P aeruginosa

Settings: outpatients

Intervention: TIS intermittent (four‐weekly on‐off cycles) twice‐daily 300 mg/5 mL

Comparison: inhaled tobramycin (TOBI®) (IV preparation) continuous twice‐daily 80 mg

Outcomes

Illustrative comparative risks* (95% CI)

Relative effect
(95% CI)

No of participants
(studies)

Quality of the evidence
(GRADE)

Comments

Assumed risk

Corresponding risk

TIS intermittent

Inhaled tobramycin (IV preparation) continuous

FEV1 (% predicted):

change from baseline

Follow‐up: the end of the first treatment phase (12 weeks)

The change from baseline in FEV1 % predicted was on average 1.07% less in the TIS group than in the inhaled tobramycin (IV preparation) group, values ranged from 11.20% less to 9.06% higher.

NA

32
(1)

⊕⊝⊝⊝
very low1,2

Trial investigators provided individual participant data for lung function and we have analysed the first‐period data ourselves using the generic inverse variance method in RevMan.

FVC (% predicted):

change from baseline

Follow‐up: the end of the first treatment phase (12 weeks)

The change from baseline in FVC % predicted was on average 0.01% more in the TIS group than in the inhaled tobramycin (IV preparation) group, values ranged from 9.48% less to 9.50% higher.

NA

32
(1)

⊕⊝⊝⊝
very low1,2

Trial investigators provided individual participant data for lung function and we have analysed the first‐period data ourselves using the generic inverse variance method in RevMan.

Pulmonary exacerbations

Follow‐up: NA

Outcome not reported.

NA

Quality of life

Follow‐up: NA

Outcome not reported.

NA

Survival

Follow‐up: NA

Outcome not reported.

NA

Antibiotic resistance

Follow‐up: NA

Outcome not reported.

NA

Adverse events

Follow‐up: NA

Outcome not reported.

NA

*The basis for the assumed risk (e.g. the median control group risk across studies) is provided in footnotes. The corresponding risk (and its 95% CI is based on the assumed risk in the comparison group and the relative effect of the intervention (and its 95% CI).
CI: confidence interval; FEV1: forced expiratory volume at 1 second; FVC: forced vital capacity; IV: intravenous; NA: not applicable; P aeruginosa :Pseudomonas aeruginosa;TIS: tobramycin for inhalation solution.

GRADE Working Group grades of evidence
High quality: further research is very unlikely to change our confidence in the estimate of effect.
Moderate quality: further research is likely to have an important impact on our confidence in the estimate of effect and may change the estimate.
Low quality: further research is very likely to have an important impact on our confidence in the estimate of effect and is likely to change the estimate.
Very low quality: we are very uncertain about the estimate.

1. Downgraded twice due to risk of bias being unclear or high across all of the domains. The trial was at risk due to lack of blinding of participants or outcome measurement. This was because of the interventions being significantly different making it impossible to blind. Some outcomes (sputum bacteriology and oxygen saturation) were listed in the methods but not reported in the results.
2. Downgraded once due to imprecision. The sample size was small as only the first arm of a cross‐over trial was used.

Figuras y tablas -
Summary of findings 3. Summary of findings: inhaled TOBI® (IV preparation) versus tobramycin for inhalation solution
Summary of findings 4. Summary of findings: tobramycin for inhalation powder versus tobramycin for inhalation solution

TIP compared with TIS for long‐term therapy in CF

Patient population: children and adults with CF and P aeruginosa

Settings: outpatients

Intervention: TIP twice‐daily 4 capsules (total of 112 mg) (3 cycles (28 days on‐drug, 28 days off‐drug))

Comparison: TIS twice‐daily 300 mg/5 mL

Outcomes

Illustrative comparative risks* (95% CI)

Relative effect
(95% CI)

No of participants
(studies)

Quality of the evidence
(GRADE)

Comments

Assumed risk

Corresponding risk

TIS

TIP

FEV1 (% predicted): relative change from baseline

Follow‐up: 24 weeks

The MD between the 2 groups was 1.10 (95% CI ‐2.33 to 4.53) favouring TIS, but not significantly.

NA

517
(1)

⊕⊕⊕⊝
moderate1

TIP was found to be non‐inferior to TIS.

FVC

Follow‐up: NA

Outcome not reported.

NA

Pulmonary exacerbations: number of participants experiencing pulmonary exacerbation

Follow‐up: 24 weeks

301 per 1000

337 per 1000

(259 to 436 per 1000)

RR 1.12 (0.86 to 1.45)

517
(1)

⊕⊕⊕⊝
moderate1

Survival:

number of deaths

Follow‐up: 24 weeks

Not calculable as there were no deaths in the TIS group.

There were 3 deaths in the TIP group.

RR 4.76 (0.25 to 91.62)

517
(1)

⊕⊕⊝⊝
low1,2

Antibiotic resistance: mean change from baseline in P aeruginosa sputum density

Follow‐up: 24 weeks

Mucoid and non‐mucoid P aeruginosa sputum densities showed a decrease from baseline in both groups at all time points. Mean change was ‐1.6 versus ‐0.92 log10 CFU/g for mucoid phenotype and ‐1.77 versus ‐0.73 log10 CFU/g for non‐mucoid phenotype.

NA

517

(1)

⊕⊕⊕⊝
moderate1

Adverse events: number of any adverse event reported

Follow‐up: 24 weeks

842 per 1000

901 per 1000
(842 to 968 per 1000)

RR 1.07

(1.00 to 1.15)

517
(1)

⊕⊕⊕⊝
moderate1

A range of adverse events were reported but the only adverse events which were significantly different between the two groups were

favouring TIS

  • cough: RR 1.56 (95% CI (1.23, 1.96))

  • hoarseness: 3.56 (95% CI (1.71, 7.43))

*The basis for the assumed risk (e.g. the median control group risk across studies) is provided in footnotes. The corresponding risk (and its 95% CI) is based on the assumed risk in the comparison group and the relative effect of the intervention (and its 95% CI).
CFU: colony forming units; CI: confidence interval; FEV1 : forced expiratory volume at 1 second; FVC: forced vital capacity; MD: mean difference; P aeruginosa : Pseudomonas aeruginosa; RR: risk ratio; TIP: tobramycin inhalation powder TIS: tobramycin for inhalation solution.

GRADE Working Group grades of evidence
High quality: further research is very unlikely to change our confidence in the estimate of effect.
Moderate quality: further research is likely to have an important impact on our confidence in the estimate of effect and may change the estimate.
Low quality: further research is very likely to have an important impact on our confidence in the estimate of effect and is likely to change the estimate.
Very low quality: we are very uncertain about the estimate.

1. Downgraded once due to risk of bias within the trial. This was an open‐label trial and so was at high risk of bias for blinding and had an unclear risk for randomisation and allocation concealment.
2. Downgraded once for imprecision due to low event rates.

Figuras y tablas -
Summary of findings 4. Summary of findings: tobramycin for inhalation powder versus tobramycin for inhalation solution
Summary of findings 5. Summary of findings: aztreonam lysine for inhalation versus tobramycin for inhalation solution

TIS compared with AZLI for long‐term therapy in CF

Patient population: children and adults with CF and P aeruginosa

Settings: outpatients

Intervention: AZLI 75 mg 3 times daily

Comparison: TIS 300 mg twice‐daily

Outcomes

Illustrative comparative risks* (95% CI)

Relative effect
(95% CI)

No of participants
(studies)

Quality of the evidence
(GRADE)

Comments

Assumed risk

Corresponding risk

TIS

AZLI

FEV1 (% predicted):

mean relative change from baseline averaged across 3 cycles

Follow‐up: 24 weeks

The MD between groups was ‐3.40 (95% CI ‐6.63 to ‐0.17), favouring AZLI.

NA

268
(1)

⊕⊕⊕⊝
moderate1

Pulmonary exacerbations: need for additional antibiotics.

Follow‐up: 24 weeks

576 per 1000

380 per 1000
(294 to 495 per 1000)

RR 0.66

(0.51 to 0.86)

268
(1)

⊕⊕⊕⊝
moderate1

Quality of life:

mean change from baseline in CFQ‐R respiratory symptom scale averaged across 3 cycles.

Follow‐up: 24 weeks

The mean (SD) change in CFQ‐R score was 2.2 (17.7) in the TIS group.

The mean change in CFQ‐R score in the AZLI group was
4.10 points higher
(0.06 points lower to 8.26 points higher).

NA

268
(1)

⊕⊕⊕⊝
moderate1

Survival

Follow‐up: 24 weeks

See comments.

268
(1)

⊕⊕⊝⊝
low1,2

2 participants died during the trial, but neither were related to treatment and the treatment group was not specified.

Antibiotic resistance:

change from baseline in P aeruginosa CFU/g of sputum at week 24

Follow‐up: 24 weeks

The mean (SD) change in log10 CFU/g was ‐0.32 (1.87) in the TIS group.

The mean change in log10 CFU/g in the AZLI group was 0.23 lower (0.76 lower to 0.3 log10 CFU/g higher).

NA

268
(1)

⊕⊕⊕⊝
moderate1

Adverse events:

number of treatment‐related adverse events

Follow‐up: 24 weeks

129 per 1000

228 per 1000
(133 to 392 per 1000)

RR 1.77 (1.03 to 3.04)

268
(1)

⊕⊕⊕⊝
moderate1

Whilst treatment‐related events were significantly more likely in the AZLI treated group P < 0.04), the difference in serious adverse events (also more likely in the AZLI group) did not quite reach significance. No significant difference was reported for any other reported adverse event.

*The basis for the assumed risk (e.g. the median control group risk across studies) is provided in footnotes. The corresponding risk (and its 95% CI) is based on the assumed risk in the comparison group and the relative effect of the intervention (and its 95% CI).
AZLI: aztreonam lysine for inhalation; CFQ‐R: cystic fibrosis questionnaire ‐ revised; CFU: colony forming units; CI: confidence interval; FEV1 : forced expiratory volume at 1 second; FVC: forced vital capacity; MD: mean difference; P aeruginosa : Pseudomonas aeruginosa;RR: risk ratio; SD: standard deviation; TIS: tobramycin for inhalation solution.

GRADE Working Group grades of evidence
High quality: further research is very unlikely to change our confidence in the estimate of effect.
Moderate quality: further research is likely to have an important impact on our confidence in the estimate of effect and may change the estimate.
Low quality: further research is very likely to have an important impact on our confidence in the estimate of effect and is likely to change the estimate.
Very low quality: we are very uncertain about the estimate.

1. Downgraded once due to risk of bias within the trial. The trial was open‐label with the treatments given at a different frequency and so obvious to participants. There was also an unclear risk attributed to blinding of outcome assessment.
2. Downgraded once due to imprecision from low event rates.

Figuras y tablas -
Summary of findings 5. Summary of findings: aztreonam lysine for inhalation versus tobramycin for inhalation solution
Summary of findings 6. Summary of findings: liposomal amikacin for inhalation versus tobramycin for inhalation solution

LAI compared with TIS for long‐term therapy in CF

Patient or population: children and adults with CF and P aeruginosa

Settings: outpatients

Intervention: LAI 560 mg once daily with eFlow® nebuliser

Comparison: TIS 300 mg twice daily via PARI LC® PLUS nebuliser

Outcomes

Illustrative comparative risks* (95% CI)

Relative effect
(95% CI)

No of participants
(studies)

Quality of the evidence
(GRADE)

Comments

Assumed risk

Corresponding risk

TIS

LAI

FEV1 :

LS relative mean change from baseline (%)

Follow‐up: 168 days

The LS MD in FEV1 (LAI ‐ TIS) was ‐1.31 % (95 % CI ‐4.95 to 2.34) favouring TIS but not significantly (P = 0.48).

NA

262
(1)

⊕⊕⊝⊝
low1,2

Results taken from abstract (Bilton 2014).

The lower CI was above ‐5 % indicating non‐inferiority of LAI to TIS.

Quality of Life

CFQ‐R respiratory symptom scores (mean (SE))

Follow‐up: 140 days

Mean increase from baseline at day 140 (end of trial) was 4.94 for LAI (which is greater than the 4 points which show a minimally important difference) but only 2.13 for TIS.

NA

302
(1)

⊕⊕⊝⊝
low1,2

Minimally important differences (≥ 4 points) on the CFQ‐R Respiratory symptoms scale were seen after each treatment cycle with LAI but only after the first cycle of TIS.

Antibiotic resistance:

change from baseline in P aeruginosa CFU/g of sputum

Follow‐up: 168 days

Mean reductions in P aeruginosa sputum density were similar during on‐treatment periods and off‐treatment periods with no significant difference between LAI and TIS (P = 0.038).

NA

259
(1)

⊕⊕⊝⊝
low1,2

Taken directly from abstract.

Adverse events: number of treatment‐related adverse events

84% of participants in the LAI group experienced at least 1 treatment‐related adverse event, whilst 78.8 % of the TIS group experienced at least 1 treatment‐related adverse event. Serious adverse events were experienced by 17.6 % of LAI participants and 19.9 % of TIS participants.

NA

294
(1)

⊕⊕⊝⊝
low1,2

Narrative taken directly from abstract (Bilton 2014).

*The basis for the assumed risk (e.g. the median control group risk across studies) is provided in footnotes. The corresponding risk (and its 95% CI) is based on the assumed risk in the comparison group and the relative effect of the intervention (and its 95% CI).
CFU colony forming units; CF: cystic fibrosis; CFQ‐R: cystic fibrosis questionnaire ‐ revised; CI: confidence interval; FEV1 : forced expiratory volume at 1 second; LAI: liposomal amikacin for inhalation;LS least squares; MD: mean difference; P aeruginosa : Pseudomonas aeruginosa;RR: risk ratio; TIS: tobramycin for inhalation solution.

GRADE Working Group grades of evidence
High quality: further research is very unlikely to change our confidence in the estimate of effect.
Moderate quality: further research is likely to have an important impact on our confidence in the estimate of effect and may change the estimate.
Low quality: further research is very likely to have an important impact on our confidence in the estimate of effect and is likely to change the estimate.
Very low quality: we are very uncertain about the estimate.

1. Downgraded once due to risk of bias within the trial being unclear or high across all domains, largely due to the trial being published only in abstract form.

2. Downgraded once due to publication bias as we only have an abstract with limited information about the trial and the results.

Figuras y tablas -
Summary of findings 6. Summary of findings: liposomal amikacin for inhalation versus tobramycin for inhalation solution
Summary of findings 7. Summary of findings: levofloxacin for inhalation solution versus tobramycin for inhalation solution

LIS compared with TIS for long‐term therapy in CF

Patient population: adults and children aged over 12 with CF and P aeruginosa

Settings: outpatients

Intervention: LIS (Aeroquin™, MP376, APT‐1026) 240 mg (2.4 mL of 100 mg per mL solution) twice daily

Comparison: TIS 300 mg/5 mL twice daily

Outcomes

Illustrative comparative risks* (95% CI)

Relative effect
(95% CI)

No of participants
(studies)

Quality of the evidence
(GRADE)

Comments

Assumed risk

Corresponding risk

TIS

LIS

FEV1 (% predicted):

relative mean change from baseline

Follow‐up: six months

The mean (SD) change in % predicted FEV1 was ‐1.5 (14.8) in the TIS group.

The mean change in % predicted FEV1 in the LIS group was 0.30 higher (3.02 lower to 3.62 higher).

NA

282
(1)

⊕⊕⊕⊕
high

FVC (% predicted): relative mean change from baseline

Follow‐up: six months

The mean (SD) change in FVC % predicted was ‐1.3 (12.8) in the TIS group.

The mean change in FVC % predicted in the LIS group was 0.60 higher (2.23 lower to 3.43 higher).

NA

282
(1)

⊕⊕⊕⊕
high

Pulmonary exacerbations:

number of hospitalisations due to respiratory exacerbations

Follow‐up: six months

280 per 1000

173 per 1000
(112 to 274 per 1000)

RR 0.62 (0.40 to 0.98)

282
(1)

⊕⊕⊕⊕
high

Quality of life: change from baseline in CFQ‐R

The trial reported that scores in the respiratory domain of the CFQ‐R were similar in the 2 groups at baseline, increased in the LIS group and decreased in the TIS group at day 28 and were similar again by the end of the trial.

NA

282
(1)

⊕⊕⊝⊝
low1,2

No data could be entered into analysis.

Survival

Follow‐up: NA

Outcome not reported.

NA

Antibiotic resistance: mean change in P aeruginosa sputum density (log10 CFU/g)

Follow‐up: six months

The mean (SD) sputum density in the TIS group was ‐0.25 (1.76) log10 CFU/g.

The mean sputum density in the LIS group was 0.12 higher (0.31 log10 CFU/g lower to 0.55 log10 CFU/g higher).

NA

282
(1)

⊕⊕⊕⊕
high

Adverse events:

number of treatment‐related adverse events

Significantly fewer participants in the LIS group reported epistaxis, RR 0.2 (95% CI 0.04 to 1.00), general malaise, RR 0.1 (95% CI 0.01 to 0.83) and increased blood glucose, RR 0.28 (95% CI 0.08 to 0.94).

Significantly more participants in the LIS group reported dysgeusia, RR 46.25 (95% CI 2.88 to 742).

No other differences were noted.

NA

282
(1)

⊕⊕⊕⊕
high

*The basis for the assumed risk (e.g. the median control group risk across studies) is provided in footnotes. The corresponding risk (and its 95% CI) is based on the assumed risk in the comparison group and the relative effect of the intervention (and its 95% CI).
CFU: colony forming units; CI: confidence interval; FEV1 : forced expiratory volume at 1 second; FVC: forced vital capacity; LIS: levofloxacin for inhalation solution; P aeruginosa : Pseudomonas aeruginosa;RR: risk ratio; TIS: tobramycin for inhalation solution.

GRADE Working Group grades of evidence
High quality: further research is very unlikely to change our confidence in the estimate of effect.
Moderate quality: further research is likely to have an important impact on our confidence in the estimate of effect and may change the estimate.
Low quality: further research is very likely to have an important impact on our confidence in the estimate of effect and is likely to change the estimate.
Very low quality: we are very uncertain about the estimate.

1. Downgraded once due to indirectness. Quality of life was measured by the CFQ‐R score but no data was provided, just a summary. It is unclear which participants were included in this outcome.

2. Downgraded once due to publication bias as the results were not presented in full for this outcome.

Figuras y tablas -
Summary of findings 7. Summary of findings: levofloxacin for inhalation solution versus tobramycin for inhalation solution
Summary of findings 8. Summary of findings: continuous cycles alternating aztreonam lysine for inhalation with tobramycin for inhalation solution versus continuous cycles alternating placebo with tobramycin for inhalation solution

Continuous AZLI/TIS compared with continuous placebo/TIS (i.e. intermittent TIS) for long‐term therapy in CF

Patient population: children and adults with CF and P aeruginosa

Settings: outpatients

Intervention: continuous alternating cycles of AZLI (75 mg (diluted in 0.17% NaCL) 3 times‐daily) and TIS (300 mg/5 mL twice‐daily)

Comparison: alternating cycles of placebo (lactose monohydrate and sodium chloride reconstituted with the same diluent used for AZLI 3 times daily) and TIS (300 mg/5 mL twice‐daily)

Outcomes

Illustrative comparative risks* (95% CI)

Relative effect
(95% CI)

No of participants
(studies)

Quality of the evidence
(GRADE)

Comments

Assumed risk

Corresponding risk

TIS/placebo

AZLI/TIS

FEV1 (% predicted):

mean change from baseline (average values across the end of the three treatment cycles)

Follow‐up: six months (24 weeks)

The change from baseline in FEV1 % predicted was on average 1.33% more in the AZLI/TIS group than in the in the TIS/placebo group, values ranged from 0.51% lower to 3.17% higher.

NA

90
(1)

⊕⊕⊝⊝
low1,2

FVC

Follow‐up: NA

Outcome not reported.

NA

Pulmonary exacerbations: rate of PDEs per participant year

Follow‐up: 24 weeks

489 per 1000

347 per 1000
(210 to 577 per 1000)

RR 0.71 (0.43 to 1.18)

90
(1)

⊕⊕⊝⊝
low1,2

The rate of PDEs was lower in the AZLI/TIS group (1.31 PDEs per participant year) than in the placebo/TIS group (1.76 PDEs per participant year). The difference between the groups was not reported to be significant (P = 0.25, RR 0.74 (95% CI 0.45 to 1.24)).

Quality of life: CFQ‐R respiratory symptom scores averaged from weeks 4, 12 and 20

Follow‐up: 24 weeks

Scores improved by a mean (SE) 1.00 (1.74) in the AZLI/tobramycin group, they worsened by a mean (SE) ‐2.06 (1.63) in the placebo/TIS group. The difference between the groups was not found to be significant, MD 3.06 (95% CI ‐1.61 to 7.73).

90
(1)

⊕⊕⊝⊝
low1,2

Survival

Follow‐up NA

Outcome not reported.

NA

Antibiotic resistance:

mean change from baseline in P aeruginosa sputum density (CFU/g)

Follow‐up: 24 weeks

Adjusted mean changes from baseline sputum P aeruginosa density after each course of AZLI/placebo or TIS during the comparative phase were small (0.36 to ‐0.55 log10 CFU/g) and differences between treatment groups were not statistically significant.

⊕⊕⊝⊝
low1,2

Adverse events: any adverse event in the comparative phase

Follow‐up: 24 weeks

978 per 1000

949 per 1000
(880 to 1000)

RR 0.97 (0.90 to 1.05)

88
(1)

⊕⊕⊝⊝
low1,2

A range of adverse events were reported but the only adverse events which were significantly different between the 2 groups were:

favouring continuous treatment

  • dyspnoea: RR 0.59 (95% CI 0.35 to 1.01);

  • decrease in exercise tolerance: RR 0.27 (95% CI 0.08 to 0.90);

  • decreased appetite: RR 0.34 (95% CI 0.14 to 0.85);

favouring intermittent treatment

  • nasal congestion: RR 3.01 (95% CI 1.04 to 8.74).

*The basis for the assumed risk (e.g. the median control group risk across studies) is provided in footnotes. The corresponding risk (and its 95% CI) is based on the assumed risk in the comparison group and the relative effect of the intervention (and its 95% CI). AZLI: inhaled aztreonam lysine; CFQ‐R: cystic fibrosis questionnaire ‐ revised; CFU: colony forming units; CI: confidence interval; FEV1: forced expiratory volume at 1 second; FVC: forced vital capacity; MD: mean difference; PDE: protocol‐defined exacerbation; P aeruginosa : Pseudomonas aeruginosa;RR: risk ratio; SE: standard error; TIS: tobramycin for inhalation solution.

GRADE Working Group grades of evidence
High quality: further research is very unlikely to change our confidence in the estimate of effect.
Moderate quality: further research is likely to have an important impact on our confidence in the estimate of effect and may change the estimate.
Low quality: further research is very likely to have an important impact on our confidence in the estimate of effect and is likely to change the estimate.
Very low quality: we are very uncertain about the estimate.

1. Downgraded once due to risk of bias being unclear across five of the domains around randomisation, allocation concealment, blinding of participants and incomplete outcome data.
2. Downgraded once due to imprecision as trial enrolment was limited and the trial was underpowered.

Figuras y tablas -
Summary of findings 8. Summary of findings: continuous cycles alternating aztreonam lysine for inhalation with tobramycin for inhalation solution versus continuous cycles alternating placebo with tobramycin for inhalation solution
Table 1. Summary of excluded short‐term studies (28 days or longer)

Trial

Trial characteristics

Participants

Interventions

Summary of results

Dorkin 2015

Duration: 28 days.

Design: double‐blind, placebo‐controlled parallel RCT.

Location: multicentre ‐ 73 sites in 9 countries (USA, Australia and Europe).

Clinical trials identifier: NCT00645788

Number: estimated enrolment 245, 288 randomised but only 286 received 1 of the 4 treatments.

Age: 12 years and older (split children 12 ‐ 17 years and adults 18 years and over).

Gender: males or females.

Disease status: chronic colonisation with P aeruginosa, clinically stable.

Intervention 1: 32.5 mg ciprofloxacin betaine corresponding to 50 mg ciprofloxacin Pulmonsphere inhalation powder 2x daily.

Intervention 2: placebo (50 mg matching placebo powder formulation) 2x daily.

Intervention 3: 48.75 mg ciprofloxacin betaine corresponding to 75 mg ciprofloxacin Pulmonsphere inhalation powder 2x daily.

Intervention 4: placebo (75 mg matching placebo powder formulation) 2x daily.

Interventions 3 and 4 were introduced after amendment 2.

No significant difference in change in FEV1 between ciprofloxacin dry powder inhalation at either dose (P = 0.154).

In pooled analyses, FEV1 decline from baseline to treatment end was significantly lower with ciprofloxacin
DPI than with placebo (pooled data; P = 0.02).

There were positive effects on sputum bacterial load and quality of life which weren't maintained in the 4‐week follow‐up.

There were no significant
differences in type/incidence of treatment‐emergent
adverse events by treatment group (P = 0.115).

Dupont 2008

Duration: 28 days.

Design: placebo‐controlled phase IIa parallel RCT (stratified by baseline FEV1 (% predicted) and randomised 2:1 to Arikace™ or placebo).

Location: multicentre ‐ 13 centres in Europe.

Number: 66 participants enrolled.

Age: 23 adults, 25 adolescents (13 ‐ 18 years) and 18 children (6 ‐ 12 years).

Gender: no details.

Disease status: chronic P aeruginosa infection; baseline FEV1 (% predicted) 40 ‐ 75% in 43 participants; >75% in 23 participants.

Cohort 1: (n = 32) 280 mg Arikace™ or placebo (hypertonic saline solution (1.5% NaCl)) once daily.
Cohort 2: (n = 34) 560 mg Arikace™ or placebo (hypertonic saline solution (1.5% NaCl)) once daily.

Inhaled with PARI eFlow® nebuliser.

Relative change in FEV1 was higher in the 560 mg group at day 28 (P = 0.033) compared to placebo.

The adverse event profile was similar among Arikace™ and placebo groups.

Galeva 2011

Duration: 28 days.

Design: placebo‐controlled parallel RCT.

Location: multicentre ‐ 17 centres in 8 countries.

Number: 62 randomised (target was 100).

Age: 6 to 21 years.

Gender: no details.

Disease status: diagnosed with CF by at least 1 clinical feature plus sweat test, FEV1 of 25 ‐ 80% predicted.

Intervention 1: TIP (n = 32) 112 mg 2x daily.

Intervention 2: placebo (n = 30) 2x daily.

Mean treatment difference in absolute change in FEV1 between TIP ‐ placebo was 4.4 % (P < 0.05).

Mean treatment difference in relative change in FEV1 between TIP ‐ placebo was 5.9 % (P < 0.0.184).

TIP significantly reduced sputum density.

Geller 2011b

Duration: 28 days.

Design: double‐blind, placebo‐controlled parallel RCT (3 arms).

Location: multicentre ‐ 51 centres across USA and Europe.

Number: 151 randomised.

Age: mean age 29 years.

Gender: 85 males, 66 females.

Disease status: diagnosed CF, chronic P aeruginosa airways infection, FEV1 between 25 ‐ 85% predicted, and 3 courses of inhaled antibiotics over the past 12 months.

Intervention 1: (n = 38) MP‐376 120 mg daily.

Intervention 2: (n = 37) MP‐376 240 mg daily.

Intervention 3: (n = 39) MP‐376 240 mg 2x daily.

Intervention 4: (n = 37) placebo.

Delivered by a customized investigational PARI eFlow nebulizer.

All doses of MP‐376 resulted in reduced sputum density at day 28 (240 mg twice a day showed a 0.96 log difference compared with placebo P = 0.001)

There was a dose‐dependent increase in FEV1 for MP‐376. There was a difference of 8.7 % in FEV1 between MP‐376 240 mg twice a day and placebo (P = 0.003).

There was a significant reduction in the need for other anti‐pseudomonal antibiotics compared to placebo.

Gibson 2003

Duration: 28 days.

Design: double‐blind, placebo‐controlled parallel RCT.

Early termination due to poor recruitment.

Number: 21 randomised (planned 98).

Age: 6 months ‐ 6 years.

Gender: 11 males, 10 females.

Disease status: positive P aeruginosa culture.

Intervention 1: (n = 8) tobramycin 300 mg 2x daily.

Intervention 2: (n = 13) placebo 2x daily.

There was a significant difference between treatment groups and placebo in the reduction in P aeruginosa density (no P aeruginosa was detected at day 28 in 8 out of 8 active group patients compared to 1 out of 13 placebo patients).

There were no significant differences between treatment groups for clinical indices or adverse events.

Goss 2009

Duration: 28 days (with 28‐day follow‐up).

Design: placebo‐controlled parallel phase 2 RCT (stratified by baseline FEV1 (% predicted) and randomised 2:1 to Arikace™ or placebo).

Location: multicentre ‐ 18 centres across USA.

Number: 46 randomised.

Age: mean (SD)

Arikace™ 70 mg: 33.1 (9.7) years.

Arikace™ 140 mg: 35.4 (6.0) years.

Placebo 70 mg and 140 mg: 24.4 (6.3) years

Arikace™ 560 mg: 31.5 (14.5) years.

Placebo 560 mg: 26.3 (6.7) years.

Gender: 27 males, 19 females.

Disease status: Cohorts 1 and 2: baseline FEV1 % predicted 40 ‐ 75% n = 16 and > 75% n = 5.

Cohort 3: baseline FEV1 % predicted 40 ‐ 75% n = 19 and > 75% n = 6.

More details on lung function and BMI in supplementary papers

Arikace™ or placebo (hypertonic saline (1.5% NaCl).

Cohort 1: (n = 14) 70 mg Arikace™ or placebo 1x daily.

Cohort 2: (n = 12) 40 mg Arikace™ or placebo 1x daily.

Cohort 3: (n = 22) 560 mg Arikace™ or placebo 1x daily.

Inhaled using eFlow nebulizer system (PARI Pharma GmbH).

Follow‐up for 28 days after trial finish. Review of interim data in combination with data from similar European trial led to addition of Cohort 3 for a further 28 days with follow‐up of 56 days after trial finish.

Arikace™ was well tolerated at doses of 70 mg, 140 mg and 560 mg.

Hodson 2002

Duration: 28 days.

Design: open‐label parallel RCT (stratified by age and centre).
Location: multcentre.

Number: 126 randomised, 11 withdrew before treatment, 115 treated.

Age: range 7 ‐ 50 years.

Gender: males 45% of total.

Disease status: criteria for diagnosis abnormal sweat electrolytes, gene mutation.

Intervention 1: tobramycin 300 mg in 5 mL 2x daily, delivered by Pari LC plus nebuliser with CR50 compressor.

Intervention 2: colistin 1MU in 3 mL in saline 2x daily, delivered by Ventstream nebuliser with CR50 compressor.

Tobramycin significantly improved lung function (mean improvement in FEV1 % predicted from baseline to week 4 was 6.7 % P = 0.006). The mean change in FEV1 % predicted was not significant in the colistin group (0.37 %).

Both antibiotic regimes produced a significant decrease in sputum density, there was no development of highly resistant strains and the safety profile for both antibiotics was good.
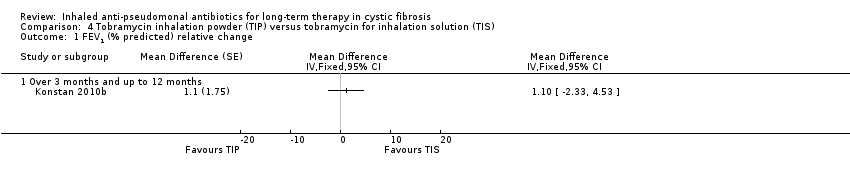
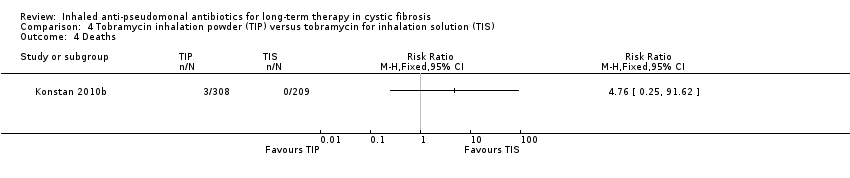
Konstan 2010a

Duration: total of 24 weeks, 3 cycles each of 28 days on treatment followed by 28 days off treatment (only cycle 1 was double‐blind and randomised, cycles 2 and 3 were open‐label extension phases in which all participants received the same treatment).

Design: double‐blind, placebo‐controlled parallel RCT.

Location; multicentre ‐ 38 centres in Europe, Latin America and USA.

Clinical trials identifier: NCT00125346.

Known as the EVOLVE Trial.

Trial terminated after showing a statistically significant benefit of TIP.

Number: 102 randomised, 95 received intended treatment, unclear in which group 7 withdrawals were from.

Age: mean (SD): TIP 13.4 (4.42) years; placebo 13.2 (3.91) years.

Gender: 42 males, 53 females.

Disease status: baseline lung function (FEV1 % predicted) (mean (SD)): TIP 54.7 (18.89)%; placebo 58.5 (20.03)%.

Intervention 1: (n = 46) TIP 112 mg 2x daily.

Intervention 2: (n = 49) placebo 2x daily.

Cycle 1 (28 days on and 28 days off treatment or placebo).

Cycles 2 and 3: open‐label cycles of TIP for all participants.

TIP significantly improved FEV1 % predicted from baseline to day 28 (difference 13.3, 95% CI 5.31 to 21.28 P = 0.0016).

TIP reduced sputum P aeruginosa density, respiratory related hospitalisation and anti‐pseudomonal antibiotic use.

The most common adverse event was cough but the frequency was higher in the placebo group (26.5 %) versus TIP (13.0%).

No evidence of ototoxicity or nephrotoxicity.

Lenoir 2007

Duration: 4 weeks followed by a 4‐week run‐out phase.

Design: double‐blind, placebo‐controlled parallel RCT.

Location: multicentre ‐ 13 sites in 4 countries.

Number: 59 participants.

Age: range 6 ‐ 30 years.

Gender: 32 males, 27 females.

Disease status: participants diagnosed with CF and P aeruginosa.

Intervention 1: tobramycin 300 mg (Bramitob®) 2x daily.

Intervention 2: placebo 2x daily.

Active drug and placebo both delivered by Pari LC Plus nebuliser and Pari TurboBoy compressor.

There was a significant increase in FEV1 from baseline in the tobramycin group but not in the placebo group (absolute difference 13.3% P = 0.003). Similar improvements were also seen for FVC in the tobramycin group.

Adverse events were lower in the in the tobramycin group.

Microbiological outcomes were significantly improved.

Mainz 2014

Duration: 28 days.

Design: double‐blind placebo‐controlled parallel RCT.

Location: multicentre ‐ 2 centres in Germany (Jena and Tuebingen).

Number: 9 participants.

Age: mean (SD): 22.4 (7.6) years; range 10.6 to 38.7 years.

Gender: 6 males, 3 females.

Disease status: diagnosed with CF by 2 positive sweat tests or genetic analysis (or both) and with chronic P aeruginosa colonisation.

Intervention 1: 80 mg tobramycin daily.

Intervention 2: placebo (isotonic saline).

Sinonasal inhalation using PARI Sinus™ compressor with a PARI LC SPRINT STAR™ nebuliser. Drug administered to each nostril for 4 minutes with the other nostril occluded, maximum volume of 1 mL per nostril.

P aeruginosa quantity decreased in 4 out of 6 (67%) participants receiving tobramycin and in none of the placebo group.

Sinonasal inhalation was well tolerated.

Mazurek 2014

Duration: single cycle of 28 days on and 28 days off (8 weeks total duration).

Design: parallel RCT (non‐inferiority trial).

Location: multicentre ‐ 38 centres in Europe.

Clinical trials identifier: NCT00885365.

Follow‐on 48 week extension of TNS4 only: ClinicalTrials ID: NCT01111383.

Number: 406 individuals screened, 324 participants randomised.

Age: mean (SD): TNS4 15.89 (6.25) years; TNS5 15.58 (7.31) years.

Gender: no details.

Disease status: diagnosed with CF. Chronic P aeruginosa infection and FEV1 ≥ 40% and ≤ 80% predicted.

Intervention 1: (n = 156) TNS4 (Bramitob®) 300 mg/4 mL 2x daily.

Intervention 2: (n = 168) TNS5 (TOBI®) 300 mg/5 mL 2x daily.

Both interventions delivered via PARI Boy N® compressor and the PARI LC Plus® nebuliser.

Other standard therapies allowed.

TNS4 showed similar short‐term clinical benefits to TNS5.

Adverse event reporting was similar between the 2 treatment groups.

McCoy 2008

Duration: 4 weeks.

Design: double‐blind, placebo‐controlled parallel RCT.

Location: multicentre ‐ 56 centres in USA.

Number: 246 participants randomised; 173 completed 28‐day treatment phase; and 90 completed open‐label follow‐up for 56 days.

Age: 7 to 65 years.

Gender: 121 males.

Disease status: documented diagnosis of CF and P aeruginosa, 3 or more courses of tobramycin in previous year, FEV1 between 25 and 75% predicted.

Intervention 1: aztreonam 75 mg for 4 weeks, 2x or 3xdaily.

Intervention 2: placebo (5 mg lactose in 1mL 0.17% NaCl) for 4 weeks, 2x or 3x daily.

AZLI treatment increased the median time to need for additional anti‐pseudomonal antibiotics by 21 days compared to placebo (AZLI 92 days; placebo 71 days P = 0.007).

AZLI improved mean CFQ‐R respiratory scores (P = 0.02) and sputum density (P = 0.006.

Adverse events were reported in both groups but were consistent with CF lung disease.

Nasr 2004

Duration: 28 days.

Design: double‐blind, placebo‐controlled parallel RCT.

Location: single centre in USA.

Number: 32 people with CF (31 completed).

Age: mean (SD) and range ‐ TSI group 11.81 (7.46) years, 6.0 to 34.7 years; placebo group 15.86 (7.25) years, 7.4 to 28.8 years.

Gender: 12 males, 20 females ‐ TSI group 6 males and 10 females, placebo group 6 males and 10 females.

Disease status: CF diagnosis by sweat test or genotype testing. Colonised with P aeruginosa. Lung function FEV1 % predicted mean (SD) and range: TSI group 95.73 (17.21)%, 55.0% to 134.1%; placebo group 83.71 (21.07)%, 45.0% to 108.73%.

Intervention 1: (n = 16) TSI 5 mL (solution of 300 mg tobramycin and 11.25 mg sodium chloride in sterile water) 2x daily.

Intervention 2: (n = 16) placebo (solution of 1.25 quinine sulphate in normal saline) 2x daily.

Interventions both administered using PARI LC Plus™ jet nebuliser and PulmoAide compressor.

% predicted FEV1 increased slightly for both groups by mean (SD) 1.29 (3.33) for TSI and 1.17 (1.4) for placebo.

Ramsey 1993

Duration: 3x 28‐day periods (only results of first 28‐day parallel group comparison suitable for analysis).

Design: double‐blind placebo‐controlled 3‐period cross‐over RCT.

Number: 71 participants.

Age: mean (SD): 17.7 (1.25) years and 16.6 (1.24) years in 2 groups.

Gender: 37 males, 34 females.

Disease status: CF diagnosed by sweat test. Sputum culture of P aeruginosa susceptible to tobramycin. Mean baseline FEV1 55% (SE 3.7) and 60% (SE 3.2) predicted in 2 treatment arms.

Intervention 1: tobramycin 600 mg 3x daily for 28 days, then cross‐over for 2 further 28‐day periods.

Intervention 2: placebo (0.5 normal saline) 3x daily for 28 days, then cross‐over for 2 further 28‐day periods.

Delivered by Ultrasonic (Ultraneb 100/99) nebuliser with 30 mL solution and 200 inhalations.

In the first 28‐day period there was an increase in % predicted FEV1 compared to placebo (P < 0.001) and FVC (P = 0.014).

There was a decrease in the density of P aeruginosa in sputum (P < 0.001).

Retsch‐Bogart 2007

Duration: 28 days.

Design: double‐blind, placebo‐controlled parallel Phase III RCT.

Location: multicentre: 53 centres in USA, Canada, Australia and New Zealand.

Clinical trials identifier:

NCT00112359.

Known as AIR‐CF1 Trial.

Number: 164 participants.

Age: mean (range)): AZLI 27.4 (7 – 54) years; placebo 31.7 (11 – 74) years.

Gender: 93 males, 71 females.

Disease status: stable condition. P aeruginosa in sputum or throat swab. No use of anti‐pseudomonal antibiotics in previous 14 days. Baseline lung function (FEV1 % predicted) (mean (SD)): AZLI 54.4 (13.4)%; placebo 54.8 (14.0)%.

Intervention 1: AZLI 75 mg 3x daily.

Intervention 2: placebo 3x daily.

Doses administered at least 4 hours apart using PARI eFlow™ Electronic Nebuliser after pre‐treatment with bronchodilator.

Concommitant standard CF therapies allowed except anti‐pseudomonal antibiotics, azithromycin or hypertonic saline.

AZLI improved FEV1 % predicted (P < 0.001), CFQ‐R respiratory score (P < 0.001) and sputum P aeruginosa density (P < 0.001) compared to placebo.

Adverse events were comparable between groups with the exception of productive cough. This outcome was reduced by half in AZLI‐treated participants.

Rietschel 2009

Duration: 20 weeks in total (8 weeks intervention 1, followed by 4 week washout, followed by 8 weeks intervention 2).

Design: cross‐over.

Location: multicentre in Germany.

Number: 35 stated as randomised in first abstract, but 29 randomised and 24/29 as having completed in second abstract.

Age: 6 years and over, mean (SD) age 19.8 (6.3) years, range 8 ‐ 35 years.

Disease status: chronically infected with P aeruginosa.

Intervention 1: continuous TIS 300 mg/d 1x daily.

Intervention 2: continuous TIS 300 mg/d 2x daily.

Mean FEV1 was not markedly different between treatment periods or from baseline.

No audiological or nephrotoxic side effects were noted.

Once or twice daily dose was shown to be safe and tolerable.

Sands 2014

Duration: 3 months in total, but only 4 weeks taking each intervention (4 weeks intervention 1, 4 weeks washout period, 4 weeks intervention 2).

Design: Cross‐over.

Location: multicentre in Poland.

Number: 58 randomised, 54 in ITT population

Age: 4 years and older. Mean (SD) age 15.4 (6.81) years, range 7 to 36 years.

Gender: 25 males, 33 females.

Disease status: mean (SD) FEV1 % predicted: VANTOBRA group 63.8 (17.1)%, range 30.0% to 82.8%; TIS group 64.2 (17.7)%, range 28.0% to 83.9%.

Intervention 1 (n = 28): T100 also known as VANTOBRA (170 mg tobramycin in 1.7 mL solution) via drug‐specific eFlow nebuliser Tolero with an eBase controller 2x daily.

Intervention 2 (n = 30): TOBI (300 mg tobramycin in 5 mL solution) via PARI LC Plus nebuliser with PARI BOY SX compressor 2x daily.

Treatment with both products were comparable in terms of clinical efficacy (reduction of P aeruginosa density and improvement in lung function.

Safety profiles were also comparable.

Trapnell 2012

Duration: 28 days.

Design: placebo‐controlled parallel RCT.

Location: multicentre ‐ 33 sites in the USA.

Number: 119 participants randomised.

Age: mean (SD)): FTI 80/20mg 35 (10.9) years; FTI 160/40mg 31 (10.2) years; placebo 31 (8.8) years.

Gender: 68 males, 51 females.

Disease status: lung function (FEV1 % predicted) (mean (SD)): FTI 80/20mg 50 (13.4)%; FTI 160/40mg 21 (51)%; placebo 48 (13.6)%.

Intervention 1: (n = 38) FTI 80/20 mg 2x daily.

Intervention 2: (n = 41) FTI 160/40 mg 2x daily.

Intervention 3: (n = 40) placebo 2x daily.

Improvements in mean FEV1 % predicted achieved in the AZLI run‐in period were maintained in the FTI group compared with placebo (P = 0.002).

The treatment effect on P aeruginosa sputum density significantly favoured FTI compared to placebo.

Respiratory symptoms were less common in the FTI group.

Wainwright 2011

Duration: 28 days.

Design: placebo‐controlled parallel RCT.

Location: multicentre ‐ 40 centres in USA, Canada and Australia.

Number: 160 people randomised, 157 received treatment.

Age: mean (SD): AZLI 19.5 (9.1) years; placebo 18.9 (9.1) years.

Gender: 90 males, 70 females.

Disease status: FEV1 % predicted: AZLI 95.5 (12.7)%; placebo 94.7 (12.9)%.

Intervention 1: (n = 76; 75 analysed, 1 discontinued trial) AZLI (75 mg aztreonam, 52.5 mg lysine monohydrate diluted in 0.17% saline (1 mL)) 3x daily.

Intervention 2: (n = 81) placebo (5 mg lactose, 7.3 mg NaCl diluted in 0.17% saline (1 mL)) 3x daily.

Both interventions self‐administered with the investigational eFlow® electronic nebulizer (PARI GmbH, Starnberg, Germany).

Treatment effect at 28 days for relative FEV1 % predicted was 2.7 % (P = 0.021 favouring AZLI).

Treatment effect for CFQ‐R respiratory symptom score at day 28 was modest at 1.8 points (95% CI ‐2.8 to 6.4 P = 0.443).

Sputum density was improved in the AZLI group (P = 0.016).

AZLI: aztreonam lysine for inhalation
CF: cystic fibrosis
FEV1: forced expiratory volume in one second
FTI: fosfomycin/tobramycin for inhalation
ITT: intention to treat
P aeruginosa: Pseudomonas aeruginosa
RCT: randomised controlled trial
SD: standard deviation
SE: standard error
TIP: tobramycin inhalation powder

Figuras y tablas -
Table 1. Summary of excluded short‐term studies (28 days or longer)
Comparison 1. Inhaled anti‐pseudomonal antibiotic (IAPA) versus placebo

Outcome or subgroup title

No. of studies

No. of participants

Statistical method

Effect size

1 Mean absolute FEV1 (% predicted) Show forest plot

2

Mean Difference (IV, Fixed, 95% CI)

Subtotals only

1.1 At 3 months

1

29

Mean Difference (IV, Fixed, 95% CI)

‐2.0 [‐22.41, 18.41]

1.2 Over 3 months and up to 12 months

1

245

Mean Difference (IV, Fixed, 95% CI)

3.10 [‐2.35, 8.55]

2 Mean change in FEV1 (% predicted) Show forest plot

1

Mean Difference (IV, Fixed, 95% CI)

Subtotals only

2.1 At 3 months

1

29

Mean Difference (IV, Fixed, 95% CI)

6.0 [‐1.07, 13.07]

3 Mean change in % predicted FEV1 Show forest plot

1

Mean Difference (Fixed, 95% CI)

Subtotals only

3.1 Over 3 months and up to 12 months

1

Mean Difference (Fixed, 95% CI)

6.38 [2.94, 9.82]

4 Rate of change of FEV1 (% predicted per year) Show forest plot

1

Mean Difference (IV, Fixed, 95% CI)

Subtotals only

4.1 Over 24 months and up to 36 months

1

27

Mean Difference (IV, Fixed, 95% CI)

7.8 [3.29, 12.31]

5 Mean absolute FVC (% predicted) at end of treatment Show forest plot

1

Mean Difference (IV, Fixed, 95% CI)

Subtotals only

5.1 At 1 to 3 months

1

29

Mean Difference (IV, Fixed, 95% CI)

8.0 [‐12.18, 28.18]

6 Mean change in FVC (% predicted) Show forest plot

2

Mean Difference (IV, Fixed, 95% CI)

Subtotals only

6.1 At 1 to 3 months

1

29

Mean Difference (IV, Fixed, 95% CI)

11.0 [1.94, 20.06]

6.2 Over 3 months and up to 12 months

1

245

Mean Difference (IV, Fixed, 95% CI)

4.60 [1.01, 8.19]

7 Rate of change of FVC (% predicted per year) Show forest plot

1

Mean Difference (IV, Fixed, 95% CI)

Subtotals only

7.1 Over 24 months and up to 36 months

1

27

Mean Difference (IV, Fixed, 95% CI)

5.40 [0.86, 9.94]

8 Frequency of one or more hospital admissions Show forest plot

4

Risk Ratio (M‐H, Random, 95% CI)

Subtotals only

8.1 Over 3 months and up to 12 months

3

946

Risk Ratio (M‐H, Random, 95% CI)

0.66 [0.47, 0.93]

8.2 Over 12 months and up to 24 months

1

181

Risk Ratio (M‐H, Random, 95% CI)

0.59 [0.34, 1.05]

8.3 Over 24 months and up to 36 months

1

27

Risk Ratio (M‐H, Random, 95% CI)

0.8 [0.39, 1.65]

9 Hospital admissions, mean number of days in hospital Show forest plot

1

Mean Difference (IV, Fixed, 95% CI)

Subtotals only

9.1 Over 24 months and up to 36 months

1

27

Mean Difference (IV, Fixed, 95% CI)

‐3.20 [‐9.04, 2.64]

10 Frequency of one or more courses of intravenous antibiotics Show forest plot

3

Risk Ratio (M‐H, Fixed, 95% CI)

Subtotals only

10.1 Over 3 months and up to 12 months

2

765

Risk Ratio (M‐H, Fixed, 95% CI)

0.77 [0.67, 0.88]

10.2 Over 12 months and up to 24 months

1

175

Risk Ratio (M‐H, Fixed, 95% CI)

0.62 [0.35, 1.08]

11 Pulmonary exacerbations Show forest plot

1

Risk Ratio (M‐H, Fixed, 95% CI)

Subtotals only

11.1 Over 3 months and up to 12 months

1

245

Risk Ratio (M‐H, Fixed, 95% CI)

0.78 [0.59, 1.03]

12 Lost school or working days Show forest plot

1

Mean Difference (IV, Fixed, 95% CI)

Subtotals only

12.1 Over 3 months and up to 12 months

1

245

Mean Difference (IV, Fixed, 95% CI)

‐5.3 [‐8.59, ‐2.01]

13 Deaths Show forest plot

3

Risk Ratio (M‐H, Fixed, 95% CI)

Subtotals only

13.1 Over 3 months and up to 12 months

2

767

Risk Ratio (M‐H, Fixed, 95% CI)

0.17 [0.03, 1.09]

13.2 Over 24 months and up to 36 months

1

27

Risk Ratio (M‐H, Fixed, 95% CI)

0.27 [0.01, 6.11]

14 Frequency of tobramycin‐resistant P. aeruginosa at end of study Show forest plot

3

Risk Ratio (M‐H, Random, 95% CI)

Subtotals only

14.1 Over 3 months and up to 12 months

2

672

Risk Ratio (M‐H, Random, 95% CI)

1.95 [0.86, 4.42]

14.2 Over 24 months and up to 36 months

1

26

Risk Ratio (M‐H, Random, 95% CI)

7.80 [0.46, 131.62]

15 Frequency of new isolates of drug resistant organisms (at end of study) Show forest plot

2

Risk Ratio (M‐H, Fixed, 95% CI)

Subtotals only

15.1 Burkholderia cepacia

2

536

Risk Ratio (M‐H, Fixed, 95% CI)

0.26 [0.03, 1.99]

15.2 Stenotrophomonas maltophilia

1

520

Risk Ratio (M‐H, Fixed, 95% CI)

3.05 [0.32, 29.10]

15.3 Alcaligenes xylosoxidans

1

520

Risk Ratio (M‐H, Fixed, 95% CI)

1.02 [0.06, 16.15]

15.4 Aspergillus species

1

389

Risk Ratio (M‐H, Fixed, 95% CI)

2.12 [1.29, 3.46]

16 Number experiencing adverse event (at end of study) Show forest plot

4

Risk Ratio (M‐H, Random, 95% CI)

Subtotals only

16.1 Auditory impairment

4

540

Risk Ratio (M‐H, Random, 95% CI)

0.0 [0.0, 0.0]

16.2 Tinnitus

1

520

Risk Ratio (M‐H, Random, 95% CI)

17.26 [1.00, 297.54]

16.3 Voice alteration

2

701

Risk Ratio (M‐H, Random, 95% CI)

2.66 [1.14, 6.25]

16.4 Pneumothorax

1

520

Risk Ratio (M‐H, Random, 95% CI)

0.25 [0.03, 2.26]

16.5 Hemoptysis

1

520

Risk Ratio (M‐H, Random, 95% CI)

0.87 [0.66, 1.13]

Figuras y tablas -
Comparison 1. Inhaled anti‐pseudomonal antibiotic (IAPA) versus placebo
Comparison 2. Colistimethate sodium dry powder (CDPI) versus tobramycin for inhalation solution (TIS)

Outcome or subgroup title

No. of studies

No. of participants

Statistical method

Effect size

1 Number of pulmonary exacerbations Show forest plot

1

Risk Ratio (M‐H, Fixed, 95% CI)

Totals not selected

1.1 Over 3 months and up to 12 months

1

Risk Ratio (M‐H, Fixed, 95% CI)

0.0 [0.0, 0.0]

2 Time to first pulmonary exacerbation Show forest plot

1

Mean Difference (IV, Fixed, 95% CI)

Totals not selected

2.1 Over 3 months and up to 12 months

1

Mean Difference (IV, Fixed, 95% CI)

0.0 [0.0, 0.0]

3 Deaths Show forest plot

1

Risk Ratio (M‐H, Fixed, 95% CI)

Totals not selected

3.1 Over 3 months and up to 12 months

1

Risk Ratio (M‐H, Fixed, 95% CI)

0.0 [0.0, 0.0]

4 Adverse events (at end of study) Show forest plot

1

Risk Ratio (M‐H, Fixed, 95% CI)

Subtotals only

4.1 Total adverse events

1

379

Risk Ratio (M‐H, Fixed, 95% CI)

1.06 [0.99, 1.12]

4.2 Treatment‐related adverse events

1

379

Risk Ratio (M‐H, Fixed, 95% CI)

1.76 [1.50, 2.08]

4.3 Mild adverse events

1

379

Risk Ratio (M‐H, Fixed, 95% CI)

1.00 [0.92, 1.09]

4.4 Moderate adverse events

1

379

Risk Ratio (M‐H, Fixed, 95% CI)

1.32 [1.11, 1.57]

4.5 Severe adverse events

1

379

Risk Ratio (M‐H, Fixed, 95% CI)

3.83 [2.15, 6.83]

Figuras y tablas -
Comparison 2. Colistimethate sodium dry powder (CDPI) versus tobramycin for inhalation solution (TIS)
Comparison 3. Inhaled TOBI® (IV preparation) versus tobramycin for inhalation solution (TIS)

Outcome or subgroup title

No. of studies

No. of participants

Statistical method

Effect size

1 FEV1 % predicted Show forest plot

1

Mean Difference (Fixed, 95% CI)

Totals not selected

1.1 At 1 to 3 months

1

Mean Difference (Fixed, 95% CI)

0.0 [0.0, 0.0]

2 FVC Show forest plot

1

Mean Difference (Fixed, 95% CI)

Totals not selected

2.1 At 1 to 3 months

1

Mean Difference (Fixed, 95% CI)

0.0 [0.0, 0.0]

Figuras y tablas -
Comparison 3. Inhaled TOBI® (IV preparation) versus tobramycin for inhalation solution (TIS)
Comparison 4. Tobramycin inhalation powder (TIP) versus tobramycin for inhalation solution (TIS)

Outcome or subgroup title

No. of studies

No. of participants

Statistical method

Effect size

1 FEV1 (% predicted) relative change Show forest plot

1

Mean Difference (Fixed, 95% CI)

Totals not selected

1.1 Over 3 months and up to 12 months

1

Mean Difference (Fixed, 95% CI)

0.0 [0.0, 0.0]

2 Hospitalisations Show forest plot

1

Risk Ratio (M‐H, Fixed, 95% CI)

Totals not selected

2.1 Over 3 months and up to 12 months

1

Risk Ratio (M‐H, Fixed, 95% CI)

0.0 [0.0, 0.0]

3 Pulmonary exacerbations Show forest plot

1

Risk Ratio (M‐H, Fixed, 95% CI)

Totals not selected

3.1 Over 3 months and up to 12 months

1

Risk Ratio (M‐H, Fixed, 95% CI)

0.0 [0.0, 0.0]

4 Deaths Show forest plot

1

Risk Ratio (M‐H, Fixed, 95% CI)

Totals not selected

5 Adverse events (at end of study) Show forest plot

1

Risk Ratio (M‐H, Fixed, 95% CI)

Totals not selected

5.1 Any adverse event

1

Risk Ratio (M‐H, Fixed, 95% CI)

0.0 [0.0, 0.0]

5.2 Bronchospasm

1

Risk Ratio (M‐H, Fixed, 95% CI)

0.0 [0.0, 0.0]

5.3 Cough

1

Risk Ratio (M‐H, Fixed, 95% CI)

0.0 [0.0, 0.0]

5.4 Productive cough

1

Risk Ratio (M‐H, Fixed, 95% CI)

0.0 [0.0, 0.0]

5.5 Dyspnoea

1

Risk Ratio (M‐H, Fixed, 95% CI)

0.0 [0.0, 0.0]

5.6 Pyrexia

1

Risk Ratio (M‐H, Fixed, 95% CI)

0.0 [0.0, 0.0]

5.7 Oropharyngeal pain

1

Risk Ratio (M‐H, Fixed, 95% CI)

0.0 [0.0, 0.0]

5.8 Dysphonia (hoarseness)

1

Risk Ratio (M‐H, Fixed, 95% CI)

0.0 [0.0, 0.0]

5.9 Haemoptysis

1

Risk Ratio (M‐H, Fixed, 95% CI)

0.0 [0.0, 0.0]

5.10 Headache

1

Risk Ratio (M‐H, Fixed, 95% CI)

0.0 [0.0, 0.0]

5.11 Nasal congestion

1

Risk Ratio (M‐H, Fixed, 95% CI)

0.0 [0.0, 0.0]

5.12 Nausea

1

Risk Ratio (M‐H, Fixed, 95% CI)

0.0 [0.0, 0.0]

5.13 Rales

1

Risk Ratio (M‐H, Fixed, 95% CI)

0.0 [0.0, 0.0]

5.14 Rhinorrhea

1

Risk Ratio (M‐H, Fixed, 95% CI)

0.0 [0.0, 0.0]

5.15 Pulmonary function test decreased

1

Risk Ratio (M‐H, Fixed, 95% CI)

0.0 [0.0, 0.0]

5.16 Upper respiratory tract infection

1

Risk Ratio (M‐H, Fixed, 95% CI)

0.0 [0.0, 0.0]

5.17 Wheezing

1

Risk Ratio (M‐H, Fixed, 95% CI)

0.0 [0.0, 0.0]

5.18 Chest discomfort

1

Risk Ratio (M‐H, Fixed, 95% CI)

0.0 [0.0, 0.0]

5.19 Fatigue

1

Risk Ratio (M‐H, Fixed, 95% CI)

0.0 [0.0, 0.0]

5.20 Vomiting

1

Risk Ratio (M‐H, Fixed, 95% CI)

0.0 [0.0, 0.0]

5.21 Sinusitis

1

Risk Ratio (M‐H, Fixed, 95% CI)

0.0 [0.0, 0.0]

5.22 Pulmonary congestion

1

Risk Ratio (M‐H, Fixed, 95% CI)

0.0 [0.0, 0.0]

Figuras y tablas -
Comparison 4. Tobramycin inhalation powder (TIP) versus tobramycin for inhalation solution (TIS)
Comparison 5. Inhaled aztreonam lysine (AZLI) versus tobramycin for inhalation solution (TIS)

Outcome or subgroup title

No. of studies

No. of participants

Statistical method

Effect size

1 FEV1 % predicted ‐ mean relative change from baseline Show forest plot

1

Mean Difference (Fixed, 95% CI)

Totals not selected

1.1 At Week 24 (average across 3 cycles)

1

Mean Difference (Fixed, 95% CI)

0.0 [0.0, 0.0]

2 FEV1 % predicted ‐ mean actual change from baseline Show forest plot

1

Mean Difference (IV, Fixed, 95% CI)

Totals not selected

2.1 At Week 24 (averaged across 3 cycles)

1

Mean Difference (IV, Fixed, 95% CI)

0.0 [0.0, 0.0]

3 Need for additional antibiotics Show forest plot

1

Risk Ratio (M‐H, Fixed, 95% CI)

Totals not selected

3.1 At Week 24

1

Risk Ratio (M‐H, Fixed, 95% CI)

0.0 [0.0, 0.0]

4 Number of days of additional antibiotics Show forest plot

1

Mean Difference (IV, Fixed, 95% CI)

Totals not selected

4.1 At Week 24

1

Mean Difference (IV, Fixed, 95% CI)

0.0 [0.0, 0.0]

5 Weight (relative change from baseline) Show forest plot

1

Mean Difference (IV, Fixed, 95% CI)

Totals not selected

5.1 At Week 24

1

Mean Difference (IV, Fixed, 95% CI)

0.0 [0.0, 0.0]

6 Quality of Life ‐ CFQR respiratory symptom scale Show forest plot

1

Mean Difference (IV, Fixed, 95% CI)

Totals not selected

6.1 At Week 24 (average across 3 cycles)

1

Mean Difference (IV, Fixed, 95% CI)

0.0 [0.0, 0.0]

7 TSQM ‐ effectiveness Show forest plot

1

Mean Difference (IV, Fixed, 95% CI)

Totals not selected

7.1 At week 24 (average across 3 cycles)

1

Mean Difference (IV, Fixed, 95% CI)

0.0 [0.0, 0.0]

8 TSQM ‐ global satisfaction Show forest plot

1

Mean Difference (IV, Fixed, 95% CI)

Totals not selected

8.1 At Week 24

1

Mean Difference (IV, Fixed, 95% CI)

0.0 [0.0, 0.0]

9 TSQM ‐ side effects Show forest plot

1

Mean Difference (IV, Fixed, 95% CI)

Totals not selected

9.1 At Week 24

1

Mean Difference (IV, Fixed, 95% CI)

0.0 [0.0, 0.0]

10 TSQM ‐ convenience Show forest plot

1

Mean Difference (IV, Fixed, 95% CI)

Totals not selected

10.1 At Week 24

1

Mean Difference (IV, Fixed, 95% CI)

0.0 [0.0, 0.0]

11 Log10Pseudomonas aeruginosa CFU/g sputum Show forest plot

1

Mean Difference (IV, Fixed, 95% CI)

Totals not selected

11.1 At Week 24 (average across 3 cycles)

1

Mean Difference (IV, Fixed, 95% CI)

0.0 [0.0, 0.0]

12 Adverse events (at end of study) Show forest plot

1

Risk Ratio (M‐H, Fixed, 95% CI)

Subtotals only

12.1 Treatment‐related adverse events

1

268

Risk Ratio (M‐H, Fixed, 95% CI)

1.77 [1.03, 3.04]

12.2 Serious adverse events

1

268

Risk Ratio (M‐H, Fixed, 95% CI)

1.94 [0.98, 3.84]

12.3 Cough

1

268

Risk Ratio (M‐H, Fixed, 95% CI)

0.90 [0.78, 1.03]

12.4 Productive cough

1

268

Risk Ratio (M‐H, Fixed, 95% CI)

0.86 [0.69, 1.07]

12.5 Pyrexia

1

268

Risk Ratio (M‐H, Fixed, 95% CI)

1.04 [0.73, 1.49]

12.6 Oropharyngeal pain

1

268

Risk Ratio (M‐H, Fixed, 95% CI)

0.94 [0.64, 1.40]

12.7 Dyspnoea

1

268

Risk Ratio (M‐H, Fixed, 95% CI)

0.86 [0.57, 1.30]

12.8 Haemoptysis

1

268

Risk Ratio (M‐H, Fixed, 95% CI)

1.43 [0.87, 2.36]

12.9 Rales

1

268

Risk Ratio (M‐H, Fixed, 95% CI)

0.83 [0.54, 1.27]

12.10 Headache

1

268

Risk Ratio (M‐H, Fixed, 95% CI)

1.04 [0.65, 1.66]

12.11 Nasal congestion

1

268

Risk Ratio (M‐H, Fixed, 95% CI)

1.08 [0.68, 1.74]

12.12 Rhinorrhea

1

268

Risk Ratio (M‐H, Fixed, 95% CI)

0.74 [0.46, 1.17]

12.13 Exercise tolerance decreased

1

268

Risk Ratio (M‐H, Fixed, 95% CI)

0.90 [0.55, 1.46]

12.14 Fatigue

1

268

Risk Ratio (M‐H, Fixed, 95% CI)

0.93 [0.56, 1.55]

12.15 Decreased appetite

1

268

Risk Ratio (M‐H, Fixed, 95% CI)

0.97 [0.54, 1.75]

12.16 Abdominal pain

1

268

Risk Ratio (M‐H, Fixed, 95% CI)

2.18 [0.98, 4.85]

12.17 Respiratory tract congestion

1

268

Risk Ratio (M‐H, Fixed, 95% CI)

0.82 [0.44, 1.52]

12.18 Wheezing

1

268

Risk Ratio (M‐H, Fixed, 95% CI)

0.78 [0.42, 1.43]

12.19 Chest discomfort

1

268

Risk Ratio (M‐H, Fixed, 95% CI)

1.05 [0.51, 2.14]

12.20 Nausea

1

268

Risk Ratio (M‐H, Fixed, 95% CI)

1.36 [0.63, 2.95]

12.21 Vomiting

1

268

Risk Ratio (M‐H, Fixed, 95% CI)

0.97 [0.48, 1.96]

12.22 Pulmonary function decreased

1

268

Risk Ratio (M‐H, Fixed, 95% CI)

0.63 [0.31, 1.29]

12.23 Breath sounds abnormal

1

268

Risk Ratio (M‐H, Fixed, 95% CI)

0.52 [0.23, 1.18]

Figuras y tablas -
Comparison 5. Inhaled aztreonam lysine (AZLI) versus tobramycin for inhalation solution (TIS)
Comparison 6. Levofloxacin for inhalation solution (LIS) versus tobramycin for inhalation solution (TIS)

Outcome or subgroup title

No. of studies

No. of participants

Statistical method

Effect size

1 Absolute change in FEV1 % predicted Show forest plot

1

Mean Difference (IV, Fixed, 95% CI)

Totals not selected

1.1 At three months

1

Mean Difference (IV, Fixed, 95% CI)

0.0 [0.0, 0.0]

1.2 Over 3 months and up to 12 months

1

Mean Difference (IV, Fixed, 95% CI)

0.0 [0.0, 0.0]

2 Relative change in FEV1 % predicted Show forest plot

1

Mean Difference (IV, Fixed, 95% CI)

Totals not selected

2.1 At three months

1

Mean Difference (IV, Fixed, 95% CI)

0.0 [0.0, 0.0]

2.2 Over 3 months and up to 12 months

1

Mean Difference (IV, Fixed, 95% CI)

0.0 [0.0, 0.0]

3 Absolute change in FVC % predicted Show forest plot

1

Mean Difference (IV, Fixed, 95% CI)

Totals not selected

3.1 At three months

1

Mean Difference (IV, Fixed, 95% CI)

0.0 [0.0, 0.0]

3.2 Over 3 months and up to 12 months

1

Mean Difference (IV, Fixed, 95% CI)

0.0 [0.0, 0.0]

4 Relative change in FVC % predicted Show forest plot

1

Mean Difference (IV, Fixed, 95% CI)

Totals not selected

4.1 At three months

1

Mean Difference (IV, Fixed, 95% CI)

0.0 [0.0, 0.0]

4.2 Over 3 months and up to 12 months

1

Mean Difference (IV, Fixed, 95% CI)

0.0 [0.0, 0.0]

5 Hospitalisations due to respiratory exacerbations Show forest plot

1

Risk Ratio (M‐H, Fixed, 95% CI)

Totals not selected

5.1 Over 3 months and up to 12 months

1

Risk Ratio (M‐H, Fixed, 95% CI)

0.0 [0.0, 0.0]

6 Weight decrease Show forest plot

1

Risk Ratio (M‐H, Fixed, 95% CI)

Totals not selected

6.1 Over 3 months and up to 12 months

1

Risk Ratio (M‐H, Fixed, 95% CI)

0.0 [0.0, 0.0]

7 Change in P aeruginosa sputum density (log10 CFU/g) Show forest plot

1

Mean Difference (IV, Fixed, 95% CI)

Totals not selected

7.1 Over 3 months and up to 12 months

1

Mean Difference (IV, Fixed, 95% CI)

0.0 [0.0, 0.0]

8 Adverse events (at end of study) Show forest plot

1

Risk Ratio (M‐H, Fixed, 95% CI)

Totals not selected

8.1 Cough

1

Risk Ratio (M‐H, Fixed, 95% CI)

0.0 [0.0, 0.0]

8.2 Increased sputum

1

Risk Ratio (M‐H, Fixed, 95% CI)

0.0 [0.0, 0.0]

8.3 Respiratory tract congestion

1

Risk Ratio (M‐H, Fixed, 95% CI)

0.0 [0.0, 0.0]

8.4 Increased viscosity of bronchial secretions

1

Risk Ratio (M‐H, Fixed, 95% CI)

0.0 [0.0, 0.0]

8.5 Paranasal sinus hypersecretion

1

Risk Ratio (M‐H, Fixed, 95% CI)

0.0 [0.0, 0.0]

8.6 Haemoptysis

1

Risk Ratio (M‐H, Fixed, 95% CI)

0.0 [0.0, 0.0]

8.7 Discoloured sputum

1

Risk Ratio (M‐H, Fixed, 95% CI)

0.0 [0.0, 0.0]

8.8 Exertional dyspnoea

1

Risk Ratio (M‐H, Fixed, 95% CI)

0.0 [0.0, 0.0]

8.9 Rales

1

Risk Ratio (M‐H, Fixed, 95% CI)

0.0 [0.0, 0.0]

8.10 Dyspnoea

1

Risk Ratio (M‐H, Fixed, 95% CI)

0.0 [0.0, 0.0]

8.11 Oropharyngeal pain

1

Risk Ratio (M‐H, Fixed, 95% CI)

0.0 [0.0, 0.0]

8.12 Epistaxis

1

Risk Ratio (M‐H, Fixed, 95% CI)

0.0 [0.0, 0.0]

8.13 Disease progression

1

Risk Ratio (M‐H, Fixed, 95% CI)

0.0 [0.0, 0.0]

8.14 Fatigue

1

Risk Ratio (M‐H, Fixed, 95% CI)

0.0 [0.0, 0.0]

8.15 Decreased exercise tolerance

1

Risk Ratio (M‐H, Fixed, 95% CI)

0.0 [0.0, 0.0]

8.16 Pyrexia

1

Risk Ratio (M‐H, Fixed, 95% CI)

0.0 [0.0, 0.0]

8.17 Malaise

1

Risk Ratio (M‐H, Fixed, 95% CI)

0.0 [0.0, 0.0]

8.18 Increase in blood glucose

1

Risk Ratio (M‐H, Fixed, 95% CI)

0.0 [0.0, 0.0]

8.19 Dysgeusia

1

Risk Ratio (M‐H, Fixed, 95% CI)

0.0 [0.0, 0.0]

8.20 Sinus headache

1

Risk Ratio (M‐H, Fixed, 95% CI)

0.0 [0.0, 0.0]

8.21 Headache

1

Risk Ratio (M‐H, Fixed, 95% CI)

0.0 [0.0, 0.0]

8.22 Nasopharyngitis

1

Risk Ratio (M‐H, Fixed, 95% CI)

0.0 [0.0, 0.0]

8.23 Sinusitis

1

Risk Ratio (M‐H, Fixed, 95% CI)

0.0 [0.0, 0.0]

8.24 Upper respiratory tract infection

1

Risk Ratio (M‐H, Fixed, 95% CI)

0.0 [0.0, 0.0]

8.25 Abdominal pain

1

Risk Ratio (M‐H, Fixed, 95% CI)

0.0 [0.0, 0.0]

8.26 Nausea

1

Risk Ratio (M‐H, Fixed, 95% CI)

0.0 [0.0, 0.0]

8.27 Arthralgia

1

Risk Ratio (M‐H, Fixed, 95% CI)

0.0 [0.0, 0.0]

8.28 Decreased appetite

1

Risk Ratio (M‐H, Fixed, 95% CI)

0.0 [0.0, 0.0]

8.29 Rash

1

Risk Ratio (M‐H, Fixed, 95% CI)

0.0 [0.0, 0.0]

Figuras y tablas -
Comparison 6. Levofloxacin for inhalation solution (LIS) versus tobramycin for inhalation solution (TIS)
Comparison 7. Continuous aztreonam (AZLI)/tobramycin (TIS) versus intermittent tobramycin (TIS)

Outcome or subgroup title

No. of studies

No. of participants

Statistical method

Effect size

1 Mean change from baseline ‐ FEV1 % predicted Show forest plot

1

Mean Difference (Fixed, 95% CI)

Subtotals only

1.1 Over 3 months and up to 12 months (values from end of 3 cycles averaged)

1

Mean Difference (Fixed, 95% CI)

1.33 [‐0.51, 3.17]

2 Rate of hospitalisation per participant year Show forest plot

1

90

Risk Ratio (M‐H, Fixed, 95% CI)

0.62 [0.35, 1.11]

2.1 Over 3 months and up to 12 months

1

90

Risk Ratio (M‐H, Fixed, 95% CI)

0.62 [0.35, 1.11]

3 Need for additional antibiotics for an exacerbation Show forest plot

1

90

Risk Ratio (M‐H, Fixed, 95% CI)

0.88 [0.59, 1.32]

3.1 Over 3 months and up to 12 months

1

90

Risk Ratio (M‐H, Fixed, 95% CI)

0.88 [0.59, 1.32]

4 Rate of protocol defined pulmonary exacerbations per participant year Show forest plot

1

90

Risk Ratio (M‐H, Fixed, 95% CI)

0.71 [0.43, 1.18]

4.1 Over 3 months and up to 12 months

1

90

Risk Ratio (M‐H, Fixed, 95% CI)

0.71 [0.43, 1.18]

5 Quality of life ‐ CFQ‐R respiratory symptom score Show forest plot

1

Mean Difference (Fixed, 95% CI)

3.06 [‐1.61, 7.73]

5.1 Over 3 months and up to 12 months

1

Mean Difference (Fixed, 95% CI)

3.06 [‐1.61, 7.73]

6 Incidence of other respiratory pathogens (at end of study) Show forest plot

1

Risk Ratio (M‐H, Fixed, 95% CI)

Subtotals only

6.1 P aeruginosa

1

87

Risk Ratio (M‐H, Fixed, 95% CI)

1.00 [0.94, 1.06]

6.2 Achromobacter species

1

87

Risk Ratio (M‐H, Fixed, 95% CI)

1.29 [0.42, 3.90]

6.3 Stenotrophomonas maltophilia

1

87

Risk Ratio (M‐H, Fixed, 95% CI)

0.88 [0.40, 1.90]

6.4 Aspergillus spp.

1

87

Risk Ratio (M‐H, Fixed, 95% CI)

0.65 [0.35, 1.22]

6.5 MRSA

1

87

Risk Ratio (M‐H, Fixed, 95% CI)

0.65 [0.35, 1.22]

6.6 Burkholderia spp.

1

87

Risk Ratio (M‐H, Fixed, 95% CI)

3.21 [0.13, 76.67]

6.7 MSSA

1

76

Risk Ratio (M‐H, Fixed, 95% CI)

0.68 [0.35, 1.33]

7 Adverse events (at end of study) Show forest plot

1

Risk Ratio (M‐H, Fixed, 95% CI)

Subtotals only

7.1 Any comparative phase adverse event

1

88

Risk Ratio (M‐H, Fixed, 95% CI)

0.97 [0.90, 1.05]

7.2 Adverse events grade 1‐2 severity

1

88

Risk Ratio (M‐H, Fixed, 95% CI)

1.10 [0.23, 5.13]

7.3 Adverse events grade 3‐4 severity

1

88

Risk Ratio (M‐H, Fixed, 95% CI)

1.02 [0.54, 1.91]

7.4 Serious adverse events

1

88

Risk Ratio (M‐H, Fixed, 95% CI)

0.96 [0.64, 1.44]

8 Treatment‐emergent adverse events (at end of study) Show forest plot

1

Risk Ratio (M‐H, Fixed, 95% CI)

Subtotals only

8.1 Cough

1

88

Risk Ratio (M‐H, Fixed, 95% CI)

1.06 [0.83, 1.36]

8.2 Sputum increased

1

88

Risk Ratio (M‐H, Fixed, 95% CI)

0.71 [0.49, 1.03]

8.3 Dyspnoea

1

88

Risk Ratio (M‐H, Fixed, 95% CI)

0.59 [0.35, 1.01]

8.4 Fatigue

1

88

Risk Ratio (M‐H, Fixed, 95% CI)

0.71 [0.38, 1.33]

8.5 Haemoptysis

1

88

Risk Ratio (M‐H, Fixed, 95% CI)

1.10 [0.53, 2.26]

8.6 Nasal congestion

1

88

Risk Ratio (M‐H, Fixed, 95% CI)

3.01 [1.04, 8.74]

8.7 Pulmonary function test decreased

1

88

Risk Ratio (M‐H, Fixed, 95% CI)

1.20 [0.57, 2.54]

8.8 Respiratory tract congestion

1

88

Risk Ratio (M‐H, Fixed, 95% CI)

1.10 [0.53, 2.26]

8.9 Infective pulmonary exacerbation of CF

1

88

Risk Ratio (M‐H, Fixed, 95% CI)

2.19 [0.82, 5.89]

8.10 Lung disorder

1

88

Risk Ratio (M‐H, Fixed, 95% CI)

0.76 [0.36, 1.59]

8.11 Wheezing

1

88

Risk Ratio (M‐H, Fixed, 95% CI)

1.10 [0.48, 2.50]

8.12 Chest discomfort

1

88

Risk Ratio (M‐H, Fixed, 95% CI)

0.67 [0.31, 1.46]

8.13 Pyrexia

1

88

Risk Ratio (M‐H, Fixed, 95% CI)

0.67 [0.31, 1.46]

8.14 Headache

1

88

Risk Ratio (M‐H, Fixed, 95% CI)

0.96 [0.38, 2.41]

8.15 Diarrhoea

1

88

Risk Ratio (M‐H, Fixed, 95% CI)

1.31 [0.43, 3.99]

8.16 Nausea

1

88

Risk Ratio (M‐H, Fixed, 95% CI)

0.66 [0.26, 1.65]

8.17 Oropharyngeal pain

1

88

Risk Ratio (M‐H, Fixed, 95% CI)

1.31 [0.43, 3.99]

8.18 Decreased Appetite

1

88

Risk Ratio (M‐H, Fixed, 95% CI)

0.34 [0.14, 0.85]

8.19 Dyspnoea exertional

1

88

Risk Ratio (M‐H, Fixed, 95% CI)

2.74 [0.56, 13.37]

8.20 Rhinorrhoea

1

88

Risk Ratio (M‐H, Fixed, 95% CI)

0.68 [0.24, 1.93]

8.21 Sputum discoloured

1

88

Risk Ratio (M‐H, Fixed, 95% CI)

1.83 [0.46, 7.18]

8.22 Vomiting

1

88

Risk Ratio (M‐H, Fixed, 95% CI)

0.61 [0.22, 1.67]

8.23 Chest pain

1

88

Risk Ratio (M‐H, Fixed, 95% CI)

0.63 [0.20, 1.99]

8.24 Weight decreased

1

88

Risk Ratio (M‐H, Fixed, 95% CI)

0.88 [0.25, 3.05]

8.25 Chills

1

88

Risk Ratio (M‐H, Fixed, 95% CI)

0.66 [0.17, 2.58]

8.26 Exercise tolerance decreased

1

88

Risk Ratio (M‐H, Fixed, 95% CI)

0.27 [0.08, 0.90]

8.27 Sinus congestion

1

88

Risk Ratio (M‐H, Fixed, 95% CI)

0.47 [0.13, 1.70]

Figuras y tablas -
Comparison 7. Continuous aztreonam (AZLI)/tobramycin (TIS) versus intermittent tobramycin (TIS)