Reducción quirúrgica del volumen pulmonar para el enfisema difuso
Referencias
Referencias de los estudios incluidos en esta revisión
Referencias de los estudios excluidos de esta revisión
Referencias de los estudios en curso
Referencias adicionales
Referencias de otras versiones publicadas de esta revisión
Characteristics of studies
Characteristics of included studies [ordered by study ID]
| Methods | Prospective, randomised controlled trial. Allows cross‐over of patients from medical to surgical arm after they had completed evaluation after 3 additional months of medical therapy and rehabilitation. | |
| Participants | Screened: 200 Baseline demographics: Entry criteria: Non‐smokers (>/= 6 months); symptomatic despite optimised medical therapy; NYHA Class III–IV; evidence of airflow obstruction & hyperinflation by pulmonary function studies (i.e., FEV1 < 30% of predicted, postbronchodilator administration, FRC or TLC> 120% of predicted), hyperinflation documented by chest X‐ray and diffuse bullous emphysema documented by high‐resolution computed tomography (CT) scan, decreased or absent perfusion documented in planned resected lung tissue by quantitative perfusion lung scan Exclusion criteria: Severe & refractory hypoxemia (PaO2/FIO2 ratio < 150); severe hypercapnic respiratory failure requiring mechanical ventilation; presence of significant cardiovascular disease; presence of severe pulmonary hypertension (mean pulmonary artery pressure > 35 mm Hg); severe debilitated state with total body weight < 70% of ideal body weight, presence of significant extrapulmonary end‐organ dysfunction expected to limit survival; psychosocial dysfunction; continued smoking. | |
| Interventions | LVRS via MS & bilateral stapling resection versus usual medical care (including pulmonary rehabilitation). Pulmonary rehabilitation: 8 week prgramme with additional 3 months in patients randomised to control. PR had educational, physical, psychosocial supportive components. All participants had individualised programmes based on exercise test results. Outcomes assessed 8 weeks of outpatient pulmonary rehabilitation, and 3 months after additional pulmonary rehabilitation or LVRS. | |
| Outcomes | Lung function (performed following ATS guidelines); Arterial blood gases; Sickness Impact Profile (SIP); mortality | |
| Notes | ||
| Risk of bias | ||
| Bias | Authors' judgement | Support for judgement |
| Adequate sequence generation? | Unclear risk | Described as randomised; no other information available |
| Allocation concealment? | Unclear risk | Information not available |
| Methods | Randomised parallel group trial | |
| Participants | Screened: 174 Baseline demographics: Entry criteria: CT‐confirmed severe emphysema; <75 years; FEV1 >500ml; CS dose <10mg/d Exclusion criteria: O2 use >18hrs/d; | |
| Interventions | LVRS via median sternotomy or thoracoscopy versus continued medical care. Continued medical care included rehabilitation and optimised drug therapy. Pulmonary rehabilitation: 6 week programme consisting of physical, occupational health, nutritional education components. Participants were telephoned in order to encourage them to adhere with the exercise programme. Outcome assessment took place at three, six and twelve monthly intervals. | |
| Outcomes | Mortality; FEV1; FVC; TLC; RV; shuttle‐walking distance, and quality of life; inspiratory and expiratory mouth pressures; arterial‐blood gas values | |
| Notes | ||
| Risk of bias | ||
| Bias | Authors' judgement | Support for judgement |
| Adequate sequence generation? | Unclear risk | Described as randomised; other information not available |
| Allocation concealment? | Low risk | Third party |
| Methods | Randomised controlled trial. | |
| Participants | Screened: 328 Baseline demographics: Entry criteria: <75 years; FEV1 <40% predicted; TLC >120% predicted; evidence of heterogenous emphysema on CT or V/Q scan Exclusion criteria: asthma; prior lung surgery; pleural disease; contraindications for surgery; inability to attend PR or follow‐up; pulmonary hypertension. | |
| Interventions | LVRS via video‐assisted thoracic surgery (VATS) (or less often by median sternotomy at the discretion of the surgeon) versus ongoing medical treatment including pulmonary rehabilitation. A short course of pulmonary rehabilitation was offered to participants in the surgery group. Pulmonary rehabilitation: Six week programme with supervised physical exercise, educational, and psychosocial components Outcomes assessed at 3, 6, 9, and 12 months after randomisation. | |
| Outcomes | Quality of life (measured by the CRDQ); Six‐minute walking distance, submaximal cycle endurance time; FEV1; FEV1/FVC; RV; FRC; TLC; mortality | |
| Notes | ||
| Risk of bias | ||
| Bias | Authors' judgement | Support for judgement |
| Adequate sequence generation? | Low risk | Random numbers table, block randomisation in groups of four. |
| Allocation concealment? | Low risk | Third party |
| Methods | Randomised controlled trial | |
| Participants | Screened: 304 (eligible: 114) | |
| Interventions | Bilateral LVRS by median sternotomy (N = 42) or video‐assisted thoracoscopy (N = 3) versus continued physical training. Physical training offered to both treatment groups. Study duration: participants followed up for one year post‐randomisation. | |
| Outcomes | Mortality, lung function, withdrawal, quality of life (SGRQ and SF‐36), exercise capacity (6 minute walk test & shuttle walk test) | |
| Notes | ||
| Risk of bias | ||
| Bias | Authors' judgement | Support for judgement |
| Adequate sequence generation? | Low risk | Randomised number lists (blocks of four) |
| Allocation concealment? | Low risk | Conducted off site |
| Methods | Randomised Controlled Trial of two interventions | |
| Participants | Eligible: 72 | |
| Interventions | LASER: | |
| Outcomes | Morbidity, Air leaks, Delayed Pneumothorax, FEV1, MOS‐36, Operation time (hrs), Length of Stay, Supplemental Oxygen Therapy, Repiratory Failure. | |
| Notes | ||
| Risk of bias | ||
| Bias | Authors' judgement | Support for judgement |
| Adequate sequence generation? | Unclear risk | Described as randomised; no other information available |
| Allocation concealment? | Unclear risk | Information not available |
| Methods | Randomised parallel group trials reported as one data set. | |
| Participants | Screened: 738 | |
| Interventions | LVRS via median sternotomy versus usual medical care. Optimal care standardised in both treatment groups (including PR, bronchodilators, vaccination, steroids and antibiotics) Pulmonary rehabilitation: 6 week course prior to randomisation (and continued for the duration of the study in both groups) Participants followed up for two years post randomisation. | |
| Outcomes | Morbidity; lung function; quality of life (CRDQ); exercise capacity; withdrawal | |
| Notes | ||
| Risk of bias | ||
| Bias | Authors' judgement | Support for judgement |
| Adequate sequence generation? | Low risk | Described as randomised; information not available |
| Allocation concealment? | Low risk | Conducted off site at a data coordinating centre |
| Methods | Randomised controlled trial | |
| Participants | Screened: 3777 Baseline: | |
| Interventions | LVRS via VATS or MS versus usual medical care according to ATS recommendations Usual care tailored to each participant in the control group. This included: smoking cessation (for those resuming smoking during course of the study); drug therapies (including CS and inhaled bronchodilators); LTOT; immunisations, and continued pulmonary rehabilitation. Pulmonary rehabilitation: Three phases: pre‐randomisation (6‐10 weeks); post‐randomisation: 8‐9 weeks) and long‐term maintenance (duration of the trial). PR consisted of physical, educational and psychosocial components (including nutritional counselling). Offered to both treatment groups. | |
| Outcomes | Mortality; exercise capacity; quality of life; FEV1; FVC; RV; cost; complications; length of hospital stay | |
| Notes | ||
| Risk of bias | ||
| Bias | Authors' judgement | Support for judgement |
| Adequate sequence generation? | Low risk | Computer‐generated random number sequence |
| Allocation concealment? | Low risk | Conducted by third party |
| Methods | Randomised controlled trial. | |
| Participants | Screened: not reported Baseline: | |
| Interventions | Buttressed versus non‐buttressed stapling device in LVRS procedures. Pulmonary rehabilitation not undertaken as part of study protocol. | |
| Outcomes | Length of hospital stay; FEV1; dyspnoea; PaO2 & PaCO2; complications; mortality | |
| Notes | ||
| Risk of bias | ||
| Bias | Authors' judgement | Support for judgement |
| Adequate sequence generation? | Unclear risk | Described as randomised; other information not available |
| Allocation concealment? | Unclear risk | Information not available |
CRDQ: Chronic Respiratory Disease Questionnaire; CS: corticosteroid; FEV1: Forced expiratory volume in one second; FVC: Forced expiratory vital capacity; LTOT: Long‐term oxygen therapy; LVRS: Lung volume reduction surgery; MS: Median sternotomy; OCS: oral corticosteroids; RV: Residual volume; SGRQ: St George's Respiratory Questionnaire; SF‐36: Short‐form 36 questionnaire; TLC: Total lung capacity; V/Q scan: Ventilation/perfusion scan; VATS: Video‐assisted thoracic surgery.
Characteristics of excluded studies [ordered by study ID]
| Study | Reason for exclusion |
| Case series. | |
| Case series. | |
| Case series. | |
| Case series. | |
| Prospective case series. | |
| Case series in patients with bullous emphysema. | |
| Prospective case series. | |
| Includes diffuse bullous emphysema (with heterogeneous distribution). | |
| Prospective case series. | |
| Prospective case series with retrospective review of preoperative characteristics. | |
| Prospective case series (not randomised). | |
| Prospective case series. | |
| Case series using laser pneumoplasty. |
Characteristics of ongoing studies [ordered by study ID]
| Trial name or title | |
| Methods | |
| Participants | People with severe emphysema |
| Interventions | LVRS versus medical care |
| Outcomes | Quality of life, lung function, mortality, exercise capacity |
| Starting date | |
| Contact information | |
| Notes | Interim analysis of data presented at 2001 ATS conference. |
| Trial name or title | |
| Methods | |
| Participants | |
| Interventions | |
| Outcomes | |
| Starting date | |
| Contact information | |
| Notes |
| Trial name or title | |
| Methods | |
| Participants | |
| Interventions | LVRS versus usual care (including pulmonary rehabilitation) |
| Outcomes | |
| Starting date | |
| Contact information | |
| Notes |
Data and analyses
| Outcome or subgroup title | No. of studies | No. of participants | Statistical method | Effect size |
| 1 Overall mortality (all patients, to end of follow‐up) Show forest plot | 5 | 1503 | Odds Ratio (M‐H, Fixed, 95% CI) | 1.06 [0.83, 1.35] |
| Analysis 1.1  Comparison 1 Surgery versus control, Outcome 1 Overall mortality (all patients, to end of follow‐up). | ||||
| 2 Overall mortality (stratified by risk, to end of follow‐up) Show forest plot | 5 | 1503 | Odds Ratio (M‐H, Fixed, 95% CI) | 1.06 [0.83, 1.36] |
| Analysis 1.2  Comparison 1 Surgery versus control, Outcome 2 Overall mortality (stratified by risk, to end of follow‐up). | ||||
| 2.1 High risk | 1 | 140 | Odds Ratio (M‐H, Fixed, 95% CI) | 2.0 [1.02, 3.92] |
| 2.2 Non‐high risk | 1 | 1078 | Odds Ratio (M‐H, Fixed, 95% CI) | 0.86 [0.64, 1.14] |
| 2.3 Unclear risk status | 4 | 285 | Odds Ratio (M‐H, Fixed, 95% CI) | 2.34 [0.98, 5.57] |
| 3 30 Day Mortality in Non‐High Risk Patients Show forest plot | 1 | Odds Ratio (M‐H, Fixed, 95% CI) | Totals not selected | |
| Analysis 1.3  Comparison 1 Surgery versus control, Outcome 3 30 Day Mortality in Non‐High Risk Patients. | ||||
| 4 90‐Day Mortality (all patients) Show forest plot | 4 | 1415 | Odds Ratio (M‐H, Fixed, 95% CI) | 6.57 [3.34, 12.95] |
| Analysis 1.4  Comparison 1 Surgery versus control, Outcome 4 90‐Day Mortality (all patients). | ||||
| 5 90‐Day Mortality (stratified by risk) Show forest plot | 4 | 1415 | Odds Ratio (M‐H, Fixed, 95% CI) | 6.24 [3.24, 12.02] |
| Analysis 1.5  Comparison 1 Surgery versus control, Outcome 5 90‐Day Mortality (stratified by risk). | ||||
| 5.1 High risk | 1 | 140 | Odds Ratio (M‐H, Fixed, 95% CI) | 57.24 [3.38, 968.54] |
| 5.2 Non‐high risk | 1 | 1078 | Odds Ratio (M‐H, Fixed, 95% CI) | 3.65 [1.65, 8.09] |
| 5.3 Unclear risk status | 3 | 197 | Odds Ratio (M‐H, Fixed, 95% CI) | 7.08 [1.54, 32.58] |
| 6 Change in SGRQ (six months) Show forest plot | 2 | SGRQ (Fixed, 95% CI) | Subtotals only | |
| Analysis 1.6  Comparison 1 Surgery versus control, Outcome 6 Change in SGRQ (six months). | ||||
| 6.1 Symptoms | 1 | SGRQ (Fixed, 95% CI) | ‐11.7 [‐20.15, ‐3.25] | |
| 6.2 Activity | 1 | SGRQ (Fixed, 95% CI) | ‐16.8 [‐23.10, ‐10.50] | |
| 6.3 Impacts | 1 | SGRQ (Fixed, 95% CI) | ‐13.1 [‐19.20, ‐7.00] | |
| 6.4 Total | 2 | SGRQ (Fixed, 95% CI) | ‐13.49 [‐15.13, ‐11.84] | |
| 7 Change in SGRQ (12 months) Show forest plot | 2 | SGRQ units (Fixed, 95% CI) | Subtotals only | |
| Analysis 1.7  Comparison 1 Surgery versus control, Outcome 7 Change in SGRQ (12 months). | ||||
| 7.1 Symptoms | 1 | SGRQ units (Fixed, 95% CI) | ‐8.8 [‐17.57, ‐0.03] | |
| 7.2 Activity | 1 | SGRQ units (Fixed, 95% CI) | ‐17.1 [‐22.65, ‐11.55] | |
| 7.3 Impacts | 1 | SGRQ units (Fixed, 95% CI) | ‐14.6 [‐20.05, ‐9.15] | |
| 7.4 Total | 2 | SGRQ units (Fixed, 95% CI) | ‐13.78 [‐15.75, ‐11.80] | |
| 8 Change in SGRQ (24 months) Show forest plot | 1 | Mean Difference (IV, Fixed, 95% CI) | Totals not selected | |
| Analysis 1.8  Comparison 1 Surgery versus control, Outcome 8 Change in SGRQ (24 months). | ||||
| 8.1 Symptoms | 0 | Mean Difference (IV, Fixed, 95% CI) | 0.0 [0.0, 0.0] | |
| 8.2 Activity | 0 | Mean Difference (IV, Fixed, 95% CI) | 0.0 [0.0, 0.0] | |
| 8.3 Impacts | 0 | Mean Difference (IV, Fixed, 95% CI) | 0.0 [0.0, 0.0] | |
| 8.4 Total | 1 | Mean Difference (IV, Fixed, 95% CI) | 0.0 [0.0, 0.0] | |
| 9 Mean change in CRDQ domains (12 months) Show forest plot | 1 | CRDQ units (Fixed, 95% CI) | Totals not selected | |
| Analysis 1.9  Comparison 1 Surgery versus control, Outcome 9 Mean change in CRDQ domains (12 months). | ||||
| 9.1 Dypnoea | 1 | CRDQ units (Fixed, 95% CI) | 0.0 [0.0, 0.0] | |
| 9.2 Fatigue | 1 | CRDQ units (Fixed, 95% CI) | 0.0 [0.0, 0.0] | |
| 9.3 Mastery | 1 | CRDQ units (Fixed, 95% CI) | 0.0 [0.0, 0.0] | |
| 9.4 Emotion | 1 | CRDQ units (Fixed, 95% CI) | 0.0 [0.0, 0.0] | |
| 10 Mean change in CRDQ domains (24 months) Show forest plot | 1 | CRDQ units (Fixed, 95% CI) | Totals not selected | |
| Analysis 1.10  Comparison 1 Surgery versus control, Outcome 10 Mean change in CRDQ domains (24 months). | ||||
| 10.1 Dypnoea | 1 | CRDQ units (Fixed, 95% CI) | 0.0 [0.0, 0.0] | |
| 10.2 Fatigue | 1 | CRDQ units (Fixed, 95% CI) | 0.0 [0.0, 0.0] | |
| 10.3 Mastery | 1 | CRDQ units (Fixed, 95% CI) | 0.0 [0.0, 0.0] | |
| 10.4 Emotion | 1 | CRDQ units (Fixed, 95% CI) | 0.0 [0.0, 0.0] | |
| 11 Change in SF‐36 (six months) Show forest plot | 1 | SF‐346 units (Fixed, 95% CI) | Totals not selected | |
| Analysis 1.11  Comparison 1 Surgery versus control, Outcome 11 Change in SF‐36 (six months). | ||||
| 11.1 Physical functioning | 1 | SF‐346 units (Fixed, 95% CI) | 0.0 [0.0, 0.0] | |
| 11.2 Role physical | 1 | SF‐346 units (Fixed, 95% CI) | 0.0 [0.0, 0.0] | |
| 11.3 Bodily pain | 1 | SF‐346 units (Fixed, 95% CI) | 0.0 [0.0, 0.0] | |
| 11.4 General health | 1 | SF‐346 units (Fixed, 95% CI) | 0.0 [0.0, 0.0] | |
| 11.5 Vitality | 1 | SF‐346 units (Fixed, 95% CI) | 0.0 [0.0, 0.0] | |
| 11.6 Social functioning | 1 | SF‐346 units (Fixed, 95% CI) | 0.0 [0.0, 0.0] | |
| 11.7 Role emotional | 1 | SF‐346 units (Fixed, 95% CI) | 0.0 [0.0, 0.0] | |
| 11.8 Mental health | 1 | SF‐346 units (Fixed, 95% CI) | 0.0 [0.0, 0.0] | |
| 12 Change in SF‐36 (12 months) Show forest plot | 1 | SF‐36 units (Fixed, 95% CI) | Totals not selected | |
| Analysis 1.12  Comparison 1 Surgery versus control, Outcome 12 Change in SF‐36 (12 months). | ||||
| 12.1 Physical functioning | 1 | SF‐36 units (Fixed, 95% CI) | 0.0 [0.0, 0.0] | |
| 12.2 Role physical | 1 | SF‐36 units (Fixed, 95% CI) | 0.0 [0.0, 0.0] | |
| 12.3 Bodily pain | 1 | SF‐36 units (Fixed, 95% CI) | 0.0 [0.0, 0.0] | |
| 12.4 General health | 1 | SF‐36 units (Fixed, 95% CI) | 0.0 [0.0, 0.0] | |
| 12.5 Vitality | 1 | SF‐36 units (Fixed, 95% CI) | 0.0 [0.0, 0.0] | |
| 12.6 Social functioning | 1 | SF‐36 units (Fixed, 95% CI) | 0.0 [0.0, 0.0] | |
| 12.7 Role emotional | 1 | SF‐36 units (Fixed, 95% CI) | 0.0 [0.0, 0.0] | |
| 12.8 Mental health | 1 | SF‐36 units (Fixed, 95% CI) | 0.0 [0.0, 0.0] | |
| 13 Improvement in health‐related quality of life (SGRQ) Show forest plot | 1 | Odds Ratio (M‐H, Fixed, 95% CI) | Totals not selected | |
| Analysis 1.13  Comparison 1 Surgery versus control, Outcome 13 Improvement in health‐related quality of life (SGRQ). | ||||
| 13.1 Six months | 1 | Odds Ratio (M‐H, Fixed, 95% CI) | 0.0 [0.0, 0.0] | |
| 13.2 12 months | 1 | Odds Ratio (M‐H, Fixed, 95% CI) | 0.0 [0.0, 0.0] | |
| 13.3 24 months | 1 | Odds Ratio (M‐H, Fixed, 95% CI) | 0.0 [0.0, 0.0] | |
| 14 No change/deterioration in health‐related quality of life (SGRQ) Show forest plot | 1 | Odds Ratio (M‐H, Fixed, 95% CI) | Totals not selected | |
| Analysis 1.14  Comparison 1 Surgery versus control, Outcome 14 No change/deterioration in health‐related quality of life (SGRQ). | ||||
| 14.1 Six months | 1 | Odds Ratio (M‐H, Fixed, 95% CI) | 0.0 [0.0, 0.0] | |
| 14.2 12 months | 1 | Odds Ratio (M‐H, Fixed, 95% CI) | 0.0 [0.0, 0.0] | |
| 14.3 24 months | 1 | Odds Ratio (M‐H, Fixed, 95% CI) | 0.0 [0.0, 0.0] | |
| 15 Improvement in exercise capacity Show forest plot | 1 | Odds Ratio (M‐H, Fixed, 95% CI) | Totals not selected | |
| Analysis 1.15  Comparison 1 Surgery versus control, Outcome 15 Improvement in exercise capacity. | ||||
| 15.1 Six months | 1 | Odds Ratio (M‐H, Fixed, 95% CI) | 0.0 [0.0, 0.0] | |
| 15.2 12 months | 1 | Odds Ratio (M‐H, Fixed, 95% CI) | 0.0 [0.0, 0.0] | |
| 15.3 24 months | 1 | Odds Ratio (M‐H, Fixed, 95% CI) | 0.0 [0.0, 0.0] | |
| 16 No change/deterioration in exercise capacity Show forest plot | 1 | Odds Ratio (M‐H, Fixed, 95% CI) | Totals not selected | |
| Analysis 1.16  Comparison 1 Surgery versus control, Outcome 16 No change/deterioration in exercise capacity. | ||||
| 16.1 Six months | 1 | Odds Ratio (M‐H, Fixed, 95% CI) | 0.0 [0.0, 0.0] | |
| 16.2 12 months | 1 | Odds Ratio (M‐H, Fixed, 95% CI) | 0.0 [0.0, 0.0] | |
| 16.3 24 months | 1 | Odds Ratio (M‐H, Fixed, 95% CI) | 0.0 [0.0, 0.0] | |
| 17 Six minute walk distance (metres) Show forest plot | 3 | Mean Difference (IV, Fixed, 95% CI) | Subtotals only | |
| Analysis 1.17  Comparison 1 Surgery versus control, Outcome 17 Six minute walk distance (metres). | ||||
| 17.1 at 3 months | 2 | 80 | Mean Difference (IV, Fixed, 95% CI) | 20.85 [‐9.36, 51.07] |
| 17.2 at 6 months | 1 | 81 | Mean Difference (IV, Fixed, 95% CI) | 55.0 [9.58, 100.42] |
| 17.3 at 12 months | 0 | 0 | Mean Difference (IV, Fixed, 95% CI) | 0.0 [0.0, 0.0] |
| 18 Change in six minute walk distance (metres) Show forest plot | 1 | Mean Difference (IV, Fixed, 95% CI) | Totals not selected | |
| Analysis 1.18  Comparison 1 Surgery versus control, Outcome 18 Change in six minute walk distance (metres). | ||||
| 18.1 at 3 months | 0 | Mean Difference (IV, Fixed, 95% CI) | 0.0 [0.0, 0.0] | |
| 18.2 at 6 months | 1 | Mean Difference (IV, Fixed, 95% CI) | 0.0 [0.0, 0.0] | |
| 18.3 at 12 months | 1 | Mean Difference (IV, Fixed, 95% CI) | 0.0 [0.0, 0.0] | |
| 18.4 at 24 months | 1 | Mean Difference (IV, Fixed, 95% CI) | 0.0 [0.0, 0.0] | |
| 19 FEV1 (L) Show forest plot | 5 | Mean Difference (IV, Fixed, 95% CI) | Subtotals only | |
| Analysis 1.19  Comparison 1 Surgery versus control, Outcome 19 FEV1 (L). | ||||
| 19.1 at 3 months | 3 | 122 | Mean Difference (IV, Fixed, 95% CI) | 0.23 [0.08, 0.37] |
| 19.2 at 6 months | 4 | 248 | Mean Difference (IV, Fixed, 95% CI) | 0.28 [0.20, 0.35] |
| 19.3 at 12 months | 0 | 0 | Mean Difference (IV, Fixed, 95% CI) | 0.0 [0.0, 0.0] |
| 20 Improvement in FEV1 % predicted Show forest plot | 1 | Odds Ratio (M‐H, Fixed, 95% CI) | Totals not selected | |
| Analysis 1.20  Comparison 1 Surgery versus control, Outcome 20 Improvement in FEV1 % predicted. | ||||
| 20.1 Six months | 1 | Odds Ratio (M‐H, Fixed, 95% CI) | 0.0 [0.0, 0.0] | |
| 20.2 12 months | 1 | Odds Ratio (M‐H, Fixed, 95% CI) | 0.0 [0.0, 0.0] | |
| 20.3 24 months | 1 | Odds Ratio (M‐H, Fixed, 95% CI) | 0.0 [0.0, 0.0] | |
| 21 No change/deterioration in FEV1 % predicted Show forest plot | 1 | Odds Ratio (M‐H, Fixed, 95% CI) | Totals not selected | |
| Analysis 1.21  Comparison 1 Surgery versus control, Outcome 21 No change/deterioration in FEV1 % predicted. | ||||
| 21.1 Six months | 1 | Odds Ratio (M‐H, Fixed, 95% CI) | 0.0 [0.0, 0.0] | |
| 21.2 12 months | 1 | Odds Ratio (M‐H, Fixed, 95% CI) | 0.0 [0.0, 0.0] | |
| 21.3 24 months | 1 | Odds Ratio (M‐H, Fixed, 95% CI) | 0.0 [0.0, 0.0] | |
| 22 Change in FEV1 (% predicted) Show forest plot | 1 | Mean Difference (IV, Fixed, 95% CI) | Totals not selected | |
| Analysis 1.22  Comparison 1 Surgery versus control, Outcome 22 Change in FEV1 (% predicted). | ||||
| 22.1 at 3 months | 0 | Mean Difference (IV, Fixed, 95% CI) | 0.0 [0.0, 0.0] | |
| 22.2 at 6 months | 1 | Mean Difference (IV, Fixed, 95% CI) | 0.0 [0.0, 0.0] | |
| 22.3 at 12 months | 1 | Mean Difference (IV, Fixed, 95% CI) | 0.0 [0.0, 0.0] | |
| 22.4 at 24 months | 1 | Mean Difference (IV, Fixed, 95% CI) | 0.0 [0.0, 0.0] | |
| 23 Total lung capacity (% of predicted) Show forest plot | 3 | 122 | Mean Difference (IV, Fixed, 95% CI) | ‐21.70 [‐30.97, ‐12.43] |
| Analysis 1.23  Comparison 1 Surgery versus control, Outcome 23 Total lung capacity (% of predicted). | ||||
| 23.1 at 3 months | 3 | 122 | Mean Difference (IV, Fixed, 95% CI) | ‐21.70 [‐30.97, ‐12.43] |
| 23.2 at 6 months | 0 | 0 | Mean Difference (IV, Fixed, 95% CI) | 0.0 [0.0, 0.0] |
| 23.3 at 12 months | 0 | 0 | Mean Difference (IV, Fixed, 95% CI) | 0.0 [0.0, 0.0] |
| 24 Residual lung volume (% of predicted) Show forest plot | 3 | 122 | Mean Difference (IV, Fixed, 95% CI) | ‐54.52 [‐75.17, ‐33.88] |
| Analysis 1.24  Comparison 1 Surgery versus control, Outcome 24 Residual lung volume (% of predicted). | ||||
| 24.1 at 3 months | 3 | 122 | Mean Difference (IV, Fixed, 95% CI) | ‐54.52 [‐75.17, ‐33.88] |
| 24.2 at 6 months | 0 | 0 | Mean Difference (IV, Fixed, 95% CI) | 0.0 [0.0, 0.0] |
| 24.3 at 12 months | 0 | 0 | Mean Difference (IV, Fixed, 95% CI) | 0.0 [0.0, 0.0] |
| 25 Mean direct medical costs and total healthcare‐related costs according to time after randomisation (USD 000s) Show forest plot | 1 | Mean Difference (IV, Fixed, 95% CI) | Totals not selected | |
| Analysis 1.25  Comparison 1 Surgery versus control, Outcome 25 Mean direct medical costs and total healthcare‐related costs according to time after randomisation (USD 000s). | ||||
| 25.1 Direct Medical Costs 0‐12 Months after randomisation (USD 000s) | 1 | Mean Difference (IV, Fixed, 95% CI) | 0.0 [0.0, 0.0] | |
| 25.2 Total Costs 0‐12 months after randomisation (USD 000s) | 1 | Mean Difference (IV, Fixed, 95% CI) | 0.0 [0.0, 0.0] | |
| 25.3 Direct medical costs 13‐24 months after randomisation (USD 000s) | 1 | Mean Difference (IV, Fixed, 95% CI) | 0.0 [0.0, 0.0] | |
| 25.4 Total costs 13‐24 months after randomisation (USD 000s) | 1 | Mean Difference (IV, Fixed, 95% CI) | 0.0 [0.0, 0.0] | |
| 25.5 Direct medical costs 25‐36 months after randomisation (USD 000s) | 1 | Mean Difference (IV, Fixed, 95% CI) | 0.0 [0.0, 0.0] | |
| 25.6 Total costs 25‐36 months after randomisation (USD 000s) | 1 | Mean Difference (IV, Fixed, 95% CI) | 0.0 [0.0, 0.0] | |
| 26 Mean direct medical costs and total healthcare‐related costs at three years (USD 000s) Show forest plot | 1 | Mean Difference (IV, Fixed, 95% CI) | Totals not selected | |
| Analysis 1.26  Comparison 1 Surgery versus control, Outcome 26 Mean direct medical costs and total healthcare‐related costs at three years (USD 000s). | ||||
| 27 Mean number of emergency‐room visits Show forest plot | 1 | Mean Difference (IV, Fixed, 95% CI) | Totals not selected | |
| Analysis 1.27  Comparison 1 Surgery versus control, Outcome 27 Mean number of emergency‐room visits. | ||||
| 27.1 0‐12 months | 1 | Mean Difference (IV, Fixed, 95% CI) | 0.0 [0.0, 0.0] | |
| 27.2 13‐24 months | 1 | Mean Difference (IV, Fixed, 95% CI) | 0.0 [0.0, 0.0] | |
| 27.3 25‐36 months | 1 | Mean Difference (IV, Fixed, 95% CI) | 0.0 [0.0, 0.0] | |
| Outcome or subgroup title | No. of studies | No. of participants | Statistical method | Effect size |
| 1 Post‐operative Death Show forest plot | 1 | Peto Odds Ratio (Peto, Fixed, 95% CI) | Totals not selected | |
| Analysis 2.1  Comparison 2 Laser versus stapling, Outcome 1 Post‐operative Death. | ||||
| 2 Hospital Days Show forest plot | 1 | Mean Difference (IV, Fixed, 95% CI) | Totals not selected | |
| Analysis 2.2  Comparison 2 Laser versus stapling, Outcome 2 Hospital Days. | ||||
| 3 Persistent air leaks (>7days) Show forest plot | 1 | Peto Odds Ratio (Peto, Fixed, 95% CI) | Totals not selected | |
| Analysis 2.3  Comparison 2 Laser versus stapling, Outcome 3 Persistent air leaks (>7days). | ||||
| 4 Delayed Pneumothorax Show forest plot | 1 | Peto Odds Ratio (Peto, Fixed, 95% CI) | Totals not selected | |
| Analysis 2.4  Comparison 2 Laser versus stapling, Outcome 4 Delayed Pneumothorax. | ||||
| 5 Supplemental Oxygen Show forest plot | 1 | Peto Odds Ratio (Peto, Fixed, 95% CI) | Totals not selected | |
| Analysis 2.5  Comparison 2 Laser versus stapling, Outcome 5 Supplemental Oxygen. | ||||
| 6 Quality of Life Show forest plot | 1 | Peto Odds Ratio (Peto, Fixed, 95% CI) | Totals not selected | |
| Analysis 2.6  Comparison 2 Laser versus stapling, Outcome 6 Quality of Life. | ||||
| 7 Change in FEV1 (%) Show forest plot | 1 | Mean Difference (IV, Fixed, 95% CI) | Totals not selected | |
| Analysis 2.7  Comparison 2 Laser versus stapling, Outcome 7 Change in FEV1 (%). | ||||
| 8 Change in FVC (%) Show forest plot | 1 | Mean Difference (IV, Fixed, 95% CI) | Totals not selected | |
| Analysis 2.8  Comparison 2 Laser versus stapling, Outcome 8 Change in FVC (%). | ||||
| Outcome or subgroup title | No. of studies | No. of participants | Statistical method | Effect size |
| 1 Mortality | 0 | Odds Ratio (M‐H, Fixed, 95% CI) | Totals not selected | |
| 2 Hospital stay (days) Show forest plot | 1 | Mean Difference (IV, Fixed, 95% CI) | Totals not selected | |
| Analysis 3.2  Comparison 3 Buttressed versus non‐buttressed stapling, Outcome 2 Hospital stay (days). | ||||
| 3 Post‐operative air leak Show forest plot | 1 | Odds Ratio (M‐H, Fixed, 95% CI) | Totals not selected | |
| Analysis 3.3  Comparison 3 Buttressed versus non‐buttressed stapling, Outcome 3 Post‐operative air leak. | ||||
| 4 Re‐operations following persistent air leak Show forest plot | 1 | Odds Ratio (M‐H, Fixed, 95% CI) | Totals not selected | |
| Analysis 3.4  Comparison 3 Buttressed versus non‐buttressed stapling, Outcome 4 Re‐operations following persistent air leak. | ||||
| 5 FEV1 (% predicted) Show forest plot | 1 | Mean Difference (IV, Fixed, 95% CI) | Totals not selected | |
| Analysis 3.5  Comparison 3 Buttressed versus non‐buttressed stapling, Outcome 5 FEV1 (% predicted). | ||||
| 6 Residual volume (% predicted) Show forest plot | 1 | Mean Difference (IV, Fixed, 95% CI) | Totals not selected | |
| Analysis 3.6  Comparison 3 Buttressed versus non‐buttressed stapling, Outcome 6 Residual volume (% predicted). | ||||
| 7 Total lung capacity (% predicted) Show forest plot | 1 | Mean Difference (IV, Fixed, 95% CI) | Totals not selected | |
| Analysis 3.7  Comparison 3 Buttressed versus non‐buttressed stapling, Outcome 7 Total lung capacity (% predicted). | ||||

Methodological quality summary: review authors' judgements about each methodological quality item for each included study.

Forest plot of comparison: 1 Surgery versus control, outcome: 1.1 Overall mortality (all patients, to end of follow‐up).

At 90 days one extra death occurs following LVRS, for every 16 people operated on.

At 90 days one extra death occurs following LVRS, for every 27 people operated on in the low risk arm of the NETT trial.

Comparison 1 Surgery versus control, Outcome 1 Overall mortality (all patients, to end of follow‐up).

Comparison 1 Surgery versus control, Outcome 2 Overall mortality (stratified by risk, to end of follow‐up).

Comparison 1 Surgery versus control, Outcome 3 30 Day Mortality in Non‐High Risk Patients.

Comparison 1 Surgery versus control, Outcome 4 90‐Day Mortality (all patients).

Comparison 1 Surgery versus control, Outcome 5 90‐Day Mortality (stratified by risk).

Comparison 1 Surgery versus control, Outcome 6 Change in SGRQ (six months).

Comparison 1 Surgery versus control, Outcome 7 Change in SGRQ (12 months).

Comparison 1 Surgery versus control, Outcome 8 Change in SGRQ (24 months).

Comparison 1 Surgery versus control, Outcome 9 Mean change in CRDQ domains (12 months).

Comparison 1 Surgery versus control, Outcome 10 Mean change in CRDQ domains (24 months).

Comparison 1 Surgery versus control, Outcome 11 Change in SF‐36 (six months).

Comparison 1 Surgery versus control, Outcome 12 Change in SF‐36 (12 months).

Comparison 1 Surgery versus control, Outcome 13 Improvement in health‐related quality of life (SGRQ).

Comparison 1 Surgery versus control, Outcome 14 No change/deterioration in health‐related quality of life (SGRQ).

Comparison 1 Surgery versus control, Outcome 15 Improvement in exercise capacity.

Comparison 1 Surgery versus control, Outcome 16 No change/deterioration in exercise capacity.

Comparison 1 Surgery versus control, Outcome 17 Six minute walk distance (metres).

Comparison 1 Surgery versus control, Outcome 18 Change in six minute walk distance (metres).

Comparison 1 Surgery versus control, Outcome 19 FEV1 (L).

Comparison 1 Surgery versus control, Outcome 20 Improvement in FEV1 % predicted.

Comparison 1 Surgery versus control, Outcome 21 No change/deterioration in FEV1 % predicted.

Comparison 1 Surgery versus control, Outcome 22 Change in FEV1 (% predicted).

Comparison 1 Surgery versus control, Outcome 23 Total lung capacity (% of predicted).
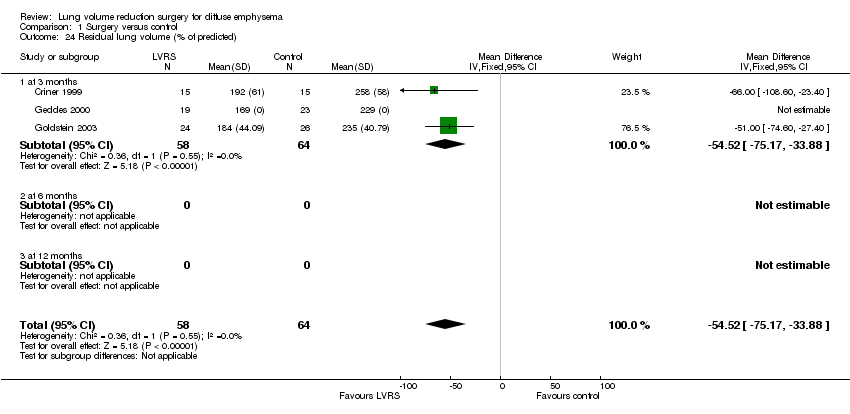
Comparison 1 Surgery versus control, Outcome 24 Residual lung volume (% of predicted).

Comparison 1 Surgery versus control, Outcome 25 Mean direct medical costs and total healthcare‐related costs according to time after randomisation (USD 000s).

Comparison 1 Surgery versus control, Outcome 26 Mean direct medical costs and total healthcare‐related costs at three years (USD 000s).
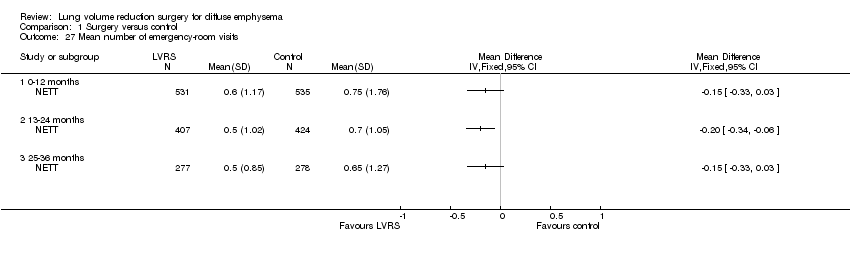
Comparison 1 Surgery versus control, Outcome 27 Mean number of emergency‐room visits.

Comparison 2 Laser versus stapling, Outcome 1 Post‐operative Death.

Comparison 2 Laser versus stapling, Outcome 2 Hospital Days.

Comparison 2 Laser versus stapling, Outcome 3 Persistent air leaks (>7days).

Comparison 2 Laser versus stapling, Outcome 4 Delayed Pneumothorax.

Comparison 2 Laser versus stapling, Outcome 5 Supplemental Oxygen.

Comparison 2 Laser versus stapling, Outcome 6 Quality of Life.

Comparison 2 Laser versus stapling, Outcome 7 Change in FEV1 (%).

Comparison 2 Laser versus stapling, Outcome 8 Change in FVC (%).

Comparison 3 Buttressed versus non‐buttressed stapling, Outcome 2 Hospital stay (days).

Comparison 3 Buttressed versus non‐buttressed stapling, Outcome 3 Post‐operative air leak.
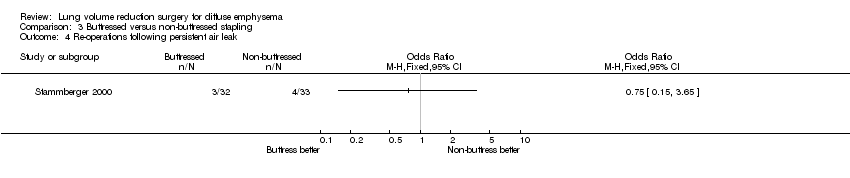
Comparison 3 Buttressed versus non‐buttressed stapling, Outcome 4 Re‐operations following persistent air leak.

Comparison 3 Buttressed versus non‐buttressed stapling, Outcome 5 FEV1 (% predicted).

Comparison 3 Buttressed versus non‐buttressed stapling, Outcome 6 Residual volume (% predicted).

Comparison 3 Buttressed versus non‐buttressed stapling, Outcome 7 Total lung capacity (% predicted).
| Search dates | Detail |
| 1. All years to December 1999 | References identified: 65 |
| 2. December 1999 to September 2005 | References identified: 253 |
| 3. September 2005 to October 2006 | References identified: 24 |
| 4. October 2006 to September 2007 | References identified: 7 |
| Study ID | Screened | Entered (% Screened) |
| Criner 1999 | 200 | 37 (19) |
| Geddes 2000 | 174 | 48 (28) |
| Goldstein 2003 | 328 | 55 (17) |
| Hillerdal 2005 | 304 | 106 (35) |
| McKenna 1996 | Unclear | 72 (unclear) |
| Miller 2005 | 738 | 93 (13) |
| NETT 2001 | 3777 | 1218 (32) |
| Stammberger 2000 | Unclear | 74 (unclear) |
| Total | 5521 | 1520 (28)* |
| Subgroup (OR) | Studies | N (combined) | CGER | NNT(h) |
| NETT defined 'high risk' | NETT 2001 | 140 | 0% | 4 |
| NETT defined 'non‐high risk' | NETT 2001 | 1078 | 25% | 27 |
| Unclear risk status | Geddes 2003; Goldstein 2003; Hillerdal 2005 | 285 | 1% | 9 |
| Subgroup (OR) | Studies | N (combined) | CGER | NNT (h) |
| NETT defined 'high risk' ‐ OR 2 (1.02 to 3.92) | NETT 2001 | 140 | 43% | 6 |
| NETT defined 'non‐high risk' ‐ 0.86 (0.64 to 1.14) | NETT 2001 | 1078 | 24% | NS |
| Unclear risk status ‐ OR: 2.21 (1 to 4.9) | Geddes 2000; Goldstein 2003; Hillerdal 2005; Miller 2005 | 285 | 8% | NS |
| Outcome or subgroup title | No. of studies | No. of participants | Statistical method | Effect size |
| 1 Overall mortality (all patients, to end of follow‐up) Show forest plot | 5 | 1503 | Odds Ratio (M‐H, Fixed, 95% CI) | 1.06 [0.83, 1.35] |
| 2 Overall mortality (stratified by risk, to end of follow‐up) Show forest plot | 5 | 1503 | Odds Ratio (M‐H, Fixed, 95% CI) | 1.06 [0.83, 1.36] |
| 2.1 High risk | 1 | 140 | Odds Ratio (M‐H, Fixed, 95% CI) | 2.0 [1.02, 3.92] |
| 2.2 Non‐high risk | 1 | 1078 | Odds Ratio (M‐H, Fixed, 95% CI) | 0.86 [0.64, 1.14] |
| 2.3 Unclear risk status | 4 | 285 | Odds Ratio (M‐H, Fixed, 95% CI) | 2.34 [0.98, 5.57] |
| 3 30 Day Mortality in Non‐High Risk Patients Show forest plot | 1 | Odds Ratio (M‐H, Fixed, 95% CI) | Totals not selected | |
| 4 90‐Day Mortality (all patients) Show forest plot | 4 | 1415 | Odds Ratio (M‐H, Fixed, 95% CI) | 6.57 [3.34, 12.95] |
| 5 90‐Day Mortality (stratified by risk) Show forest plot | 4 | 1415 | Odds Ratio (M‐H, Fixed, 95% CI) | 6.24 [3.24, 12.02] |
| 5.1 High risk | 1 | 140 | Odds Ratio (M‐H, Fixed, 95% CI) | 57.24 [3.38, 968.54] |
| 5.2 Non‐high risk | 1 | 1078 | Odds Ratio (M‐H, Fixed, 95% CI) | 3.65 [1.65, 8.09] |
| 5.3 Unclear risk status | 3 | 197 | Odds Ratio (M‐H, Fixed, 95% CI) | 7.08 [1.54, 32.58] |
| 6 Change in SGRQ (six months) Show forest plot | 2 | SGRQ (Fixed, 95% CI) | Subtotals only | |
| 6.1 Symptoms | 1 | SGRQ (Fixed, 95% CI) | ‐11.7 [‐20.15, ‐3.25] | |
| 6.2 Activity | 1 | SGRQ (Fixed, 95% CI) | ‐16.8 [‐23.10, ‐10.50] | |
| 6.3 Impacts | 1 | SGRQ (Fixed, 95% CI) | ‐13.1 [‐19.20, ‐7.00] | |
| 6.4 Total | 2 | SGRQ (Fixed, 95% CI) | ‐13.49 [‐15.13, ‐11.84] | |
| 7 Change in SGRQ (12 months) Show forest plot | 2 | SGRQ units (Fixed, 95% CI) | Subtotals only | |
| 7.1 Symptoms | 1 | SGRQ units (Fixed, 95% CI) | ‐8.8 [‐17.57, ‐0.03] | |
| 7.2 Activity | 1 | SGRQ units (Fixed, 95% CI) | ‐17.1 [‐22.65, ‐11.55] | |
| 7.3 Impacts | 1 | SGRQ units (Fixed, 95% CI) | ‐14.6 [‐20.05, ‐9.15] | |
| 7.4 Total | 2 | SGRQ units (Fixed, 95% CI) | ‐13.78 [‐15.75, ‐11.80] | |
| 8 Change in SGRQ (24 months) Show forest plot | 1 | Mean Difference (IV, Fixed, 95% CI) | Totals not selected | |
| 8.1 Symptoms | 0 | Mean Difference (IV, Fixed, 95% CI) | 0.0 [0.0, 0.0] | |
| 8.2 Activity | 0 | Mean Difference (IV, Fixed, 95% CI) | 0.0 [0.0, 0.0] | |
| 8.3 Impacts | 0 | Mean Difference (IV, Fixed, 95% CI) | 0.0 [0.0, 0.0] | |
| 8.4 Total | 1 | Mean Difference (IV, Fixed, 95% CI) | 0.0 [0.0, 0.0] | |
| 9 Mean change in CRDQ domains (12 months) Show forest plot | 1 | CRDQ units (Fixed, 95% CI) | Totals not selected | |
| 9.1 Dypnoea | 1 | CRDQ units (Fixed, 95% CI) | 0.0 [0.0, 0.0] | |
| 9.2 Fatigue | 1 | CRDQ units (Fixed, 95% CI) | 0.0 [0.0, 0.0] | |
| 9.3 Mastery | 1 | CRDQ units (Fixed, 95% CI) | 0.0 [0.0, 0.0] | |
| 9.4 Emotion | 1 | CRDQ units (Fixed, 95% CI) | 0.0 [0.0, 0.0] | |
| 10 Mean change in CRDQ domains (24 months) Show forest plot | 1 | CRDQ units (Fixed, 95% CI) | Totals not selected | |
| 10.1 Dypnoea | 1 | CRDQ units (Fixed, 95% CI) | 0.0 [0.0, 0.0] | |
| 10.2 Fatigue | 1 | CRDQ units (Fixed, 95% CI) | 0.0 [0.0, 0.0] | |
| 10.3 Mastery | 1 | CRDQ units (Fixed, 95% CI) | 0.0 [0.0, 0.0] | |
| 10.4 Emotion | 1 | CRDQ units (Fixed, 95% CI) | 0.0 [0.0, 0.0] | |
| 11 Change in SF‐36 (six months) Show forest plot | 1 | SF‐346 units (Fixed, 95% CI) | Totals not selected | |
| 11.1 Physical functioning | 1 | SF‐346 units (Fixed, 95% CI) | 0.0 [0.0, 0.0] | |
| 11.2 Role physical | 1 | SF‐346 units (Fixed, 95% CI) | 0.0 [0.0, 0.0] | |
| 11.3 Bodily pain | 1 | SF‐346 units (Fixed, 95% CI) | 0.0 [0.0, 0.0] | |
| 11.4 General health | 1 | SF‐346 units (Fixed, 95% CI) | 0.0 [0.0, 0.0] | |
| 11.5 Vitality | 1 | SF‐346 units (Fixed, 95% CI) | 0.0 [0.0, 0.0] | |
| 11.6 Social functioning | 1 | SF‐346 units (Fixed, 95% CI) | 0.0 [0.0, 0.0] | |
| 11.7 Role emotional | 1 | SF‐346 units (Fixed, 95% CI) | 0.0 [0.0, 0.0] | |
| 11.8 Mental health | 1 | SF‐346 units (Fixed, 95% CI) | 0.0 [0.0, 0.0] | |
| 12 Change in SF‐36 (12 months) Show forest plot | 1 | SF‐36 units (Fixed, 95% CI) | Totals not selected | |
| 12.1 Physical functioning | 1 | SF‐36 units (Fixed, 95% CI) | 0.0 [0.0, 0.0] | |
| 12.2 Role physical | 1 | SF‐36 units (Fixed, 95% CI) | 0.0 [0.0, 0.0] | |
| 12.3 Bodily pain | 1 | SF‐36 units (Fixed, 95% CI) | 0.0 [0.0, 0.0] | |
| 12.4 General health | 1 | SF‐36 units (Fixed, 95% CI) | 0.0 [0.0, 0.0] | |
| 12.5 Vitality | 1 | SF‐36 units (Fixed, 95% CI) | 0.0 [0.0, 0.0] | |
| 12.6 Social functioning | 1 | SF‐36 units (Fixed, 95% CI) | 0.0 [0.0, 0.0] | |
| 12.7 Role emotional | 1 | SF‐36 units (Fixed, 95% CI) | 0.0 [0.0, 0.0] | |
| 12.8 Mental health | 1 | SF‐36 units (Fixed, 95% CI) | 0.0 [0.0, 0.0] | |
| 13 Improvement in health‐related quality of life (SGRQ) Show forest plot | 1 | Odds Ratio (M‐H, Fixed, 95% CI) | Totals not selected | |
| 13.1 Six months | 1 | Odds Ratio (M‐H, Fixed, 95% CI) | 0.0 [0.0, 0.0] | |
| 13.2 12 months | 1 | Odds Ratio (M‐H, Fixed, 95% CI) | 0.0 [0.0, 0.0] | |
| 13.3 24 months | 1 | Odds Ratio (M‐H, Fixed, 95% CI) | 0.0 [0.0, 0.0] | |
| 14 No change/deterioration in health‐related quality of life (SGRQ) Show forest plot | 1 | Odds Ratio (M‐H, Fixed, 95% CI) | Totals not selected | |
| 14.1 Six months | 1 | Odds Ratio (M‐H, Fixed, 95% CI) | 0.0 [0.0, 0.0] | |
| 14.2 12 months | 1 | Odds Ratio (M‐H, Fixed, 95% CI) | 0.0 [0.0, 0.0] | |
| 14.3 24 months | 1 | Odds Ratio (M‐H, Fixed, 95% CI) | 0.0 [0.0, 0.0] | |
| 15 Improvement in exercise capacity Show forest plot | 1 | Odds Ratio (M‐H, Fixed, 95% CI) | Totals not selected | |
| 15.1 Six months | 1 | Odds Ratio (M‐H, Fixed, 95% CI) | 0.0 [0.0, 0.0] | |
| 15.2 12 months | 1 | Odds Ratio (M‐H, Fixed, 95% CI) | 0.0 [0.0, 0.0] | |
| 15.3 24 months | 1 | Odds Ratio (M‐H, Fixed, 95% CI) | 0.0 [0.0, 0.0] | |
| 16 No change/deterioration in exercise capacity Show forest plot | 1 | Odds Ratio (M‐H, Fixed, 95% CI) | Totals not selected | |
| 16.1 Six months | 1 | Odds Ratio (M‐H, Fixed, 95% CI) | 0.0 [0.0, 0.0] | |
| 16.2 12 months | 1 | Odds Ratio (M‐H, Fixed, 95% CI) | 0.0 [0.0, 0.0] | |
| 16.3 24 months | 1 | Odds Ratio (M‐H, Fixed, 95% CI) | 0.0 [0.0, 0.0] | |
| 17 Six minute walk distance (metres) Show forest plot | 3 | Mean Difference (IV, Fixed, 95% CI) | Subtotals only | |
| 17.1 at 3 months | 2 | 80 | Mean Difference (IV, Fixed, 95% CI) | 20.85 [‐9.36, 51.07] |
| 17.2 at 6 months | 1 | 81 | Mean Difference (IV, Fixed, 95% CI) | 55.0 [9.58, 100.42] |
| 17.3 at 12 months | 0 | 0 | Mean Difference (IV, Fixed, 95% CI) | 0.0 [0.0, 0.0] |
| 18 Change in six minute walk distance (metres) Show forest plot | 1 | Mean Difference (IV, Fixed, 95% CI) | Totals not selected | |
| 18.1 at 3 months | 0 | Mean Difference (IV, Fixed, 95% CI) | 0.0 [0.0, 0.0] | |
| 18.2 at 6 months | 1 | Mean Difference (IV, Fixed, 95% CI) | 0.0 [0.0, 0.0] | |
| 18.3 at 12 months | 1 | Mean Difference (IV, Fixed, 95% CI) | 0.0 [0.0, 0.0] | |
| 18.4 at 24 months | 1 | Mean Difference (IV, Fixed, 95% CI) | 0.0 [0.0, 0.0] | |
| 19 FEV1 (L) Show forest plot | 5 | Mean Difference (IV, Fixed, 95% CI) | Subtotals only | |
| 19.1 at 3 months | 3 | 122 | Mean Difference (IV, Fixed, 95% CI) | 0.23 [0.08, 0.37] |
| 19.2 at 6 months | 4 | 248 | Mean Difference (IV, Fixed, 95% CI) | 0.28 [0.20, 0.35] |
| 19.3 at 12 months | 0 | 0 | Mean Difference (IV, Fixed, 95% CI) | 0.0 [0.0, 0.0] |
| 20 Improvement in FEV1 % predicted Show forest plot | 1 | Odds Ratio (M‐H, Fixed, 95% CI) | Totals not selected | |
| 20.1 Six months | 1 | Odds Ratio (M‐H, Fixed, 95% CI) | 0.0 [0.0, 0.0] | |
| 20.2 12 months | 1 | Odds Ratio (M‐H, Fixed, 95% CI) | 0.0 [0.0, 0.0] | |
| 20.3 24 months | 1 | Odds Ratio (M‐H, Fixed, 95% CI) | 0.0 [0.0, 0.0] | |
| 21 No change/deterioration in FEV1 % predicted Show forest plot | 1 | Odds Ratio (M‐H, Fixed, 95% CI) | Totals not selected | |
| 21.1 Six months | 1 | Odds Ratio (M‐H, Fixed, 95% CI) | 0.0 [0.0, 0.0] | |
| 21.2 12 months | 1 | Odds Ratio (M‐H, Fixed, 95% CI) | 0.0 [0.0, 0.0] | |
| 21.3 24 months | 1 | Odds Ratio (M‐H, Fixed, 95% CI) | 0.0 [0.0, 0.0] | |
| 22 Change in FEV1 (% predicted) Show forest plot | 1 | Mean Difference (IV, Fixed, 95% CI) | Totals not selected | |
| 22.1 at 3 months | 0 | Mean Difference (IV, Fixed, 95% CI) | 0.0 [0.0, 0.0] | |
| 22.2 at 6 months | 1 | Mean Difference (IV, Fixed, 95% CI) | 0.0 [0.0, 0.0] | |
| 22.3 at 12 months | 1 | Mean Difference (IV, Fixed, 95% CI) | 0.0 [0.0, 0.0] | |
| 22.4 at 24 months | 1 | Mean Difference (IV, Fixed, 95% CI) | 0.0 [0.0, 0.0] | |
| 23 Total lung capacity (% of predicted) Show forest plot | 3 | 122 | Mean Difference (IV, Fixed, 95% CI) | ‐21.70 [‐30.97, ‐12.43] |
| 23.1 at 3 months | 3 | 122 | Mean Difference (IV, Fixed, 95% CI) | ‐21.70 [‐30.97, ‐12.43] |
| 23.2 at 6 months | 0 | 0 | Mean Difference (IV, Fixed, 95% CI) | 0.0 [0.0, 0.0] |
| 23.3 at 12 months | 0 | 0 | Mean Difference (IV, Fixed, 95% CI) | 0.0 [0.0, 0.0] |
| 24 Residual lung volume (% of predicted) Show forest plot | 3 | 122 | Mean Difference (IV, Fixed, 95% CI) | ‐54.52 [‐75.17, ‐33.88] |
| 24.1 at 3 months | 3 | 122 | Mean Difference (IV, Fixed, 95% CI) | ‐54.52 [‐75.17, ‐33.88] |
| 24.2 at 6 months | 0 | 0 | Mean Difference (IV, Fixed, 95% CI) | 0.0 [0.0, 0.0] |
| 24.3 at 12 months | 0 | 0 | Mean Difference (IV, Fixed, 95% CI) | 0.0 [0.0, 0.0] |
| 25 Mean direct medical costs and total healthcare‐related costs according to time after randomisation (USD 000s) Show forest plot | 1 | Mean Difference (IV, Fixed, 95% CI) | Totals not selected | |
| 25.1 Direct Medical Costs 0‐12 Months after randomisation (USD 000s) | 1 | Mean Difference (IV, Fixed, 95% CI) | 0.0 [0.0, 0.0] | |
| 25.2 Total Costs 0‐12 months after randomisation (USD 000s) | 1 | Mean Difference (IV, Fixed, 95% CI) | 0.0 [0.0, 0.0] | |
| 25.3 Direct medical costs 13‐24 months after randomisation (USD 000s) | 1 | Mean Difference (IV, Fixed, 95% CI) | 0.0 [0.0, 0.0] | |
| 25.4 Total costs 13‐24 months after randomisation (USD 000s) | 1 | Mean Difference (IV, Fixed, 95% CI) | 0.0 [0.0, 0.0] | |
| 25.5 Direct medical costs 25‐36 months after randomisation (USD 000s) | 1 | Mean Difference (IV, Fixed, 95% CI) | 0.0 [0.0, 0.0] | |
| 25.6 Total costs 25‐36 months after randomisation (USD 000s) | 1 | Mean Difference (IV, Fixed, 95% CI) | 0.0 [0.0, 0.0] | |
| 26 Mean direct medical costs and total healthcare‐related costs at three years (USD 000s) Show forest plot | 1 | Mean Difference (IV, Fixed, 95% CI) | Totals not selected | |
| 27 Mean number of emergency‐room visits Show forest plot | 1 | Mean Difference (IV, Fixed, 95% CI) | Totals not selected | |
| 27.1 0‐12 months | 1 | Mean Difference (IV, Fixed, 95% CI) | 0.0 [0.0, 0.0] | |
| 27.2 13‐24 months | 1 | Mean Difference (IV, Fixed, 95% CI) | 0.0 [0.0, 0.0] | |
| 27.3 25‐36 months | 1 | Mean Difference (IV, Fixed, 95% CI) | 0.0 [0.0, 0.0] | |
| Outcome or subgroup title | No. of studies | No. of participants | Statistical method | Effect size |
| 1 Post‐operative Death Show forest plot | 1 | Peto Odds Ratio (Peto, Fixed, 95% CI) | Totals not selected | |
| 2 Hospital Days Show forest plot | 1 | Mean Difference (IV, Fixed, 95% CI) | Totals not selected | |
| 3 Persistent air leaks (>7days) Show forest plot | 1 | Peto Odds Ratio (Peto, Fixed, 95% CI) | Totals not selected | |
| 4 Delayed Pneumothorax Show forest plot | 1 | Peto Odds Ratio (Peto, Fixed, 95% CI) | Totals not selected | |
| 5 Supplemental Oxygen Show forest plot | 1 | Peto Odds Ratio (Peto, Fixed, 95% CI) | Totals not selected | |
| 6 Quality of Life Show forest plot | 1 | Peto Odds Ratio (Peto, Fixed, 95% CI) | Totals not selected | |
| 7 Change in FEV1 (%) Show forest plot | 1 | Mean Difference (IV, Fixed, 95% CI) | Totals not selected | |
| 8 Change in FVC (%) Show forest plot | 1 | Mean Difference (IV, Fixed, 95% CI) | Totals not selected | |
| Outcome or subgroup title | No. of studies | No. of participants | Statistical method | Effect size |
| 1 Mortality | 0 | Odds Ratio (M‐H, Fixed, 95% CI) | Totals not selected | |
| 2 Hospital stay (days) Show forest plot | 1 | Mean Difference (IV, Fixed, 95% CI) | Totals not selected | |
| 3 Post‐operative air leak Show forest plot | 1 | Odds Ratio (M‐H, Fixed, 95% CI) | Totals not selected | |
| 4 Re‐operations following persistent air leak Show forest plot | 1 | Odds Ratio (M‐H, Fixed, 95% CI) | Totals not selected | |
| 5 FEV1 (% predicted) Show forest plot | 1 | Mean Difference (IV, Fixed, 95% CI) | Totals not selected | |
| 6 Residual volume (% predicted) Show forest plot | 1 | Mean Difference (IV, Fixed, 95% CI) | Totals not selected | |
| 7 Total lung capacity (% predicted) Show forest plot | 1 | Mean Difference (IV, Fixed, 95% CI) | Totals not selected | |