Scolaris Content Display Scolaris Content Display

Study flow diagram.
Figuras y tablas -
Figure 1

Study flow diagram.

Risk of bias graph: review authors' judgements about each risk of bias item presented as percentages across all included studies.
Figuras y tablas -
Figure 2

Risk of bias graph: review authors' judgements about each risk of bias item presented as percentages across all included studies.

Risk of bias summary: review authors' judgements about each risk of bias item for each included study.
Figuras y tablas -
Figure 3

Risk of bias summary: review authors' judgements about each risk of bias item for each included study.

Funnel plot of comparison: 1 Overall outcomes: exercise regimen compared with placebo or usual care, outcome: 1.1 Maximum walking time (min).
Figuras y tablas -
Figure 4

Funnel plot of comparison: 1 Overall outcomes: exercise regimen compared with placebo or usual care, outcome: 1.1 Maximum walking time (min).

Funnel plot of comparison: 1 Overall outcomes: exercise regimen compared with placebo or usual care, outcome: 1.4 Pain‐free walking time (min).
Figuras y tablas -
Figure 5

Funnel plot of comparison: 1 Overall outcomes: exercise regimen compared with placebo or usual care, outcome: 1.4 Pain‐free walking time (min).

Funnel plot of comparison: 1 Overall outcomes: Exercise regimen compared with placebo or usual care, outcome: 1.5 Ankle brachial index.
Figuras y tablas -
Figure 6

Funnel plot of comparison: 1 Overall outcomes: Exercise regimen compared with placebo or usual care, outcome: 1.5 Ankle brachial index.

Comparison 1 Overall outcomes: exercise regimen compared with placebo or usual care, Outcome 1 Maximum walking distance (m).
Figuras y tablas -
Analysis 1.1

Comparison 1 Overall outcomes: exercise regimen compared with placebo or usual care, Outcome 1 Maximum walking distance (m).

Comparison 1 Overall outcomes: exercise regimen compared with placebo or usual care, Outcome 2 Pain‐free walking distance (m).
Figuras y tablas -
Analysis 1.2

Comparison 1 Overall outcomes: exercise regimen compared with placebo or usual care, Outcome 2 Pain‐free walking distance (m).

Comparison 1 Overall outcomes: exercise regimen compared with placebo or usual care, Outcome 3 Maximum walking time (min).
Figuras y tablas -
Analysis 1.3

Comparison 1 Overall outcomes: exercise regimen compared with placebo or usual care, Outcome 3 Maximum walking time (min).

Comparison 1 Overall outcomes: exercise regimen compared with placebo or usual care, Outcome 4 Pain‐free walking time (min).
Figuras y tablas -
Analysis 1.4

Comparison 1 Overall outcomes: exercise regimen compared with placebo or usual care, Outcome 4 Pain‐free walking time (min).

Comparison 1 Overall outcomes: exercise regimen compared with placebo or usual care, Outcome 5 Change in MWD/T.
Figuras y tablas -
Analysis 1.5

Comparison 1 Overall outcomes: exercise regimen compared with placebo or usual care, Outcome 5 Change in MWD/T.

Comparison 1 Overall outcomes: exercise regimen compared with placebo or usual care, Outcome 6 Change in ICD/T.
Figuras y tablas -
Analysis 1.6

Comparison 1 Overall outcomes: exercise regimen compared with placebo or usual care, Outcome 6 Change in ICD/T.

Comparison 1 Overall outcomes: exercise regimen compared with placebo or usual care, Outcome 7 Ankle brachial index.
Figuras y tablas -
Analysis 1.7

Comparison 1 Overall outcomes: exercise regimen compared with placebo or usual care, Outcome 7 Ankle brachial index.

Comparison 1 Overall outcomes: exercise regimen compared with placebo or usual care, Outcome 8 Mortality.
Figuras y tablas -
Analysis 1.8

Comparison 1 Overall outcomes: exercise regimen compared with placebo or usual care, Outcome 8 Mortality.

Comparison 1 Overall outcomes: exercise regimen compared with placebo or usual care, Outcome 9 Amputation.
Figuras y tablas -
Analysis 1.9

Comparison 1 Overall outcomes: exercise regimen compared with placebo or usual care, Outcome 9 Amputation.

Comparison 1 Overall outcomes: exercise regimen compared with placebo or usual care, Outcome 10 Peak exercise calf blood flow (mL/100 mL/min).
Figuras y tablas -
Analysis 1.10

Comparison 1 Overall outcomes: exercise regimen compared with placebo or usual care, Outcome 10 Peak exercise calf blood flow (mL/100 mL/min).

Comparison 2 Three‐monthly outcomes: exercise regimen compared with placebo or usual care, Outcome 1 Maximum walking distance (m).
Figuras y tablas -
Analysis 2.1

Comparison 2 Three‐monthly outcomes: exercise regimen compared with placebo or usual care, Outcome 1 Maximum walking distance (m).

Comparison 2 Three‐monthly outcomes: exercise regimen compared with placebo or usual care, Outcome 2 Pain‐free walking distance (m).
Figuras y tablas -
Analysis 2.2

Comparison 2 Three‐monthly outcomes: exercise regimen compared with placebo or usual care, Outcome 2 Pain‐free walking distance (m).

Comparison 2 Three‐monthly outcomes: exercise regimen compared with placebo or usual care, Outcome 3 Maximum walking time (min).
Figuras y tablas -
Analysis 2.3

Comparison 2 Three‐monthly outcomes: exercise regimen compared with placebo or usual care, Outcome 3 Maximum walking time (min).

Comparison 2 Three‐monthly outcomes: exercise regimen compared with placebo or usual care, Outcome 4 Pain‐free walking time (min).
Figuras y tablas -
Analysis 2.4

Comparison 2 Three‐monthly outcomes: exercise regimen compared with placebo or usual care, Outcome 4 Pain‐free walking time (min).

Comparison 2 Three‐monthly outcomes: exercise regimen compared with placebo or usual care, Outcome 5 Ankle brachial index.
Figuras y tablas -
Analysis 2.5

Comparison 2 Three‐monthly outcomes: exercise regimen compared with placebo or usual care, Outcome 5 Ankle brachial index.

Comparison 2 Three‐monthly outcomes: exercise regimen compared with placebo or usual care, Outcome 6 Mortality.
Figuras y tablas -
Analysis 2.6

Comparison 2 Three‐monthly outcomes: exercise regimen compared with placebo or usual care, Outcome 6 Mortality.

Comparison 2 Three‐monthly outcomes: exercise regimen compared with placebo or usual care, Outcome 7 Quality of Life SF‐36.
Figuras y tablas -
Analysis 2.7

Comparison 2 Three‐monthly outcomes: exercise regimen compared with placebo or usual care, Outcome 7 Quality of Life SF‐36.

Comparison 2 Three‐monthly outcomes: exercise regimen compared with placebo or usual care, Outcome 8 Peak exercise calf blood flow (mL/100 mL/min).
Figuras y tablas -
Analysis 2.8

Comparison 2 Three‐monthly outcomes: exercise regimen compared with placebo or usual care, Outcome 8 Peak exercise calf blood flow (mL/100 mL/min).

Comparison 3 Six‐monthly outcomes: exercise regimen compared with placebo or usual care, Outcome 1 Maximum walking distance (m).
Figuras y tablas -
Analysis 3.1

Comparison 3 Six‐monthly outcomes: exercise regimen compared with placebo or usual care, Outcome 1 Maximum walking distance (m).

Comparison 3 Six‐monthly outcomes: exercise regimen compared with placebo or usual care, Outcome 2 Pain‐free walking distance (m).
Figuras y tablas -
Analysis 3.2

Comparison 3 Six‐monthly outcomes: exercise regimen compared with placebo or usual care, Outcome 2 Pain‐free walking distance (m).

Comparison 3 Six‐monthly outcomes: exercise regimen compared with placebo or usual care, Outcome 3 Maximum walking time (min).
Figuras y tablas -
Analysis 3.3

Comparison 3 Six‐monthly outcomes: exercise regimen compared with placebo or usual care, Outcome 3 Maximum walking time (min).

Comparison 3 Six‐monthly outcomes: exercise regimen compared with placebo or usual care, Outcome 4 Pain‐free walking time (min).
Figuras y tablas -
Analysis 3.4

Comparison 3 Six‐monthly outcomes: exercise regimen compared with placebo or usual care, Outcome 4 Pain‐free walking time (min).

Comparison 3 Six‐monthly outcomes: exercise regimen compared with placebo or usual care, Outcome 5 Ankle brachial index.
Figuras y tablas -
Analysis 3.5

Comparison 3 Six‐monthly outcomes: exercise regimen compared with placebo or usual care, Outcome 5 Ankle brachial index.

Comparison 3 Six‐monthly outcomes: exercise regimen compared with placebo or usual care, Outcome 6 Mortality.
Figuras y tablas -
Analysis 3.6

Comparison 3 Six‐monthly outcomes: exercise regimen compared with placebo or usual care, Outcome 6 Mortality.

Comparison 3 Six‐monthly outcomes: exercise regimen compared with placebo or usual care, Outcome 7 Quality of Life SF‐36.
Figuras y tablas -
Analysis 3.7

Comparison 3 Six‐monthly outcomes: exercise regimen compared with placebo or usual care, Outcome 7 Quality of Life SF‐36.

Comparison 3 Six‐monthly outcomes: exercise regimen compared with placebo or usual care, Outcome 8 Peak exercise calf blood flow (mL/100 mL/min).
Figuras y tablas -
Analysis 3.8

Comparison 3 Six‐monthly outcomes: exercise regimen compared with placebo or usual care, Outcome 8 Peak exercise calf blood flow (mL/100 mL/min).

Comparison 4 Exercise regimen compared with antiplatelet therapy, Outcome 1 Maximum walking time (min).
Figuras y tablas -
Analysis 4.1

Comparison 4 Exercise regimen compared with antiplatelet therapy, Outcome 1 Maximum walking time (min).

Comparison 4 Exercise regimen compared with antiplatelet therapy, Outcome 2 Ankle brachial index.
Figuras y tablas -
Analysis 4.2

Comparison 4 Exercise regimen compared with antiplatelet therapy, Outcome 2 Ankle brachial index.

Comparison 4 Exercise regimen compared with antiplatelet therapy, Outcome 3 Peak exercise calf blood flow (mL/100 mL/min).
Figuras y tablas -
Analysis 4.3

Comparison 4 Exercise regimen compared with antiplatelet therapy, Outcome 3 Peak exercise calf blood flow (mL/100 mL/min).

Comparison 5 Exercise regimen compared with pentoxifylline therapy, Outcome 1 Maximum walking time (min).
Figuras y tablas -
Analysis 5.1

Comparison 5 Exercise regimen compared with pentoxifylline therapy, Outcome 1 Maximum walking time (min).

Comparison 6 Exercise regimen compared with iloprost therapy, Outcome 1 Maximum walking distance (m).
Figuras y tablas -
Analysis 6.1

Comparison 6 Exercise regimen compared with iloprost therapy, Outcome 1 Maximum walking distance (m).

Comparison 6 Exercise regimen compared with iloprost therapy, Outcome 2 Pain‐free walking distance (m).
Figuras y tablas -
Analysis 6.2

Comparison 6 Exercise regimen compared with iloprost therapy, Outcome 2 Pain‐free walking distance (m).

Comparison 7 Exercise regimen compared with pneumatic foot and calf compression, Outcome 1 Maximum walking distance (m).
Figuras y tablas -
Analysis 7.1

Comparison 7 Exercise regimen compared with pneumatic foot and calf compression, Outcome 1 Maximum walking distance (m).

Comparison 7 Exercise regimen compared with pneumatic foot and calf compression, Outcome 2 Pain‐free walking distance (m).
Figuras y tablas -
Analysis 7.2

Comparison 7 Exercise regimen compared with pneumatic foot and calf compression, Outcome 2 Pain‐free walking distance (m).

Comparison 7 Exercise regimen compared with pneumatic foot and calf compression, Outcome 3 Mortality.
Figuras y tablas -
Analysis 7.3

Comparison 7 Exercise regimen compared with pneumatic foot and calf compression, Outcome 3 Mortality.

Comparison 8 Exercise regimen compared with vitamin E, Outcome 1 3‐monthly maximum walking time (min).
Figuras y tablas -
Analysis 8.1

Comparison 8 Exercise regimen compared with vitamin E, Outcome 1 3‐monthly maximum walking time (min).

Comparison 8 Exercise regimen compared with vitamin E, Outcome 2 6‐monthly maximum walking time (min).
Figuras y tablas -
Analysis 8.2

Comparison 8 Exercise regimen compared with vitamin E, Outcome 2 6‐monthly maximum walking time (min).

Comparison 8 Exercise regimen compared with vitamin E, Outcome 3 3‐monthly ABI.
Figuras y tablas -
Analysis 8.3

Comparison 8 Exercise regimen compared with vitamin E, Outcome 3 3‐monthly ABI.

Comparison 8 Exercise regimen compared with vitamin E, Outcome 4 6‐monthly ABI.
Figuras y tablas -
Analysis 8.4

Comparison 8 Exercise regimen compared with vitamin E, Outcome 4 6‐monthly ABI.

Summary of findings for the main comparison. Is exercise an effective intervention in intermittent claudication?

Exercise compared with no exercise for intermittent claudication

Patient or population: adults with intermittent claudication

Settings: hospital or community‐based physical therapy exercise programmes

Intervention: exercisea

Comparison: no exercise (previously known as usual care)

Outcomes

Illustrative comparative risks* (95% CI)b

Relative effect
(95% CI)

No. of participants
(studies)

Quality of the evidence
(GRADE)

Comments

Assumed risk

Corresponding risk

No exercise

Exercisea

Pain‐free walking distance (m)

follow‐up:

6 weeks to 24 months

Mean pain‐free walking distance ranged across control groups from
63.3 m to 253 m.

Mean pain‐free walking distance (m) in exercise groups ranged from 116 m to 413 m. MD was 82.11 m further in the exercise group.

(95% CI 71.73 to 92.48)

391
(9 RCTs)

⊕⊕⊕⊕
highc

4/9 studies (Cucato 2013; Gardner 2002; Jansen 1991 and Mika 2005) reported a clear improvement.

Maximum walking distance (m)

follow‐up:

6 weeks to 24 months

Mean maximum walking distance ranged across control groups from 122 m to 771 m.

Mean maximum walking distance (m) in exercise groups ranged from 136 m to 1100 m. MD was 120.36 m further in the exercise group.

(95% CI 50.79 to 189.92)

500
(10 RCTs)

⊕⊕⊕⊕
highd

5/10 studies (Cucato 2013; Gardner 2002; Jansen 1991; Tew 2015; Zwierska 2005) reported a clear improvement.

Ankle brachial index

follow‐up:

3 to 12 months

Mean ABI ranged across control groups from 0.32 to 0.89.

Mean ABI in exercise groups ranged from 0.34 to 0.96. MD was 0.04 higher in the exercise group.

(95% CI 0.00 to 0.08)

570
(13 RCTs)

⊕⊕⊕⊝
moderatee

A change in ABI of 0.04 is of limited clinical significance.

Mortality: all‐cause deaths

follow‐up: 3 to 12 months

A total of 9/273 deaths occurred in the no exercise group.

A total of 8/267 deaths occurred in the exercise group.

RR 0.92 (0.39 to 2.17)

540

(5 RCTs)

⊕⊕⊕⊝
moderatef

Amputation

follow‐up: 12 months

A total of 2/88 amputations occurred in the no exercise group.

No amputations occurred in the exercise group (0/89).

RR 0.20 (0.01 to 4.15)

177
(1 RCT)

⊕⊕⊝⊝
lowg

Quality of Life SF‐36

Physical Summary score (scale 0 to 100, higher score indicates better quality of life)

follow‐up: 6 months

Mean physical summary score ranged across control groups from

34.2 to 47.1.

Mean Physical Summary score in exercise groups ranged from 41 to 54.1. MD score was 2.15
higher in the exercise group.

(95% CI 1.26 to 3.04)

429

(5 RCTs)

⊕⊕⊕⊝
moderateh

Quality of Life SF‐36

Mental Summary score (scale 0 to 100, higher score indicates better quality of life)

follow‐up: 6 months

Mean Mental Summary score ranged across control groups from

38.8 to 62.0.

Mean Mental Summary score in exercise groups ranged from 39.6 to 67. MD score was 3.76
higher in the exercise group.

(95% CI 2.7 to 4.82)

343

(4 RCTs)

⊕⊕⊕⊝
moderatei

*The basis for the assumed risk (e.g. the median control group risk across studies) is provided in footnotes. The corresponding risk (and its 95% confidence interval) is based on the assumed risk in the comparison group and the relative effect of the intervention (and its 95% CI).
ABI: ankle brachial index; CI: confidence interval; MD: mean difference; RCT: randomised controlled trial; RR: risk ratio; SF: Short Form.

GRADE Working Group grades of evidence.
High quality: Further research is very unlikely to change our confidence in the estimate of effect.
Moderate quality: Further research is likely to have an important impact on our confidence in the estimate of effect and may change the estimate.
Low quality: Further research is very likely to have an important impact on our confidence in the estimate of effect and is likely to change the estimate.
Very low quality: We are very uncertain about the estimate.

aVariability in type, duration, and frequency of exercise programmes as prescribed. Exercise programmes included a duration of six weeks up to one year, generally twice or three times a week, varying in length between 30 minutes and one hour.
bWhen possible, the no exercise (control) groups results were measured at the same time point and were used in the meta‐analysis to calculate assumed risk.
cThe level of evidence was high, as most trials were of high quality.
dThe level of evidence was high, as most trials were of high quality. Heterogeneity was significant (P = 0.01, I2 = 89%), and CIs were broad (50.79 to 189.92). However further research is unlikely to change this.
eWe downgraded by one step owing to significant heterogeneity (P ≤ 0.01, I2 = 64%); however CIs were narrow (0.00 to 0.09). Given the size of the data set, it is unlikely that further data will demonstrate a difference between the two groups.
fWe downgraded the evidence by one step, as analysis included only five small studies (of which one was underpowered) and showed wide confidence intervals (imprecision).
gWe downgraded the evidence by two steps, as data are from a single study with wide CIs (imprecision) and events were few overall.
hWe downgraded owing to heterogeneity (P = 0.02, I2 = 66%), narrow CI (1.26 to 3.04), and a symmetrical distribution on funnel plot. Other quality of life measures were used and have been described more fully in the additional Table 1. Improvement was also seen in the following domains: vitality and role physical at three months, physical function, and general health at six months.
iWe downgraded owing to heterogeneity (P < 0.01, I2 = 87%), narrow CI (2.70 to 4.82), and a symmetrical distribution on funnel plot. Additional improvements in other domains may be seen in the future as more studies report their outcomes for quality of life scores.

Figuras y tablas -
Summary of findings for the main comparison. Is exercise an effective intervention in intermittent claudication?
Table 1. Functional status and quality of life data (QoL) for all studies

Study

Measure reported

Effect reported

Collins 2005

Walking Impairment Questionnaire (WIQ) ‐ perceived distance and walking speed

On the basis of analysis of change scores, the polestriding group reported significantly greater perceived ability to walk distance than the control group at 4 (P = 0.05), 12 (P = 0.001), and 24 (P = 0.002) weeks. Moreover, the polestriding group rated their perceived ability to walk faster to be significantly greater than the control group at 4 (P = 0.03), 12 (P = 0.19), and 24 (P = 0.02) weeks. The groups’ ratings were equivalent at baseline (P > 0.05). In the polestriding group, polestriding aggregate scores for both distance and speed improved significantly between baseline and 12 weeks (P < 0.0001) and baseline and 24 weeks (P < 0.0001), but not between 12 and 24 weeks (P > 0.015). The perception of walking speed and distance did not improve in the control group.

Rand Short Form‐36 (SF‐36) ‐ perceived physical function

Exercise significantly improved the Physical Component Summary score (PSS) of SF‐36 when compared with usual care. Difference using the change score between polestriding and control groups for the PSS was significant; P = 0.03. There was no difference in the change on the Mental Component Summary score between groups.

Gardner 2002

Health‐related quality of life (QoL) assessed with the Medical Outcomes Study Short Form‐36 (MOS SF‐36)

Baseline measures of health‐related QoL were comparable in both groups.

The physical and mental health composite scores of the MOS SF‐36 were similar between the 2 groups and did not change during the study. Consequently, no analyses were performed on the individual subscales.

WIQ

No change in the WIQ was identified. Baseline scores on the 3 WIQ subscales ranged between 32% and 52%. Although the exercise group increased by 22% and 34% on the distance and speed subscales, respectively, these changes were not significant and did not differ from the changes in controls.

Gelin 2001

Intermittent Claudication‐specific Sickness Impact Profile (SIP) scale, SIPIC

Supervised physical training produced significant improvements from baseline in only 2 health‐related quality of life (HRQoL) domains (SIP Recreation and pastimes (P < 0.05) and the single‐item rating scale Physical Condition) and an ambiguous pattern of positive and negative trends in others. Unexpectedly, deterioration was most striking in functional health, where reductions appeared in 10 of 15 SIP categories. Compared with no treatment, physical training produced significantly greater improvement in only 1 HRQoL category: SIP recreation and pastimes. Improvement in this category, however, may possibly be accounted for by the opportunities for increased leisure activity afforded by participation in the ongoing training programme.

Health‐related QoL, QoL overall

No significant improvement was observed between training and control groups. Training produced small SRMs (mean change between assessments divided by
the standard deviation of change) (0.2 to < 0.5) on 4 HRQoL dimensions, of which 2 represented improvement.

Guidon 2010

Medical Outcomes Study Short Form‐36

No significant differences between groups were demonstrated for any of the MOS SF‐36 scores over the 3 time points (baseline, 12 weeks, and 1 year). This study was not included in the meta‐analysis, as the MOS SF‐36 differs from the standard SF‐36 Questionnaire.

Disease‐specific QoL (ICQ)

Results show a statistically significant decrease (P = 0.003) in ICQ scores from baseline to 12‐week follow‐up (mean difference ‐9.74, 95% CI ‐3.76 to ‐15.71) in the exercise group, indicating improved quality of life. No significant difference was demonstrated in the control group.

WIQ

In the exercise group, increases were observed in all WIQ scores, with a statistically significant increase (P = 0.015) in the WIQ Distance score (mean difference 14.28, 95% CI 2.96 to 25.61). In the control group, scores for the WIQ Stair‐climbing and Distance categories decreased, with a marginal increase in the WIQ Speed score. None of these changes were significant.

Kakkos 2005

Short Form‐36 (SF‐36)

Score for the general health domain of the SF‐36 was significantly improved at 1 year in individuals who used intermittent pneumatic compression (IPC). This study was not included in the meta‐analysis, as the full dataset was not available in the study and could not be obtained from the study author.

WIQ

IPC improved speed score of WIQ significantly. WIQ scores for walking distance, walking speed, and stair climbing were reduced in the unsupervised exercise group, remained stable in the supervised exercise group, and were increased in the IPC group.

Intermittent Claudication Questionnaire (ICQ)

Supervised exercise and IPC reduced (improved) the ICQ score, but this was significant only in the IPC group.
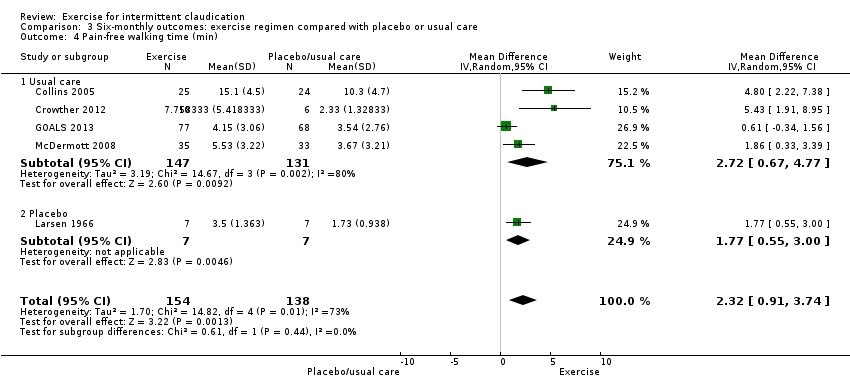
McDermott 2008

WIQ

Distance score improved (P = 0.02) in the treadmill group when compared to the control group. This was not apparent in the other 2 domains (speed and stair climbing).

SF‐36 physical functioning score

Improved (P = 0.04) in the treadmill group when compared to the control group.

GOALS 2013

WIQ scores

Participants in the intervention group, when compared with those in the control group, improved their WIQ distance score (35.3 to 47.4 vs 33.3 to 34.4; mean difference 11.1, 95% CI 3.9 to 18.1; P = 0.003) and their WIQ speed score (36.1 to 47.7 vs 35.3 to 36.6; mean difference 10.4, 95% CI 3.4 to 17.4; P = 0.004) but not their WIQ stair‐climbing score (48.9 to 57.3 vs 47.9 to 48.5; mean difference 7.9, 95% CI 0.00 to 15.8; P = 0.05).

Physical Health Composite Score (PCS) and Mental Health Composite Score (MCS) scales from the 12‐item Medical Outcomes Study Short Form Health Survey (SF‐12)

Results show no between‐group differences in change in the SF‐12 PCS or MCS subscales.

Tew 2015

Intermittent Claudication Questionnaire (ICD)

The intervention group demonstrated improvement in the ICD score of ‐10.6 (95% CI ‐18.9 to ‐ 2.3).

Tisi 1997

Nottingham Health Profile (NHP)

A daily home exercise programme, supervised weekly by a physiotherapist for the first month, achieves good compliance, increased walking distances, and improved quality of life as assessed by the Nottingham Health Profile Questionnaire.

Tsai 2002

WIQ

Improved speed (P < 0.001) and stairs (P < 0.001) in the exercise group when compared to the control group at 12 weeks. No significant difference in the distance domain

SF‐36 ‐ version 1

Perception of QoL increased significantly in the exercise group compared to usual care for the domains of physical function, role limitation, bodily pain, general health, and vitality. This study was included in the 3‐month meta‐analysis; however the SF‐36 version 1 differs from the standard SF‐36 Questionnaire.

Zwierska 2005

WIQ

Improvement in all 3 domains was seen in the upper limb group at 24 and 48 weeks when compared to the control group. The lower limb group improved in stair and speed domains at 24 and 48 weeks only when compared to the control group.

SF‐36 ‐ version 2

At 6 weeks, improvement in general health was seen in the lower‐limb group when compared to the control group.

At 24 weeks, a significant improvement was seen in general health and vitality in the lower limb group when compared to the control group. The upper limb group significantly improved in physical function and mental health when compared to the control group.

Figuras y tablas -
Table 1. Functional status and quality of life data (QoL) for all studies
Comparison 1. Overall outcomes: exercise regimen compared with placebo or usual care

Outcome or subgroup title

No. of studies

No. of participants

Statistical method

Effect size

1 Maximum walking distance (m) Show forest plot

10

500

Mean Difference (IV, Random, 95% CI)

120.36 [50.79, 189.92]

2 Pain‐free walking distance (m) Show forest plot

9

391

Mean Difference (IV, Fixed, 95% CI)

82.11 [71.73, 92.48]

3 Maximum walking time (min) Show forest plot

12

577

Mean Difference (IV, Random, 95% CI)

4.51 [3.11, 5.92]

3.1 Usual care

11

563

Mean Difference (IV, Random, 95% CI)

4.47 [3.00, 5.94]

3.2 Placebo

1

14

Mean Difference (IV, Random, 95% CI)

5.20 [0.88, 9.52]

4 Pain‐free walking time (min) Show forest plot

11

534

Mean Difference (IV, Random, 95% CI)

2.93 [1.77, 4.09]

4.1 Usual care

10

520

Mean Difference (IV, Random, 95% CI)

3.08 [1.82, 4.34]

4.2 Placebo

1

14

Mean Difference (IV, Random, 95% CI)

1.77 [0.55, 2.99]

5 Change in MWD/T Show forest plot

15

656

Mean Difference (IV, Random, 95% CI)

40.25 [28.64, 51.86]

6 Change in ICD/T Show forest plot

15

703

Mean Difference (IV, Random, 95% CI)

58.42 [44.20, 72.64]

7 Ankle brachial index Show forest plot

13

570

Mean Difference (IV, Random, 95% CI)

0.04 [‐0.00, 0.08]

8 Mortality Show forest plot

5

540

Risk Ratio (M‐H, Fixed, 95% CI)

0.92 [0.39, 2.17]

9 Amputation Show forest plot

1

177

Risk Ratio (M‐H, Fixed, 95% CI)

0.20 [0.01, 4.15]

10 Peak exercise calf blood flow (mL/100 mL/min) Show forest plot

4

103

Mean Difference (IV, Fixed, 95% CI)

0.94 [‐0.81, 2.69]

10.1 Usual care

2

71

Mean Difference (IV, Fixed, 95% CI)

2.83 [0.18, 5.49]

10.2 Placebo

2

32

Mean Difference (IV, Fixed, 95% CI)

‐0.52 [‐2.85, 1.82]

Figuras y tablas -
Comparison 1. Overall outcomes: exercise regimen compared with placebo or usual care
Comparison 2. Three‐monthly outcomes: exercise regimen compared with placebo or usual care

Outcome or subgroup title

No. of studies

No. of participants

Statistical method

Effect size

1 Maximum walking distance (m) Show forest plot

3

116

Mean Difference (IV, Random, 95% CI)

104.46 [‐64.33, 273.24]

2 Pain‐free walking distance (m) Show forest plot

3

156

Mean Difference (IV, Fixed, 95% CI)

88.70 [58.25, 119.15]

3 Maximum walking time (min) Show forest plot

5

172

Mean Difference (IV, Fixed, 95% CI)

6.05 [5.47, 6.62]

3.1 Usual care

5

172

Mean Difference (IV, Fixed, 95% CI)

6.05 [5.47, 6.62]

4 Pain‐free walking time (min) Show forest plot

3

132

Mean Difference (IV, Fixed, 95% CI)

4.95 [4.38, 5.53]

5 Ankle brachial index Show forest plot

4

130

Mean Difference (IV, Fixed, 95% CI)

0.06 [0.01, 0.11]

6 Mortality Show forest plot

2

Risk Ratio (M‐H, Fixed, 95% CI)

Totals not selected

7 Quality of Life SF‐36 Show forest plot

2

Mean Difference (IV, Fixed, 95% CI)

Subtotals only

7.1 Physical function

2

82

Mean Difference (IV, Fixed, 95% CI)

6.60 [2.37, 10.83]

7.2 Bodily pain

2

82

Mean Difference (IV, Fixed, 95% CI)

3.89 [‐1.91, 9.68]

7.3 General health

2

82

Mean Difference (IV, Fixed, 95% CI)

4.52 [‐0.01, 9.04]

7.4 Mental health

2

82

Mean Difference (IV, Fixed, 95% CI)

1.44 [‐0.93, 3.81]

7.5 Role emotional

2

82

Mean Difference (IV, Fixed, 95% CI)

1.26 [‐4.84, 7.36]

7.6 Social function

2

82

Mean Difference (IV, Fixed, 95% CI)

1.49 [‐4.16, 7.14]

7.7 Vitality

2

82

Mean Difference (IV, Fixed, 95% CI)

5.55 [1.54, 9.56]

7.8 Role physical

2

82

Mean Difference (IV, Fixed, 95% CI)

10.31 [3.64, 16.98]

7.9 Physical Summary Score

1

29

Mean Difference (IV, Fixed, 95% CI)

2.58 [‐4.29, 9.45]

7.10 Mental Summary Score

1

29

Mean Difference (IV, Fixed, 95% CI)

2.05 [‐4.73, 8.83]

8 Peak exercise calf blood flow (mL/100 mL/min) Show forest plot

1

Mean Difference (IV, Fixed, 95% CI)

Totals not selected

Figuras y tablas -
Comparison 2. Three‐monthly outcomes: exercise regimen compared with placebo or usual care
Comparison 3. Six‐monthly outcomes: exercise regimen compared with placebo or usual care

Outcome or subgroup title

No. of studies

No. of participants

Statistical method

Effect size

1 Maximum walking distance (m) Show forest plot

3

156

Mean Difference (IV, Random, 95% CI)

138.36 [22.39, 254.34]

2 Pain‐free walking distance (m) Show forest plot

2

116

Mean Difference (IV, Fixed, 95% CI)

52.14 [6.83, 97.45]

3 Maximum walking time (min) Show forest plot

4

295

Mean Difference (IV, Fixed, 95% CI)

3.20 [2.04, 4.36]

3.1 Usual care

3

281

Mean Difference (IV, Fixed, 95% CI)

3.05 [1.84, 4.25]

3.2 Placebo

1

14

Mean Difference (IV, Fixed, 95% CI)

5.20 [0.88, 9.52]

4 Pain‐free walking time (min) Show forest plot

5

292

Mean Difference (IV, Random, 95% CI)

2.32 [0.91, 3.74]

4.1 Usual care

4

278

Mean Difference (IV, Random, 95% CI)

2.72 [0.67, 4.77]

4.2 Placebo

1

14

Mean Difference (IV, Random, 95% CI)

1.77 [0.55, 3.00]

5 Ankle brachial index Show forest plot

6

240

Mean Difference (IV, Random, 95% CI)

0.05 [‐0.01, 0.11]

6 Mortality Show forest plot

1

178

Risk Ratio (M‐H, Fixed, 95% CI)

0.51 [0.05, 5.54]

7 Quality of Life SF‐36 Show forest plot

5

Mean Difference (IV, Fixed, 95% CI)

Subtotals only

7.1 Physical summary score

5

429

Mean Difference (IV, Fixed, 95% CI)

2.15 [1.26, 3.04]

7.2 Mental summary score

4

343

Mean Difference (IV, Fixed, 95% CI)

3.76 [2.70, 4.82]

7.3 Physical function

2

85

Mean Difference (IV, Fixed, 95% CI)

9.78 [0.82, 18.74]

7.4 Bodily pain

2

85

Mean Difference (IV, Fixed, 95% CI)

4.85 [‐3.79, 13.50]

7.5 General health

2

85

Mean Difference (IV, Fixed, 95% CI)

10.19 [1.83, 18.55]

7.6 Mental health

2

85

Mean Difference (IV, Fixed, 95% CI)

1.82 [‐5.28, 8.92]

7.7 Role emotional

2

85

Mean Difference (IV, Fixed, 95% CI)

4.90 [‐7.15, 16.94]

7.8 Social function

2

85

Mean Difference (IV, Fixed, 95% CI)

3.48 [‐6.74, 13.71]

7.9 Vitality

2

85

Mean Difference (IV, Fixed, 95% CI)

5.32 [‐2.57, 13.22]

7.10 Role physical

2

85

Mean Difference (IV, Fixed, 95% CI)

8.55 [‐2.69, 19.79]

8 Peak exercise calf blood flow (mL/100 mL/min) Show forest plot

2

66

Mean Difference (IV, Fixed, 95% CI)

3.79 [0.51, 7.07]

8.1 Usual care

1

52

Mean Difference (IV, Fixed, 95% CI)

3.10 [‐0.46, 6.66]

8.2 Placebo

1

14

Mean Difference (IV, Fixed, 95% CI)

7.57 [‐0.78, 15.92]

Figuras y tablas -
Comparison 3. Six‐monthly outcomes: exercise regimen compared with placebo or usual care
Comparison 4. Exercise regimen compared with antiplatelet therapy

Outcome or subgroup title

No. of studies

No. of participants

Statistical method

Effect size

1 Maximum walking time (min) Show forest plot

1

Mean Difference (IV, Fixed, 95% CI)

Totals not selected

2 Ankle brachial index Show forest plot

1

Mean Difference (IV, Fixed, 95% CI)

Totals not selected

3 Peak exercise calf blood flow (mL/100 mL/min) Show forest plot

1

Mean Difference (IV, Fixed, 95% CI)

Totals not selected

Figuras y tablas -
Comparison 4. Exercise regimen compared with antiplatelet therapy
Comparison 5. Exercise regimen compared with pentoxifylline therapy

Outcome or subgroup title

No. of studies

No. of participants

Statistical method

Effect size

1 Maximum walking time (min) Show forest plot

1

Mean Difference (IV, Fixed, 95% CI)

Totals not selected

Figuras y tablas -
Comparison 5. Exercise regimen compared with pentoxifylline therapy
Comparison 6. Exercise regimen compared with iloprost therapy

Outcome or subgroup title

No. of studies

No. of participants

Statistical method

Effect size

1 Maximum walking distance (m) Show forest plot

1

Mean Difference (IV, Fixed, 95% CI)

Totals not selected

2 Pain‐free walking distance (m) Show forest plot

1

Mean Difference (IV, Fixed, 95% CI)

Totals not selected

Figuras y tablas -
Comparison 6. Exercise regimen compared with iloprost therapy
Comparison 7. Exercise regimen compared with pneumatic foot and calf compression

Outcome or subgroup title

No. of studies

No. of participants

Statistical method

Effect size

1 Maximum walking distance (m) Show forest plot

1

Mean Difference (IV, Fixed, 95% CI)

Totals not selected

2 Pain‐free walking distance (m) Show forest plot

1

Mean Difference (IV, Fixed, 95% CI)

Totals not selected

3 Mortality Show forest plot

1

Odds Ratio (M‐H, Fixed, 95% CI)

Totals not selected

Figuras y tablas -
Comparison 7. Exercise regimen compared with pneumatic foot and calf compression
Comparison 8. Exercise regimen compared with vitamin E

Outcome or subgroup title

No. of studies

No. of participants

Statistical method

Effect size

1 3‐monthly maximum walking time (min) Show forest plot

1

Mean Difference (IV, Fixed, 95% CI)

Totals not selected

2 6‐monthly maximum walking time (min) Show forest plot

1

Mean Difference (IV, Fixed, 95% CI)

Totals not selected

3 3‐monthly ABI Show forest plot

1

Mean Difference (IV, Fixed, 95% CI)

Totals not selected

4 6‐monthly ABI Show forest plot

1

Mean Difference (IV, Fixed, 95% CI)

Totals not selected

Figuras y tablas -
Comparison 8. Exercise regimen compared with vitamin E