Amnio‐infusion en cas de rupture prématurée des membranes avant terme au troisième trimestre
Appendices
Appendix 1. Methods to be used in the next update
Data collection and analysis
Selection of studies
Two review authors will independently assess for inclusion all the potential studies we identify as a result of the search strategy. We will resolve any disagreement through discussion or, if required, we will consult a third author.
Data extraction and management
We will design a form to extract data. For eligible studies, at least two review authors will extract the data using the agreed form. We will resolve discrepancies through discussion or, if required, we will consult a third person. We will enter data into Review Manager software (RevMan 2012) and check for accuracy.
When information regarding any of the above is unclear, we will attempt to contact authors of the original reports to provide further details.
Assessment of risk of bias in included studies
Two review authors will independently assess risk of bias for each study using the criteria outlined in the Cochrane Handbook for Systematic Reviews of Interventions (Higgins 2011). We will resolve any disagreement by discussion or by involving a third assessor.
(1) Random sequence generation (checking for possible selection bias)
We will describe for each included study the method used to generate the allocation sequence in sufficient detail to allow an assessment of whether it should produce comparable groups.
We will assess the method as:
-
low risk of bias (any truly random process, e.g. random number table; computer random number generator);
-
high risk of bias (any non‐random process, e.g. odd or even date of birth; hospital or clinic record number);
-
unclear risk of bias.
(2) Allocation concealment (checking for possible selection bias)
We will describe for each included study the method used to conceal allocation to interventions prior to assignment and will assess whether intervention allocation could have been foreseen in advance of, or during recruitment, or changed after assignment.
We will assess the methods as:
-
low risk of bias (e.g. telephone or central randomisation; consecutively numbered sealed opaque envelopes);
-
high risk of bias (open random allocation; unsealed or non‐opaque envelopes, alternation; date of birth);
-
unclear risk of bias.
(3.1) Blinding of participants and personnel (checking for possible performance bias)
We will describe for each included study the methods used, if any, to blind study participants and personnel from knowledge of which intervention a participant received. We will consider that studies are at low risk of bias if they were blinded, or if we judge that the lack of blinding would be unlikely to affect results. We will assess blinding separately for different outcomes or classes of outcomes.
We will assess the methods as:
-
low, high or unclear risk of bias for participants;
-
low, high or unclear risk of bias for personnel.
(3.2) Blinding of outcome assessment (checking for possible detection bias)
We will describe for each included study the methods used, if any, to blind outcome assessors from knowledge of which intervention a participant received. We will assess blinding separately for different outcomes or classes of outcomes.
We will assess methods used to blind outcome assessment as:
-
low, high or unclear risk of bias.
(4) Incomplete outcome data (checking for possible attrition bias due to the amount, nature and handling of incomplete outcome data)
We will describe for each included study, and for each outcome or class of outcomes, the completeness of data including attrition and exclusions from the analysis. We will state whether attrition and exclusions were reported and the numbers included in the analysis at each stage (compared with the total randomised participants), reasons for attrition or exclusion where reported, and whether missing data were balanced across groups or were related to outcomes. Where sufficient information is reported, or can be supplied by the trial authors, we will re‐include missing data in the analyses which we undertake.
We will assess methods as:
-
low risk of bias (e.g. no missing outcome data; missing outcome data balanced across groups);
-
high risk of bias (e.g. numbers or reasons for missing data imbalanced across groups; ‘as treated’ analysis done with substantial departure of intervention received from that assigned at randomisation);
-
unclear risk of bias.
(5) Selective reporting (checking for reporting bias)
We will describe for each included study how we investigated the possibility of selective outcome reporting bias and what we found.
We will assess the methods as:
-
low risk of bias (where it is clear that all of the study’s pre‐specified outcomes and all expected outcomes of interest to the review have been reported);
-
high risk of bias (where not all the study’s pre‐specified outcomes have been reported; one or more reported primary outcomes were not pre‐specified; outcomes of interest are reported incompletely and so cannot be used; study fails to include results of a key outcome that would have been expected to have been reported);
-
unclear risk of bias.
(6) Other bias (checking for bias due to problems not covered by (1) to (5) above)
We will describe for each included study any important concerns we have about other possible sources of bias.
We will assess whether each study was free of other problems that could put it at risk of bias:
-
low risk of other bias;
-
high risk of other bias;
-
unclear whether there is risk of other bias.
(7) Overall risk of bias
We will make explicit judgements about whether studies are at high risk of bias, according to the criteria given in the Cochrane Handbook (Higgins 2011). With reference to (1) to (6) above, we will assess the likely magnitude and direction of the bias and whether we consider it is likely to impact on the findings. We will explore the impact of the level of bias through undertaking sensitivity analyses ‐ see 'Sensitivity analysis'.
Measures of treatment effect
Dichotomous data
For dichotomous data, we will present results as summary risk ratio with 95% confidence intervals.
Continuous data
For continuous data, we will use the mean difference if outcomes are measured in the same way between trials. We will use the standardised mean difference to combine trials that measure the same outcome, but use different methods.
Unit of analysis issues
Cluster‐randomised trials
We will not consider cluster‐randomised trials for inclusion.
Cross‐over trials
We will not consider cross‐over trials for inclusion.
Dealing with missing data
For included studies, we will note levels of attrition. We will explore the impact of including studies with high levels of missing data in the overall assessment of treatment effect by using sensitivity analysis.
For all outcomes, we will carry out analyses, as far as possible, on an intention‐to‐treat basis, i.e. we will attempt to include all participants randomised to each group in the analyses, and all participants will be analysed in the group to which they were allocated, regardless of whether or not they received the allocated intervention. The denominator for each outcome in each trial will be the number randomised minus any participants whose outcomes are known to be missing.
Assessment of heterogeneity
We will assess statistical heterogeneity in each meta‐analysis using the Tau², I² and Chi² statistics. We will regard heterogeneity as substantial if an I² is greater than 30% and either the Tau² is greater than zero, or there is a low P value (< 0.10) in the Chi² test for heterogeneity.
Assessment of reporting biases
If there are 10 or more studies in the meta‐analysis, we will investigate reporting biases (such as publication bias) using funnel plots. We will assess funnel plot asymmetry visually. If asymmetry is suggested by a visual assessment, we will perform exploratory analyses to investigate it.
Data synthesis
We will carry out statistical analysis using the Review Manager software (RevMan 2012). We will use fixed‐effect meta‐analysis for combining data where it is reasonable to assume that studies are estimating the same underlying treatment effect: i.e. where trials are examining the same intervention, and the trials’ populations and methods are judged sufficiently similar. If there is clinical heterogeneity sufficient to expect that the underlying treatment effects differ between trials, or if substantial statistical heterogeneity is detected, we will use random‐effects meta‐analysis to produce an overall summary, if an average treatment effect across trials is considered clinically meaningful. The random‐effects summary will be treated as the average range of possible treatment effects and we will discuss the clinical implications of treatment effects differing between trials. If the average treatment effect is not clinically meaningful, we will not combine trials.
If we use random‐effects analyses, the results will be presented as the average treatment effect with 95% confidence intervals, and the estimates of Tau² and I².
Subgroup analysis and investigation of heterogeneity
If we identify substantial heterogeneity, we will investigate it using subgroup analyses and sensitivity analyses. We will consider whether an overall summary is meaningful, and if it is, use random‐effects analysis to produce it.
We plan to carry out the following subgroup analyses.
-
Effects of transabdominal versus transcervical amnioinfusion on complications of preterm premature rupture of the fetal membranes.
-
Effects of transabdominal versus transcervical amnioinfusion at the various gestational ages in the third trimester.
The following outcomes will be used in subgroup analysis: persistent variable decelerations, Apgar scores, cord arterial pH at birth, neonatal morbidity including infection, lung hypoplasia, abnormal neurological outcomes and postural deformities, as well as perinatal mortality.
We will assess subgroup differences by interaction tests available within RevMan (RevMan 2012). We will report the results of subgroup analyses quoting the Chi² statistic and P value, and the interaction test I² value.
Sensitivity analysis
Sensitivity analyses will be performed for aspects of the review that might affect the results, for example, where there is risk of bias associated with the quality of some of the included trials. Sensitivity analysis will be carried out to explore the effects of fixed‐effect or random‐effects analyses for outcomes with statistical heterogeneity and the effects of any assumptions made.
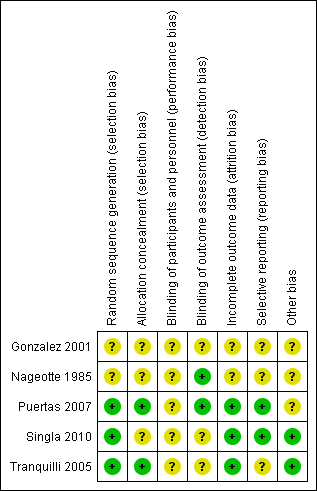
'Risk of bias' summary: review authors' judgements about each risk of bias item for each included study.

'Risk of bias' graph: review authors' judgements about each risk of bias item presented as percentages across all included studies.
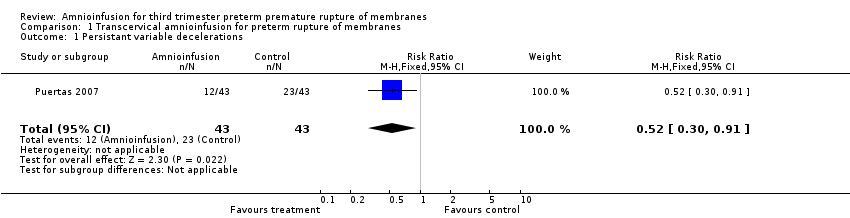
Comparison 1 Transcervical amnioinfusion for preterm rupture of membranes, Outcome 1 Persistant variable decelerations.

Comparison 1 Transcervical amnioinfusion for preterm rupture of membranes, Outcome 2 Severe variable decelerations per hour in first stage.
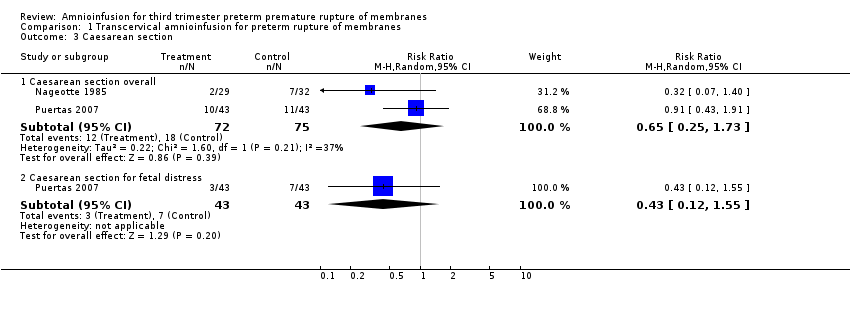
Comparison 1 Transcervical amnioinfusion for preterm rupture of membranes, Outcome 3 Caesarean section.

Comparison 1 Transcervical amnioinfusion for preterm rupture of membranes, Outcome 4 Forceps/vacuum assisted delivery.

Comparison 1 Transcervical amnioinfusion for preterm rupture of membranes, Outcome 5 1 minute Apgar score < 4.
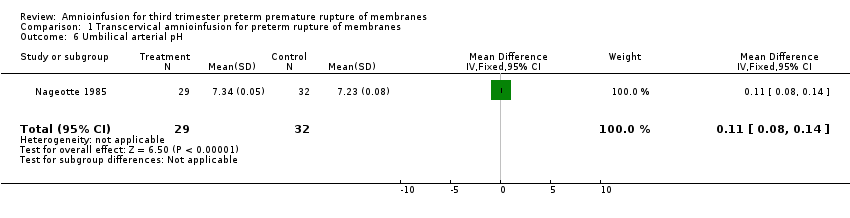
Comparison 1 Transcervical amnioinfusion for preterm rupture of membranes, Outcome 6 Umbilical arterial pH.

Comparison 1 Transcervical amnioinfusion for preterm rupture of membranes, Outcome 7 Umbilical pH ≤ 7.20.

Comparison 1 Transcervical amnioinfusion for preterm rupture of membranes, Outcome 8 Neonatal morbidity.

Comparison 1 Transcervical amnioinfusion for preterm rupture of membranes, Outcome 9 Neonatal death.
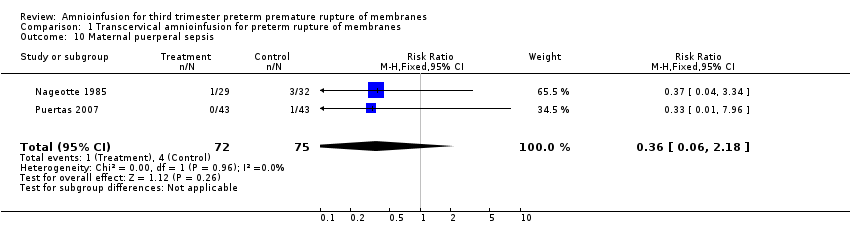
Comparison 1 Transcervical amnioinfusion for preterm rupture of membranes, Outcome 10 Maternal puerperal sepsis.
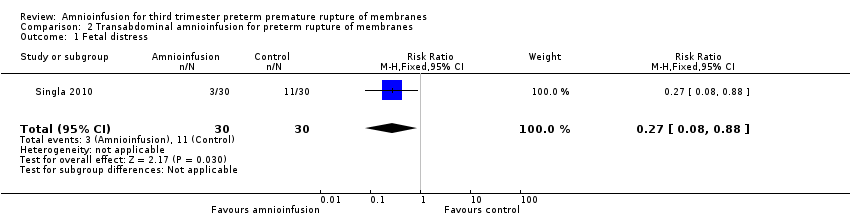
Comparison 2 Transabdominal amnioinfusion for preterm rupture of membranes, Outcome 1 Fetal distress.

Comparison 2 Transabdominal amnioinfusion for preterm rupture of membranes, Outcome 2 Gestational age at delivery (weeks).
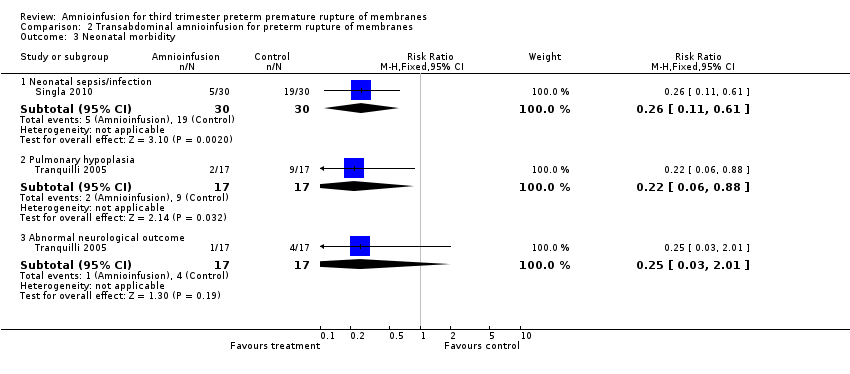
Comparison 2 Transabdominal amnioinfusion for preterm rupture of membranes, Outcome 3 Neonatal morbidity.
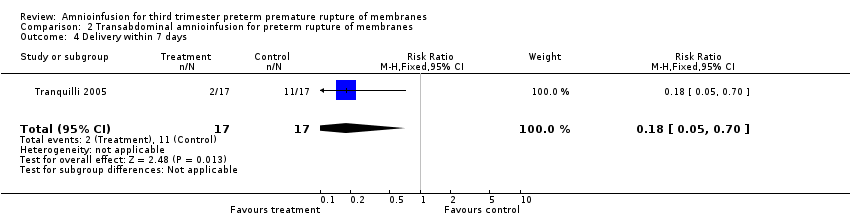
Comparison 2 Transabdominal amnioinfusion for preterm rupture of membranes, Outcome 4 Delivery within 7 days.

Comparison 2 Transabdominal amnioinfusion for preterm rupture of membranes, Outcome 5 Time to delivery (days).

Comparison 2 Transabdominal amnioinfusion for preterm rupture of membranes, Outcome 6 Admission to neonatal intensive care unit.
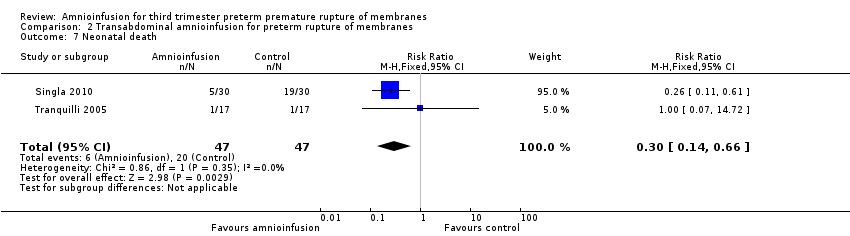
Comparison 2 Transabdominal amnioinfusion for preterm rupture of membranes, Outcome 7 Neonatal death.
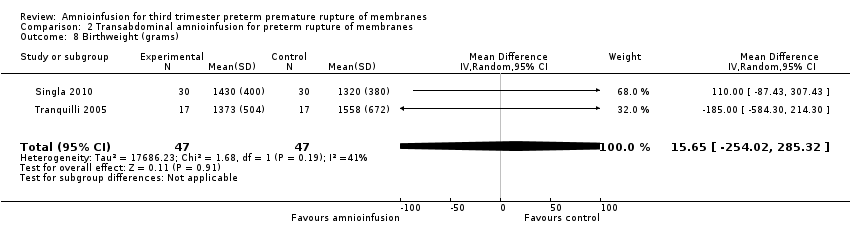
Comparison 2 Transabdominal amnioinfusion for preterm rupture of membranes, Outcome 8 Birthweight (grams).

Comparison 2 Transabdominal amnioinfusion for preterm rupture of membranes, Outcome 9 Maternal puerperal sepsis.
| Transabdominal amnioinfusion compared with no amnioinfusion for preterm rupture of membranes (PROM) | ||||
| Patient or population: pregnant women with PROM Settings: hospital Intervention: transabdominal amnioinfusion Comparison: no amnioinfusion | ||||
| Outcomes | Relative effect | No of Participants | Quality of the evidence | Comments |
| Neonatal death | RR 0.30 (0.14 ‐ 0.66) | 94 (two studies) | ⊕⊕⊕⊝ | Risk of neonatal death in the amnioinfusion group was 127 per 1000 compared to 426 per 1000 in the control group. |
| Neonatal sepsis/infection | RR 0.26 (0.11 ‐ 0.61) | 60 (one study*) | ⊕⊕⊕⊝ | *Sepsis defined as micro‐erythrocyte sedimentation rate > 5 mm, total leucocyte count < 5000, CRP > 6 mg/dL, platelet count < 100,000 or a positive blood culture within the first 48 hours. |
| Pulmonary hypoplasia | RR 0.22 (0.06 ‐ 0.88) | 34 (one study) | ⊕⊕⊝⊝ | Pulmonary hypoplasia was diagnosed according to strict clinical and radiological criteria, however, this study was small and blinding to group allocation was not described and so we downgraded this evidence from moderate to low. More evidence is needed. |
| Maternal puerperal sepsis | RR 0.20 (0.05 ‐ 0.84) | 60 (one study**) | ⊕⊕⊕⊝ | **Defined as fever > 38° C and a positive high vaginal swab culture. |
| GRADE Working Group grades of evidence CI: confidence interval; CRP: C‐reactive protein; RR: risk ratio | ||||
| Outcome or subgroup title | No. of studies | No. of participants | Statistical method | Effect size |
| 1 Persistant variable decelerations Show forest plot | 1 | 86 | Risk Ratio (M‐H, Fixed, 95% CI) | 0.52 [0.30, 0.91] |
| 2 Severe variable decelerations per hour in first stage Show forest plot | 1 | 61 | Mean Difference (IV, Fixed, 95% CI) | ‐1.2 [‐1.83, ‐0.57] |
| 3 Caesarean section Show forest plot | 2 | Risk Ratio (M‐H, Random, 95% CI) | Subtotals only | |
| 3.1 Caesarean section overall | 2 | 147 | Risk Ratio (M‐H, Random, 95% CI) | 0.65 [0.25, 1.73] |
| 3.2 Caesarean section for fetal distress | 1 | 86 | Risk Ratio (M‐H, Random, 95% CI) | 0.43 [0.12, 1.55] |
| 4 Forceps/vacuum assisted delivery Show forest plot | 1 | Risk Ratio (M‐H, Fixed, 95% CI) | Subtotals only | |
| 4.1 Overall | 1 | 86 | Risk Ratio (M‐H, Fixed, 95% CI) | 1.2 [0.58, 2.48] |
| 4.2 For fetal distress | 1 | 86 | Risk Ratio (M‐H, Fixed, 95% CI) | 0.11 [0.01, 2.00] |
| 5 1 minute Apgar score < 4 Show forest plot | 1 | 61 | Risk Ratio (M‐H, Fixed, 95% CI) | 0.28 [0.03, 2.33] |
| 6 Umbilical arterial pH Show forest plot | 1 | 61 | Mean Difference (IV, Fixed, 95% CI) | 0.11 [0.08, 0.14] |
| 7 Umbilical pH ≤ 7.20 Show forest plot | 1 | 86 | Risk Ratio (M‐H, Fixed, 95% CI) | 0.25 [0.06, 1.11] |
| 8 Neonatal morbidity Show forest plot | 1 | Risk Ratio (M‐H, Fixed, 95% CI) | Subtotals only | |
| 8.1 Overall | 1 | 86 | Risk Ratio (M‐H, Fixed, 95% CI) | 0.5 [0.19, 1.34] |
| 9 Neonatal death Show forest plot | 1 | 61 | Risk Ratio (M‐H, Fixed, 95% CI) | 0.55 [0.05, 5.77] |
| 10 Maternal puerperal sepsis Show forest plot | 2 | 147 | Risk Ratio (M‐H, Fixed, 95% CI) | 0.36 [0.06, 2.18] |
| Outcome or subgroup title | No. of studies | No. of participants | Statistical method | Effect size |
| 1 Fetal distress Show forest plot | 1 | 60 | Risk Ratio (M‐H, Fixed, 95% CI) | 0.27 [0.08, 0.88] |
| 2 Gestational age at delivery (weeks) Show forest plot | 2 | 94 | Mean Difference (IV, Random, 95% CI) | ‐0.49 [‐2.63, 1.65] |
| 3 Neonatal morbidity Show forest plot | 2 | Risk Ratio (M‐H, Fixed, 95% CI) | Subtotals only | |
| 3.1 Neonatal sepsis/infection | 1 | 60 | Risk Ratio (M‐H, Fixed, 95% CI) | 0.26 [0.11, 0.61] |
| 3.2 Pulmonary hypoplasia | 1 | 34 | Risk Ratio (M‐H, Fixed, 95% CI) | 0.22 [0.06, 0.88] |
| 3.3 Abnormal neurological outcome | 1 | 34 | Risk Ratio (M‐H, Fixed, 95% CI) | 0.25 [0.03, 2.01] |
| 4 Delivery within 7 days Show forest plot | 1 | 34 | Risk Ratio (M‐H, Fixed, 95% CI) | 0.18 [0.05, 0.70] |
| 5 Time to delivery (days) Show forest plot | 1 | 60 | Mean Difference (IV, Fixed, 95% CI) | 0.57 [‐2.86, 4.00] |
| 6 Admission to neonatal intensive care unit Show forest plot | 1 | 34 | Risk Ratio (M‐H, Fixed, 95% CI) | 1.0 [0.90, 1.12] |
| 7 Neonatal death Show forest plot | 2 | 94 | Risk Ratio (M‐H, Fixed, 95% CI) | 0.3 [0.14, 0.66] |
| 8 Birthweight (grams) Show forest plot | 2 | 94 | Mean Difference (IV, Random, 95% CI) | 15.65 [‐254.02, 285.32] |
| 9 Maternal puerperal sepsis Show forest plot | 1 | 60 | Risk Ratio (M‐H, Fixed, 95% CI) | 0.2 [0.05, 0.84] |